MARKET SUMMARY
Latest Situation in Crypto Assets
| Assets | Last Price | 24h Change | Dominance | Market Cap |
|---|---|---|---|---|
| BTC | 94,527.99 | 3.20% | 59.84% | 1,87 T |
| ETH | 3,111.22 | 0.30% | 11.97% | 374,31 B |
| SOLANA | 238.28 | -1.70% | 3.61% | 113,10 B |
| XRP | 1.1240 | 3.52% | 2.04% | 63,83 B |
| DOGE | 0.3899 | -0.05% | 1.83% | 57,27 B |
| CARDANO | 0.8324 | 13.82% | 0.93% | 29,18 B |
| TRX | 0.1979 | -2.09% | 0.55% | 17,09 B |
| SHIB | 0.00002448 | -2.25% | 0.46% | 14,44 B |
| AVAX | 35.14 | 2.38% | 0.46% | 14,37 B |
| LINK | 15.07 | 2.42% | 0.30% | 9,40 B |
| DOT | 6.049 | 4.56% | 0.29% | 9,16 B |
*Prepared on 11.20.2024 at 13:30 (UTC)
WHAT’S LEFT BEHIND
MicroStrategy Raises Bond Offering to $2.6 Billion
MicroStrategy increased its offering of zero-coupon convertible senior notes due 2029 from $1.75 billion to $2.6 billion. According to a statement on the company’s official website, some of the proceeds from the offering will be used for Bitcoin purchases. The bond sale is expected to be completed on November 21, 2024, and this step once again demonstrates the company’s commitment to its Bitcoin strategy.
BlackRock: Interest Rate Cuts Will Fuel Bitcoin and Gold
In its report on economic expectations for 2025, BlackRock stated that interest rate cuts will have a positive impact on assets such as Bitcoin and gold. The report also drew attention to sectors such as artificial intelligence and biotechnology, emphasizing that Bitcoin and gold will become more attractive in a low-interest rate environment. BlackRock’s analysis supports the future potential of crypto and precious metals.
MicroStrategy Among the Top 100 US Public Companies
MicroStrategy has risen to 97th place in the top 100 public companies in the US in the market capitalization rankings. The company’s stock performed impressively on Tuesday, rising 12% to $430, CoinDesk reported. The rise coincided with Bitcoin’s new high of $94,000, further fueling investor interest.
HIGHLIGHTS OF THE DAY
Important Economic Calender Data
| Time | News | Expectation | Previous |
|---|---|---|---|
| 15:00 | FOMC Member Barr Speaks | ||
| 16:00 | FOMC Member Cook Speaks | ||
| 17:15 | FOMC Member Bowman Speaks |
INFORMATION
*The calendar is based on UTC (Coordinated Universal Time) time zone. The economic calendar content on the relevant page is obtained from reliable news and data providers. The news in the economic calendar content, the date and time of the announcement of the news, possible changes in the previous, expectations and announced figures are made by the data provider institutions. Darkex cannot be held responsible for possible changes that may arise from similar situations.
MARKET COMPASS
While Nvidia’s balance sheet is awaited on the US front, European indices generally rose on hopes that Russia-Ukraine tensions could be defused. Wall Street futures also point to a positive opening.
Russian Foreign Minister Sergei Lavrov hinted that efforts would be made to avoid a nuclear war and Reuters reported that Putin was open to talks for a ceasefire, which revived risk appetite in global markets yesterday. Although we cannot say that we saw a strong one-day rise in stock market indices, the hope that geopolitical risks could be shelved for a while was enough to dust off the markets.
On the digital assets side, there is a rally with Bitcoin as the locomotive. Not all major crypto assets are participating in this rally, and this is due to BTC-specific news flows. Yesterday, BlackRock’s spot ETF options trading was an important dynamic. Today, enthusiasm was fueled by news that MicroStrategy raised its borrowing target for buying Bitcoin to around $2.6 billion (Previously $1.75 billion).
BlackRock’s iShares Bitcoin Trust ETF (IBIT) has a separate bracket for options. IBIT’s put-call ratio of 0.23 means that institutional investors are also bullish on the largest cryptocurrency.
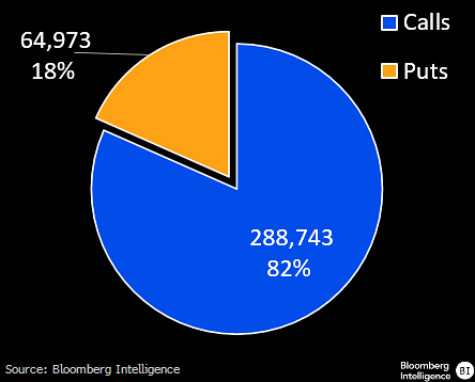
According to Bloomberg, about 289,000 call contracts changed hands on Nov. 19, while about 65,000 put contracts changed hands.
The economic calendar for the rest of the day is quite similar to the previous days. The speeches of dovish Federal Open Market Committee (FOMC) members Barr and Cook and relatively more neutral Bowman will be followed.
From the short term to the big picture.
The victory of former President Trump on November 5, which was one of the main pillars of our bullish expectation for the long-term outlook in digital assets, produced a result in line with our forecasts. The continuation of the Fed’s rate cut cycle (albeit with cautious messages from Powell in his last speech…) and the entry into BTC ETFs, indicating an increase in institutional investor interest (in addition, MicroStrategy’s BTC purchases, Microsoft starting to evaluate the purchase issue, BlackRock’s BTC ETF options started trading…) support our upside forecast for the big picture for now.
In the short term, given the nature of the market and pricing behavior, we think it would not be surprising to see occasional respite or pullbacks in digital assets. At this point, it is worth reiterating that fundamental dynamics remain bullish. While Bitcoin, the largest digital currency, extending its record high again, may continue to whet the appetite of buyers to take new, upside positions, we will watch this group struggle with the masses who may want to take profit realizations and speculators who want to take advantage of potential declines after rapid rises. On the BTC front, we can say that buyers are leading the battle for now.
TECHNICAL ANALYSIS
BTC/USDT
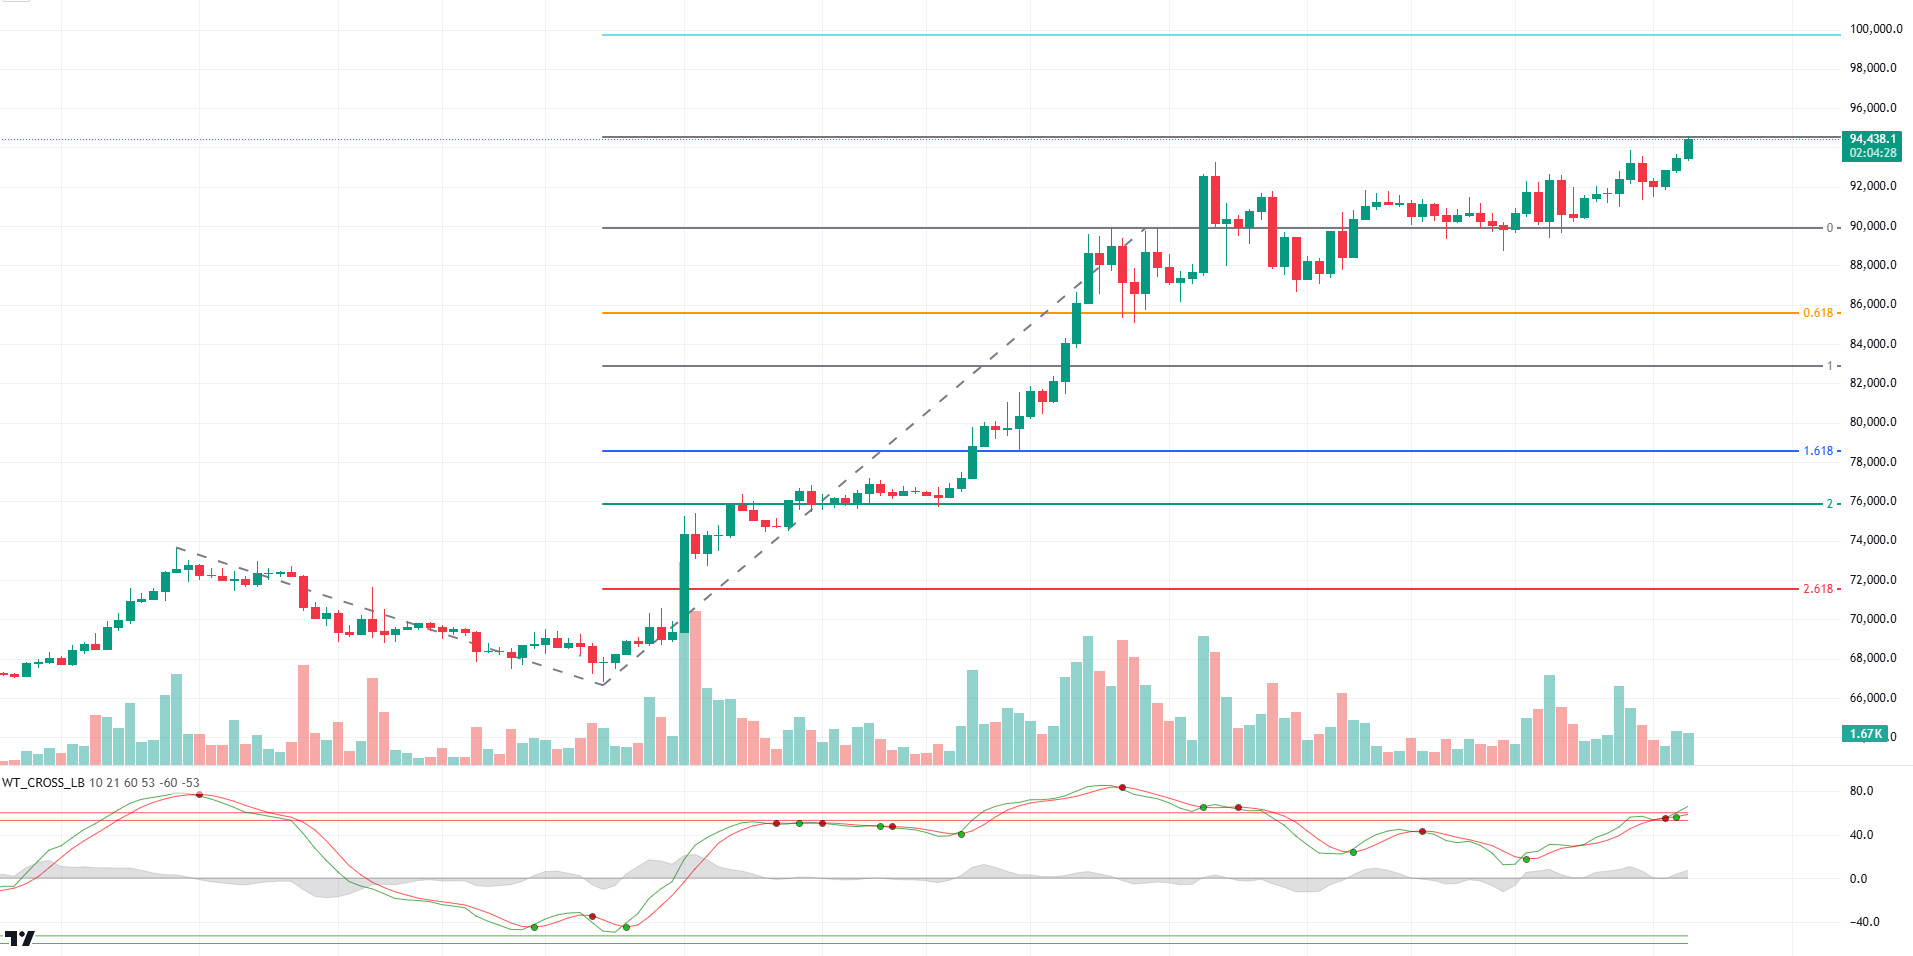
MicroStrategy announced that it has increased its bond issuance target from $1.75 billion to $2.6 billion for additional Bitcoin purchases. The company stated that it will use some of the proceeds to buy Bitcoin. Following this development, Bitcoin price continued to surpass its all-time high (ATH) and remained 7% away on its journey to six-digit levels.
When we look at the BTC technical outlook after the latest development, it reached 94,589 with ATH attempts during the day. As the positive developments for BTC continue, the upward momentum in its price continues to strengthen. The increase in spot ETF option volumes with the US market may cause new ATH levels to be seen in BTC price during the day. As we mentioned earlier, if the 95,000 level is exceeded, it may bring a sharp movement towards the 100,000 level with increasing buying pressure. In case of a pullback, the reverse trading opportunity at each ATH level may pull the price back to the minor support level of 92,500.
Supports 92,550 – 91,350 – 90,000
Resistances 94,430 – 95,000 – 100,000
ETH/USDT
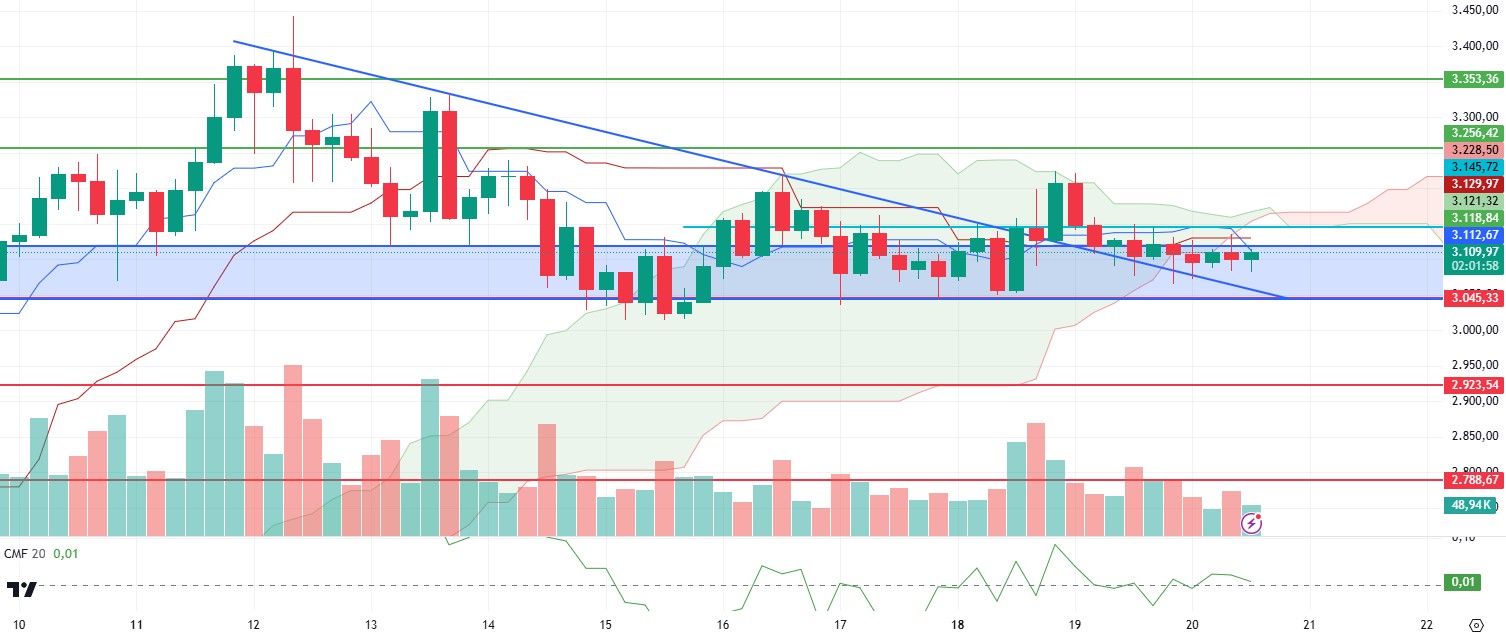
Although ETH made an attack towards the 3,145 level during the day, it again faced selling pressure on the Cumulative Volume Delta (CVD) futures. The fact that ETH, which fell below the 3,118 level with these sales, experienced a relatively volume-free squeeze in a very narrow area indicates that the price may make sharp movements after the breakouts. Pricing above the 3,145 intermediate resistance mentioned in the morning analysis seems possible to bring sharp attacks to 3,256 and 3,353 levels. On the other hand, on the Ichimoku indicator, the downward cut of the tenkan level to the kijun level and the closures under the kumo cloud have created a sell signal. With the Chaikin Money Flow (CMF) value also converging to the zero line, it shows that if the price cannot exceed the 3.118 level, it may retreat to 3.045 levels. A possible breach of the 3,045 level may cause sharp declines to 2,923 levels.
Supports 3,118 – 3,045 – 2,923
Resistances 3,256 – 3,353 – 3,534
XRP/USDT
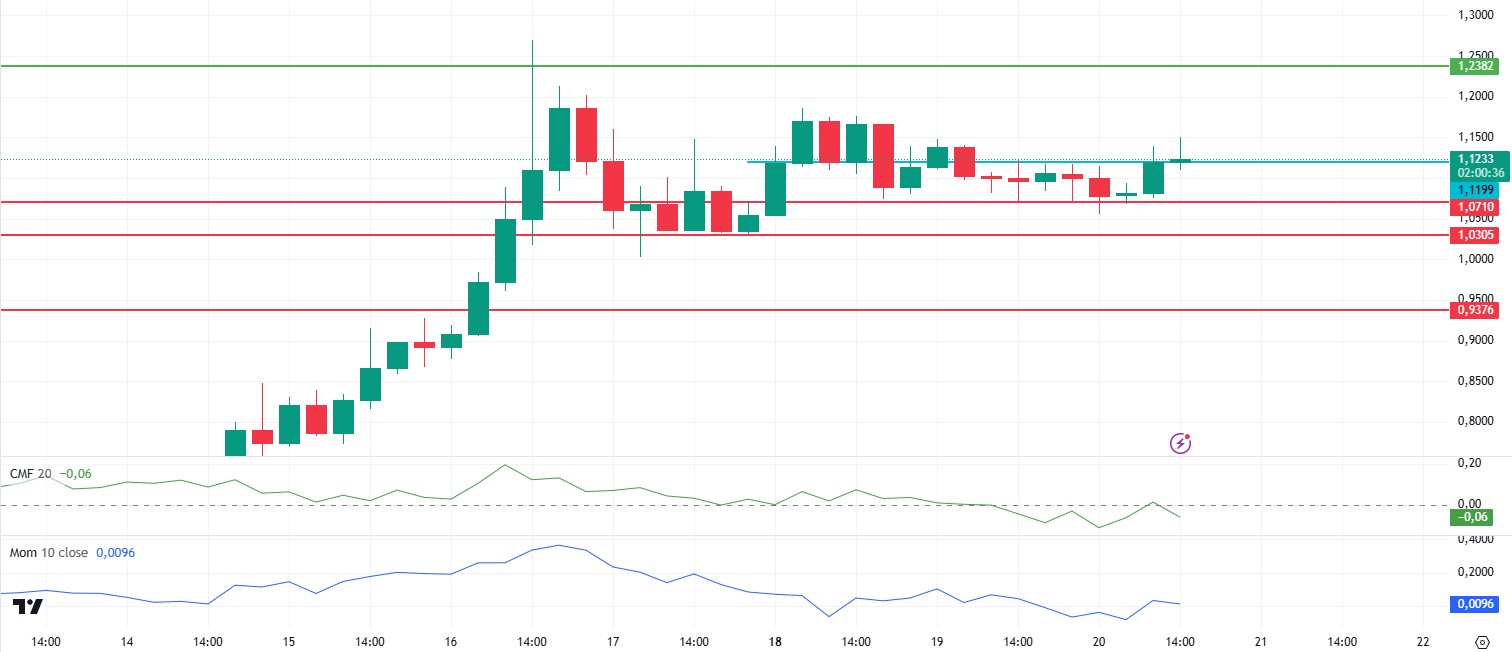
XRP was able to rise rapidly from the strong support zone between 1.07 and 1.03 mentioned in the previous day’s analysis and managed to rise above the 1.12 intermediate support zone. However, Bitcoin’s ATH during the day and the rising dominance during this movement caused a slight negative effect for XRP as well as all altcoins. The negative structure on Chaikin Money Flow (CMF) and negative divergences on momentum may indicate that investors should be wary of a possible correction at these levels. The persistence of the price above the 1.12 level may bring rises up to 1.23 levels, but the loss of this level may cause the 1.07 levels to be tested again.
Supports 1.0709 – 1.0333 – 0.9382
Resistances 1.2386 – 1.3487 – 1.4463
SOL/USDT
Solana activity has reached record highs on many metrics, but the data suggests that its performance may be inorganic. Glassnode claimed that much of this activity was carried out by bots, according to its report. In a post published on X on November 19, Glassnode noted that Solana’s transfer volume reached an all-time high of $318 billion on November 16. This is almost three times SOL’s total market capitalization, which currently stands at $112.29 billion. The total number of active addresses on Solana rose to 22 million. However, the onchain analytics firm noted that average transaction volumes dropped at the same time. This raises questions about the accuracy of Solana’s metrics because if the growth is organic, there should be a similar rise in averages. According to DefiLlama data, Solana daily revenue hit a record high of almost $6 million on November 20, with network participants paying $7.63 million in transaction fees. In conclusion, we can say that Solana’s reported figures on network activity over the past few months may be artificially inflated due to trading in meme coins, leading to skepticism over the network’s true growth trajectory.
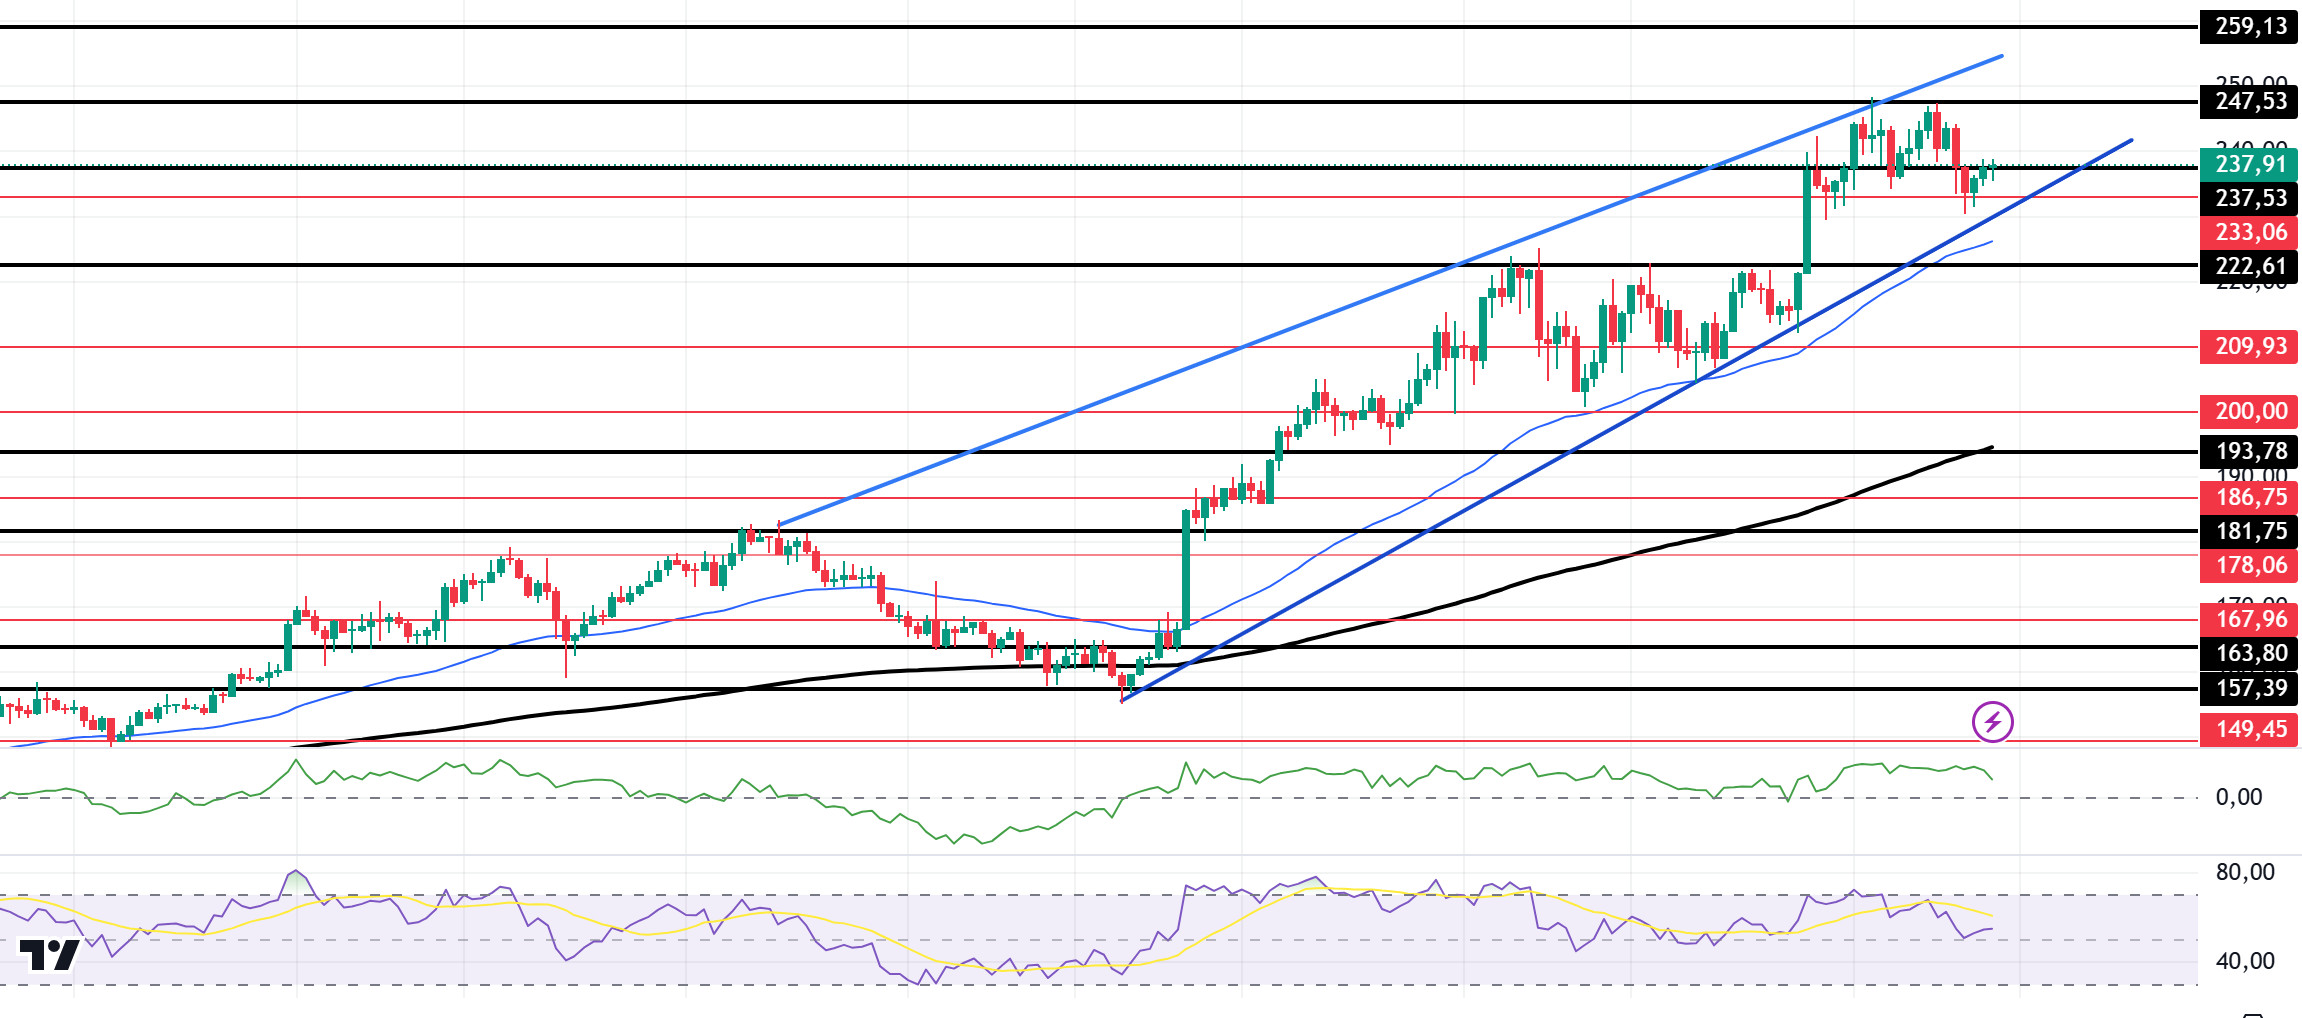
Technically, the 50 EMA (Blue Line) continues to be above the 200 EMA (Black Line) in the 4-hour timeframe. Since November 4, SOL, which has been in an uptrend since November 4, continues to be priced by maintaining this trend. At the same time, Solana observed the emergence of a rising wedge pattern on the chart. A rising wedge is usually seen as a bearish signal. However, when we examine the Chaikin Money Flow (CMF)20 indicator, while inflows are positive, inflows have begun to decline markedly. At the same time, the Relative Strength Index (RSI)14 has moved from overbought to intermediate levels. The 247.53 level is a very strong resistance point in the uptrend driven by both macroeconomic conditions and innovations in the Solana ecosystem. If it breaks here, the rise may continue. In case of retracements due to possible macroeconomic reasons or profit sales, the support levels of 222.61 and 193.78 may be triggered again. If the price reaches these support levels, a potential bullish opportunity may arise if momentum increases.
Supports 233.06 – 222.61 – 209.93
Resistances 237.53 – 249.53 – 259.13
DOGE/USDT
Vivek Ramaswamy, a leader of the US Government’s Productivity Department, recently highlighted on social media platform X the problems with the Treasury Department’s ‘Do Not Pay’ (DNP) list, Odaily reported. The DNP list is intended to prevent payments to people who have passed away, defaulted on federal debts, or been removed as contractors. But Ramaswamy pointed out that the system is not working as intended. For example, the Small Business Administration (SBA) reportedly made more than 100,000 forgivable loans to people on the DNP list, resulting in $5.3 billion being paid to potentially ineligible recipients. The SBA’s Inspector General has acknowledged this problem and recommended that the agency stop this practice. Ramaswamy emphasized that this blatant waste of federal resources must be addressed, suggesting that it was time for the Department of Government Efficiency (DOGE) to intervene. In response to these revelations, Elon Musk commented on the scale and audacity of the government fraud, expressing shock at the situation.
On late November 19, the Bitcoin price rose to an all-time high of $94,041 according to Coingecko data, pulling the rest of the market up with it. The Dogecoin price was not affected by this increase in the BTC price and the slight pullback in the market. When we look at historical data, we see that the rise or fall of Bitcoin has always affected Dogecoin. This is because the two share a correlation coefficient of 0.65, which has been on the rise since November 2023, according to data from Blockchain Center’s Crypto Correlation Tool.
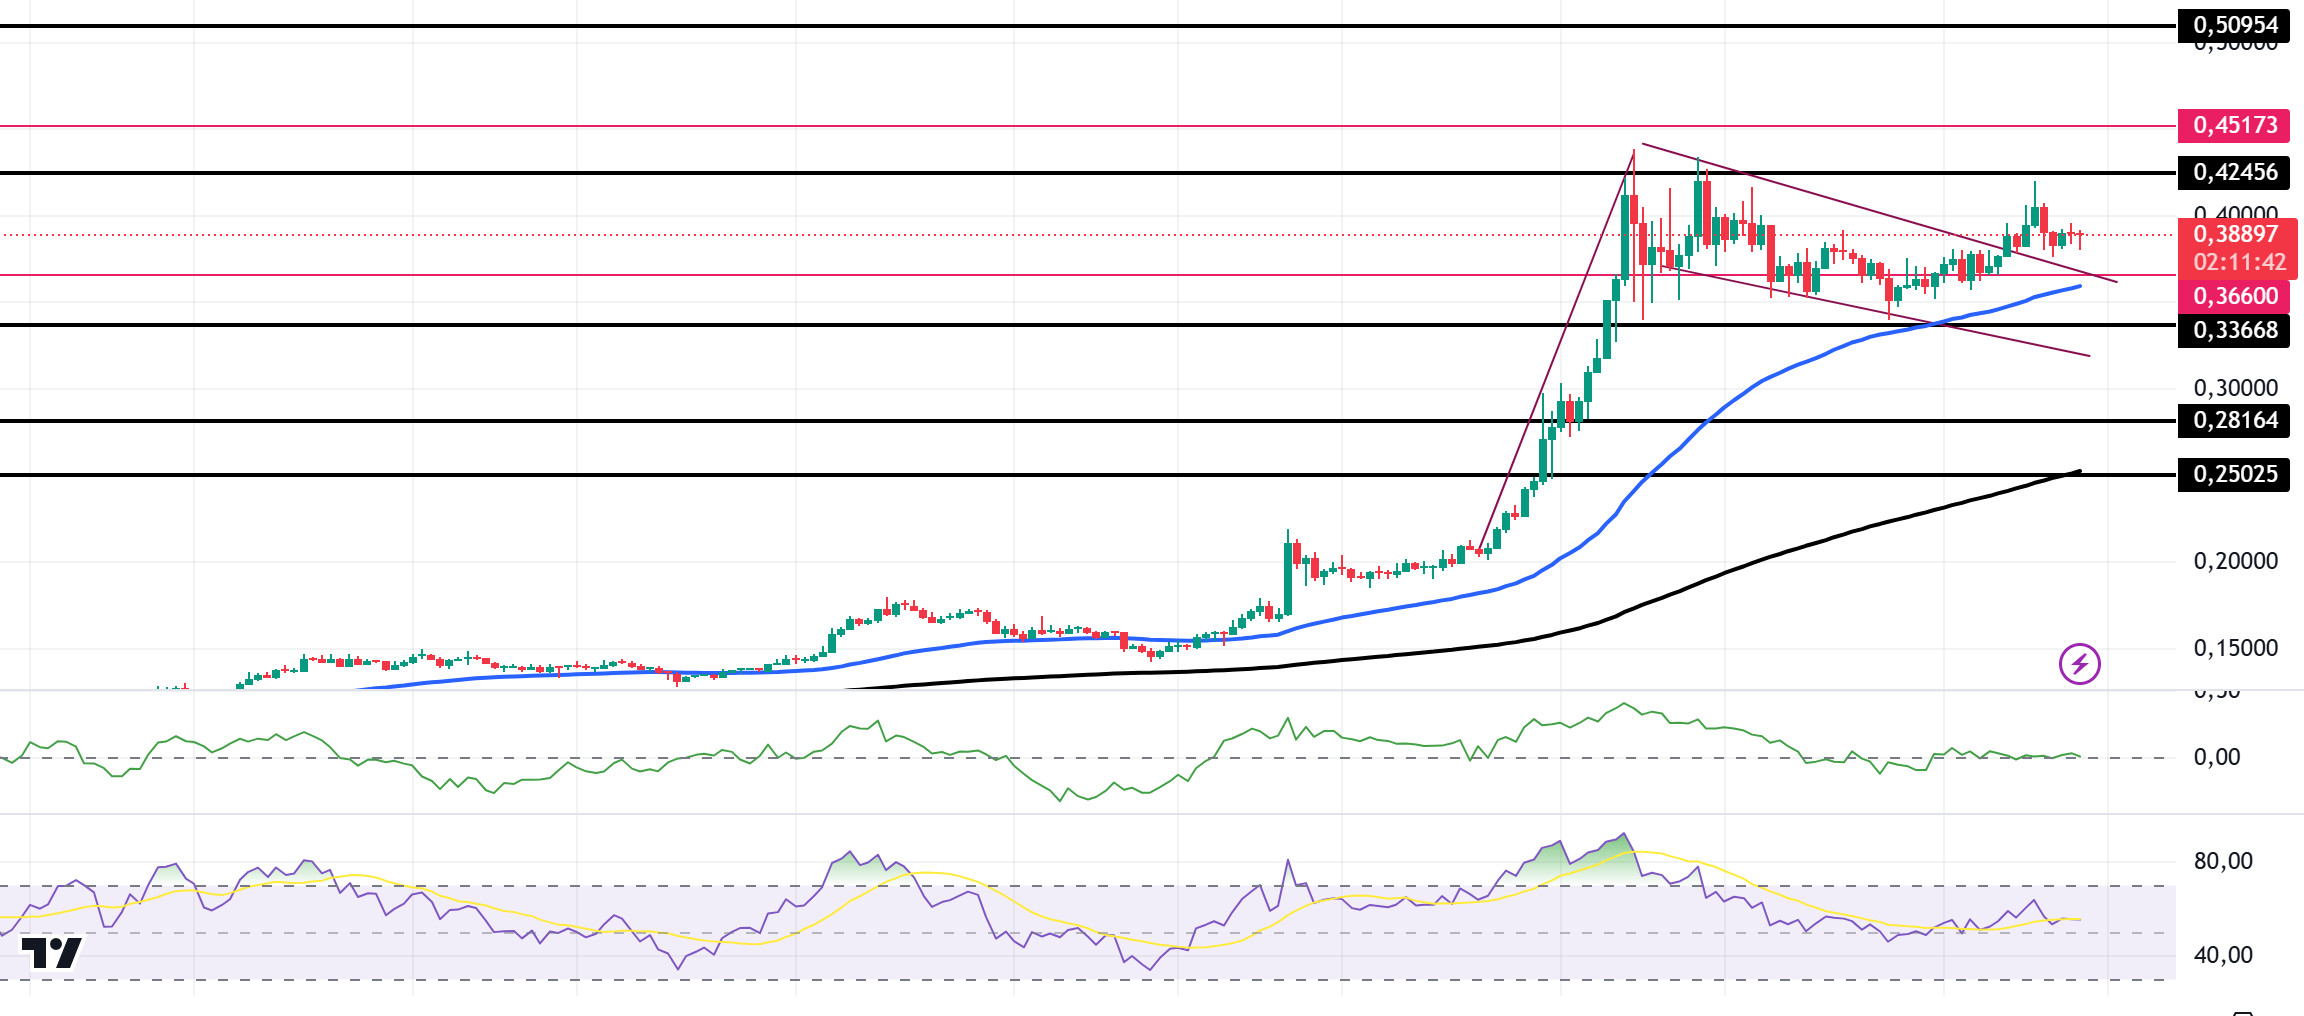
Technically, the Doge continues to consolidate above 0.35 since our analysis in the morning. However, a bull flag pattern has formed. If the pattern works after a short pullback or consolidation, the uptrend may continue. On the 4-hour timeframe, the 50 EMA (Blue Line) is above the 200 EMA (Black Line). This may mean that the uptrend will continue. But the gap between the two averages is still too wide. This could cause pullbacks. At the same time, the Relative Strength Index (RSI)14 has moved from overbought to neutral. However, when we examine the Chaikin Money Flow (CMF)20 indicator, it remains neutral. The 0.42456 level stands out as a very strong resistance point in the rises driven by both macroeconomic conditions and innovations in the Doge coin. If DOGE, which tested here, maintains its momentum and rises above this level, the rise may continue strongly. In case of retracements due to possible macroeconomic reasons or profit sales, the support levels of 0.33668 and 0.28164 can be triggered again. If the price hits these support levels, a potential bullish opportunity may arise if momentum increases.
Supports 0.36600 – 0.33668 – 0.28164
Resistances 0.42456 – 0.45173 – 0.50954
LEGAL NOTICE
The investment information, comments and recommendations contained herein do not constitute investment advice. Investment advisory services are provided individually by authorized institutions taking into account the risk and return preferences of individuals. The comments and recommendations contained herein are of a general nature. These recommendations may not be suitable for your financial situation and risk and return preferences. Therefore, making an investment decision based solely on the information contained herein may not produce results in line with your expectations.


