
MARKET SUMMARY
Latest Situation in Crypto Assets
Cryptocurrency Market Data
| Assets | Last Price | 24h Change | Dominance | Market Cap |
|---|---|---|---|---|
| BTC | 60,976.00 | -1.49% | 56.67% | 1.20 T |
| ETH | 2,389.00 | -1.69% | 13.52% | 287.06 B |
| SOLANA | 139.12 | -1.77% | 3.07% | 65.15 B |
| XRP | 0.5392 | 1.92% | 1.43% | 30.44 B |
| DOGE | 0.1059 | -2.79% | 0.73% | 15.50 B |
| TRX | 0.1596 | -0.32% | 0.65% | 13.82 B |
| CARDANO | 0.3358 | -0.90% | 0.55% | 11.73 B |
| AVAX | 25.87 | -0.33% | 0.50% | 10.52 B |
| SHIB | 0.00001687 | -2.21% | 0.47% | 9.97 B |
| LINK | 10.51 | -0.76% | 0.31% | 6.59 B |
| DOT | 4.032 | -0.43% | 0.29% | 6.06 B |
*Prepared on 10.10.2024 at 14:00 (UTC)
WHAT’S LEFT BEHIND
Critical Inflation Data Announced!
US Core Consumer Price Index (CPI) (MoM) (Sep): Announced: 0.2% Expected: 0.2% Previous: 0.3%
US Consumer Price Index (CPI) (Annual) (Sep): Released: 2.4% Expectation: 2.3% Previous: 2,5%
US Consumer Price Index (CPI) (Monthly) (Sep): Expected: 0.2% Expected: 0.1% Previous: 0.2%
Applications for Unemployment Benefits Announced: 258K Expectation: 231K Previous: 225K
Donald Trump’s Cryptocurrency Project Aave
Donald Trump-backed World Liberty Financial aims to collaborate with Aave. The platform aims to increase Aave’s liquidity and offer new investment opportunities. The Aave community is evaluating the offer.
Ripple Announces New Service
San Francisco-based blockchain startup Ripple has launched a new crypto custody solution for banks and fintech companies to store their customers’ crypto assets. Ripple aims to stand out from the competition with innovative solutions in this field, which has an important place in the crypto world.
HIGHLIGHTS OF THE DAY
Highlights of the Day
| Time | Country | News | Expectation | Previous |
|---|---|---|---|---|
| 13:15 | US | FOMC Member Cook Speaks | ||
| 14:30 | US | FOMC Member Barkin Speaks | ||
| 15:00 | US | FOMC Member Williams Speaks |
INFORMATION
MARKET COMPASS
The statements of FED officials will be followed later in the day, but we can say that tomorrow’s Producer Price Index (PPI) figures will be expected. While the recovery trend in digital assets remains limited to the US data, there are signs that the tight course may continue despite the rapid movements seen from time to time.
TECHNICAL ANALYSIS
BTC/USDT
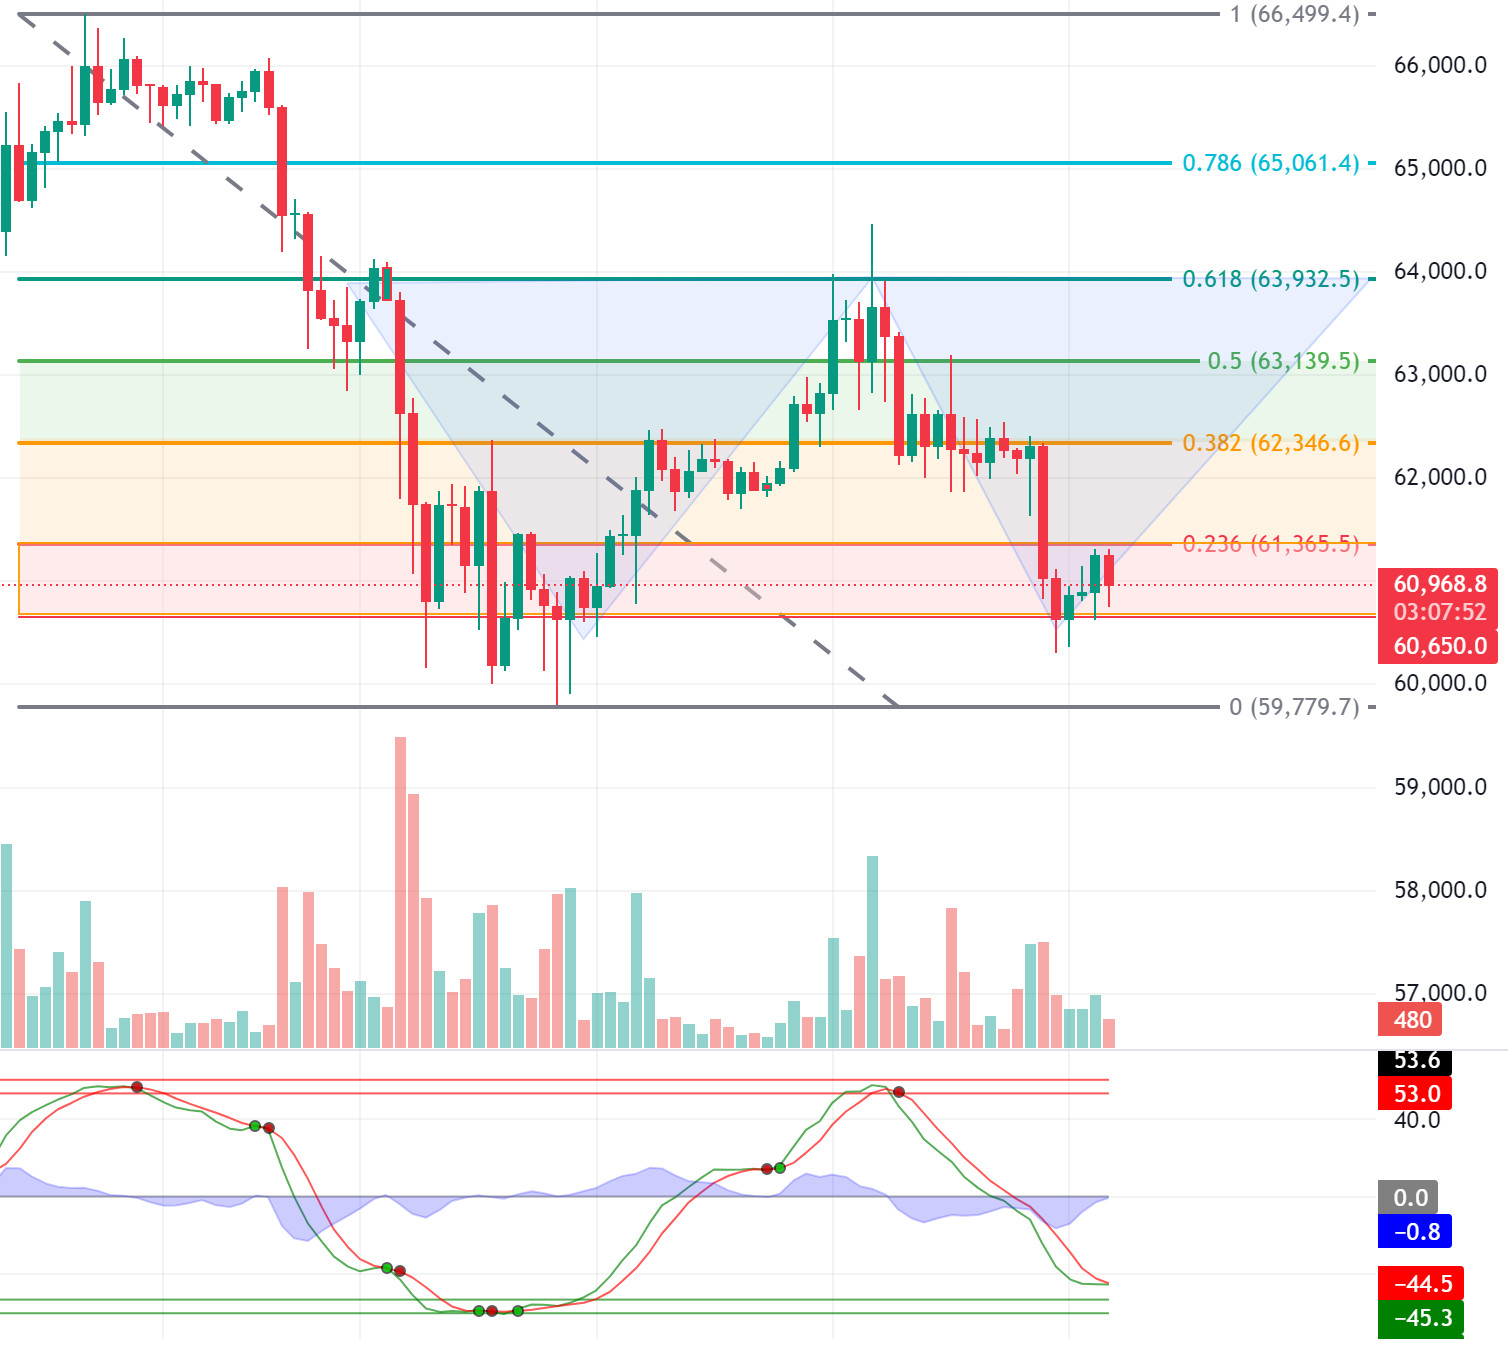
On the BTC 4-hour technical analysis chart, BTC, which exhibited low volatility above the 61,200 level before the inflation data, shows a trend towards the support level of 60,650 after the inflation data. In case of a downward breakout with hourly closures below the support level, it can be expected to take a needle to the 59,780 level, which is the level where “long” transactions are predominant in our previous analysis. In case of a breakout of the Fibonacci resistance level of 61,365, which will appear in the upward movement with the wave trend oscillator, which is our technical indicator, producing a signal in the direction of purchase, the 62,350 level can be tested.
ETH/USDT
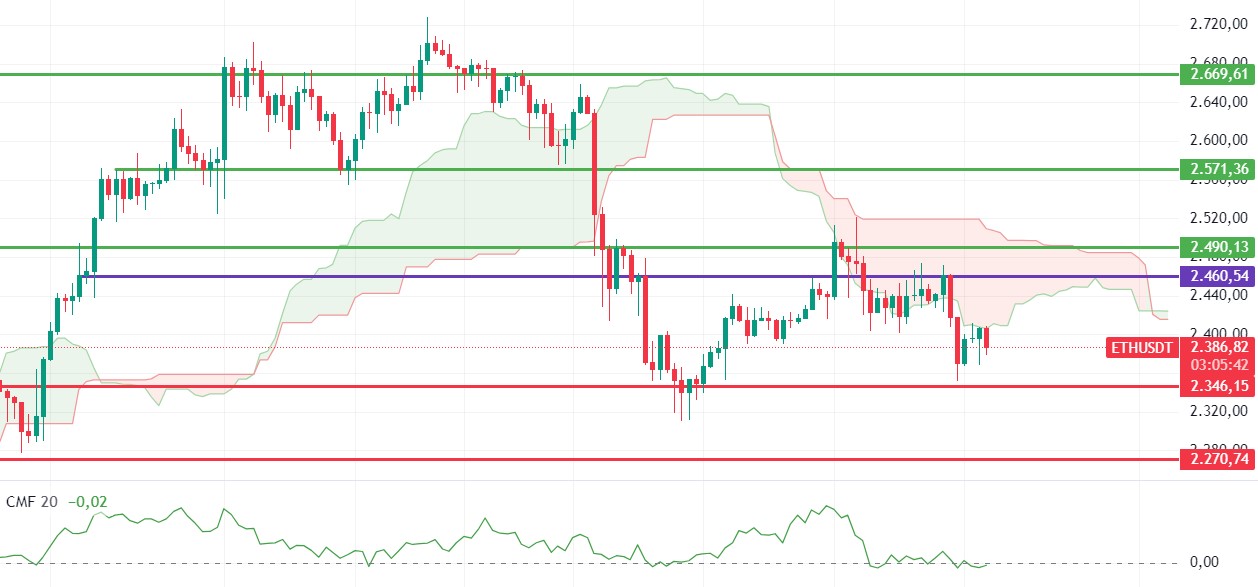
Ethereum tried to break the 2,400 level again during the day but was rejected with selling pressure. RSI, OBV and momentum also seem to have switched from positive to neutral with this move. Although CMF continues its horizontal movement, the lower level of the kumo cloud has created a serious resistance. If this area cannot be overcome with the US market opening, a decline to 2,346 levels may come again. Exceeding the 2,400 level may bring rises up to 2,460 levels. CVD spot and futures movements also seem to support the neutral position of the market.
Supports 2,346 – 2,270 – 2,194
Resistances 2,400 – 2,460 – 2,490
LINK/USDT
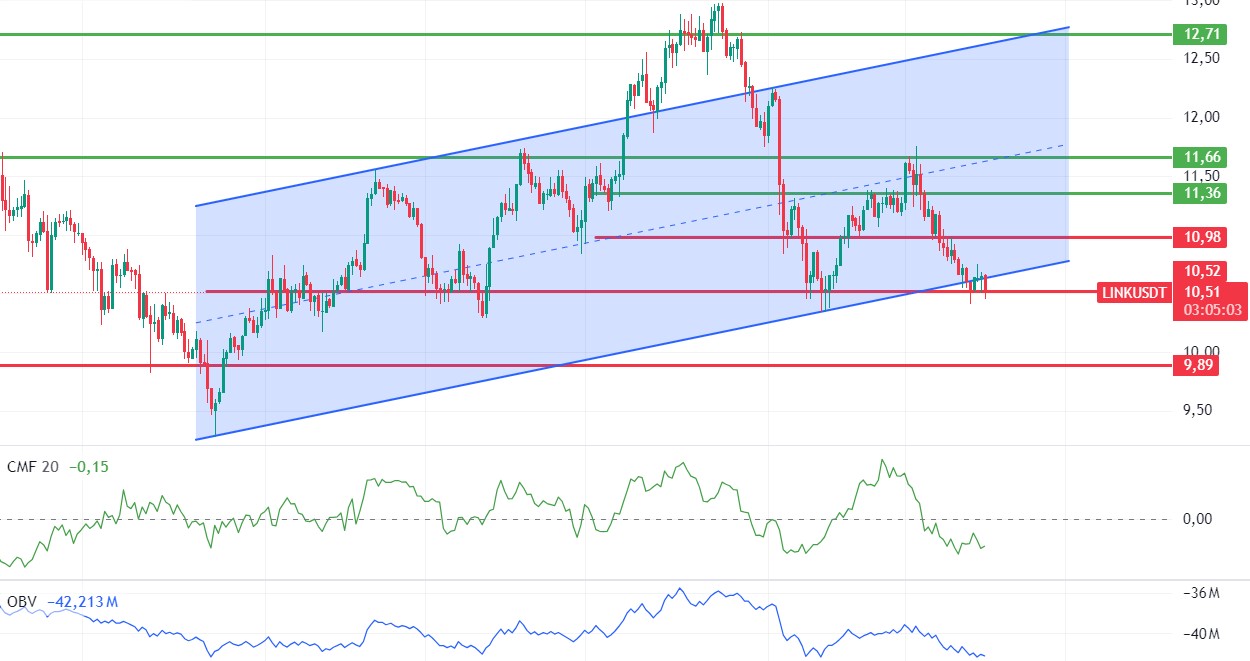
The danger signals for LINK started to ring. For LINK trying to hold on to the 10.52 level, closures below this zone can be interpreted as a continuation of the decline. However, if it can hold on to this level, rises up to 10.98 levels may come again. Decreasing volume and negativities on CMF indicate that investors may benefit from being careful for a while. There is also a slightly negative outlook for RSI and OBV. It would be healthy to determine the trend according to the breakout or reaction.
Supports 10.52 – 10.17 – 9.89
Resistances 10.98 – 10.36 – 11.66
SOL/USDT
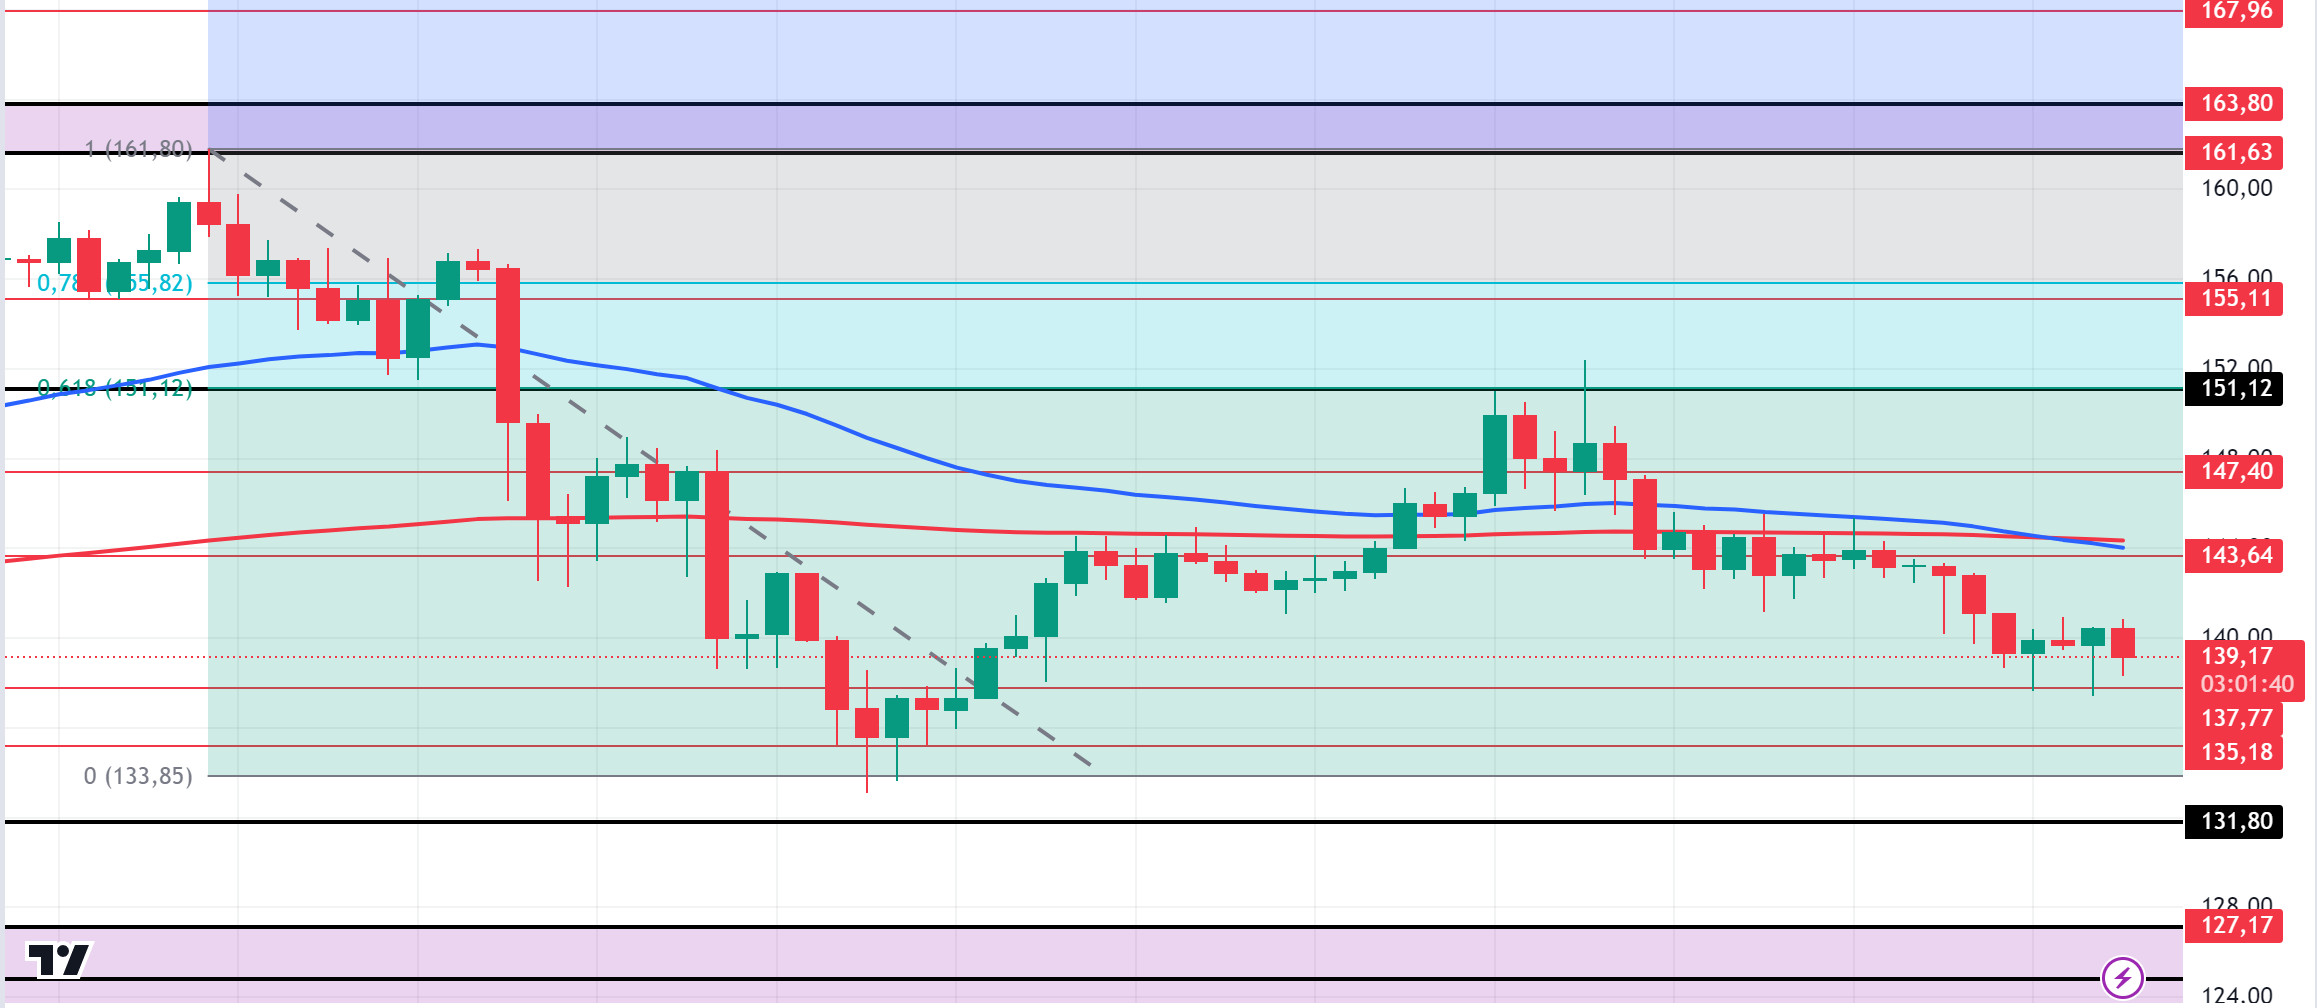
Inflation in the US came in above expectations. While the expectation was 2.3%, it came in at 2.4%, raising the question of whether the FED cut 50 basis points early. This made it quite likely that the Fed will not consider a 50 basis point rate cut at the next meeting. According to the data from CME, the probability of a 25 basis point rate cut is seen as 89%. At the same time, the rise in unemployment is likely to push no rate cut off the agenda. The 231 thousand expected forecast is now 258 thousand. On the other hand, bitcoin whales sold about 30,000 BTC (about 1.83 billion dollars) in the last 72 hours. Technically, the price continues to accumulate in the 127.17 – 161.63 band since August 8. It encountered resistance at 0.618 (151.12), the Fibonacci retracement. On the 4-hour chart, the 50 EMA has broken the 200 EMA to the downside. This could mean that the decline could deepen. The 151.12 level is a strong resistance point in the uptrend driven by both macroeconomic conditions and innovations in the Solana ecosystem. If it rises above this level, the rise may continue. In the sales that investors will make due to political and macroeconomic conditions, the support level of 131.80, which is the place of retreat, should be followed. If the price comes to these support levels, a potential bullish opportunity may arise.
Supports 137.77 – 135.18 – 131.80
Resistances 143.64 – 147.40 – 151.12
ADA/USDT
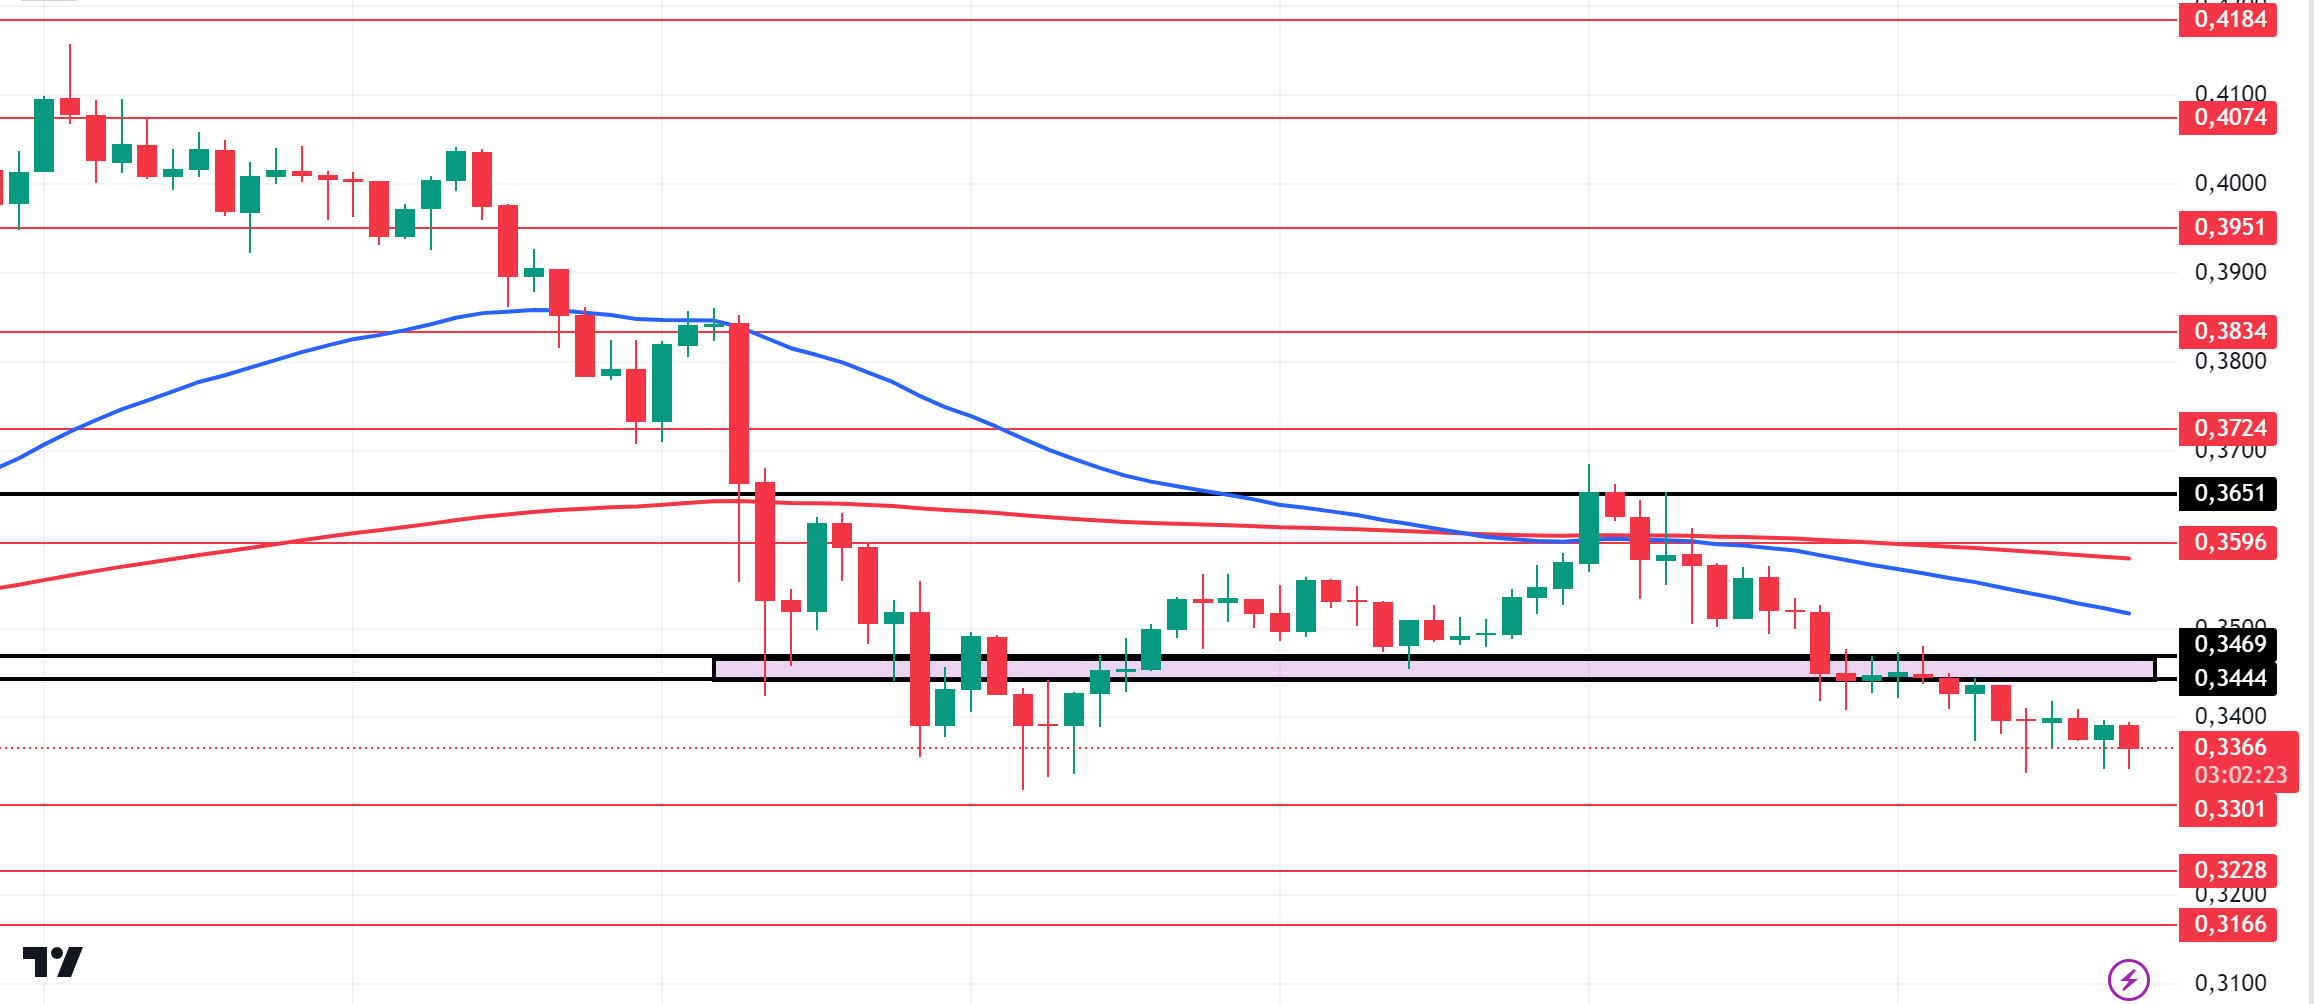
Inflation in the US came in above expectations. While the expectation was 2.3%, it came in at 2.4%, raising the question of whether the FED cut 50 basis points early. This made it quite likely that the Fed will not consider a 50 basis point rate cut at the next meeting. According to the data from CME, the probability of a 25 basis point rate cut is seen as 89%. At the same time, the rise in unemployment is likely to push no rate cut off the agenda. The 231 thousand expected forecast is now 258 thousand. On the other hand, bitcoin whales have sold about 30,000 BTC (about $1.83 billion) in the last 72 hours. Technically, on the 4-hour chart, both the 50 EMA broke the 200 EMA downwards and the strong support band of 0.3469 – 0.3444. This could be a sign that the decline may deepen. However, the price seems to have made a double bottom. If this pattern works, traders may consider this as a place to add to their positions. ADA 0.3301- 0.3228 levels appear as a strong support in retracements with possible political and macroeconomic news. If the whale purchases in the ecosystem continue, the 0.3651 level should be followed as a strong resistance.
Supports 0.3301 – 0.3228 – 0.3166
Resistances 0.3444 – 0.3469 – 0.3596
AVAX/USDT
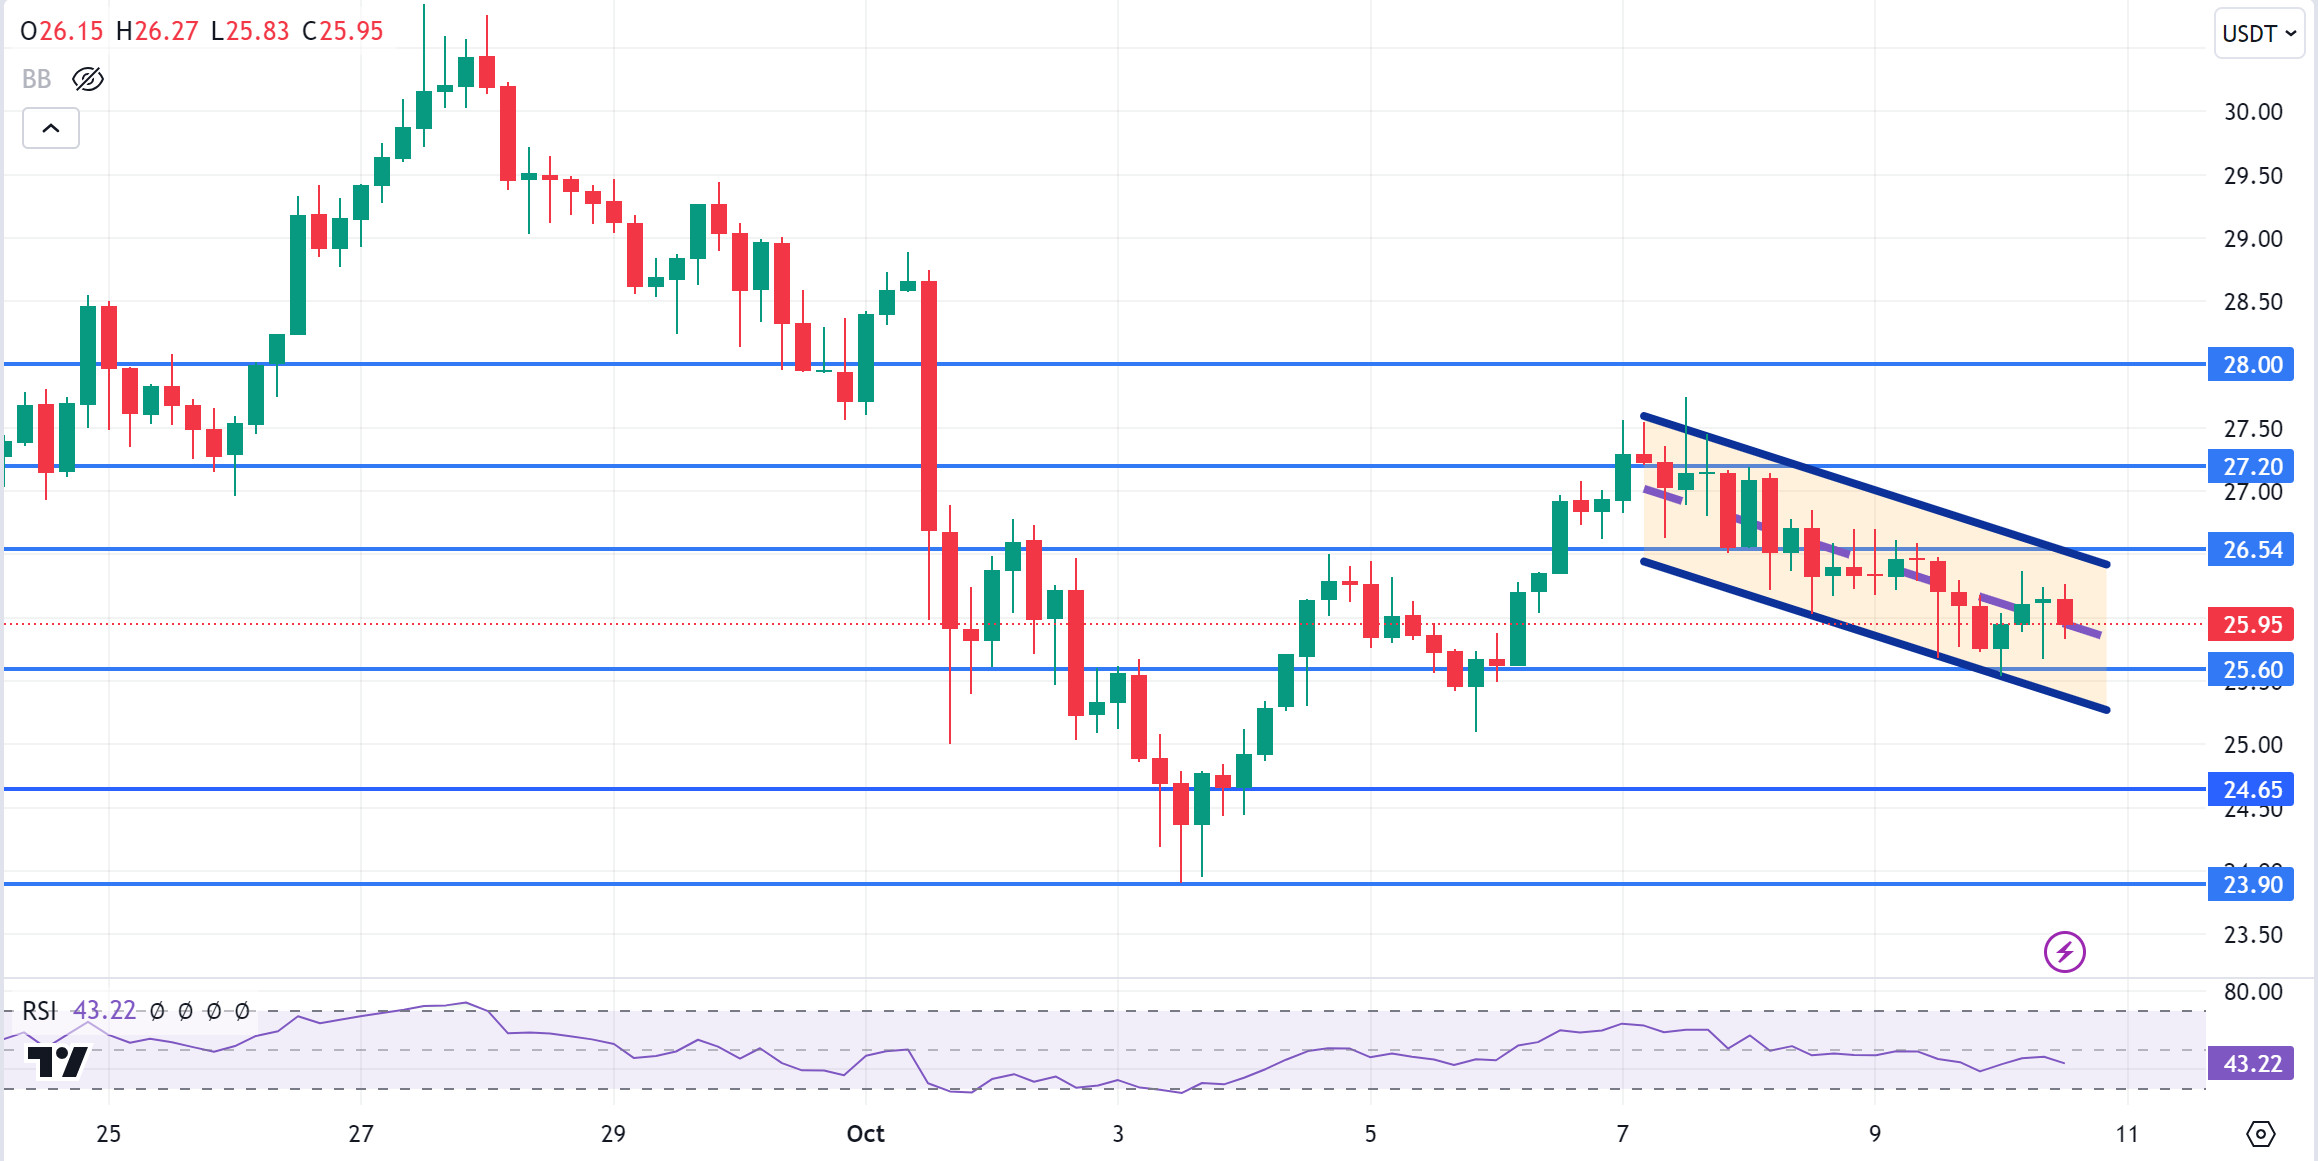
AVAX, which opened today at 25.76, is trading at 25.95 after the US consumer price index and unemployment claims data. For the market, news flows from the Middle East will be important in this process.
On the 4-hour chart, it is moving in the middle band of the falling channel. With the RSI 43 value, it can be expected to move to the upper band from here. In such a case, it may test the 26.54 resistance. Sales may increase in case of news of increasing tension in the Middle East. In such a case, it may go down to the lower band of the channel and test the 25.60 support. As long as it stays above 24.65 support during the day, the desire to rise may continue. With the break of 24.65 support, sales may increase.
Supports 25.60 – 24.65 – 23.90
Resistances 26.54 – 27.20 – 28.00
TRX/USDT
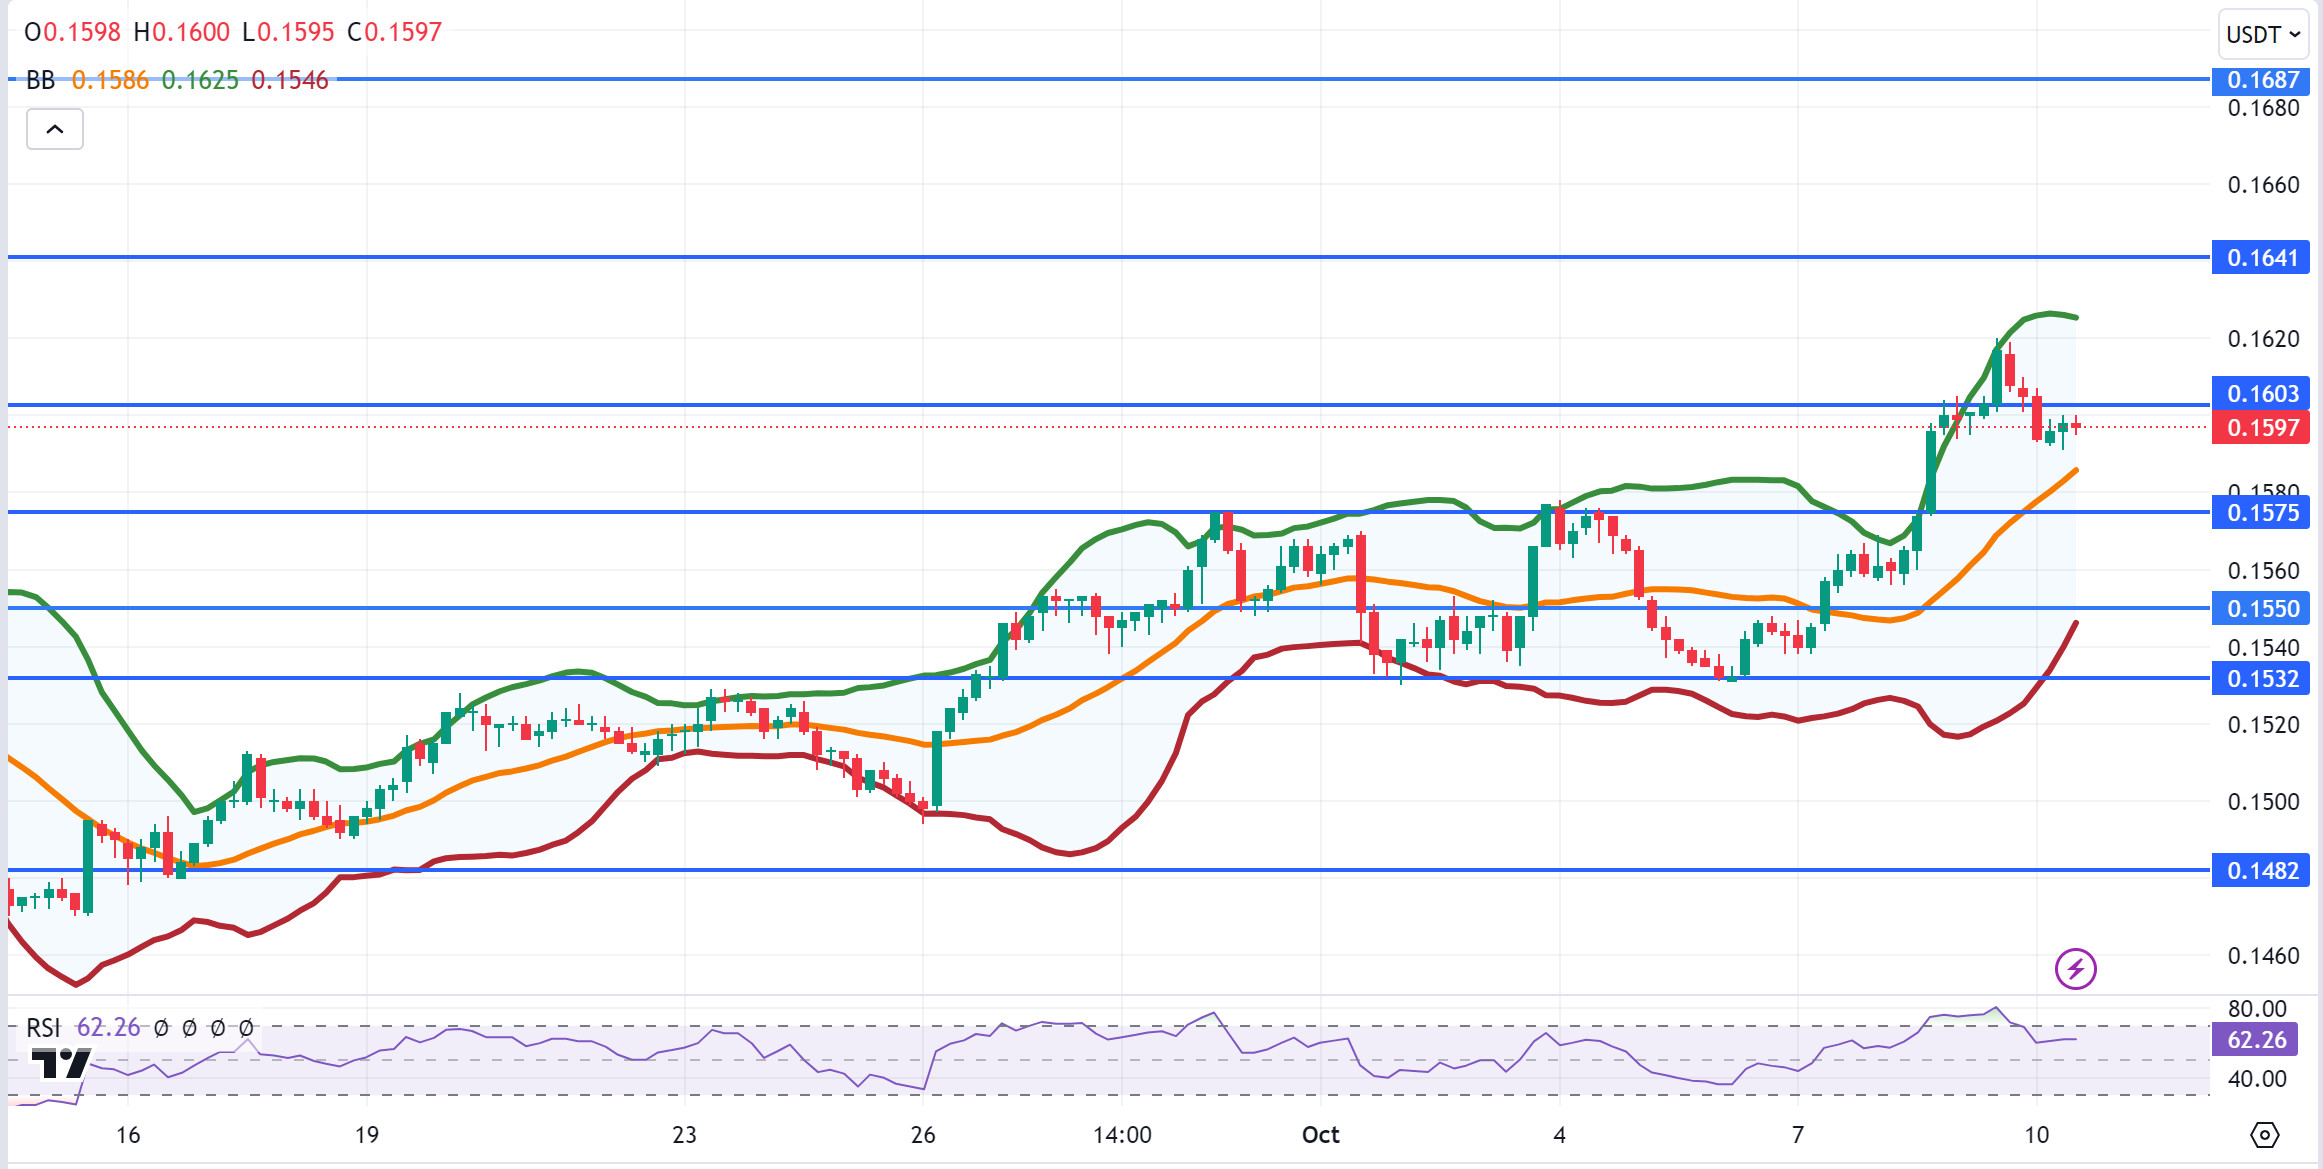
TRX, which started the day at 0.1605, fell slightly during the day and is trading at 0.1597. Inflation and unemployment benefits data were released and did not cause major volatility in the market. The market is currently closely following the news flows regarding the tension in the Middle East.
On the 4-hour chart, it is moving downwards towards the Bollinger middle band. The RSI 62 value is very close to the overbought zone and can be expected to fall a little more from its current level. In such a case, it may move to the Bollinger middle band and test the 0.1575 support. If the tension in the Middle East decreases, it may test 0.1641 resistance with future purchases. As long as TRX stays above 0.1482 support, the desire to rise may continue. If this support is broken downwards, sales can be expected to increase.
Supports 0.1575 – 0.1550 – 0.1532
Resistances 0.1603 – 0.1641 – 0.1687
XRP/USDT
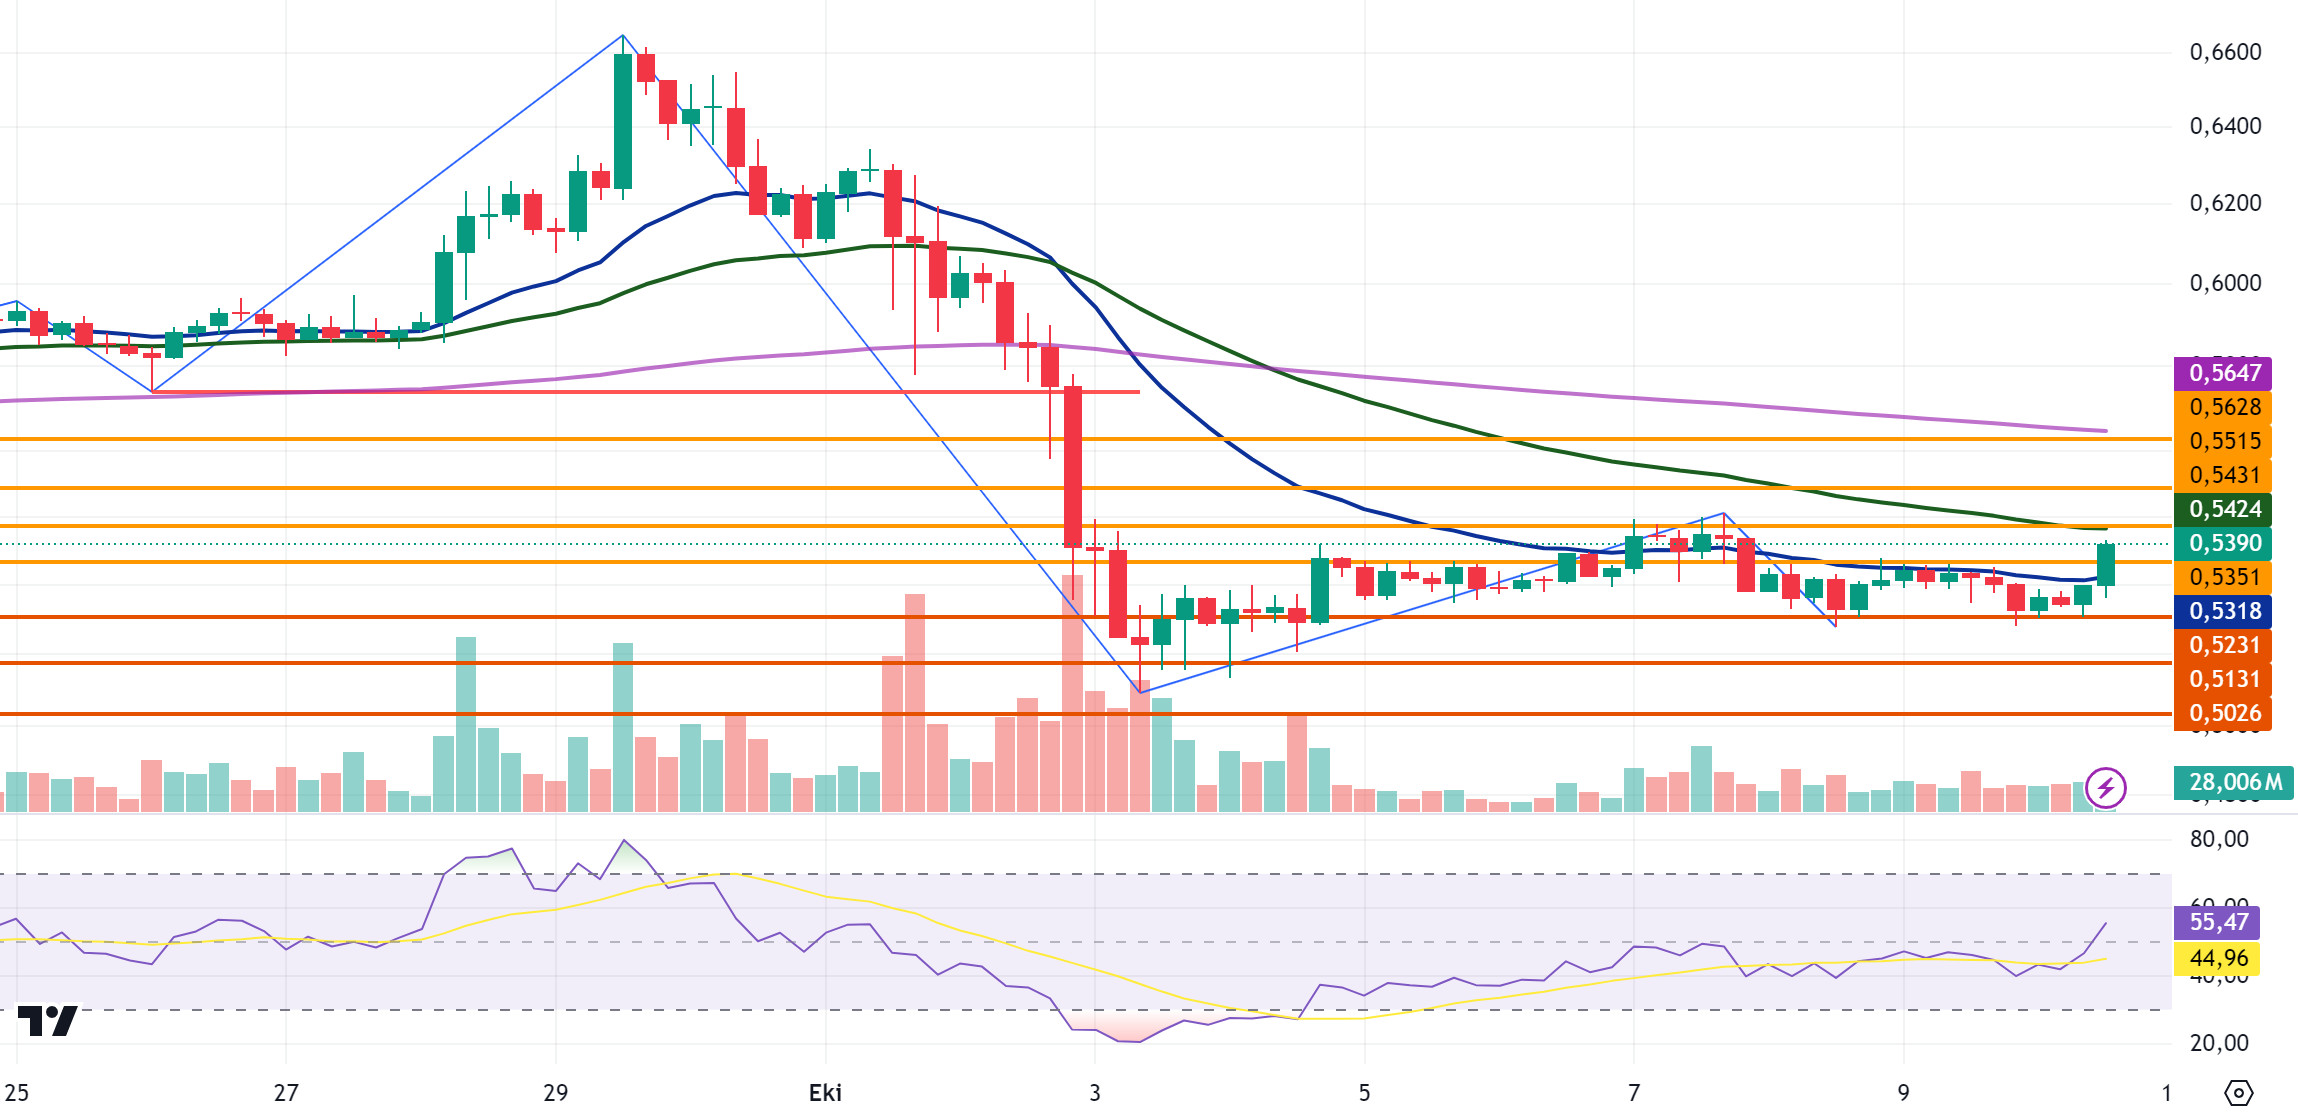
XRP started today at 0.5241 and is currently trading at 0.5390, up about 3%. Positive developments regarding XRP have been a factor in the acceleration of the rise. In particular, the announcement that Ripple launched a crypto custody service for banks and financial institutions had a positive impact on investors and XRP purchases increased. In the 4-hour analysis, XRP is trading above the EMA20 level, which it tested and failed to break on the last candle. If XRP closes the candle above the EMA20 and the 0.5351 resistance level, it may test the 0.5431-0.5515 resistance levels in the continuation of the rise. In case of a decline, it may fall into a horizontal band with its decline and if the decline deepens, it may test the 0.5231-0.5131-0.5026 support levels.
On the upside, XRP may decline with possible sales at EMA50 and 0.5431 and may offer a short trading opportunity. In its decline, it may rise with possible purchases at 0.52 and may offer a long trading opportunity.
EMA20 (Blue Line) – EMA50 (Green Line) – EMA200 (Purple Line)
Supports 0.5231 – 0. 5131 – 0.5026
Resistances 0.5351 – 0.5431 – 0.5515
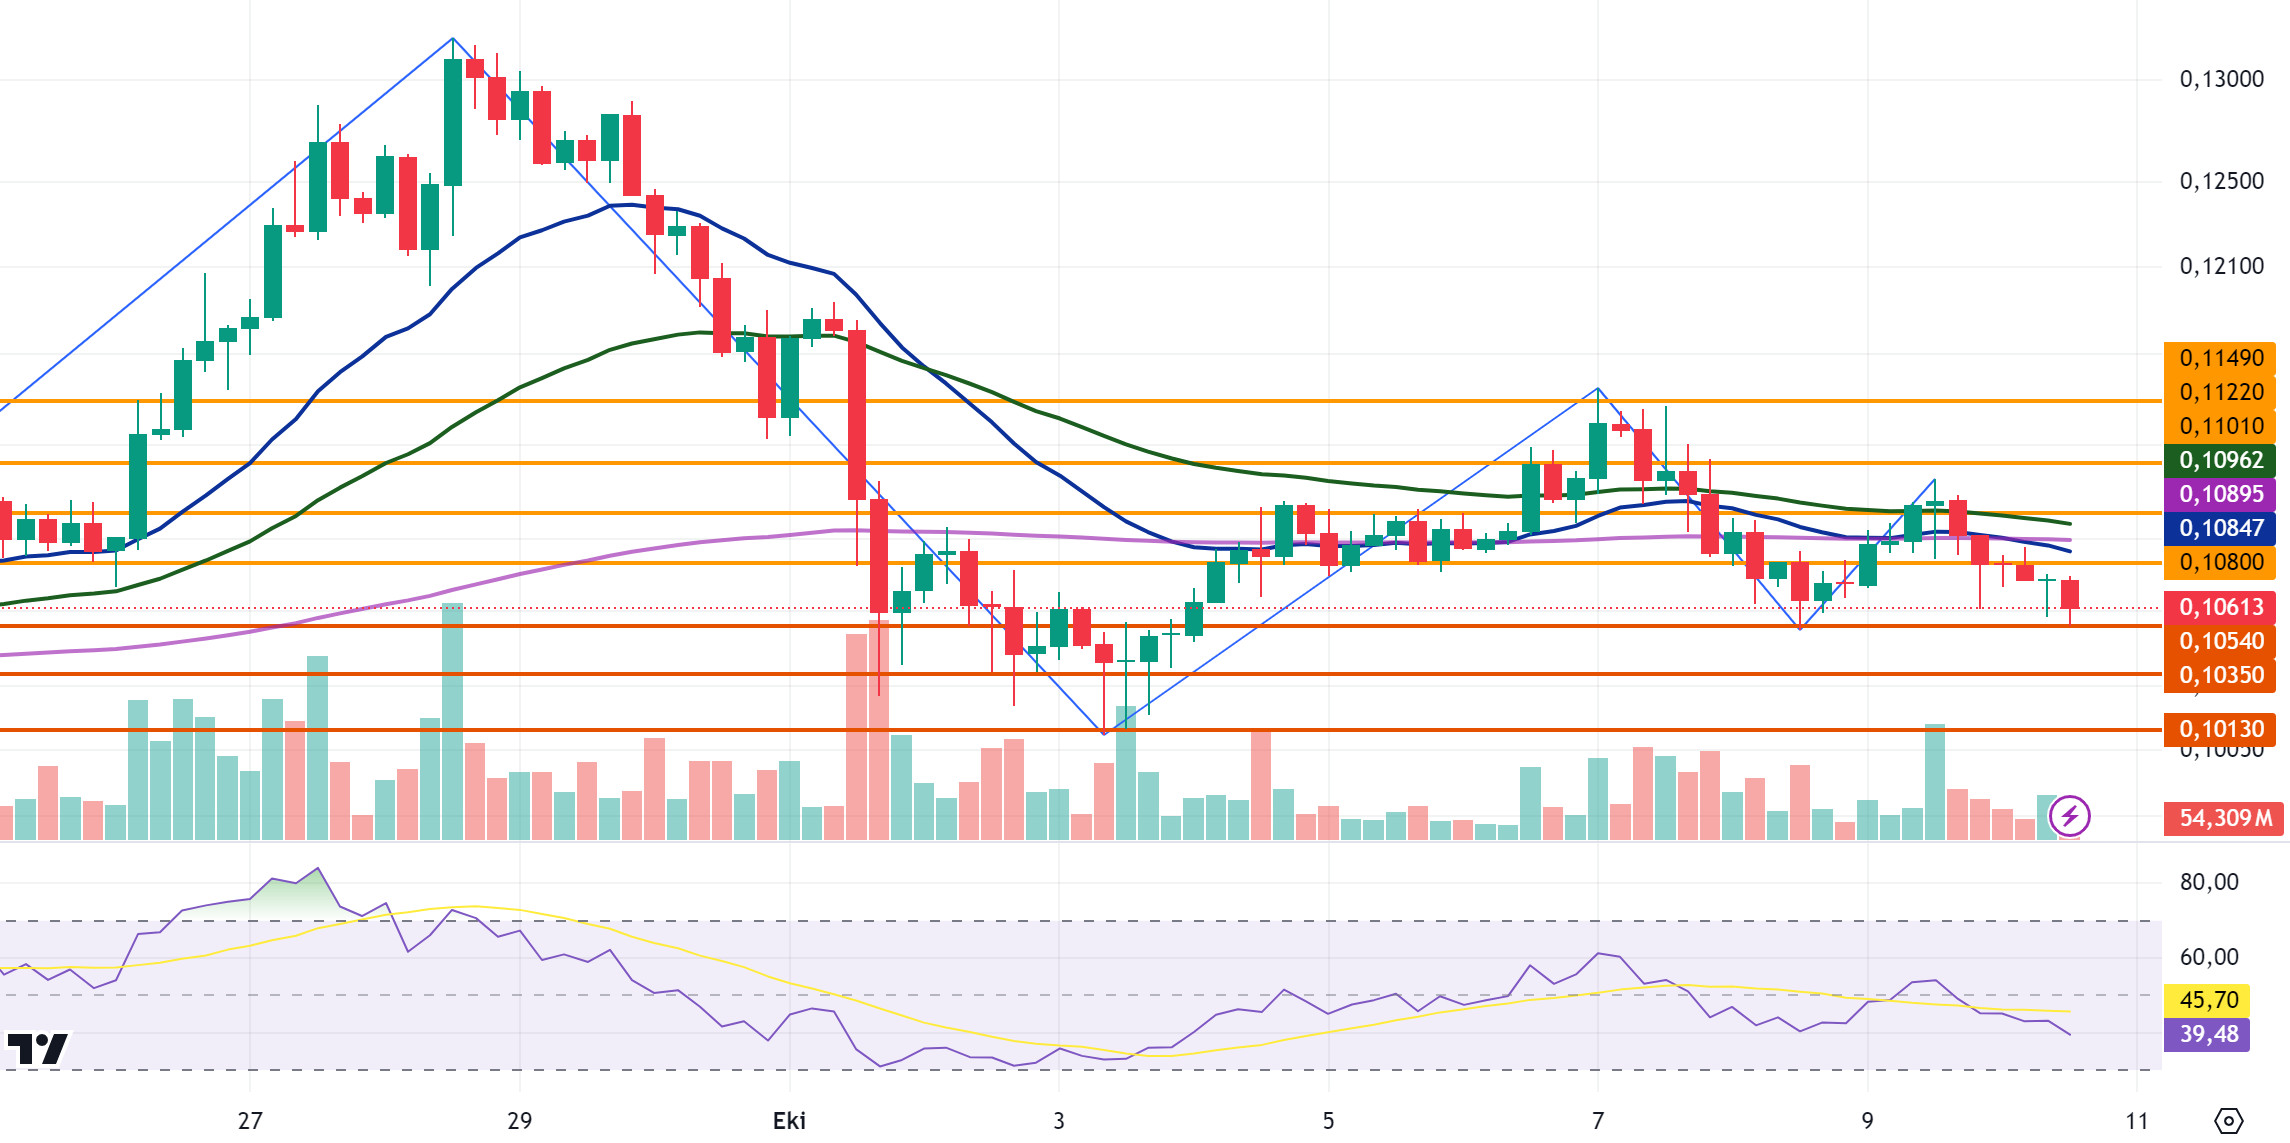
DOGE/USDT
DOGE, which started today at 0.1078, continues to trade at 0.1061 with a loss of about 2%. As a result of the sales coming with the increase in selling pressure on DOGE, its movement within the horizontal band ended and it is traded in a falling channel. DOGE recovered with purchases at 0.1054 in its decline and is currently trading at 0.1061. If the decline continues with selling pressure below EMA levels, it may test support levels of 0.1054-0.1035-0.1013. In case the decline is replaced by an uptrend, it may test the resistance levels of 0.1080-0.1101-0.1122.
In the DOGE rise, it may decline with sales that may come at EMA levels and may offer a short trading opportunity.
EMA20 (Blue Line) – EMA50 (Green Line) – EMA200 (Purple Line)
Supports 0.1054 – 0.1035 – 0.1013
Resistances 0.1080 – 0.1101 – 0.1122
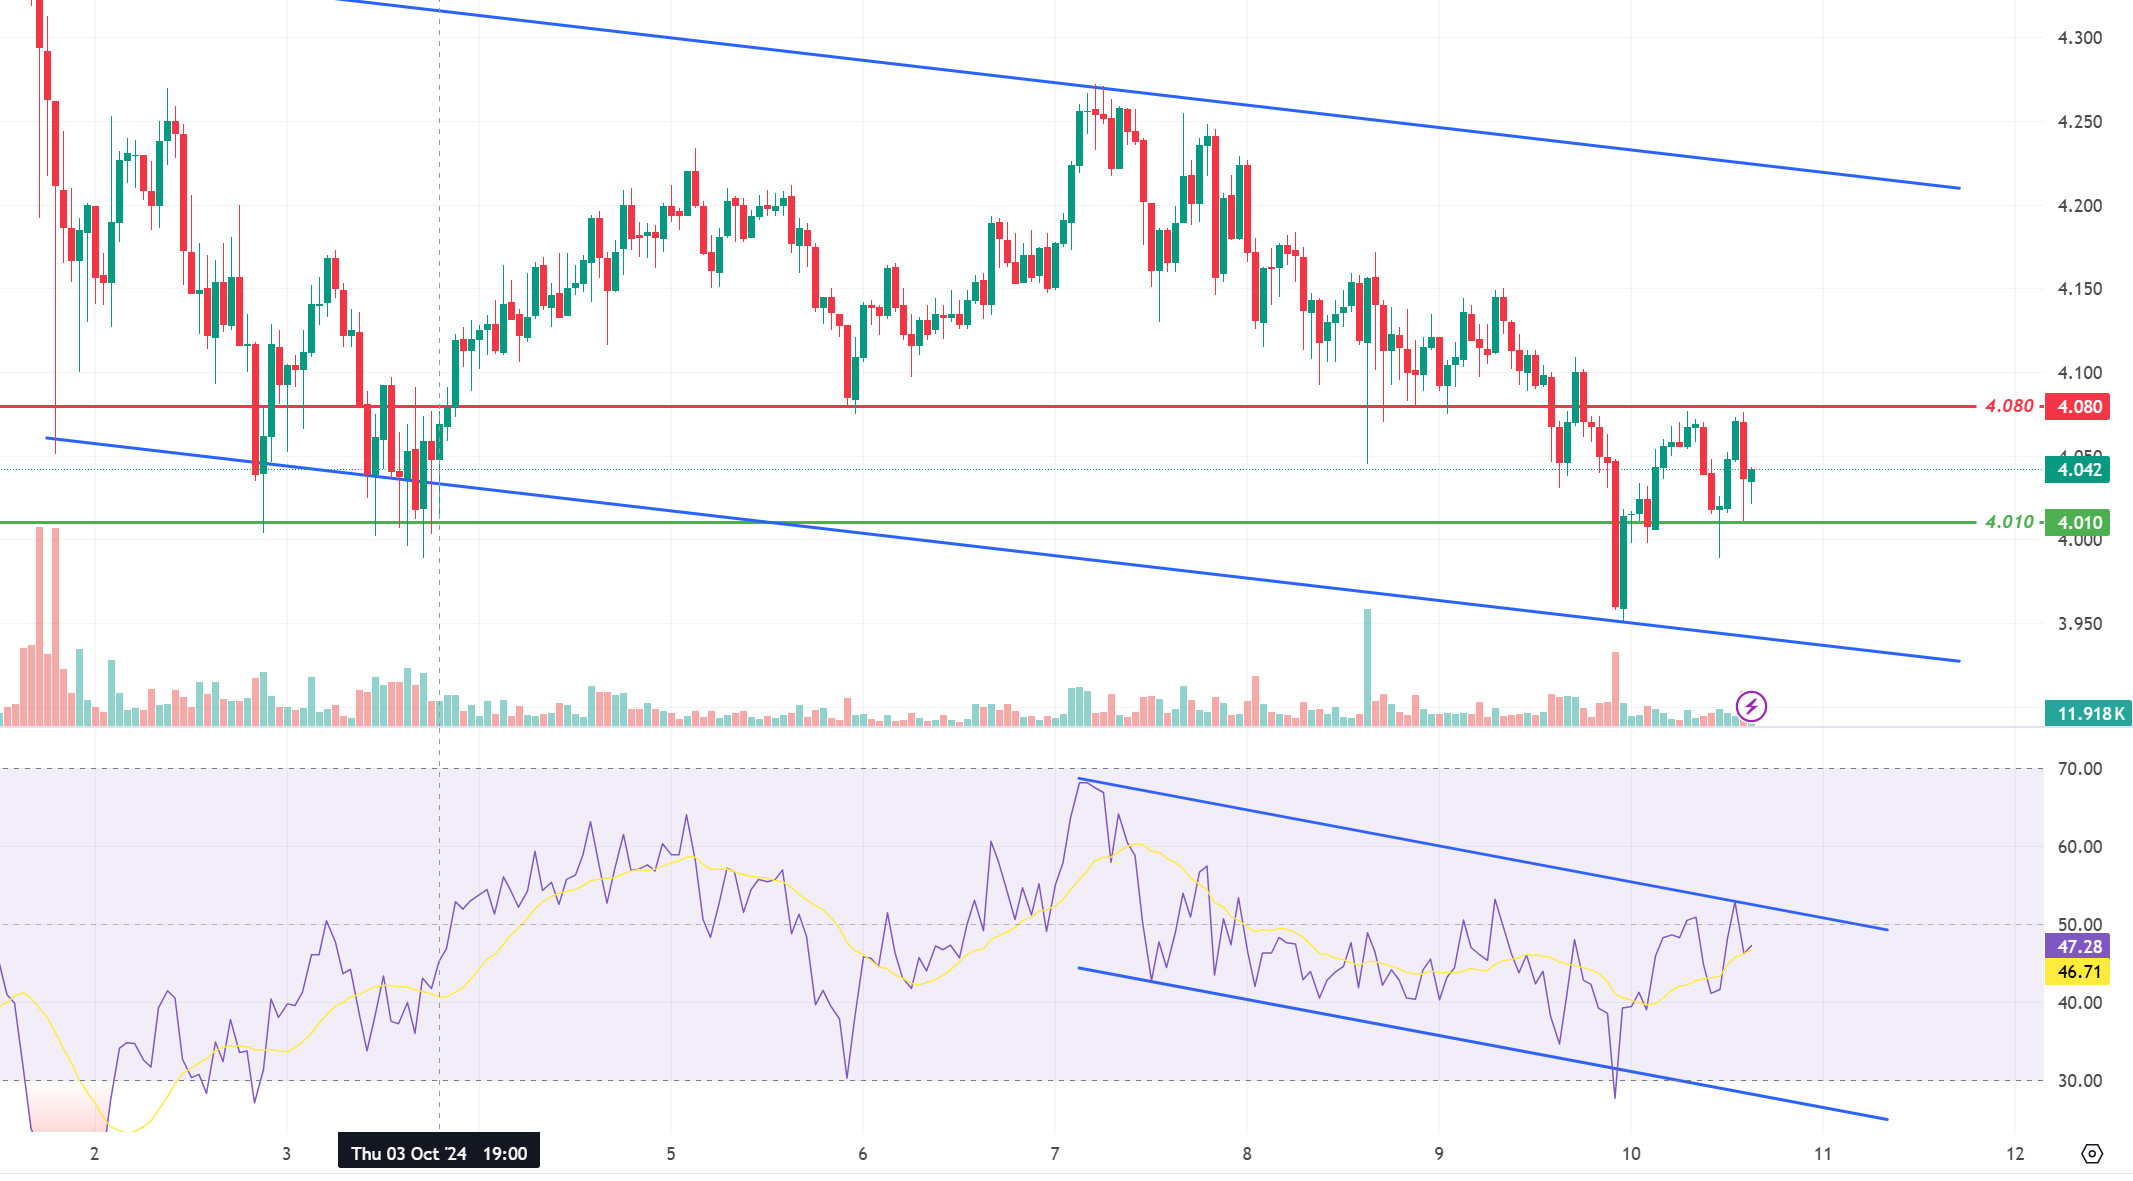
DOT/USDT
Mythos brings 3.6 million new users to the Polkadot ecosystem. As Mythical Games migrates its Blankos collection and DMarket assets to Polkadot, this integration is expected to create more than 5 million wallets. Utilizing Polkadot’s parachain structure and EVM module, Mythos provides a transparent and secure trading environment for NFT collections.
DOT rose to 4.080 resistance with the reaction from the lower band of the descending channel. Unable to break the selling pressure at 4.080 resistance, DOT fell to 4.010 support level. When we examine the RSI, it seems to have received a reaction from the upper band of the descending channel. If the price breaks the 4.010 support down, we can expect a reaction from the next support level of 3.975 band. On the other hand, if the buyer pressure increases, the price may want to break the selling pressure in the 4.080 band.
Supports 4.010 – 3.975 – 3.875
Resistances 4.080 – 4.180 – 4.210
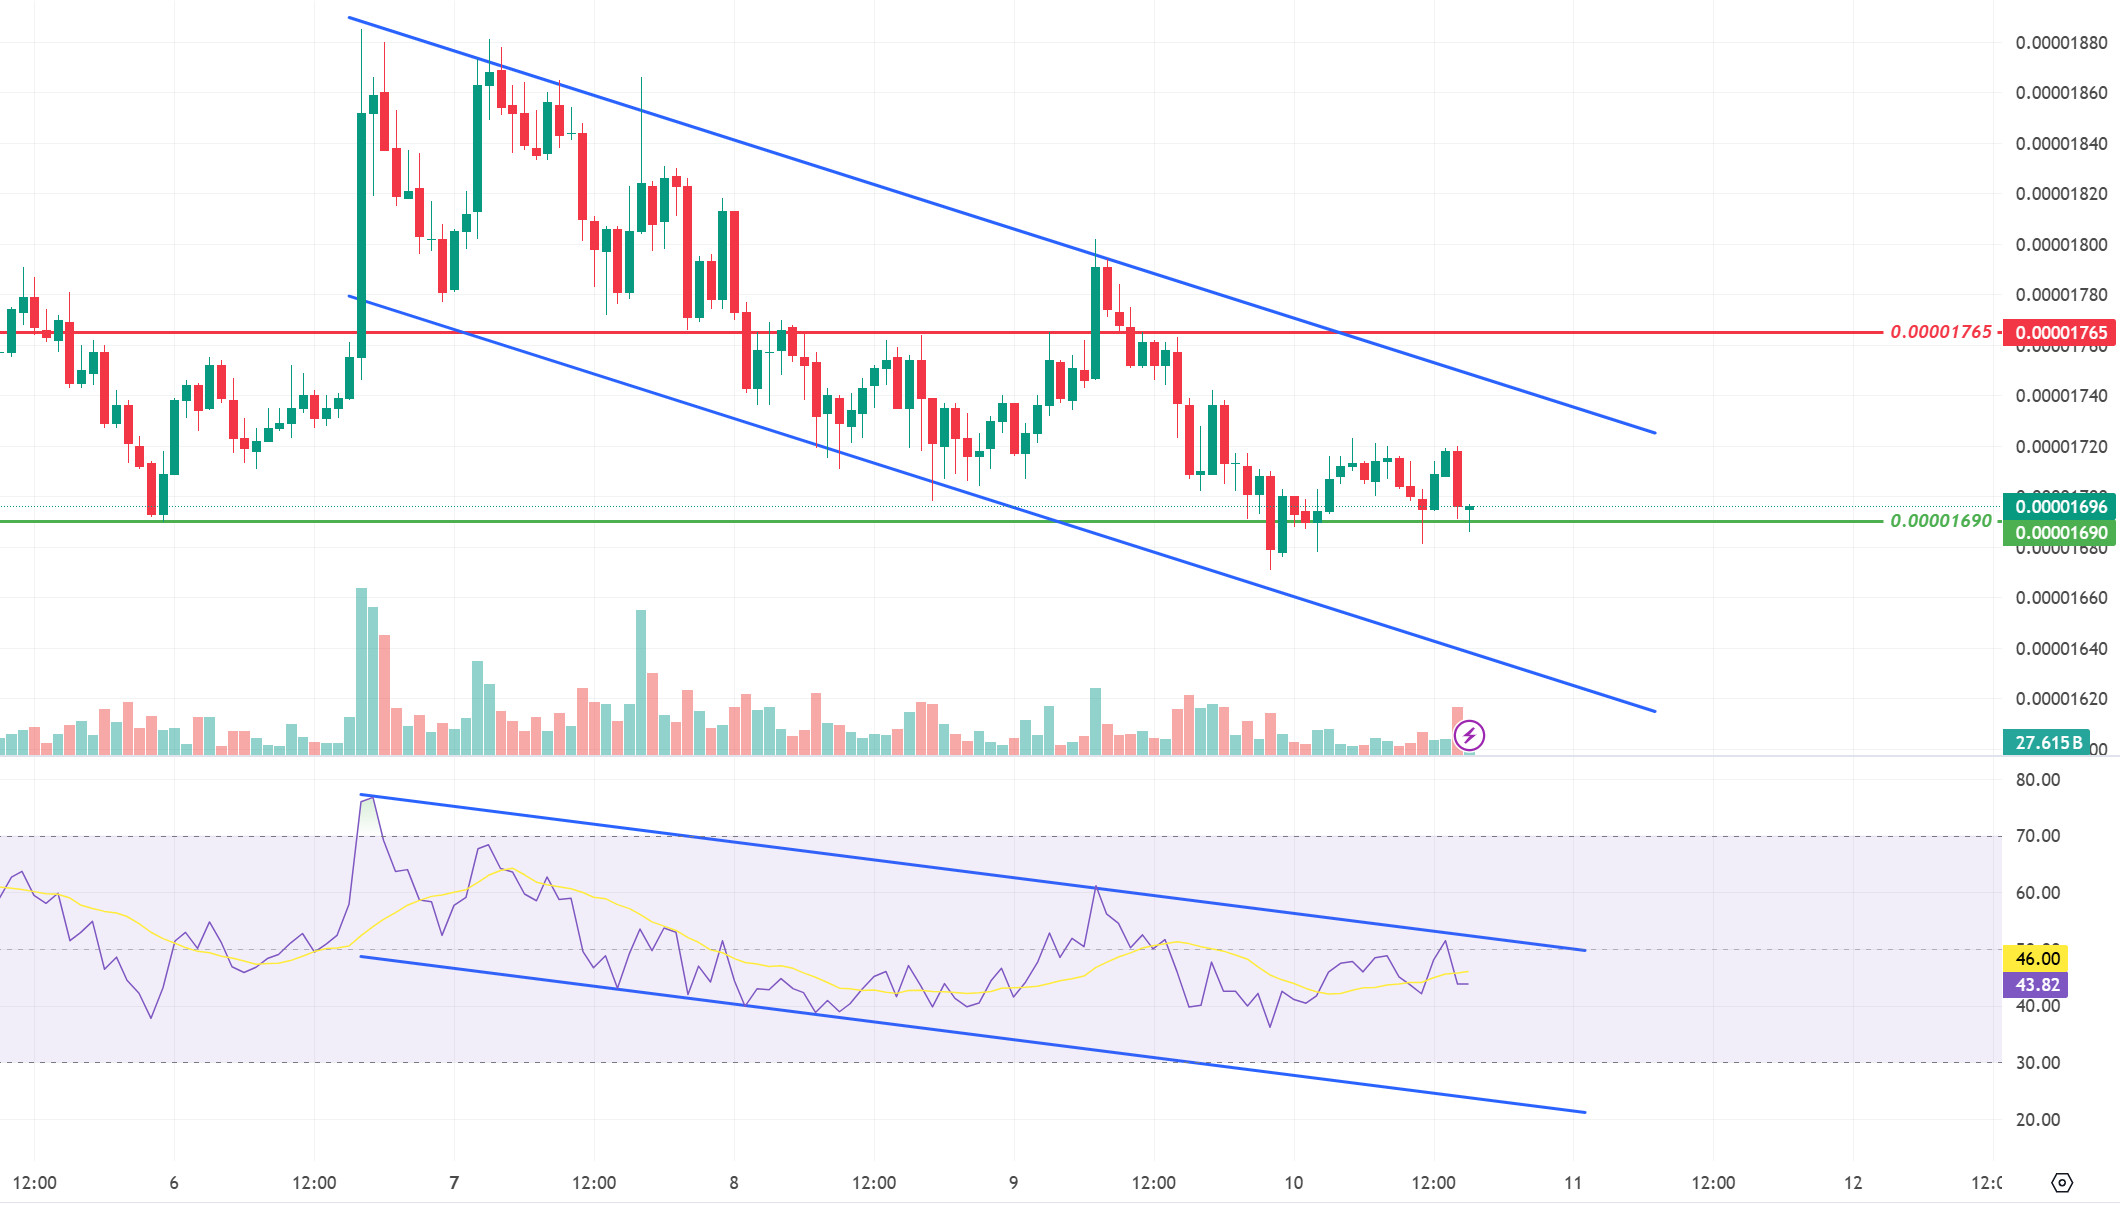
SHIB/USDT
Shiba Inu’s layer-2 solution Shibarium has started to show signs of growth in the DeFi ecosystem. According to DeFiLlama data, Shibarium’s total value locked (TVL) on DeFi has reached $4.37 million, surpassing the previous peak of $3.9 million in March. Although Shiba Inu’s price has plummeted in recent days, the community is confident in Shibarium’s long-term effects.
When we examine the RSI on the SHIB chart, we see that it is rejected from the upper band of the channel. SHIB, which cannot rise with the reaction it received from the 0.00001690 level, may test the 0.00001690 level again. On the other hand, if the buyer pressure increases with increasing burning rates, the price may want to break the selling pressure at the 0.00001765 resistance level.
Supports 0.00001690 – 0.00001630 – 0.00001565
Resistances 0.00001765 – 0.00001810 – 0.00001895
LEGAL NOTICE
The investment information, comments and recommendations contained herein do not constitute investment advice. Investment advisory services are provided individually by authorized institutions taking into account the risk and return preferences of individuals. The comments and recommendations contained herein are of a general nature. These recommendations may not be suitable for your financial situation and risk and return preferences. Therefore, making an investment decision based solely on the information contained herein may not produce results in line with your expectations
