
MARKET SUMMARY
Latest Situation in Crypto Assets
| Varlık | Son Fiyat | 24h Değişim | Piyasa Hakimiyeti | Piyasa Değeri |
|---|---|---|---|---|
| BTC | 63,808.00 | 1.37% | 56.64% | 1.26 T |
| ETH | 2,524.00 | 2.39% | 13.65% | 303.93 B |
| SOLANA | 151.00 | 2.89% | 3.19% | 70.93 B |
| XRP | 0.5364 | -0.14% | 1.37% | 30.40 B |
| DOGE | 0.1117 | 0.11% | 0.73% | 16.34 B |
| TRX | 0.1608 | -0.93% | 0.63% | 13.92 B |
| CARDANO | 0.3522 | -1.83% | 0.55% | 12.30 B |
| AVAX | 29.37 | 1.26% | 0.54% | 11.95 B |
| SHIB | 0.00001784 | 0.03% | 0.47% | 10.50 B |
| LINK | 10.87 | -1.51% | 0.31% | 6.81 B |
| DOT | 4.229 | 0.85% | 0.29% | 6.36 B |
*Prepared on 10.14.2024 at 06:00 (UTC)
WHAT’S LEFT BEHIND
Donald Trump is Leading in the Election
Former US President Donald Trump continues to make remarkable moves in the upcoming 2024 presidential elections. According to Polymarket data, Trump leads his opponent Kamala Harris by 10 points.
MicroStrategy on its Way to Become a Bitcoin Bank
MicroStrategy aims to reach a valuation of $1 trillion with Bitcoin investments. The company’s founder, Michael Saylor, believes that Bitcoin is a long-term investment.
Avalanche reaches agreement with Terra
The Avalanche Foundation has reached a new agreement to buy back 2 million tokens sold into the Terra ecosystem. The aim of the agreement is to avoid the complex processes resulting from Terra’s bankruptcy. However, the agreement is subject to court approval.
HIGHLIGHTS OF THE DAY
Important Economic Calender Data
| Zaman | Haber | Beklenti | Önceki |
|---|---|---|---|
| Axie Infinity (AXS) | 12.58M Token Unlock | ||
| Sui (SUI) | Deep Token Launch | ||
| Aleph Zero (AZERO) | Aleph Zero Talks | ||
| 13:00 | USFOMC Member Kashkari Speaks | ||
| 19:00 | USFOMC Member Waller Speaks | ||
| 13:00 | USFOMC Member Kashkari Speaks |
INFORMATION:
*The calendar is based on UTC (Coordinated Universal Time) time zone. The economic calendar content on the relevant page is obtained from reliable news and data providers. The news in the economic calendar content, the date and time of the announcement of the news, possible changes in the previous, expectations and announced figures are made by the data provider institutions. Darkex cannot be held responsible for possible changes that may arise from similar situations.
MARKET COMPASS
In global markets, expectations regarding the health of the Chinese economy and the new stimulus measures to be announced, which have been the main drivers of asset prices recently, continue to be under the scrutiny of investors. The statements made by the Finance Minister at the weekend did not fully meet market expectations. However, on the first working day of the week, news about new incentives to support businesses came from the country. Stock markets in Asia, where Japan is closed, are generally slightly positive. In the US, where the bond market will be closed, futures indices seem to be in negative territory.
On Saturday, Finance Minister Lan Foan promised a series of stimulus measures but did not provide specific details on the size of the fiscal package, prompting investors to remain cautious. For some time, substitute assets have been under pressure amid expectations of potential stimulus of unprecedented magnitude from China. Digital assets can be categorized in this group. While the idea that China will bring significant opportunities to the equity markets has taken a back seat for now, we have seen rallies in the cryptocurrency markets.
We continue to maintain our view, which we have been stating for some time, that the general direction is up. However, it is worth noting that we expect some correction in major digital assets after the recent gains over the weekend. Markets failed to satisfy Chinese expectations, but during the week, the market dynamics we mentioned earlier, including expectations for the Fed’s rate cut path, will continue to drive prices.
TECHNICAL ANALYSIS
BTC/USDT
Bitcoin, which had a relatively quiet weekend, started a new upward movement by making an upward move towards the 64,000 level this morning. With the US elections approaching, presidential candidate D. Trump, who attracts attention with his pro-crypto attitude, is among the factors that triggered the rise. In addition, the fact that MicroStrategy, which attracts attention with its Bitcoin investments, aims to reach a valuation of $ 1 trillion thanks to these investments may give a clue about the Bitcoin course in the long term.
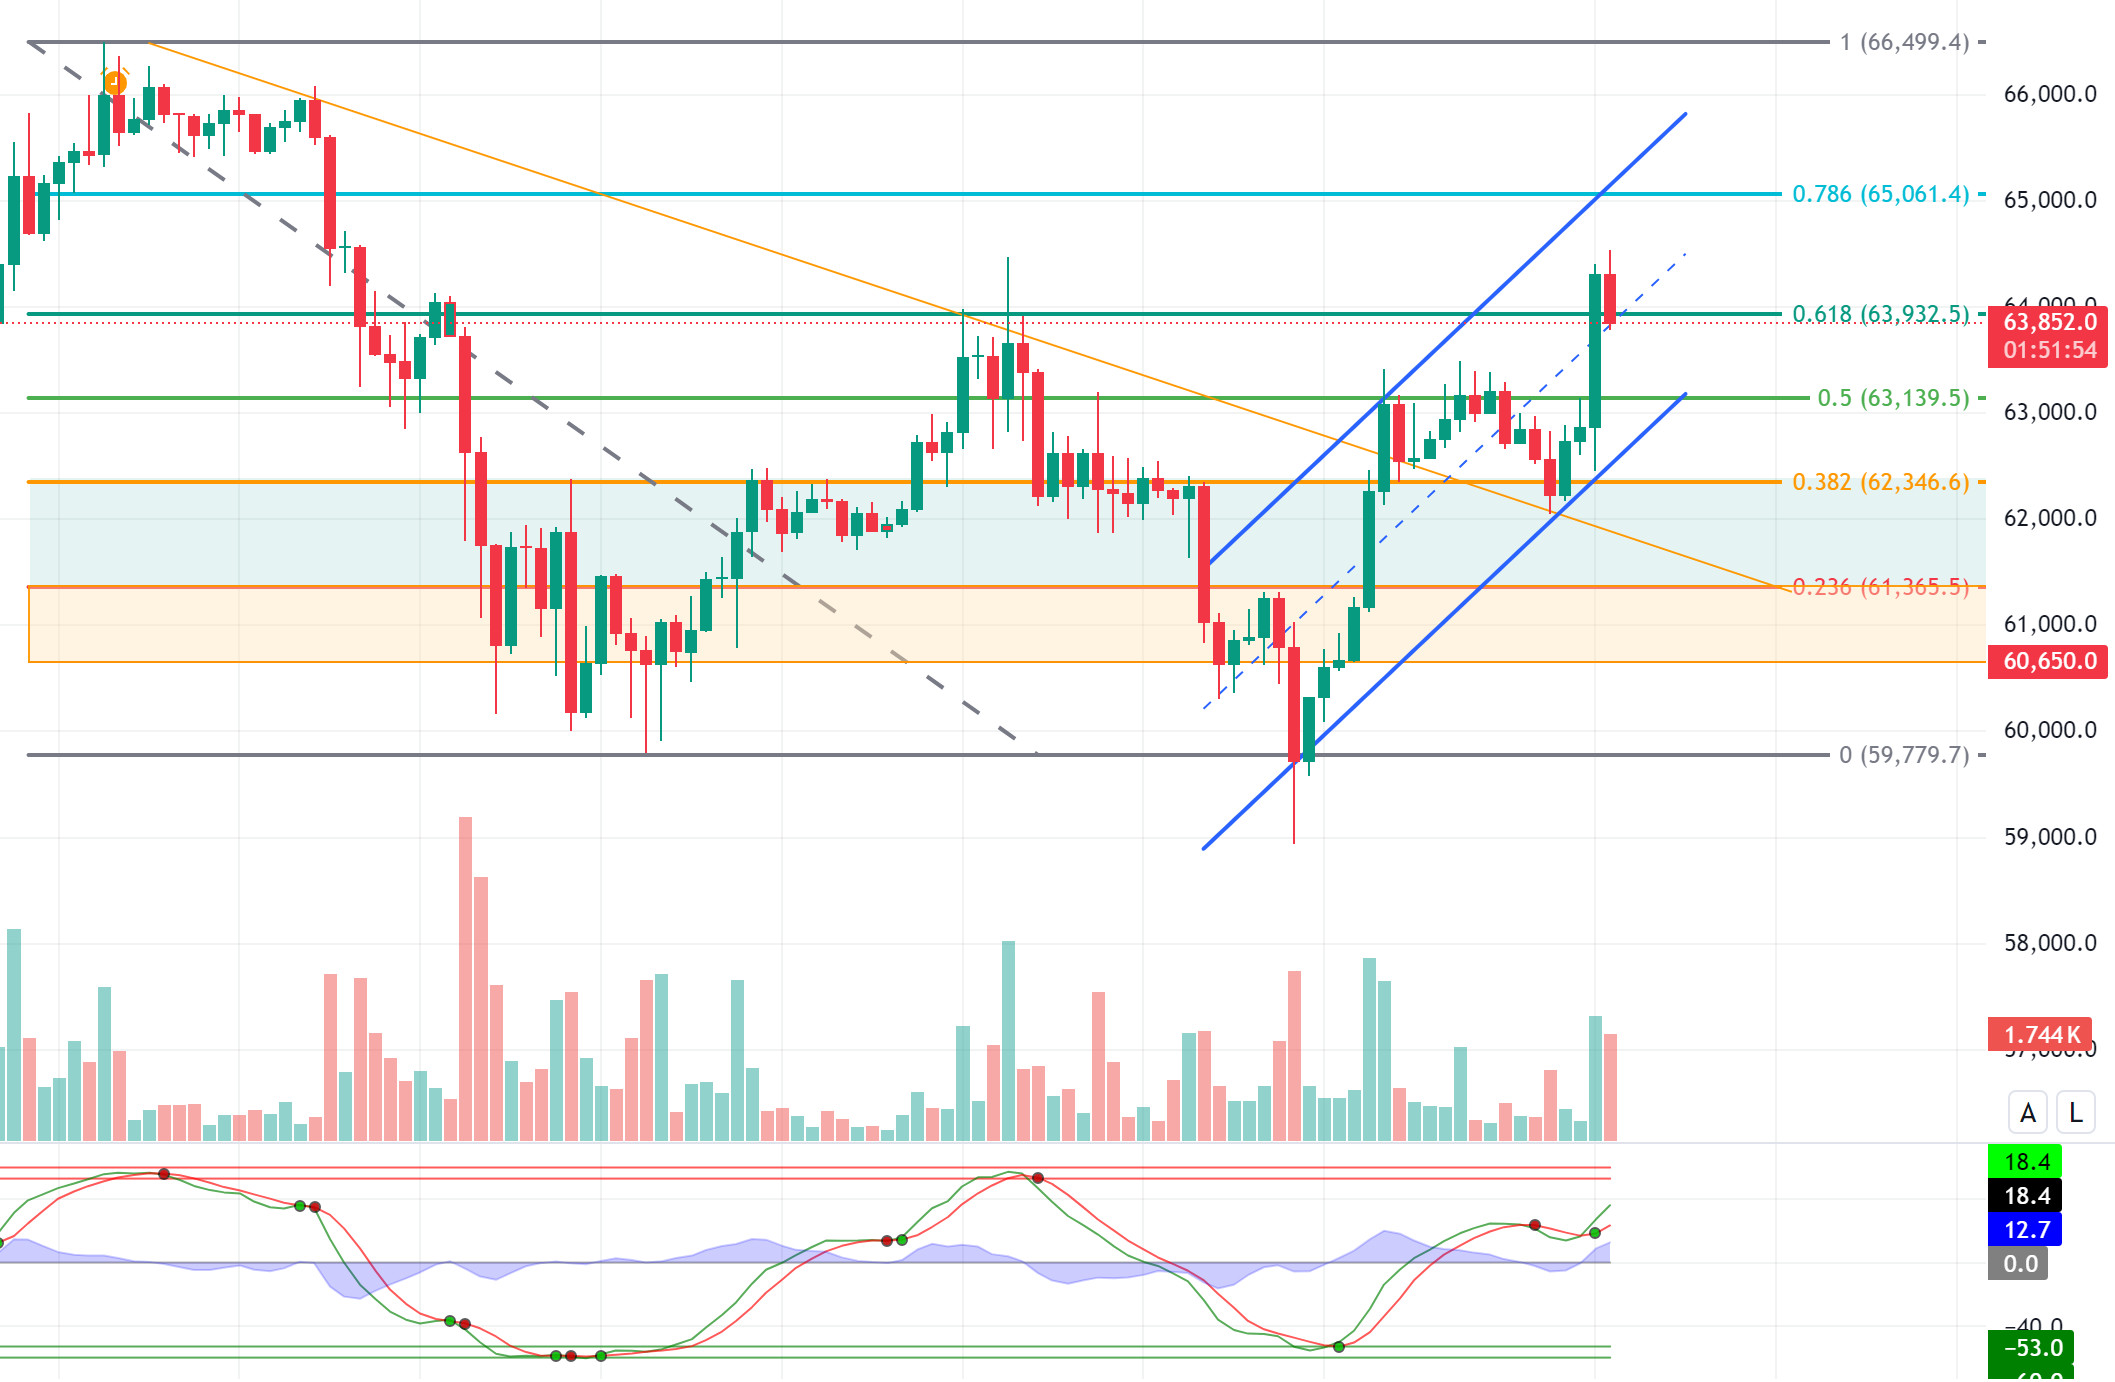
In the BTC 4-hour technical analysis, BTC, which formed the bullish channel by completing the second bottom level at 59,000 with the double bottom formation in the double bottom formation, passed the resistance levels of 0.236 and 0.382 levels, respectively, and encountered resistance at the 0.5 level. The price, which tested the major trend line by retreating towards the 0.382 level at the weekend, failed to break this line and managed to stay above it. BTC, which started a new bullish move this morning, tested above Fibonacci 0.618 (63,932), but retreated back towards this level. Hourly closes above this level may target the resistance level of 0.786 (65,061) as BTC continues its upward movement towards positive territory. As a matter of fact, “short” transactions clustered between 64,750 and 65,000 levels stand out on the weekly liquidation map. In case of a possible pullback, 0.5 (63,139) will appear as the new support level.
Supports 63,932 – 63,139 – 62,346
Resistances 65,061 – 66,076 – 67,000
ETH/USDT
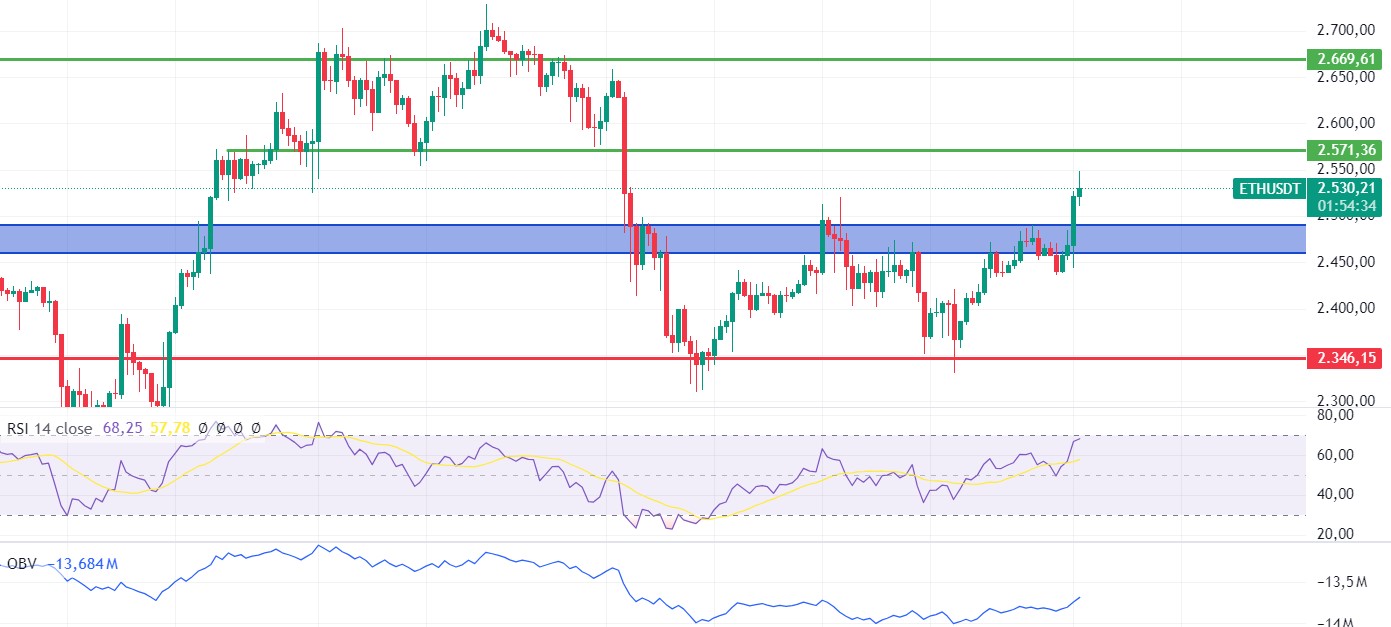
Ethereum experienced a voluminous rise in the morning hours after the weekly close, breaking through the resistance zone between 2,490 and 2,510. A W pattern structure first appears on the chart. Provided that it does not close below 2,490, the target of this pattern can be stated as the 2,640 level. Considering the positivity in RSI and OBV, we can see that the rise continues up to 2,571 resistance levels during the day. OBV and CMF also seem to support this structure. However, in addition to all these, closures below the 2,490 level may delay the bullish scenario again and bring declines to 2,460 levels.
Supports 2,490 – 2,460 – 2,400
Resistances 2,571 – 2,669 – 2,815
LINK/USDT
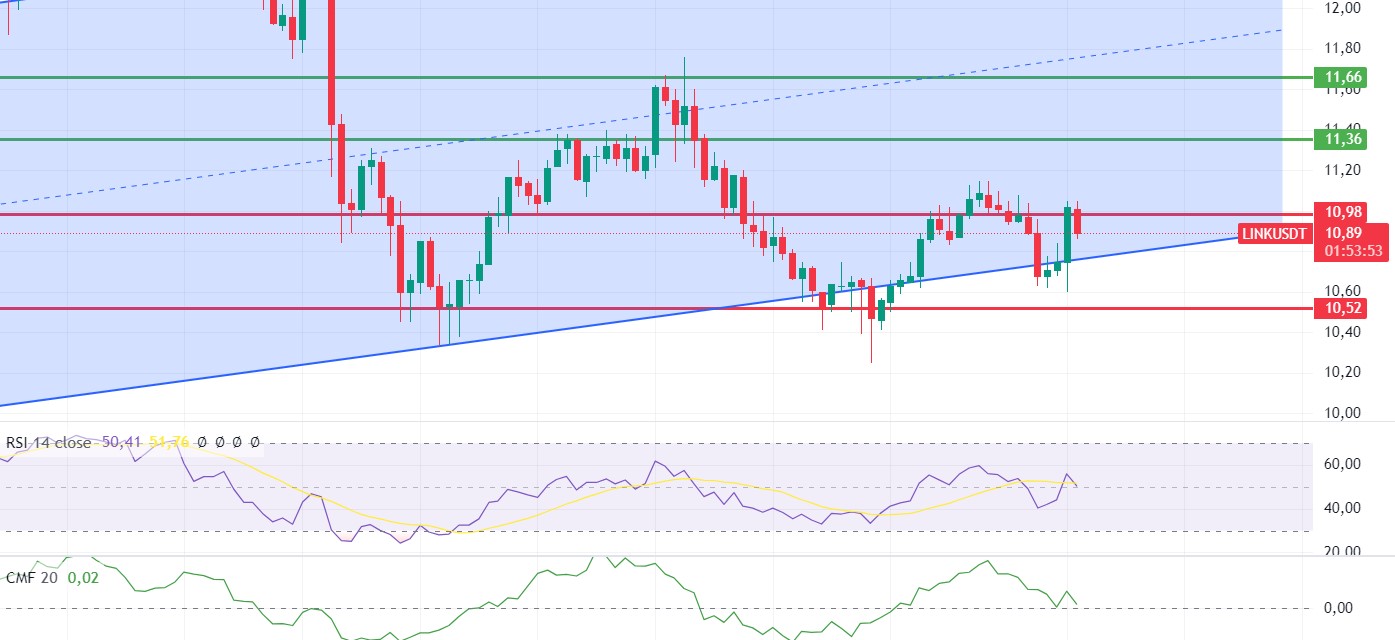
The negative mismatch scenario in RSI, which we mentioned in the Friday evening analysis for LINK, triggered a decline and then rose again to 10.98 resistance. At these levels, it can be said that it may be beneficial for investors to pay attention for a while due to the RSI level looking down again and the significant declines in CMF. The voluminous break of the 10.98 level may provide a continuation of the rise up to 11.36 levels. If it cannot get support from here, the decline may continue until 10.52 levels.
Supports 10.52 – 10.17 – 9.89
Resistances 10.98 – 10.36 – 11.66
SOL/USDT
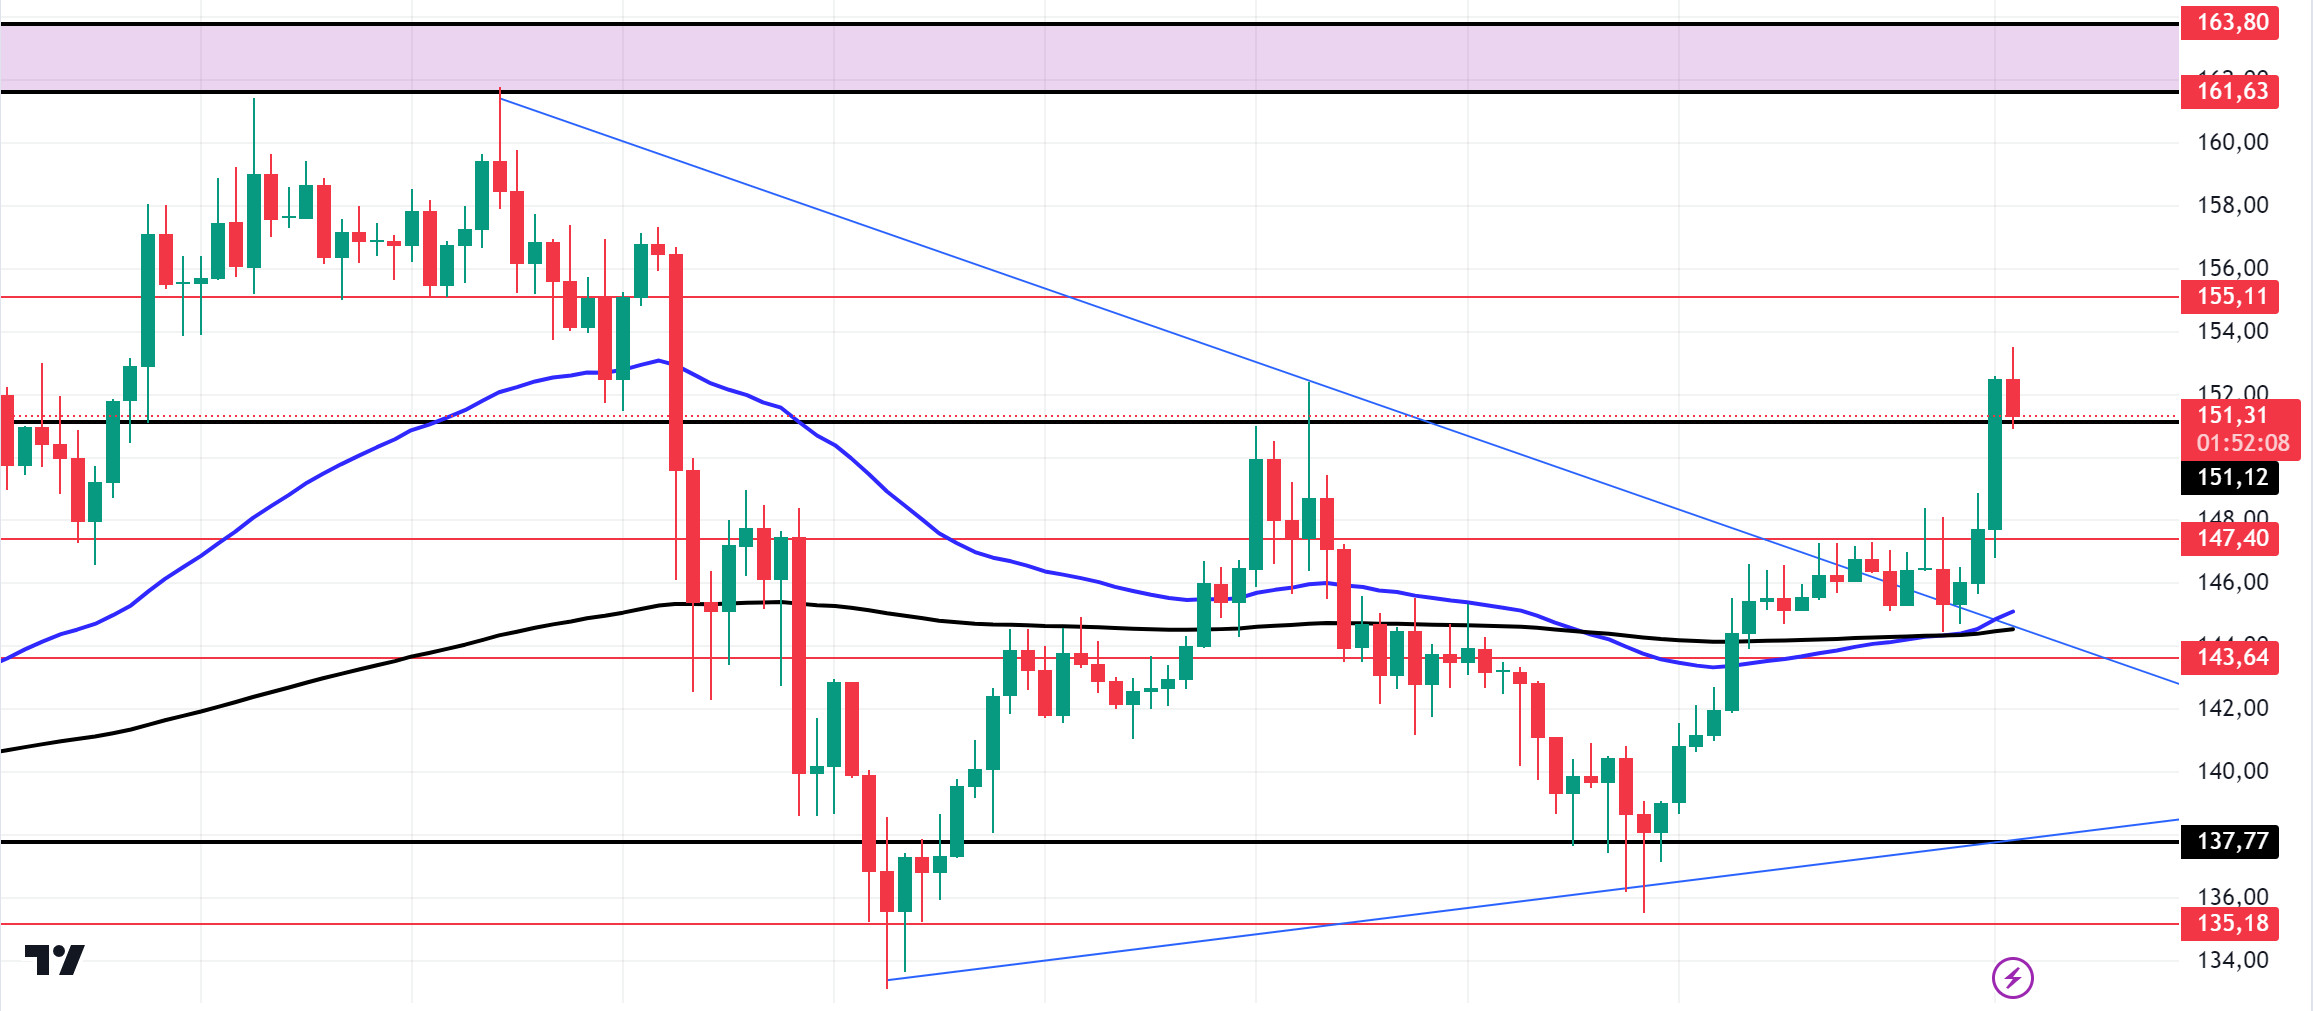
Following the geopolitical tensions in the Middle East, SOL continued to price in its consolidation zone. Solana’s Long/Short ratio on the 24-hour timeframe stands at 1.0751 as of press time. This indicates that long position holders have taken over the market. According to data from IntoTheBlock, Solana active addresses saw a sudden spike from 3 million to 3.47 million, an increase of 15. This increase indicates increased user activity and engagement within the network. According to the latest data, the amount of SOL locked in Solana’s DeFi ecosystem has reached 36 million SOL. This is the highest level ever recorded. At current prices, this amounts to approximately $5.5 billion. Solana surpassed the 50 EMA 200 EMA on the 4-hour timeframe, signaling a potential bullish breakout. This rise also means that it broke the symmetrical triangle pattern to the upside. A decisive break of the 151.12 level can be expected to confirm a significant bullish trend. The 151.12 level is a strong resistance point in the uptrend driven by both macroeconomic conditions and innovations in the Solana ecosystem. If it rises above this level, the rise may continue. In the sales that investors will make due to political and macroeconomic conditions, the 137.77 support level, which is the place of retreat, should be followed. If the price comes to these support levels, a potential bullish opportunity may arise.
Supports 147.40 – 143.64 – 137.77
Resistances 151.12 – 155.11 – 161.63
ADA/USDT
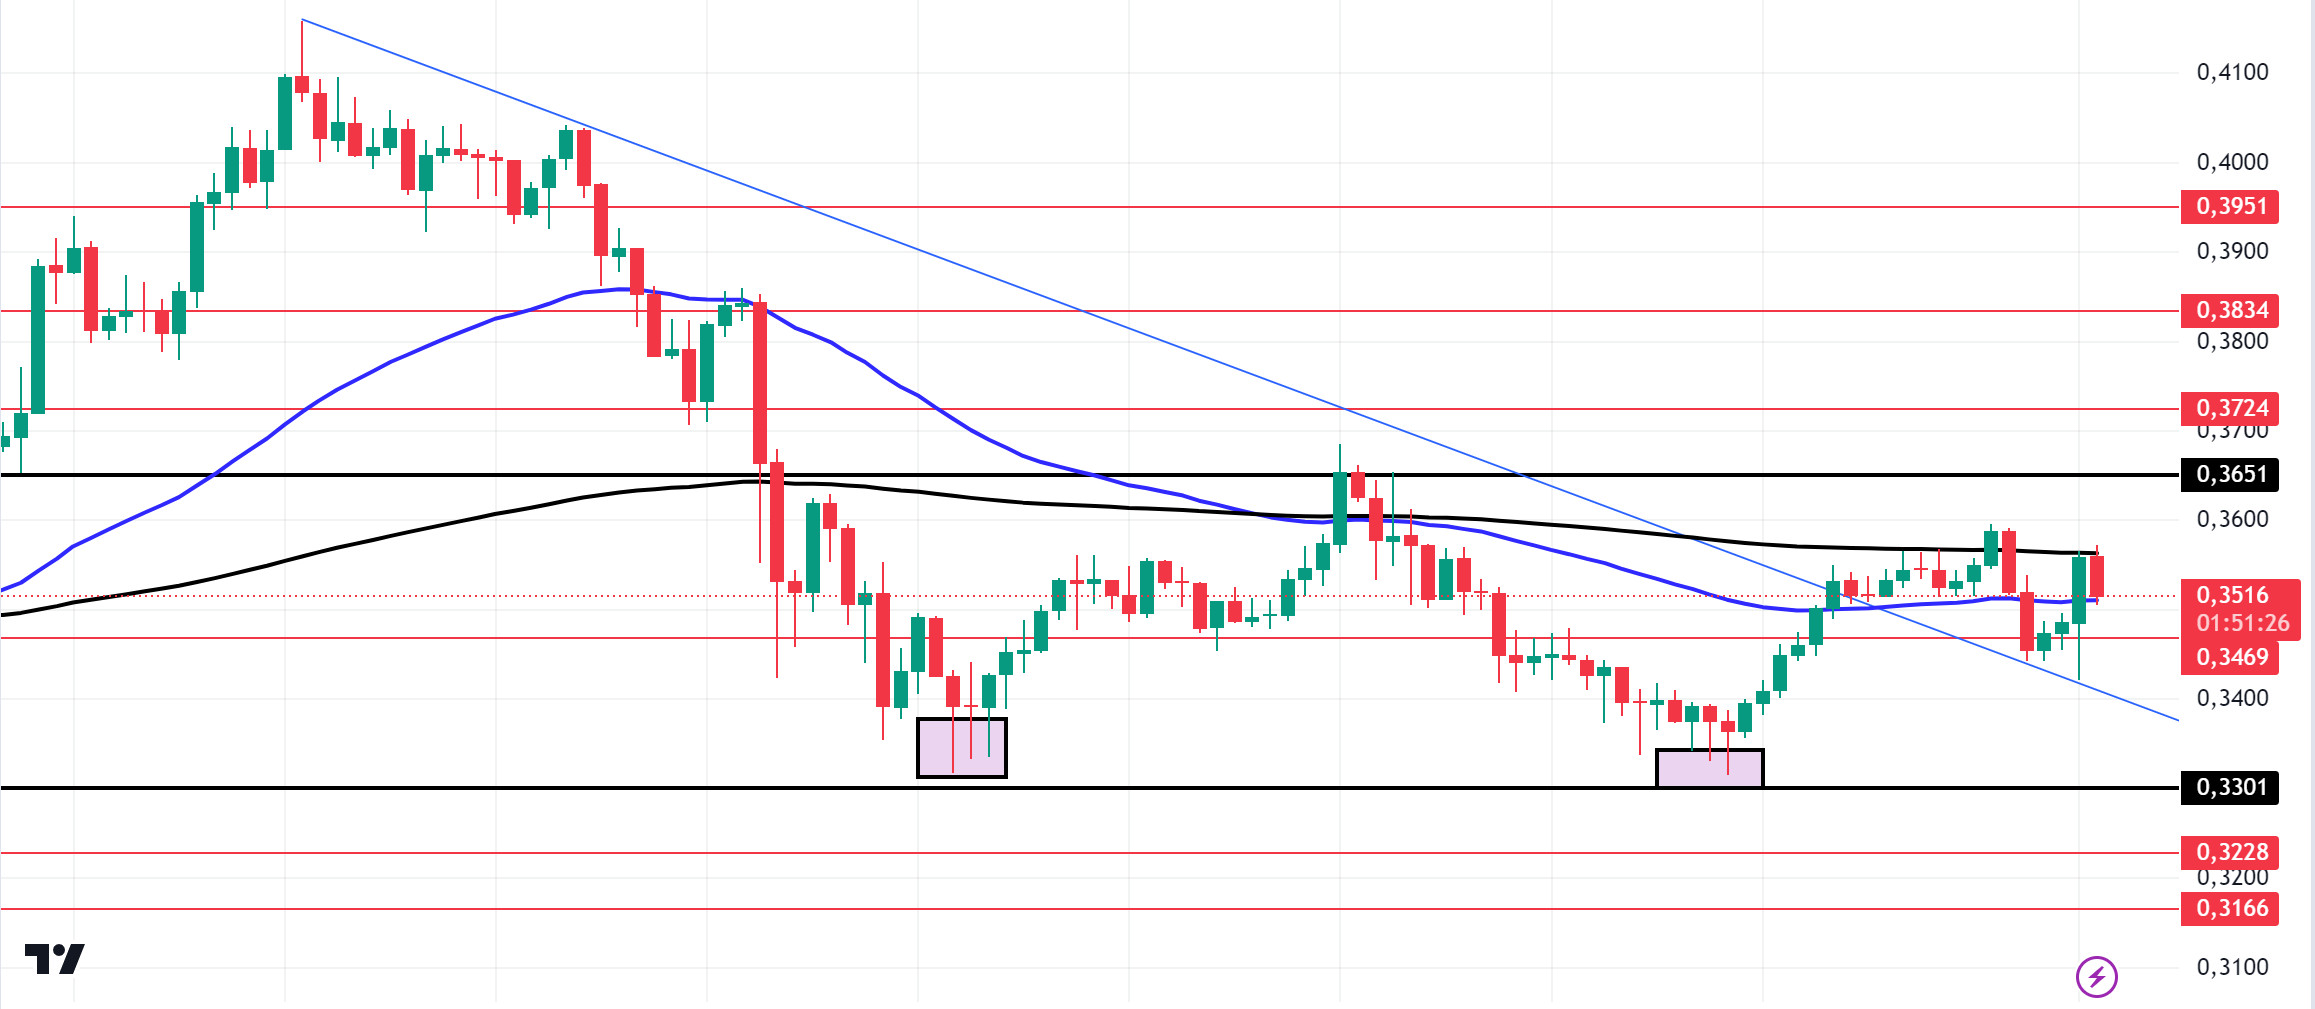
Open interest in ADA increased, reaching $224.33 million. This steady increase in interest suggests that investors are optimistic about ADA’s potential to break the 0.4000 resistance. In addition, the gradual increase in open interest sets the stage for an upside move. However, investors are waiting for stronger signals. According to IntoTheBlock’s data, a $6 billion ADA move took place. Such movements mean that big players, which we call whales, come on the scene. Technically, on the 4-hour chart, the downtrend that started on September 27 was broken by whale movements and seems to have received support from the downtrend level. This could be a bullish sign. On the other hand, the 50 EMA continues to hover below the 200 EMA. More signals may be needed for bullishness. However, a double bottom is confirmed on our chart. If money flows continue to increase and macroeconomic data is positive for cryptocurrencies, the rise may continue. If the money flow decreases and macroeconomic data is unfavorable for cryptocurrencies, 0.3301 is a strong support point and can be followed as a good place to buy.
Supports 0.3469 – 0.3301 – 0.3228
Resistances 0.3651 – 0.3724 – 0.3834
AVAX/USDT
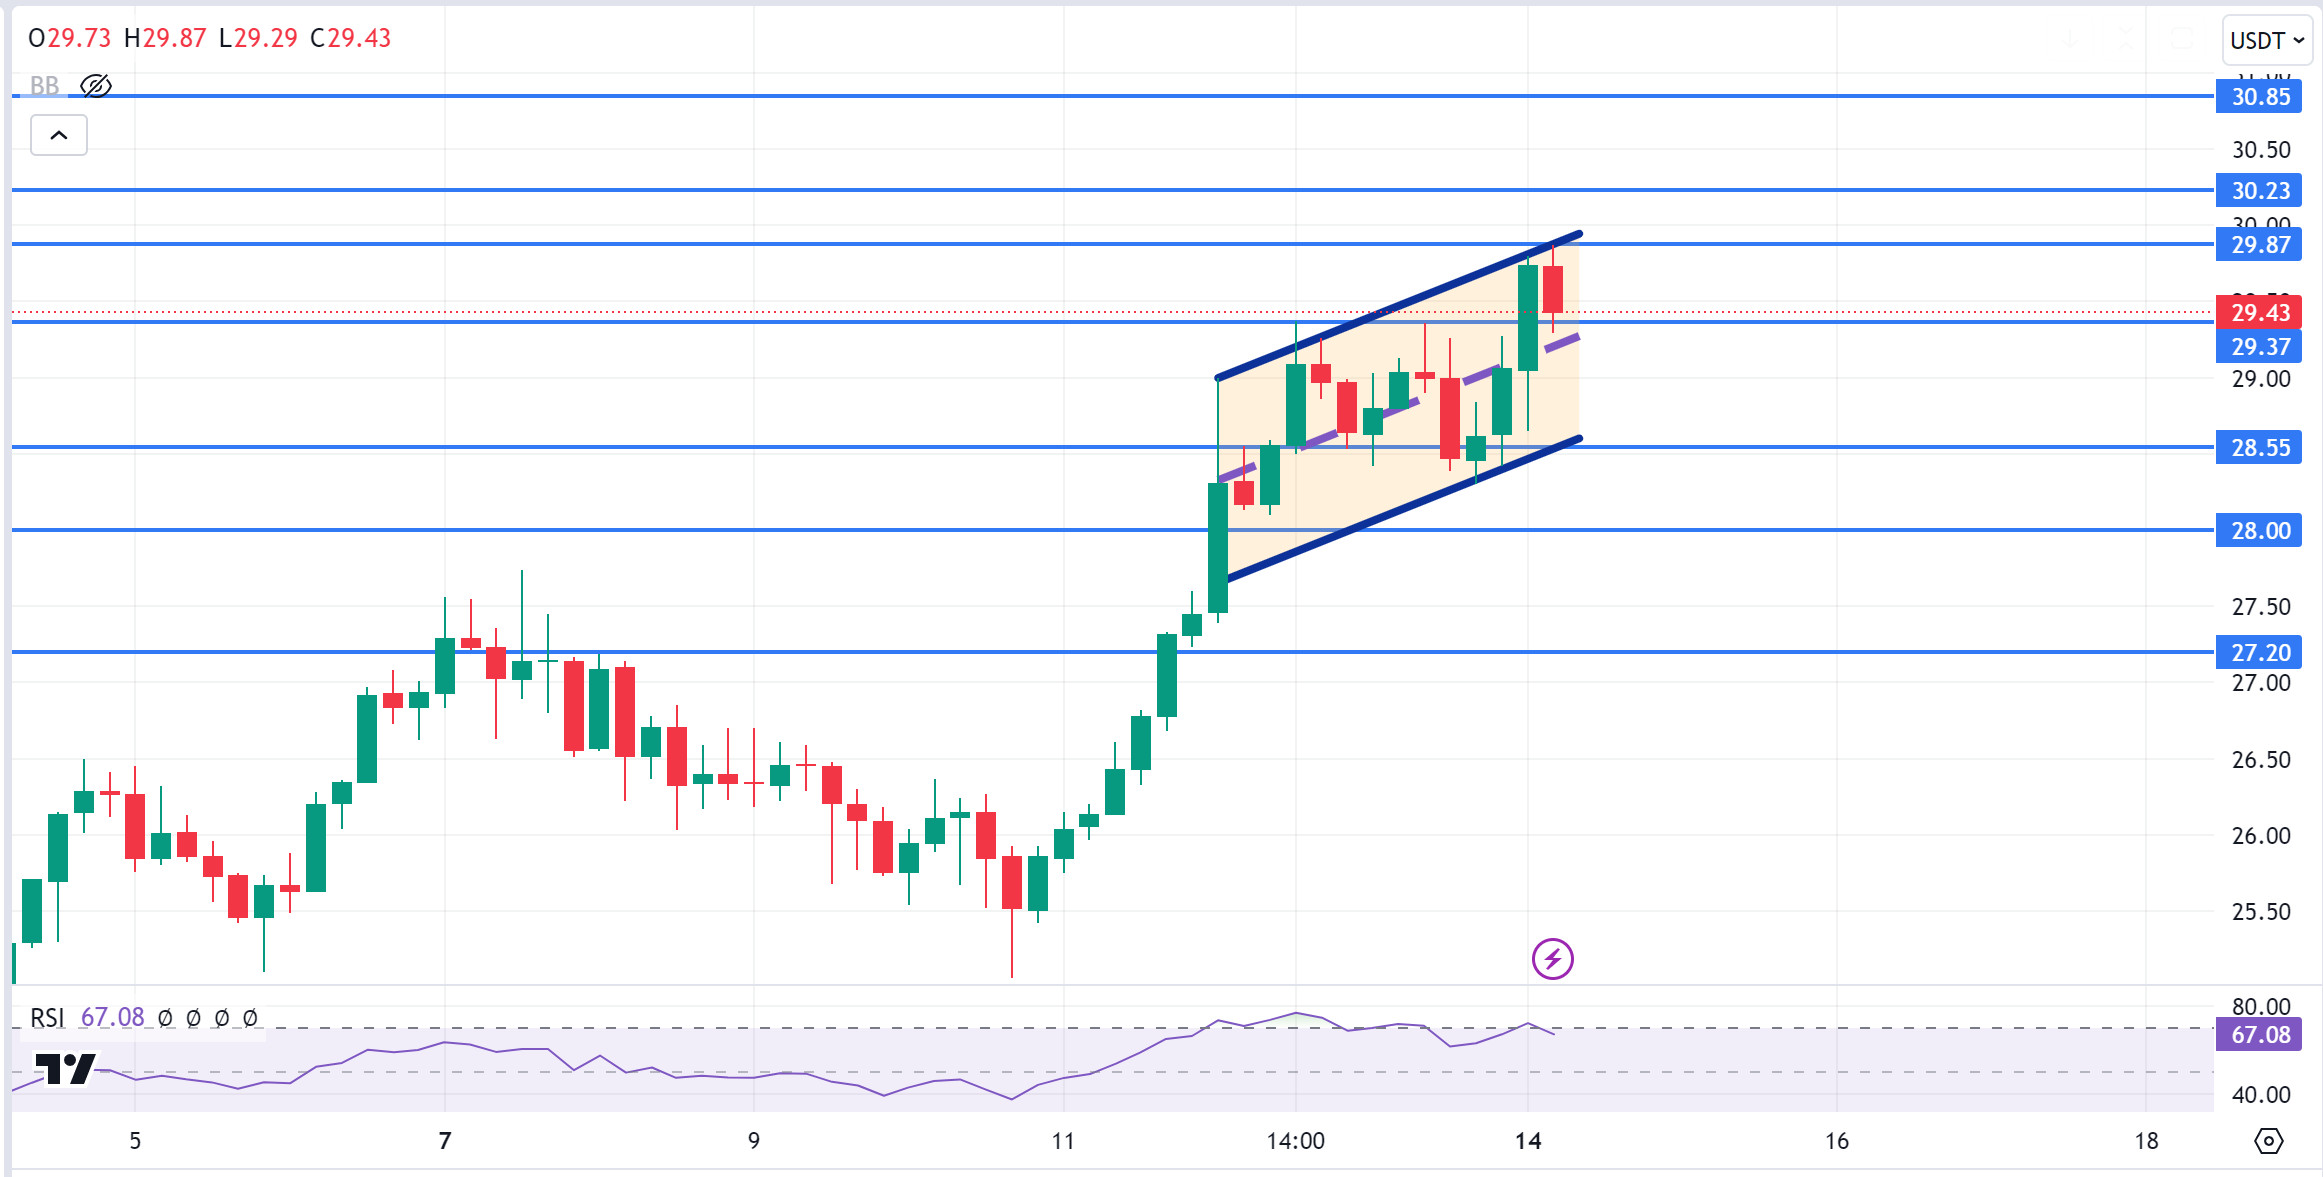
AVAX, which opened yesterday at 28.63, rose 1.5% during the day and closed the day at 29.06. Today, there is no planned data to be announced especially by the US and expected to affect the market. For this reason, it may be a low-volume day where we may see limited movements. News flows from the Middle East will be important for the market.
AVAX, currently trading at 29.43, is moving in the middle band of the rising channel on the 4-hour chart. The RSI is very close to the overbought zone with a value of 67 and can be expected to move to the lower band from here. In such a case, it may test 28.55 support. In case of positive news that the tension in the Middle East is decreasing, purchases may increase. In such a case, it may test 29.87 resistance. As long as it stays above 24.65 support during the day, the desire to rise may continue. With the break of 24.65 support, sales may increase.
Supports 29.37 – 28.55 – 28.00
Resistances 29.87 – 30.23 – 30.85
TRX/USDT
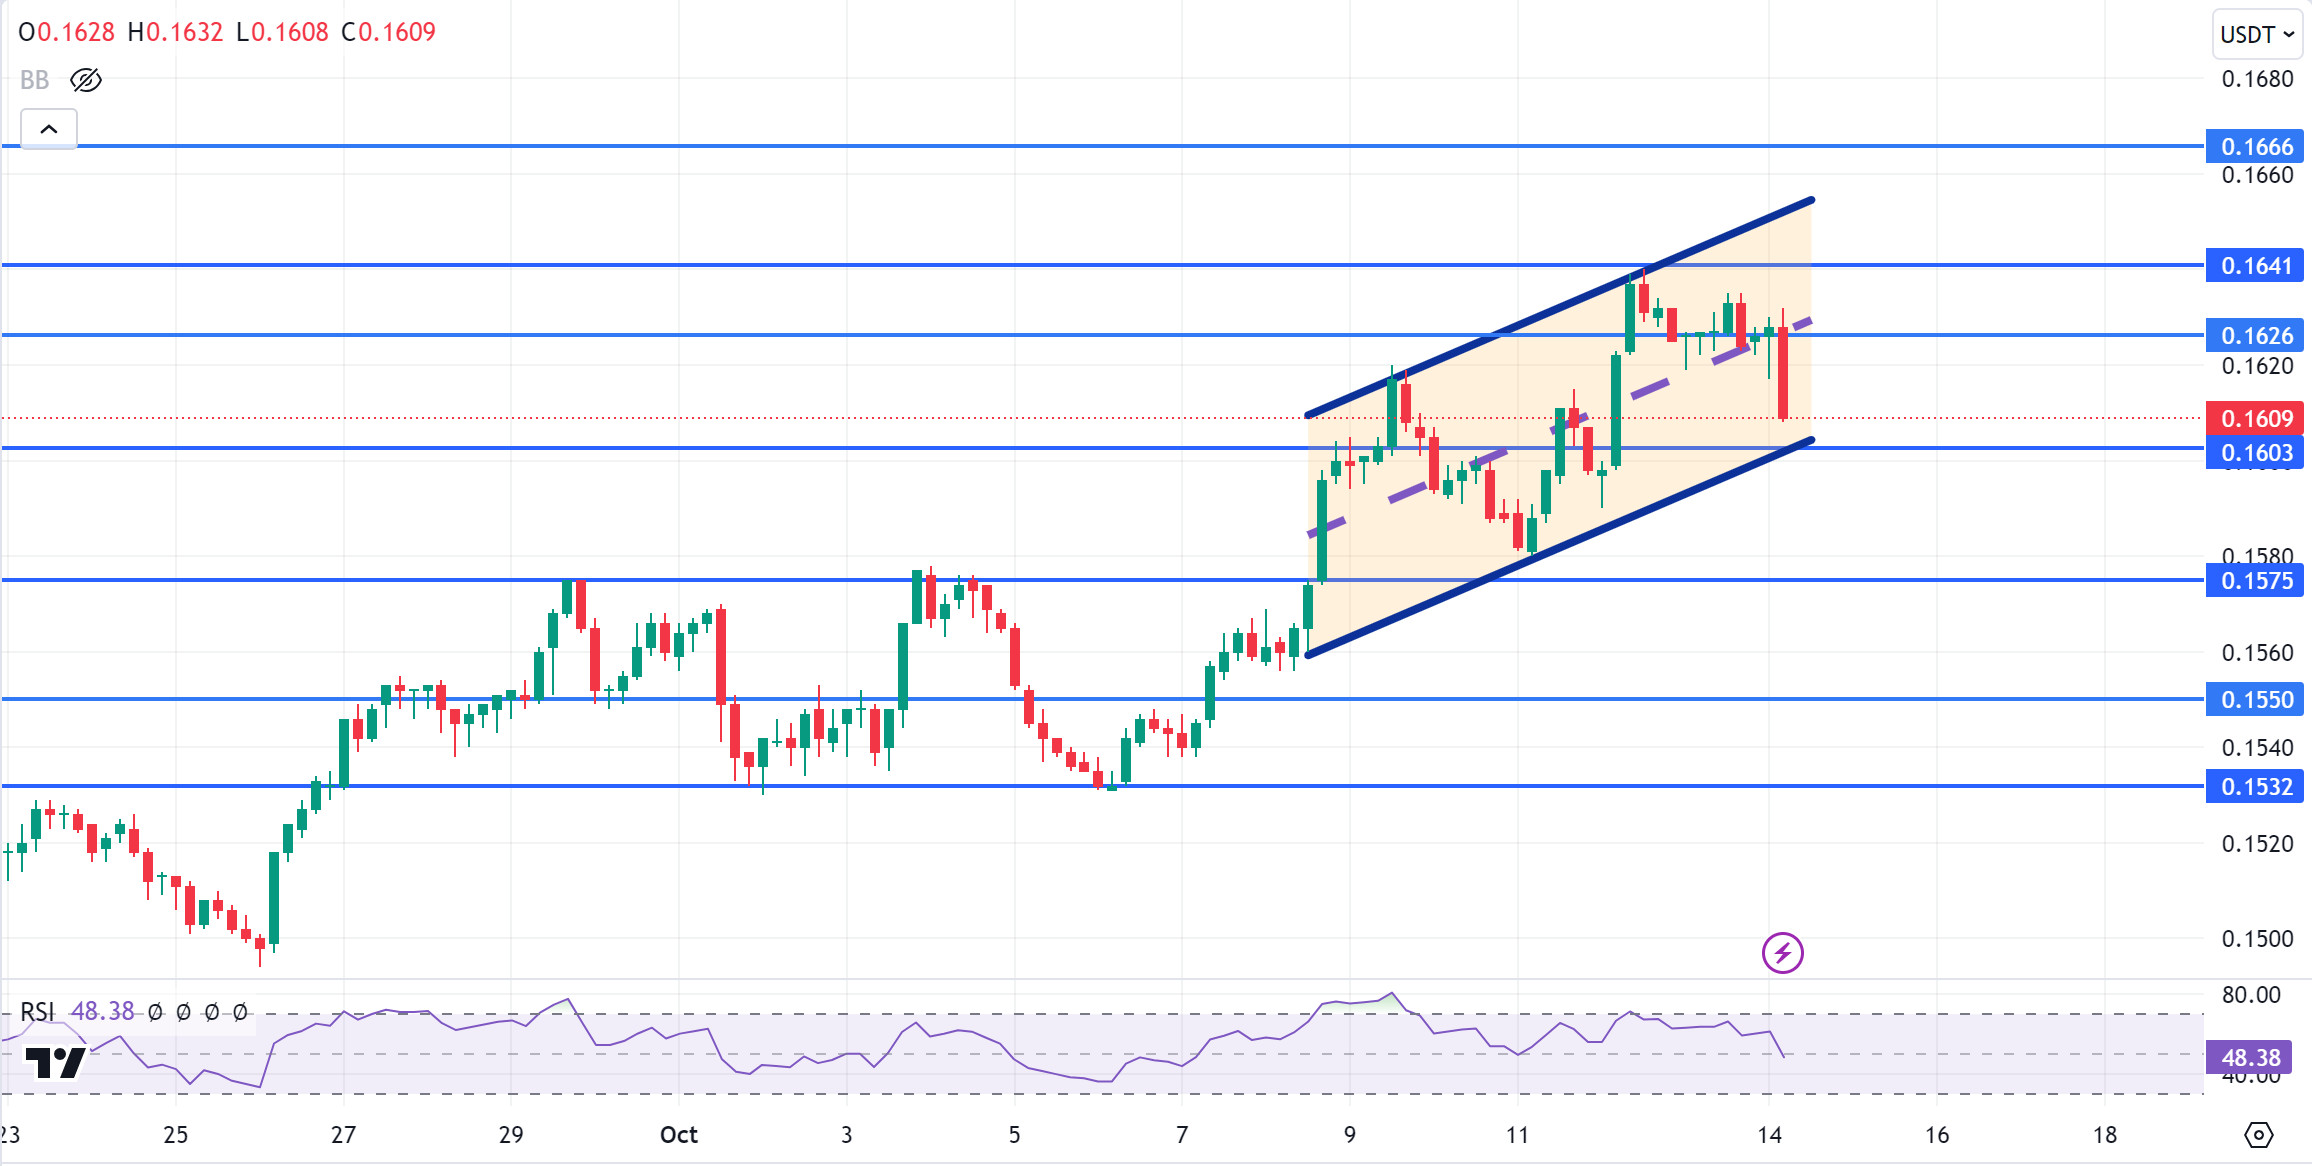
TRX, which started yesterday at 0.1626, moved horizontally during the day and closed the day at 0.1626. There is no planned data for the market to follow today. The market will be closely following the news flows regarding the tension in the Middle East.
TRX, currently trading at 0.1609, is moving within the ascending channel on the 4-hour chart. It is in the lower band of the ascending channel and can be expected to rise slightly from its level with the RSI 48 value. In such a case, the channel may move to the middle band and test the 0.1626 resistance. However, if it cannot close the candle on 0.1626 resistance, it may test 0.1603 support with the selling pressure that may occur. As long as TRX stays above 0.1482 support, the desire to rise may continue. If this support is broken downwards, sales can be expected to increase.
Supports 0.1603 – 0.1575 – 0.1550
Resistances 0.1626 – 0.1641 – 0.1666
XRP/USDT
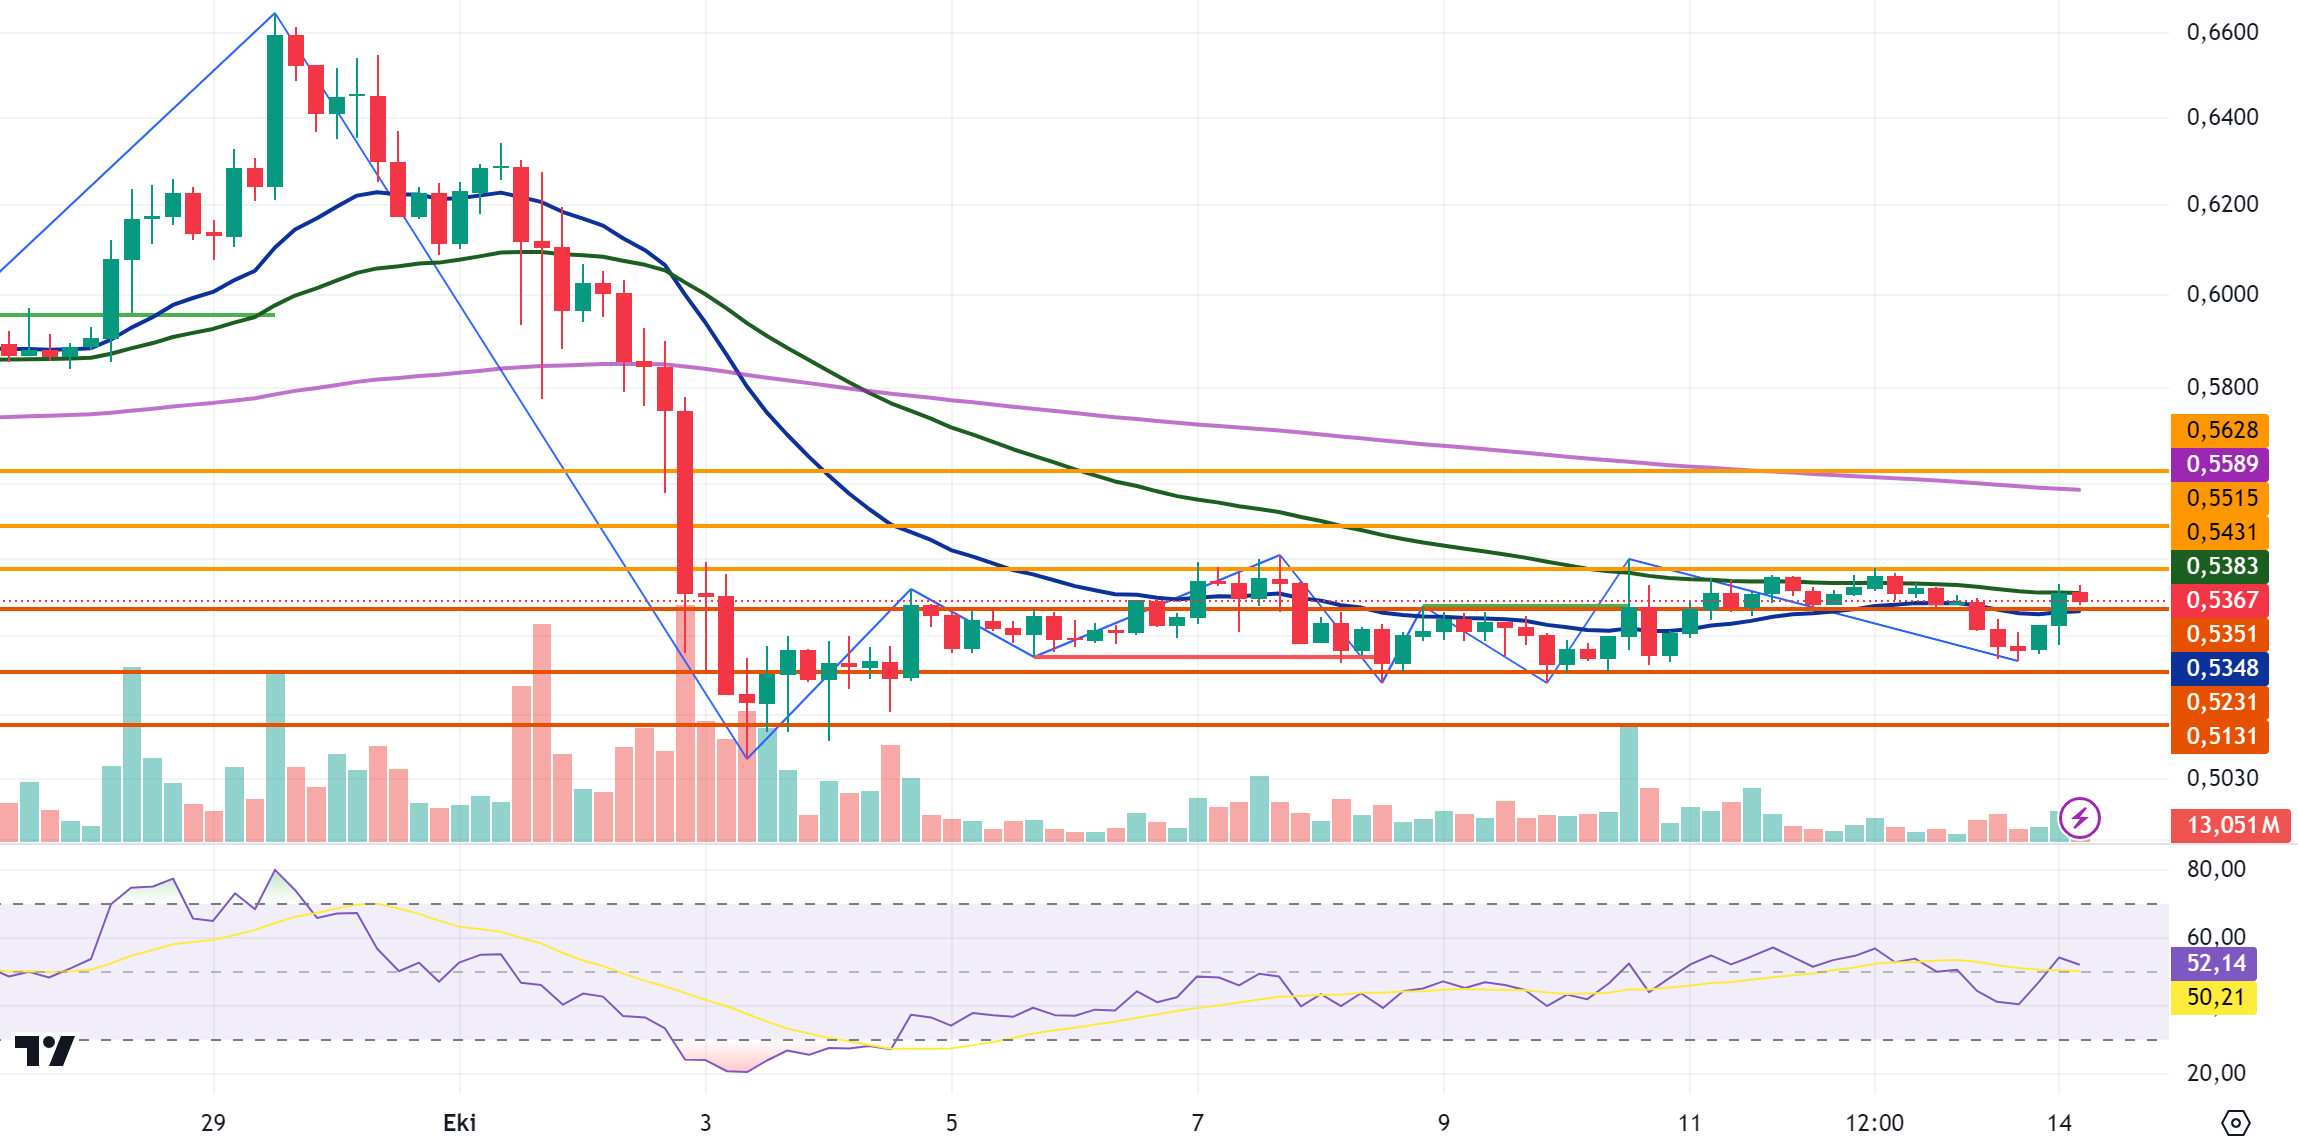
While XRP was trading in a horizontal band between EMA50 and EMA20 levels in the 4-hour analysis, it broke the EMA20 level with the decline it experienced yesterday and fell to the support level of 0.5231. The daily close in XRP, which recovered with purchases at this level, was realized at 0.5316. XRP, which started the new week with a decline, moved with the rising crypto market after the opening of Asian exchanges and rose to 0.5391. In the 4-hour analysis, after rising up to the EMA50 level, it fell with the sales here. It is currently trading at 0.5367 in a horizontal band between the EMA50 and EMA20 levels. If XRP retests and breaks the EMA50 level, which it has tested twice in the 4-hour analysis today, and continues its rise, it may test the resistance levels of 0.5351-0.5431-0.5515 with its rise. If the EMA50 level cannot be broken and the EMA20 level is broken downward with the sales that may follow, it may test the support levels of 0.5231-0.5131-0.5033 with the deepening of the decline.
The RSI data for XRP is in the neutral zone and may continue to move within a horizontal band in this process. On behalf of the crypto market, the Asian market started the new week positively and the effect of this was also seen on XRP. Apart from this situation, in this process, where there are no positive or negative developments in XRP, it may experience momentary declines and rises within the horizontal band and may offer short-term trading opportunities.
EMA20 (Blue Line) – EMA50 (Green Line) – EMA200 (Purple Line)
Supports 0.5231 – 0.5131 – 0. 5033
Resistances 0.5351 – 0.5431 – 0.5515
DOGE/USDT
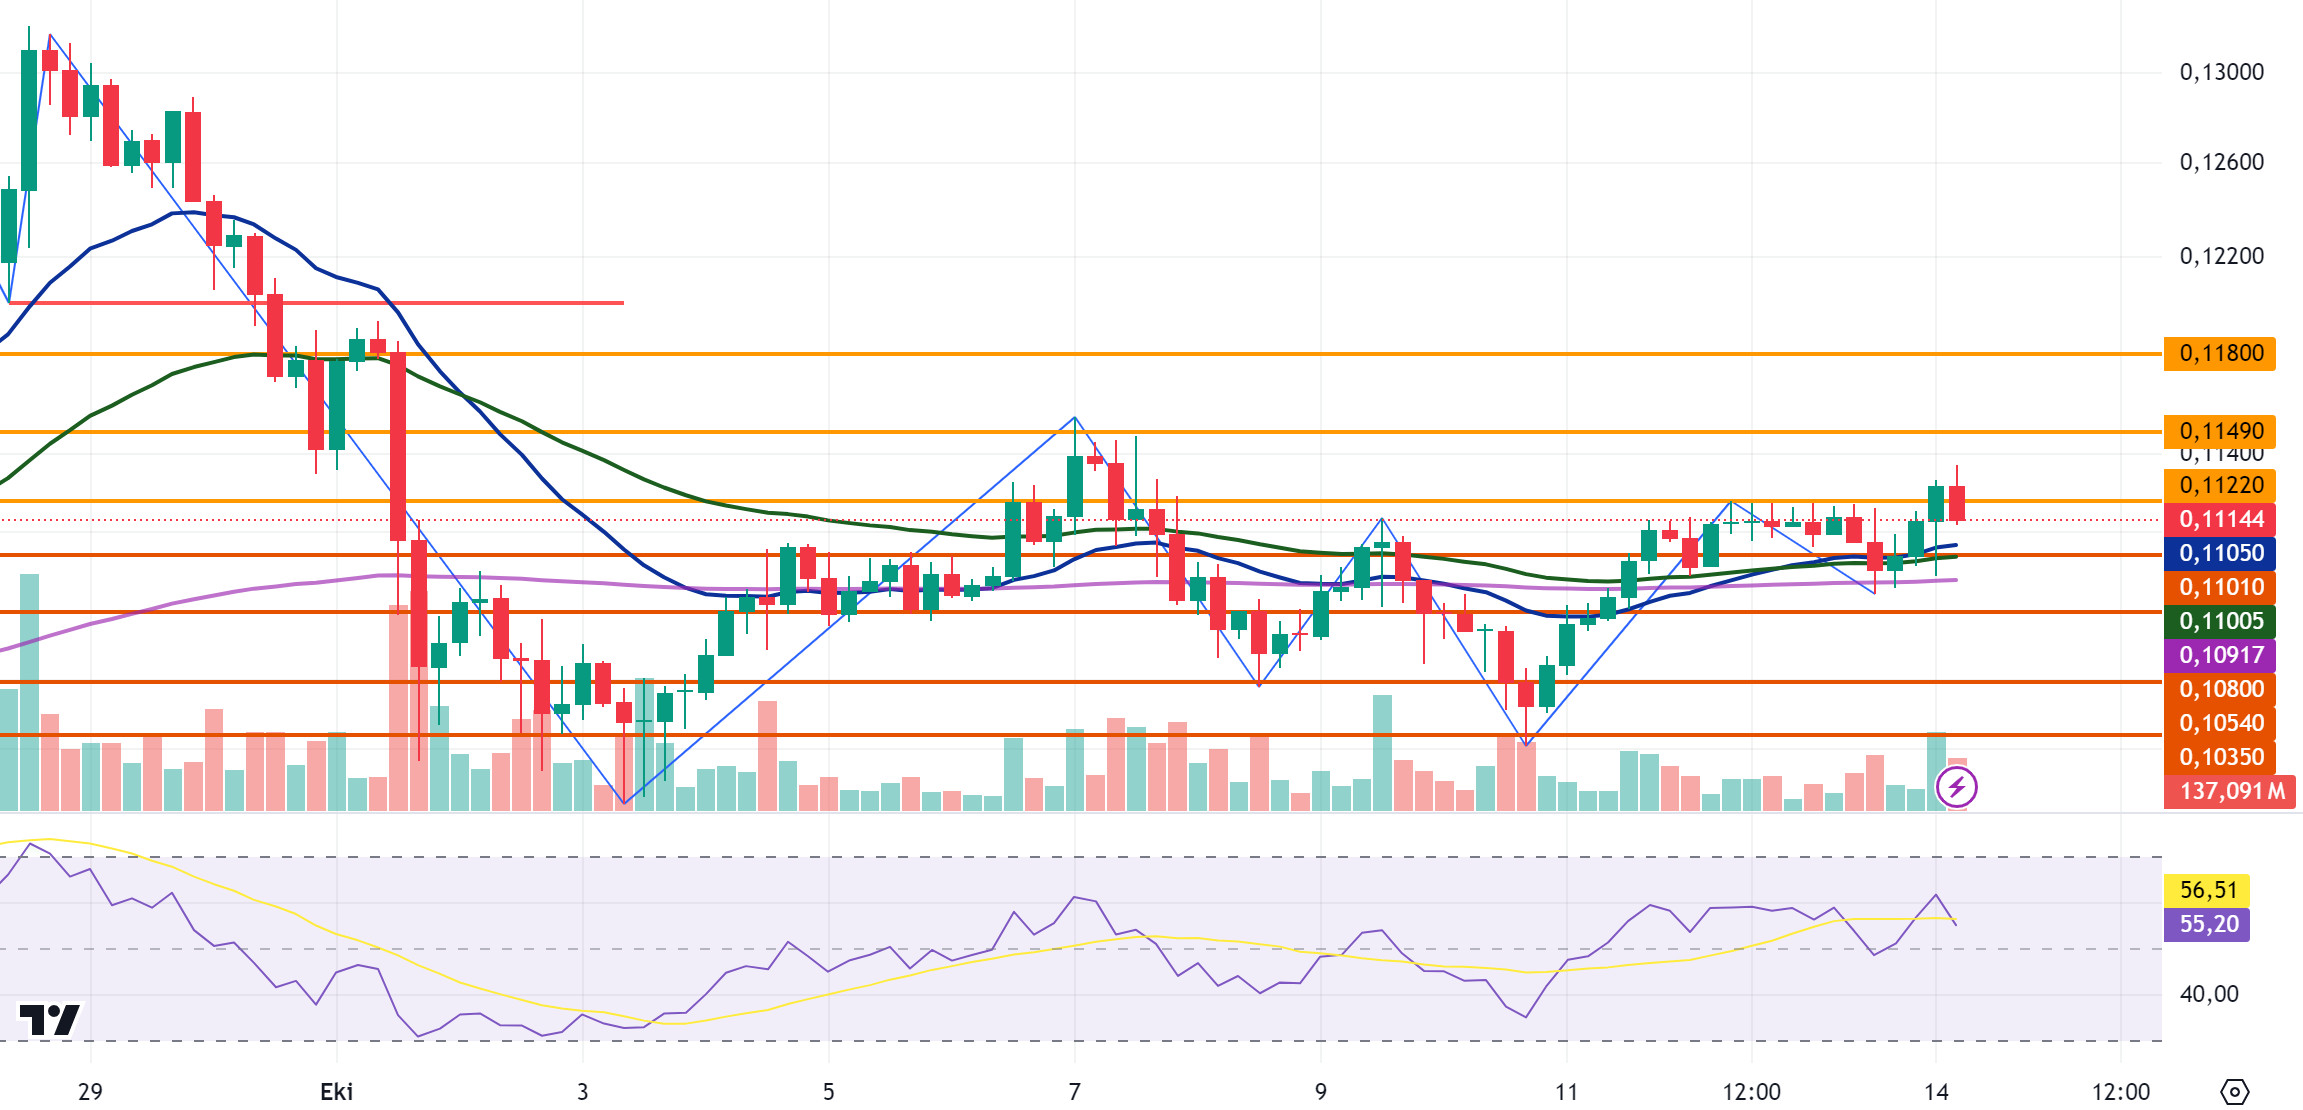
In the 4-hour analysis, DOGE was trading in a horizontal band between 0.1122 and 0.1101 levels in the 4-hour analysis, while it fell to 0.1086 with the decline it experienced yesterday, and then started to rise with the purchases coming after it fell to 0.1086. The daily close in DOGE, which returned to the horizontal band, was realized at 0.1113. In the 4-hour analysis, DOGE, which experienced a decline in the opening candle today, fell as low as 0.1092, then rose with the incoming purchases and rose as high as 0.1130. It is currently trading at 0.1114 at the start of the new week. DOGE, which rose with the purchases after yesterday’s decline, is above the EMA levels and may test the resistance levels of 0.1122-0.1149-0.1180 if the rise continues with the purchases that may come. With the decline, it may test the support levels of 0.1101 and 0.1080-0.1054 in the continuation of the decline if the EMA20 and EMA50 levels are broken.
The positive opening of Asian markets on behalf of the crypto market caused an increase in DOGE. There is currently no positive or negative development in DOGE, which moves in parallel with the crypto market, and in this process, DOGE may move within a horizontal band. In the rises that may come within its levels, it may decline with the sales that may come between 0.1122 and 0.1149 levels and may offer a short trading opportunity. In its decline, it may rise with the purchases that may come at the EMA200 and 0.1080 support level and may offer a long trading opportunity.
EMA20 (Blue Line) – EMA50 (Green Line) – EMA200 (Purple Line)
Supports 0.1101 – 0.1080 – 0.1054
Resistances 0.1122 – 0.1149 – 0.1180
DOT/USDT
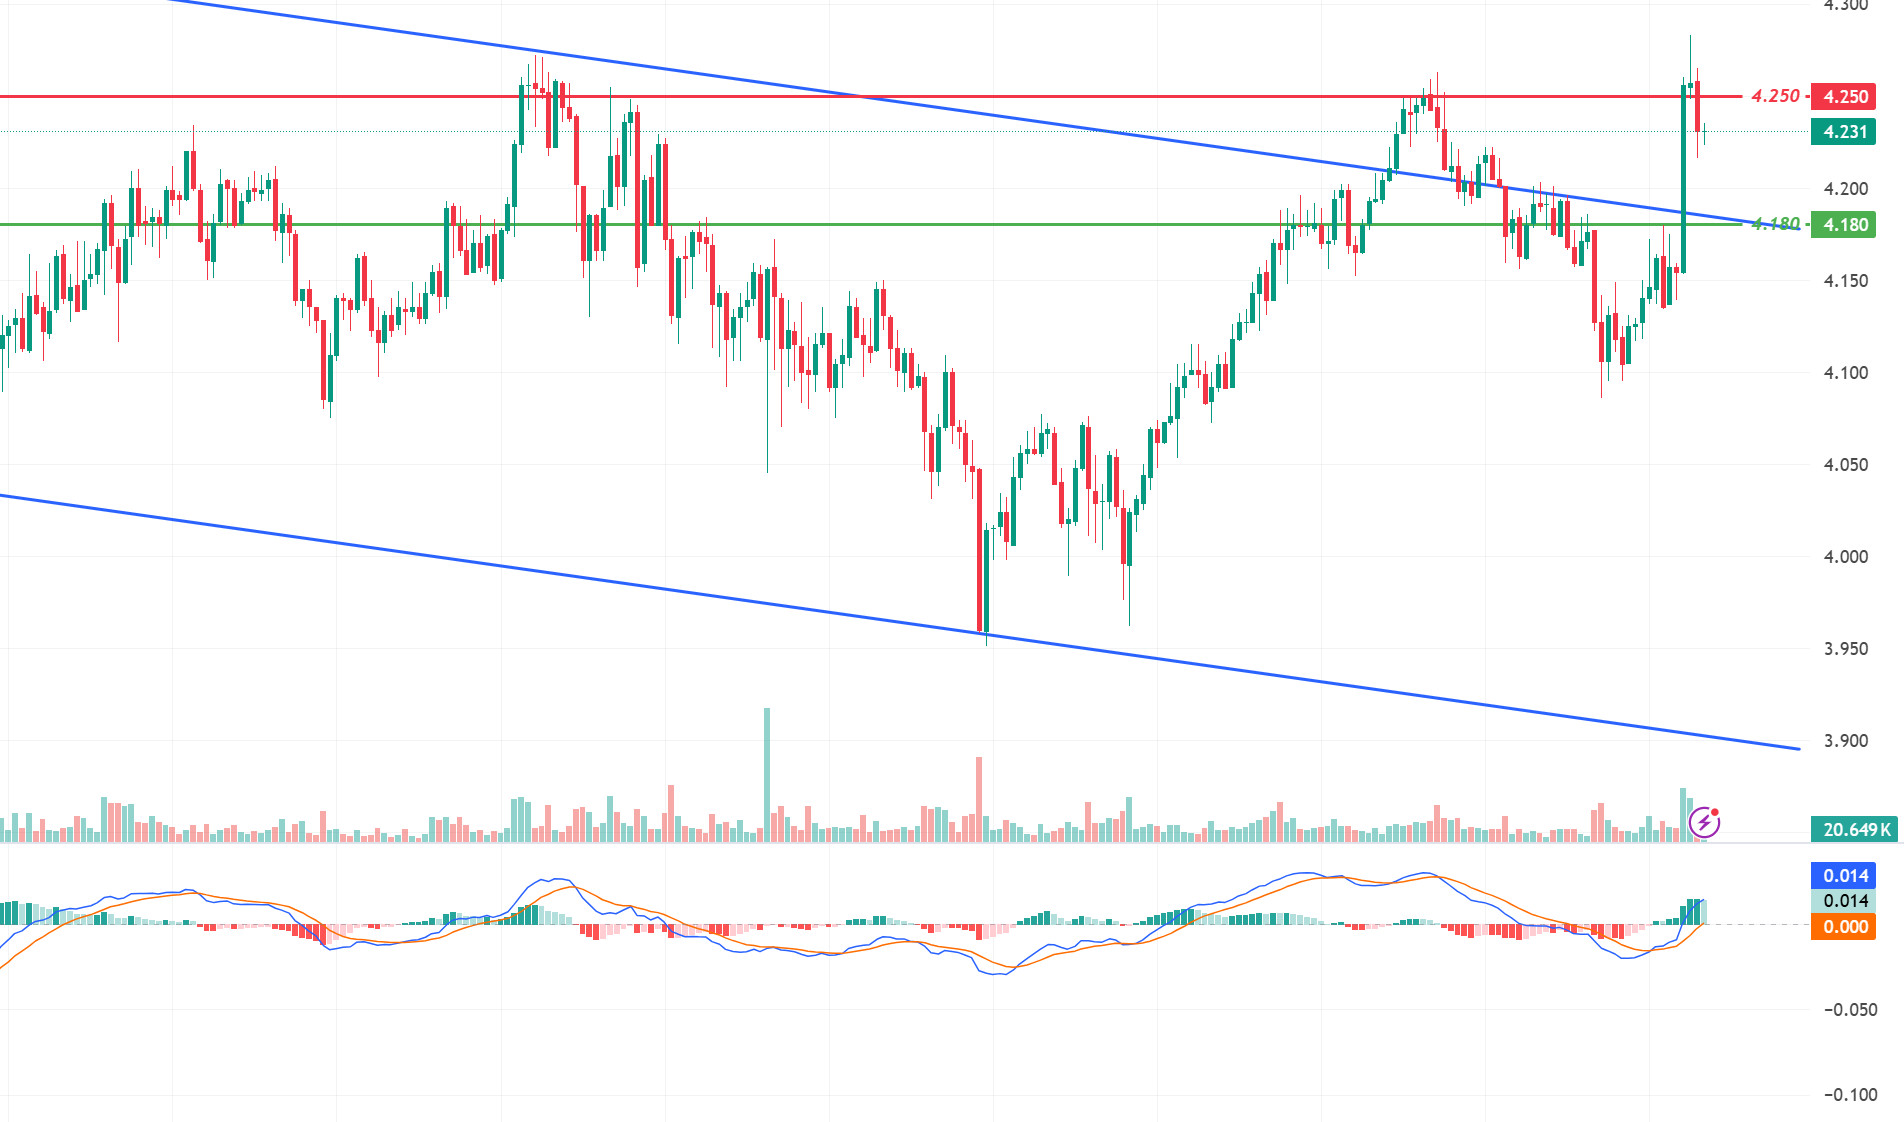
Polkadot (DOT), which rose with the trend breakout, received a reaction from the 4,250 resistance level. Polkadot, which rallied up to the 4,250 resistance level with the breakout of the descending channel, retreated slightly from the 4,250 resistance level. According to the MACD oscillator, the buying pressure seems to have decreased compared to the previous hour. In this context, the price may make a correction towards 4,180 levels. On the other hand, if the buying pressure continues, we may see a rise towards 4,315 levels.
Supports 4.210 – 4.180 – 4.080
Resistances 4.250 – 4.315 – 4.380
SHIB/USDT
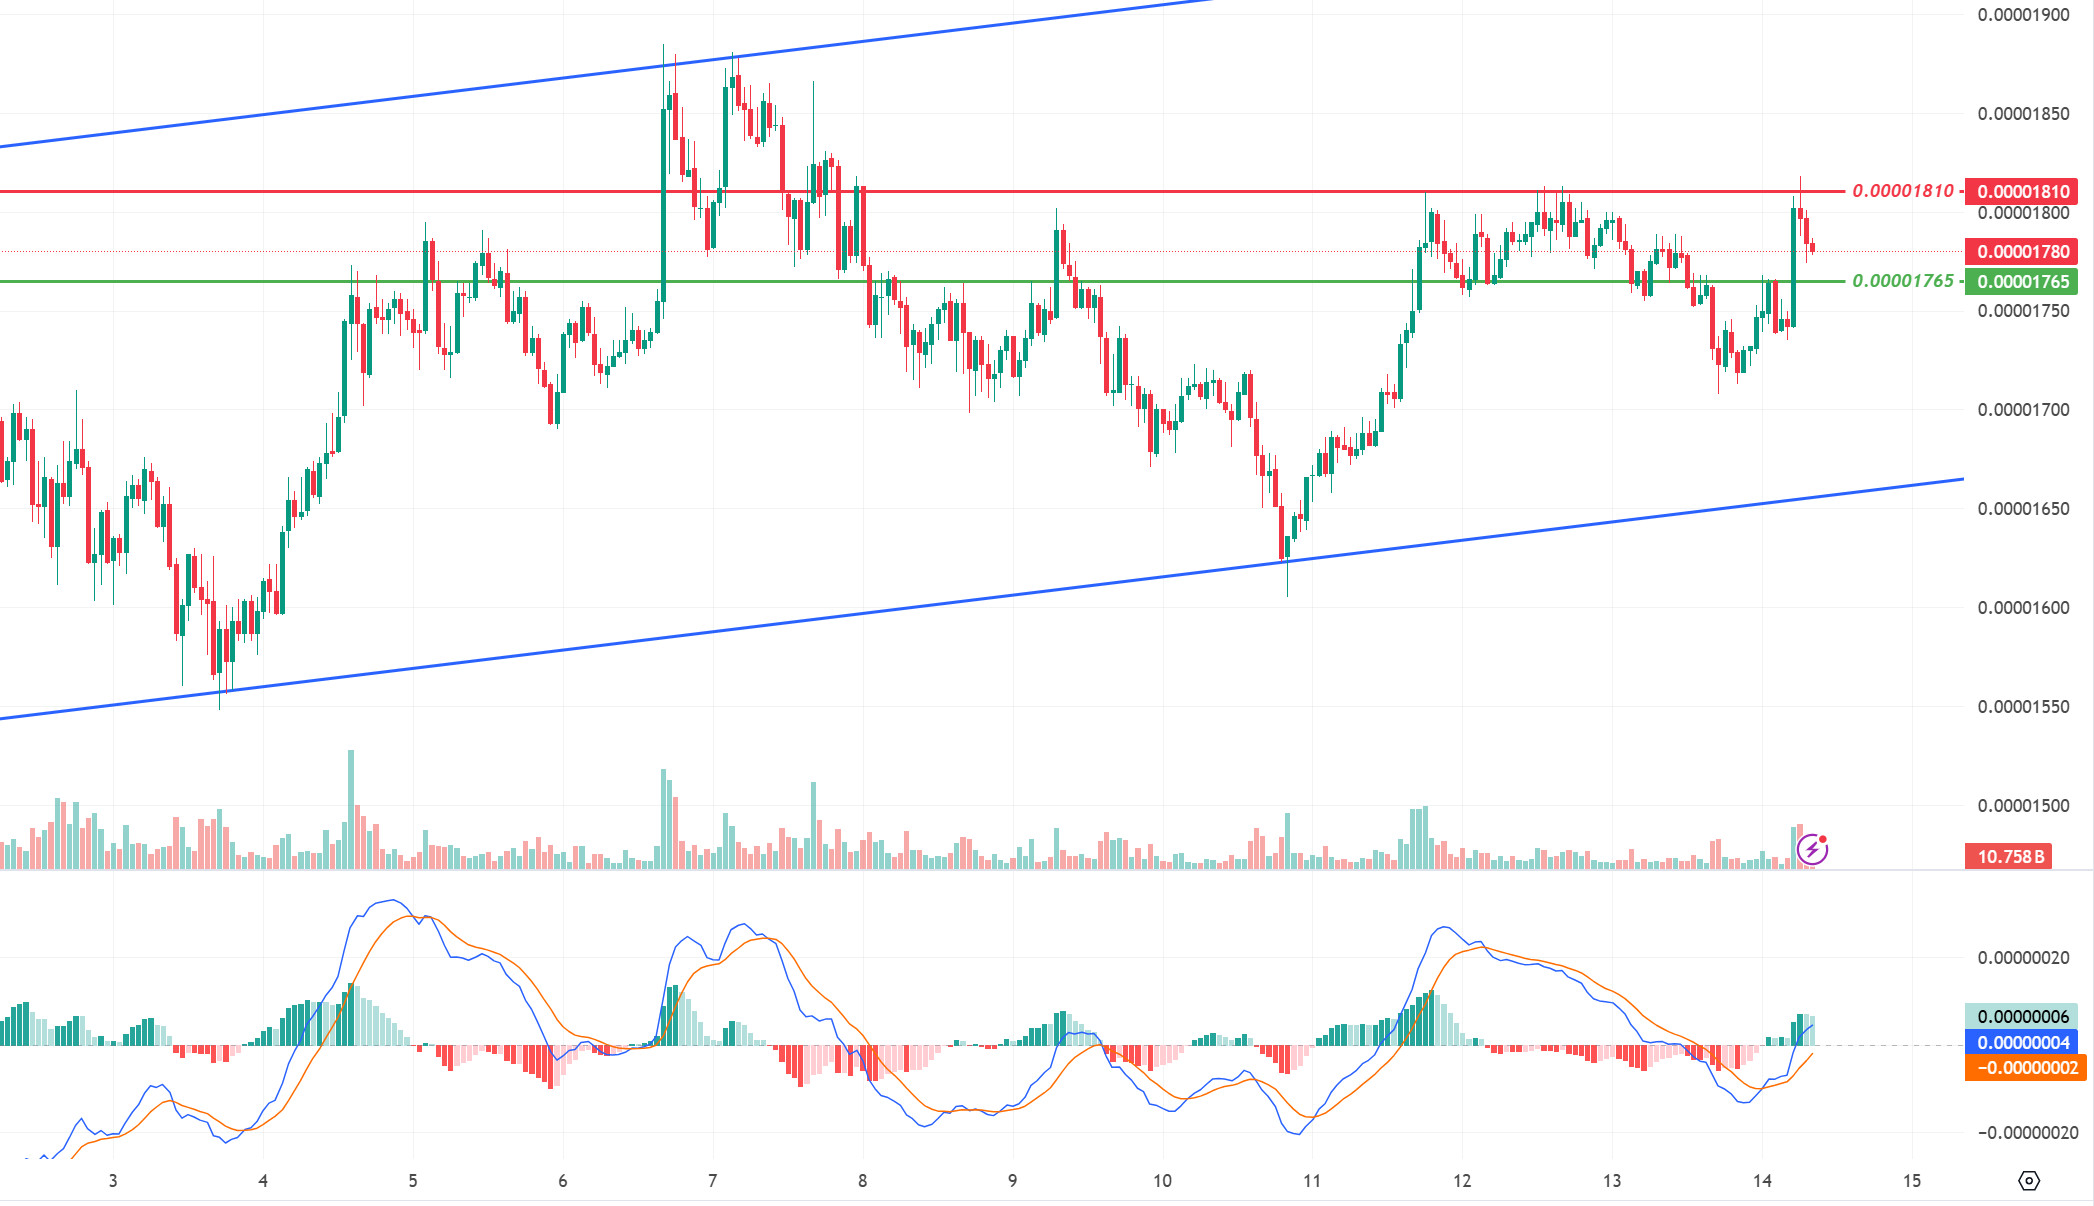
Shiba Inu (SHIB), which continued to rise with the reaction from the lower band of the ascending channel, sold at the 0.00001810 resistance level. The price, which received a reaction from the 0.00001810 resistance level, may be correcting this rise. When we examine the MACD oscillator, we can say that the buyer pressure has decreased compared to the previous hour. In this context, the price may retreat towards the 0.00001765 support level. On the other hand, if the price maintains above the 0.00001810 resistance level, we may see movements towards the upper bands of the rising channel.
Supports 0.00001765 – 0.00001690 – 0.00001630
Resistances 0.00001810 – 0.00001865 – 0.00001900
LEGAL NOTICE
The investment information, comments and recommendations contained herein do not constitute investment advice. Investment advisory services are provided individually by authorized institutions taking into account the risk and return preferences of individuals. The comments and recommendations contained herein are of a general nature. These recommendations may not be suitable for your financial situation and risk and return preferences. Therefore, making an investment decision based solely on the information contained herein may not produce results in line with your expectations.
