
MARKET SUMMARY
Latest Situation in Crypto Assets
| Assets | Last Price | 24h | Dominance | Market Cap |
|---|---|---|---|---|
| BTC | $61,218.00 | 0.53% | 56.45% | $1.21 T |
| ETH | $2,419.00 | 1.38% | 13.60% | $291.19 B |
| SOLANA | $142.47 | 2.63% | 3.12% | $66.90 B |
| XRP | $0.5360 | 0.97% | 1.42% | $30.34 B |
| DOGE | $0.1084 | 2.18% | 0.74% | $15.86 B |
| TRX | $0.1599 | 0.25% | 0.65% | $13.83 B |
| CARDANO | $0.3455 | 3.23% | 0.56% | $12.07 B |
| AVAX | $26.53 | 2.49% | 0.50% | $10.78 B |
| SHIB | $0.00001723 | 1.62% | 0.47% | $10.14 B |
| LINK | $10.71 | 2.16% | 0.31% | $6.72 B |
| DOT | $4.139 | 2.91% | 0.29% | $6.22 B |
*Prepared on 10.11.2024 at 14:00 (UTC)
WHAT’S LEFT BEHIND
Producer Price Index (PPI) in the US
While it remained unchanged on a monthly basis in September and realized below expectations, it increased by 1.8 percent on an annual basis, above the forecasts.
Bitcoin ETF issuer BlackRock
After the SEC paved the way for Bitcoin spot ETFs on January 10, BlackRock, which received the most investment in this product, increased the total value of assets under management to $ 11.5 trillion in the third quarter. The company’s fund investment of $221 billion last quarter was also the highest in its history.
Financial world awaits news from China
In order to meet its 2024 growth targets, China has been announcing economic stimulus packages in recent weeks, and an important press conference will be held tomorrow. The country’s finance minister is expected to announce a new economic stimulus package of up to 2 trillion yuan. The realization of the expectations may move Chinese and US stocks up along with cryptocurrencies.
Whales collected 1.5 million BTC in 6 months
While Bitcoin has been on a horizontal course since March, when it peaked at $73,000, CryptoQuant analyst shared an interesting detail. Analyst Axel Adler stated that short-term investors sold Bitcoin, but long-term whales made large purchases during the declines. In 6 months, big whales collected more than 1.5 million BTC.
HIGHLIGHTS OF THE DAY
Important Economic Calender Data
| Zaman | Haber | Beklenti | Önceki |
|---|---|---|---|
| 13:45 | FOMC Member Goolsbee Speaks | ||
| 14:00 | Michigan Consumer Sentiment (Oct) | 70.9 | 70.1 |
| 14:45 | FOMC Member Logan Speaks | ||
| 17:10 | FOMC Member Bowman Speaks |
INFORMATION
*The calendar is based on UTC (Coordinated Universal Time) time zone. The economic calendar content on the relevant page is obtained from reliable news and data providers. The news in the economic calendar content, the date and time of the announcement of the news, possible changes in the previous, expectations and announced figures are made by the data provider institutions. Darkex cannot be held responsible for possible changes that may arise from similar situations.
MARKET COMPASS
Following the US Consumer Price Index (CPI) data released yesterday, which came in above market expectations, all eyes turned to the Producer Price Index (PPI) figures, another inflation indicator, today.
According to the data, PPI in the US in September remained unchanged compared to the previous month and was announced as 0.0%. Core PPI, which is calculated by excluding food and energy, pointed to an increase of 0.2% in line with expectations. After the release of the data, the dollar fluctuated in a narrow area and the first effect was a decline in the dollar and a rise in digital assets. However, on the basis of these instant movements, we can say that the weak dollar outlook did not last long.
Are new stimulus measures on the way for the Chinese economy?
In addition to these headlines in the world’s largest economy, markets are also following China. After China’s National Development and Reform Commission (NDRC) did not make any noteworthy announcements to stimulate the economy on Tuesday, markets turned their attention to the country’s Finance Minister Lan Fu’an. The State Council Information Office will hold a press conference on Saturday, October 12 at 10:00 a.m. local time (GMT +8) and Minister Fu’an will also answer questions from journalists.
The country is expected to announce new and strong fiscal stimulus. According to a Bloomberg survey, the size of the stimulus is estimated to be around 2 trillion yuan ($283 billion). There is also talk that Beijing may wait until next month’s National People’s Congress to announce new fiscal stimulus measures. With so many market expectations, we don’t think Beijing will skip Saturday. However, there are still details to pay attention to. If the size of the announced package is below market expectations, it is likely to suppress risk appetite and increase pressure on digital assets. Therefore, it seems necessary to see a package at or around the size of market expectations for a recovery after recent losses.
General Table
As we have been stating for some time and also in our morning analysis today, we think that our statement “Although we think that there is a positive outlook for the long term, it seems necessary for the short term direction that the two developments in question (US PPI data and expected announcements from China) are in a tone that will support risk appetite” continues to be valid. While the CPI was, the PPI was not in a tone that would create a change in the game plan and the expectations for the Fed’s rate cut path (2 rate cuts of 25 bps each in the last two meetings of the year) do not seem to have changed for now. We can state that this current situation is a dynamic that will create pressure in the short term and a basis for rises in the medium term.
TECHNICAL ANALYSIS
BTC/USDT
In Bitcoin, eyes turned from the US side to the Asian side. The Chinese government, which is often on the agenda with its stimulus packages and the lifting of the crypto ban, is expected to announce an incentive package of up to 2 trillion yuan at a press conference tomorrow. If the expectations are realized, we can say that there will be mobility in Bitcoin and cryptocurrencies. If we look at today, the increase in the total value of assets under the management of BlackRock, the largest ETF issuer, has positively reflected on the Bitcoin price.
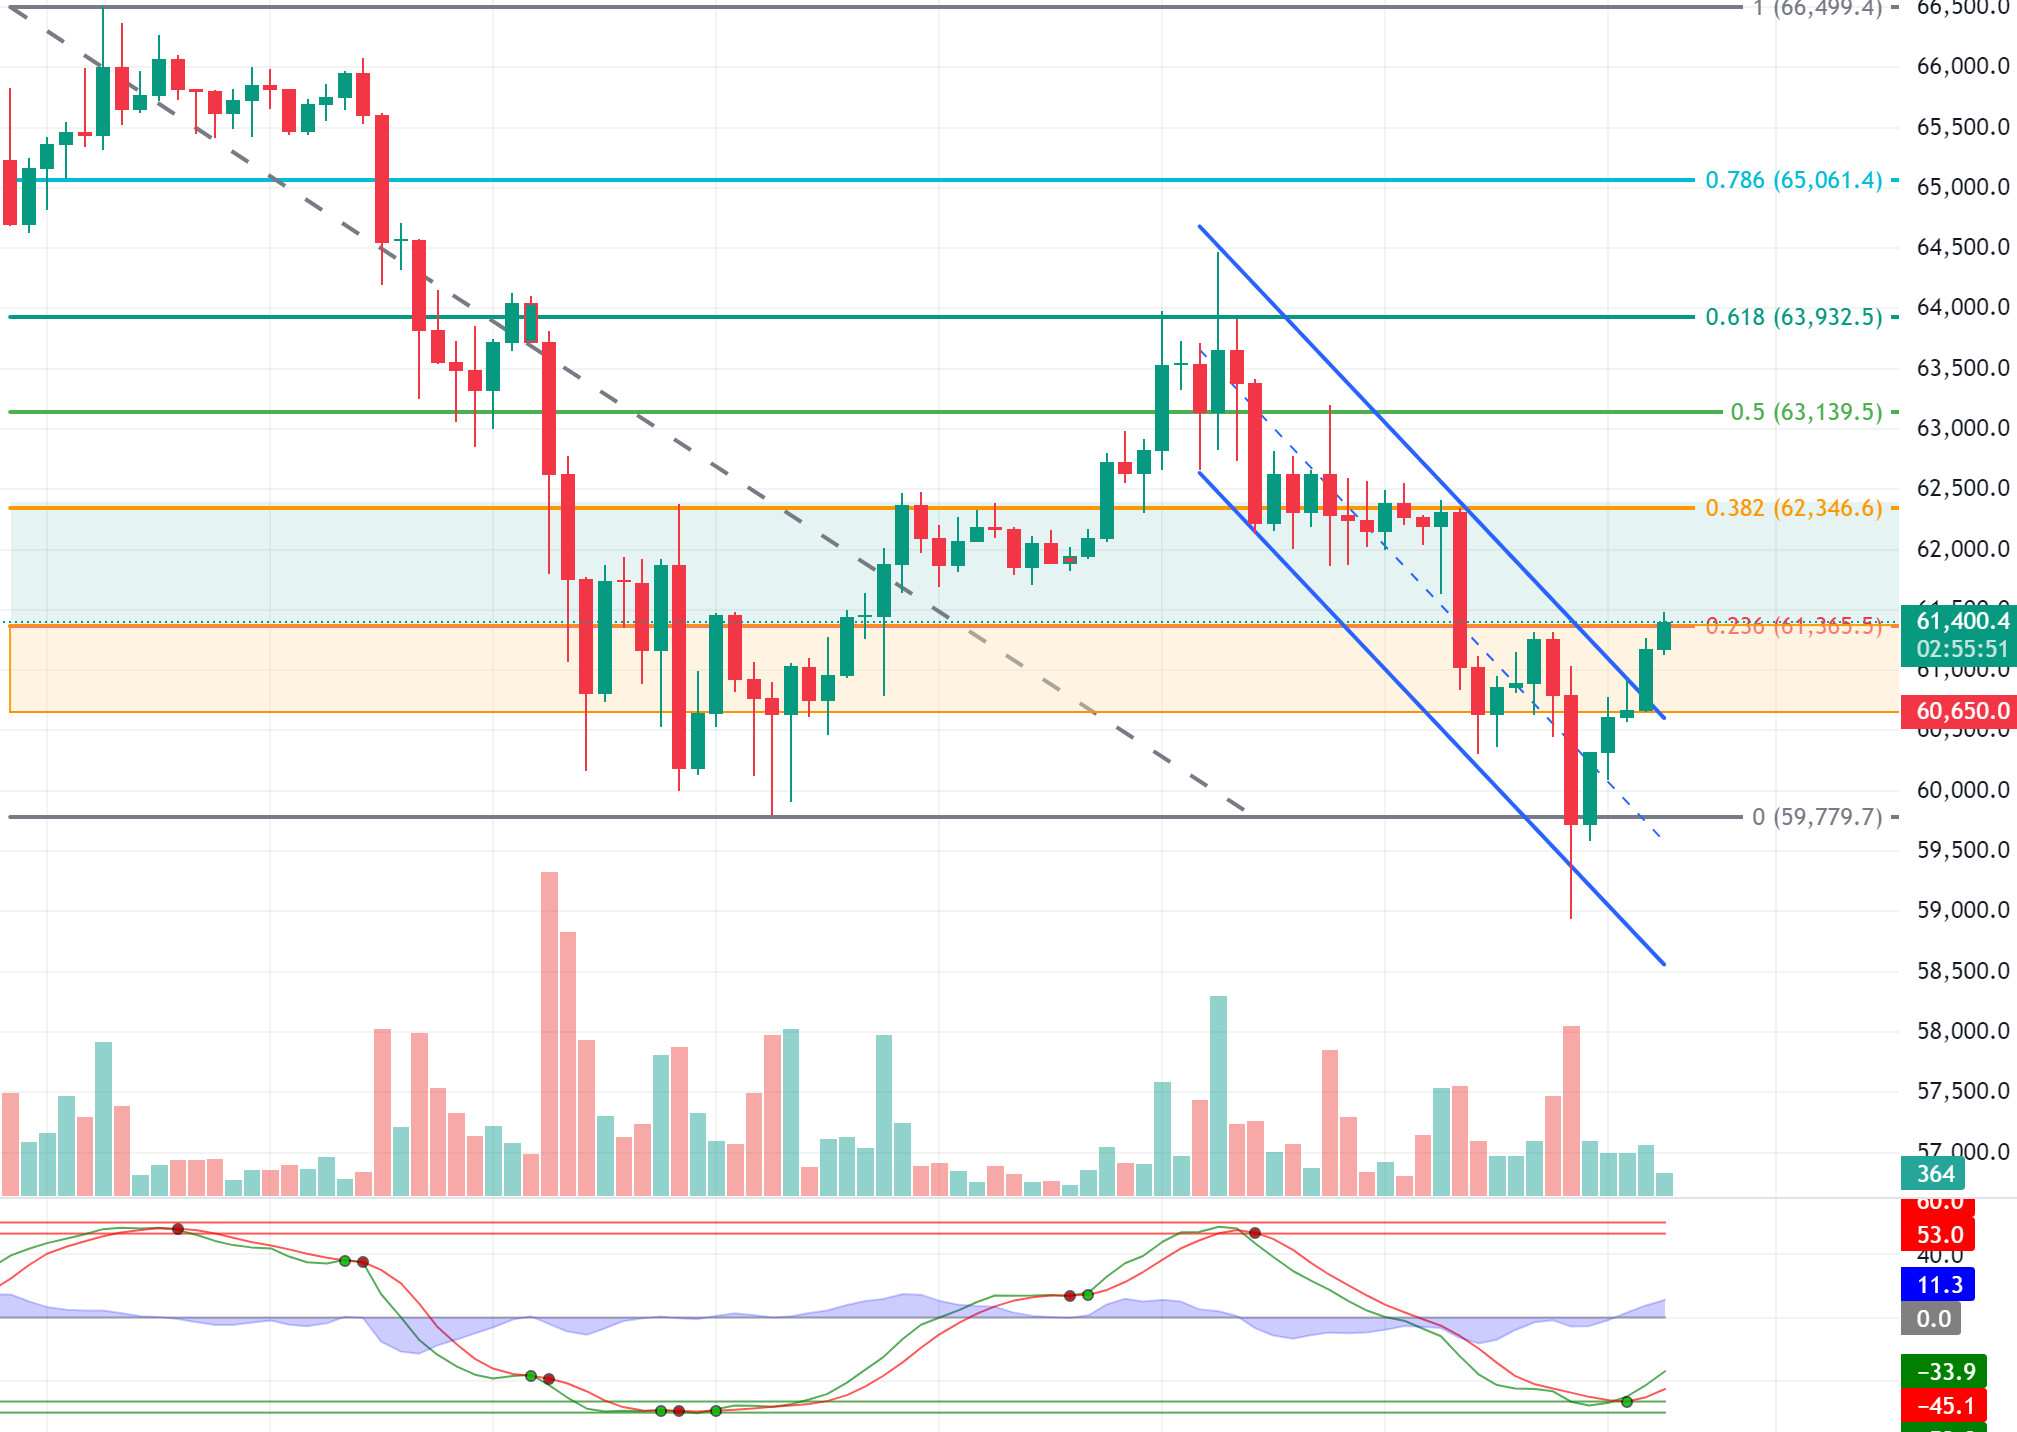
In the BTC 4-hour technical analysis, a break in the falling trend structure stands out with the effect of optimistic news. With this breakout, another resistance point, 0.382 (62,346), can be targeted by crossing the Fibonacci resistance level of 0.236 (61,365) with the active double bottom formation, increasing the upward momentum. In case of a pullback, the level that will appear as a support level is 60,650.
Supports 60,650 – 59,780 – 58,350
Resistances 61,365 – 62,350 – 63,139
ETH/USDT
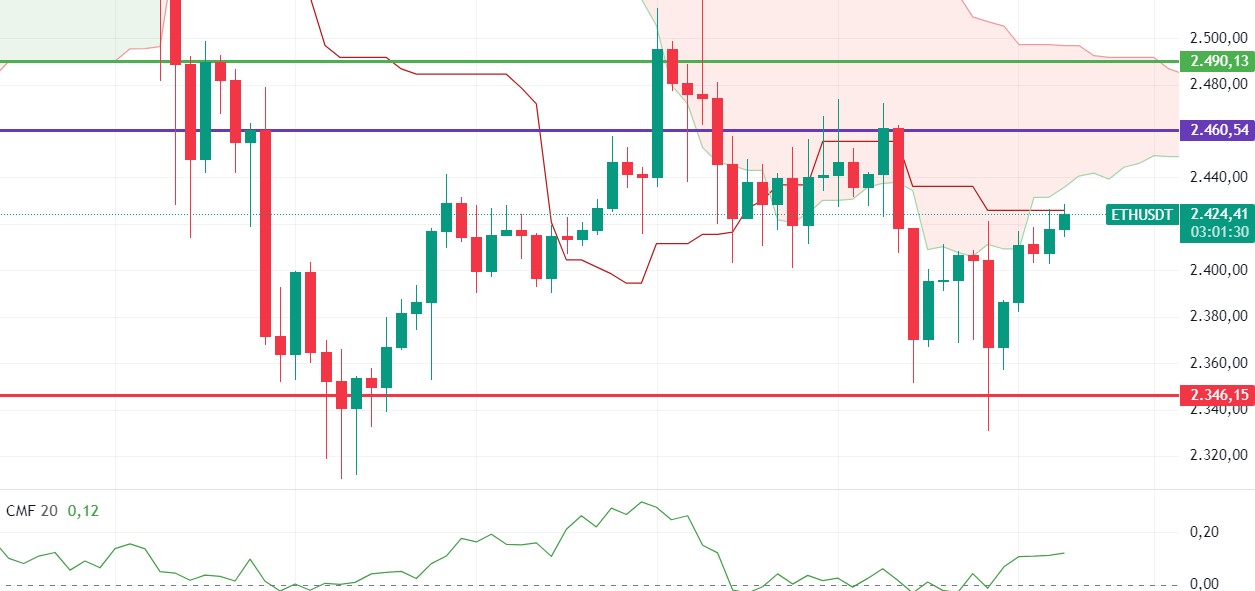
For Ethereum, which continues to be slightly positive with the positivity on CMF, momentum and RSI have become positive again. ETH, which was rejected from the Kijun level of 2,425, may strengthen its upward trend with the exceeding of this level. Especially if it exceeds the kumo cloud levels in the 4-hour timeframe, the outlook may become stronger. Besides all these, 2,400 support remains valid. Closures below this region may disrupt the positive structure and cause some retracement.
Supports 2,400 – 2,346 – 2,270
Resistances 2,460 – 2,490 – 2,571
LINK/USDT
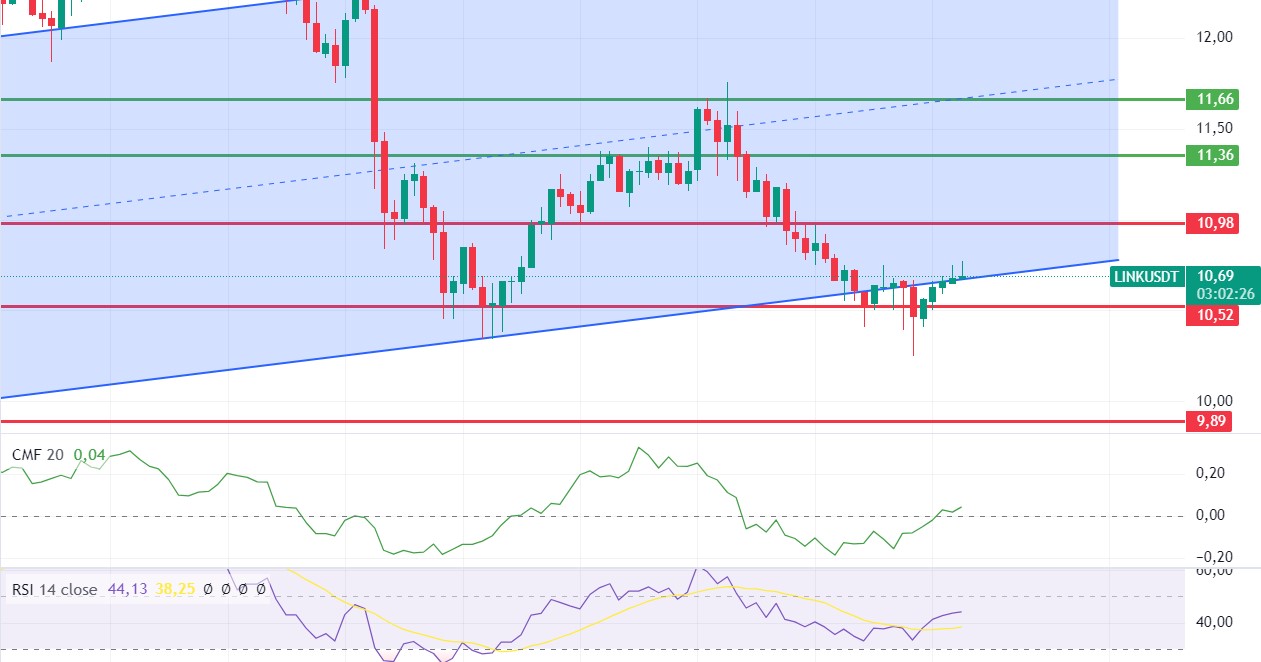
LINK continues its positive outlook by climbing back into the ascending channel. The outlook on CMF and momentum also remains positive. Although there is a reversal on the RSI, the risk of a negative mismatch above the 47.59 level of the RSI may put some pressure on the price. The voluminous break of the 10.98 level may continue the rise. However, the rejection from this region may bring a decline to 10.52 levels again.
Supports 10.52 – 10.17 – 9.89
Resistances 10.98 – 10.36 – 11.66
SOL/USDT
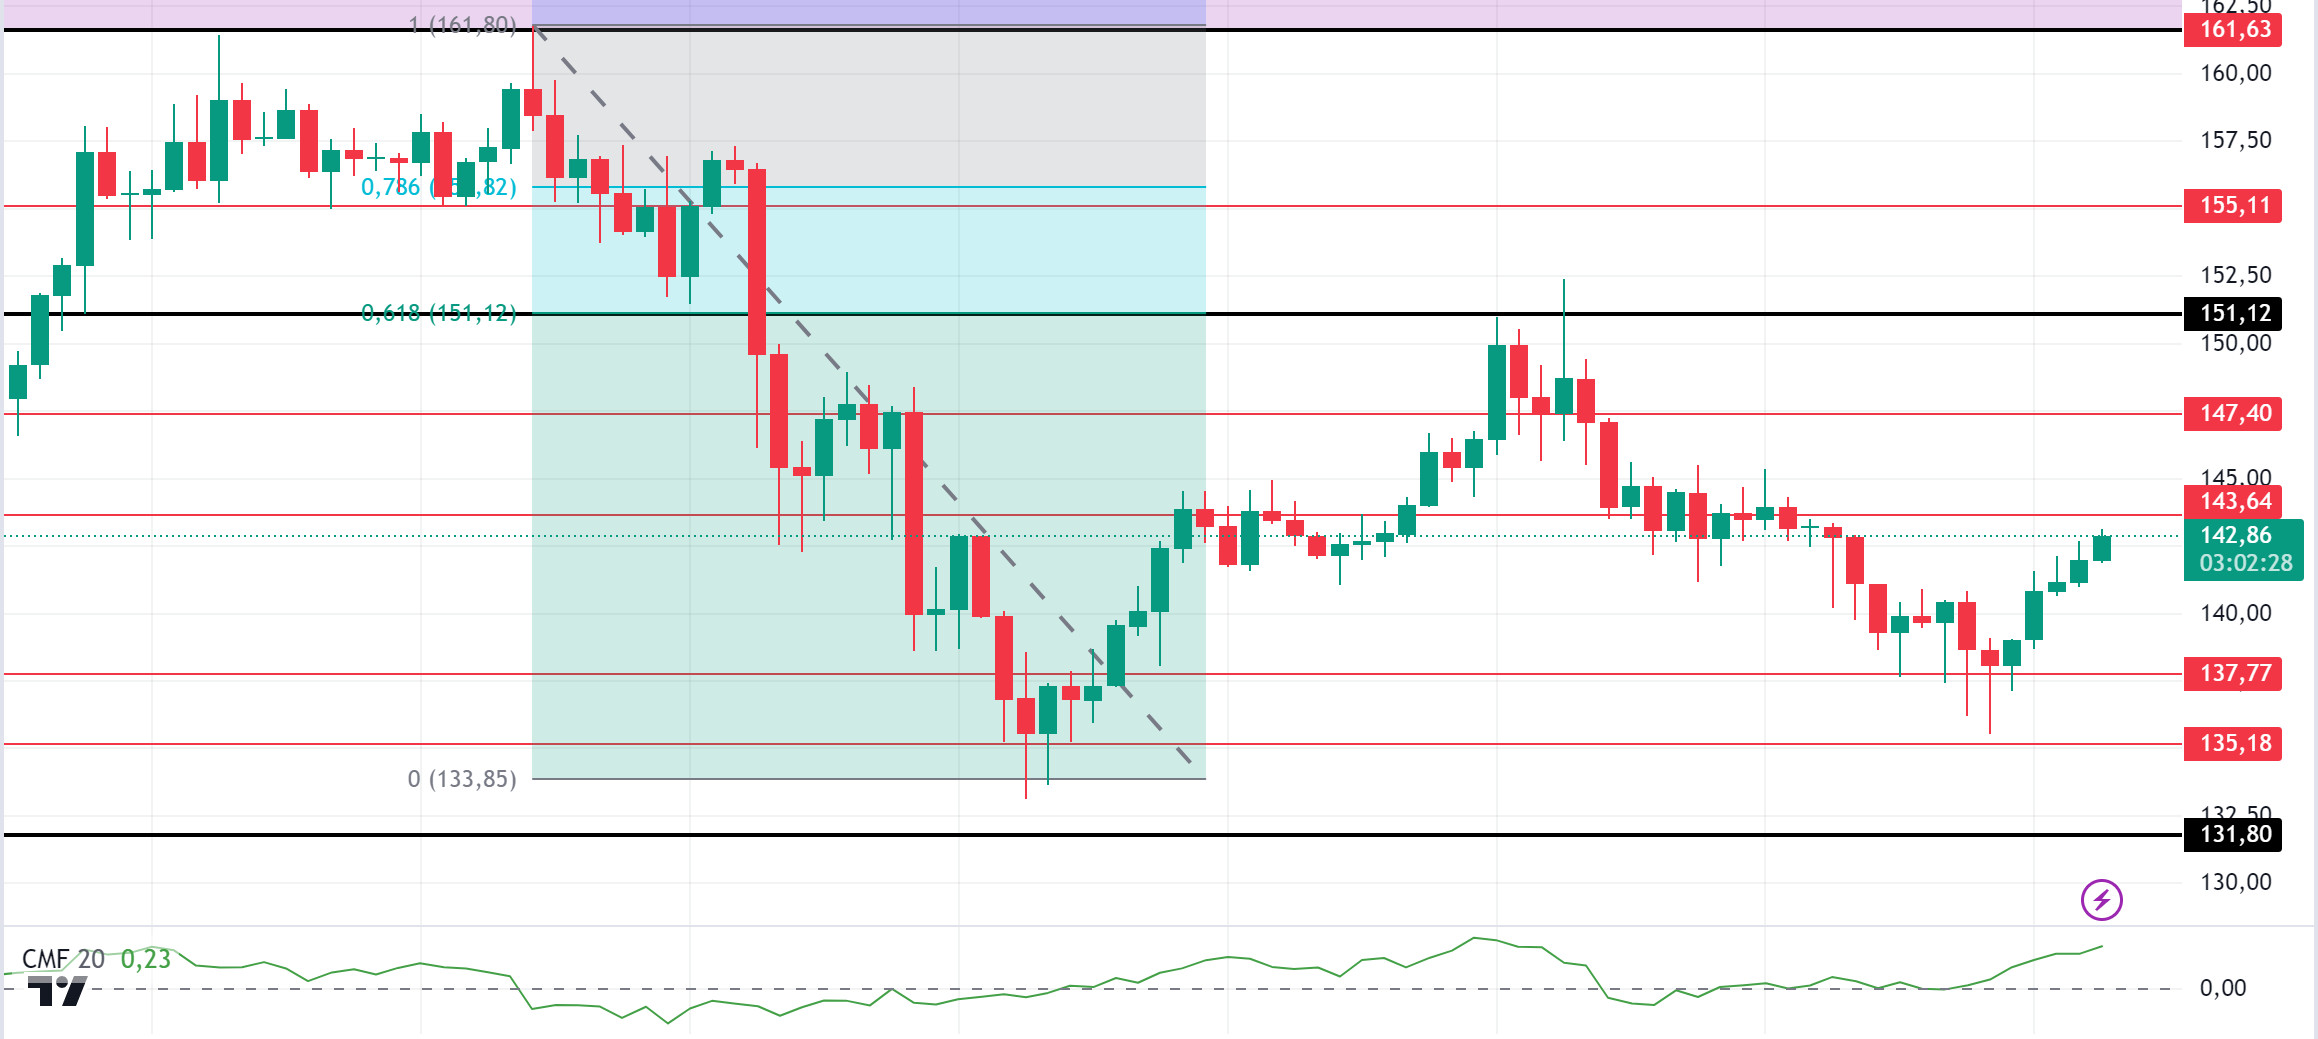
When we look at the CMF (20) indicator on the 4-hour chart, we can see that the inflows are quite high. This signals that a potential uptrend may continue. A break above 151.12 would be expected to confirm a significant bullish trend. The price has been accumulating in the 127.17 – 161.63 band since August 8. It encountered resistance at the Fibonacci retracement of 0.618 (151.12). The 151.12 level appears to be a strong resistance place in the rises driven by both macroeconomic conditions and innovations in the Solana ecosystem. If it rises above this level, the rise may continue. In the sales that investors will make due to political and macroeconomic conditions, the support level of 131.80, which is the place of retreat, should be followed. If the price comes to these support levels, a potential bullish opportunity may arise.
Supports 137.77 – 135.18 – 131.80
Resistances 143.64 – 147.40 – 151.12
ADA/USDT
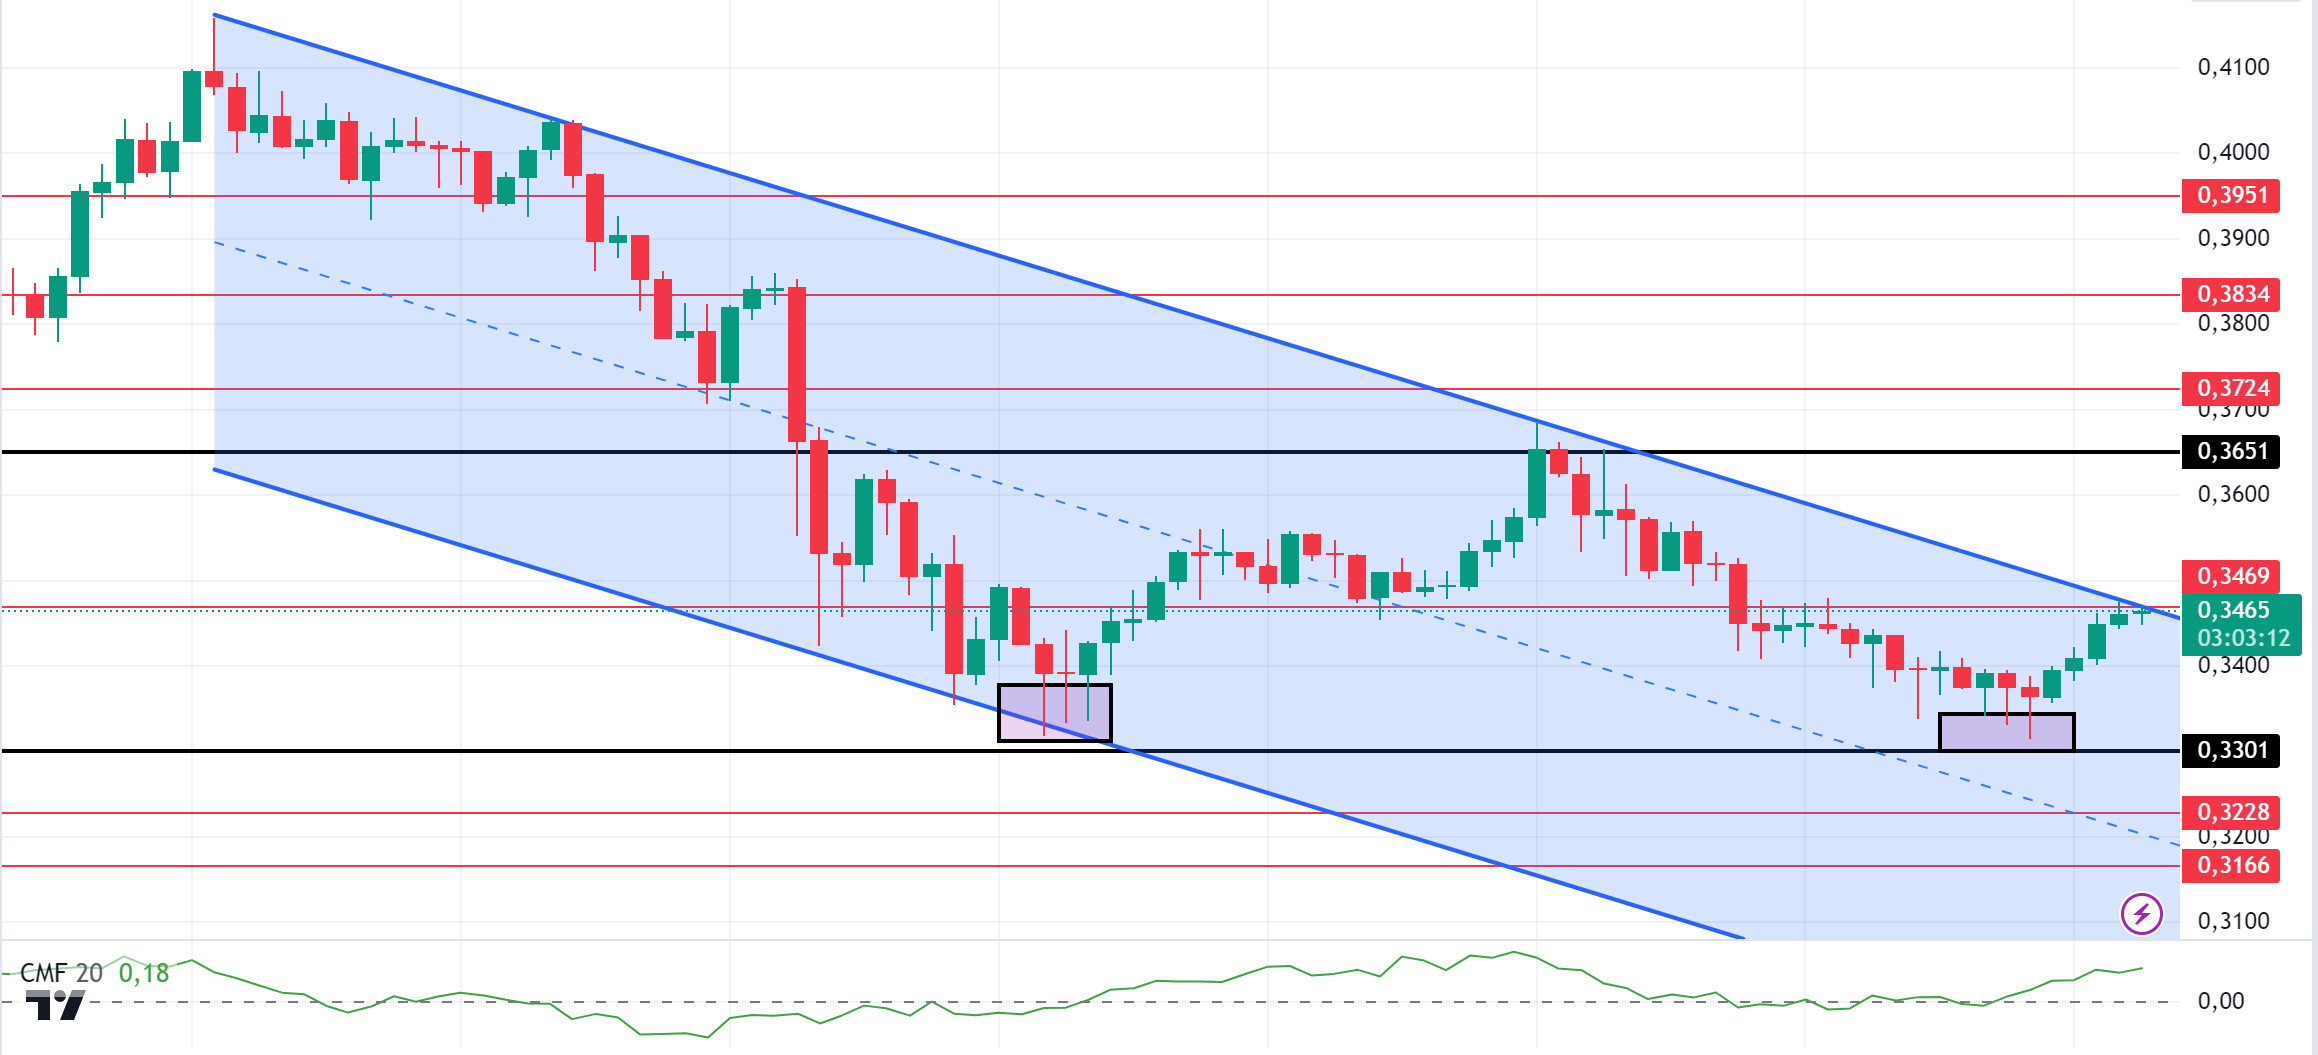
Technically, the downtrend that started on September 27 on the 4-hour chart shows that it has the potential to break the resistance level of 0.3469 with the increased money flow that we see with the CMF (20) indicator. However, a double bottom is confirmed on our chart. This could be a bullish harbinger. If money flows continue to increase and macroeconomic data is positive for cryptocurrencies, the rise may continue. If the flow of money decreases and macroeconomic data is negative for cryptocurrencies, 0.3301 is a strong support point and can be followed as a good place to buy.
Supports 0.3301 – 0.3228 – 0.3166
Resistances 0.3469 – 0.3651 – 0.3724
AVAX/USDT
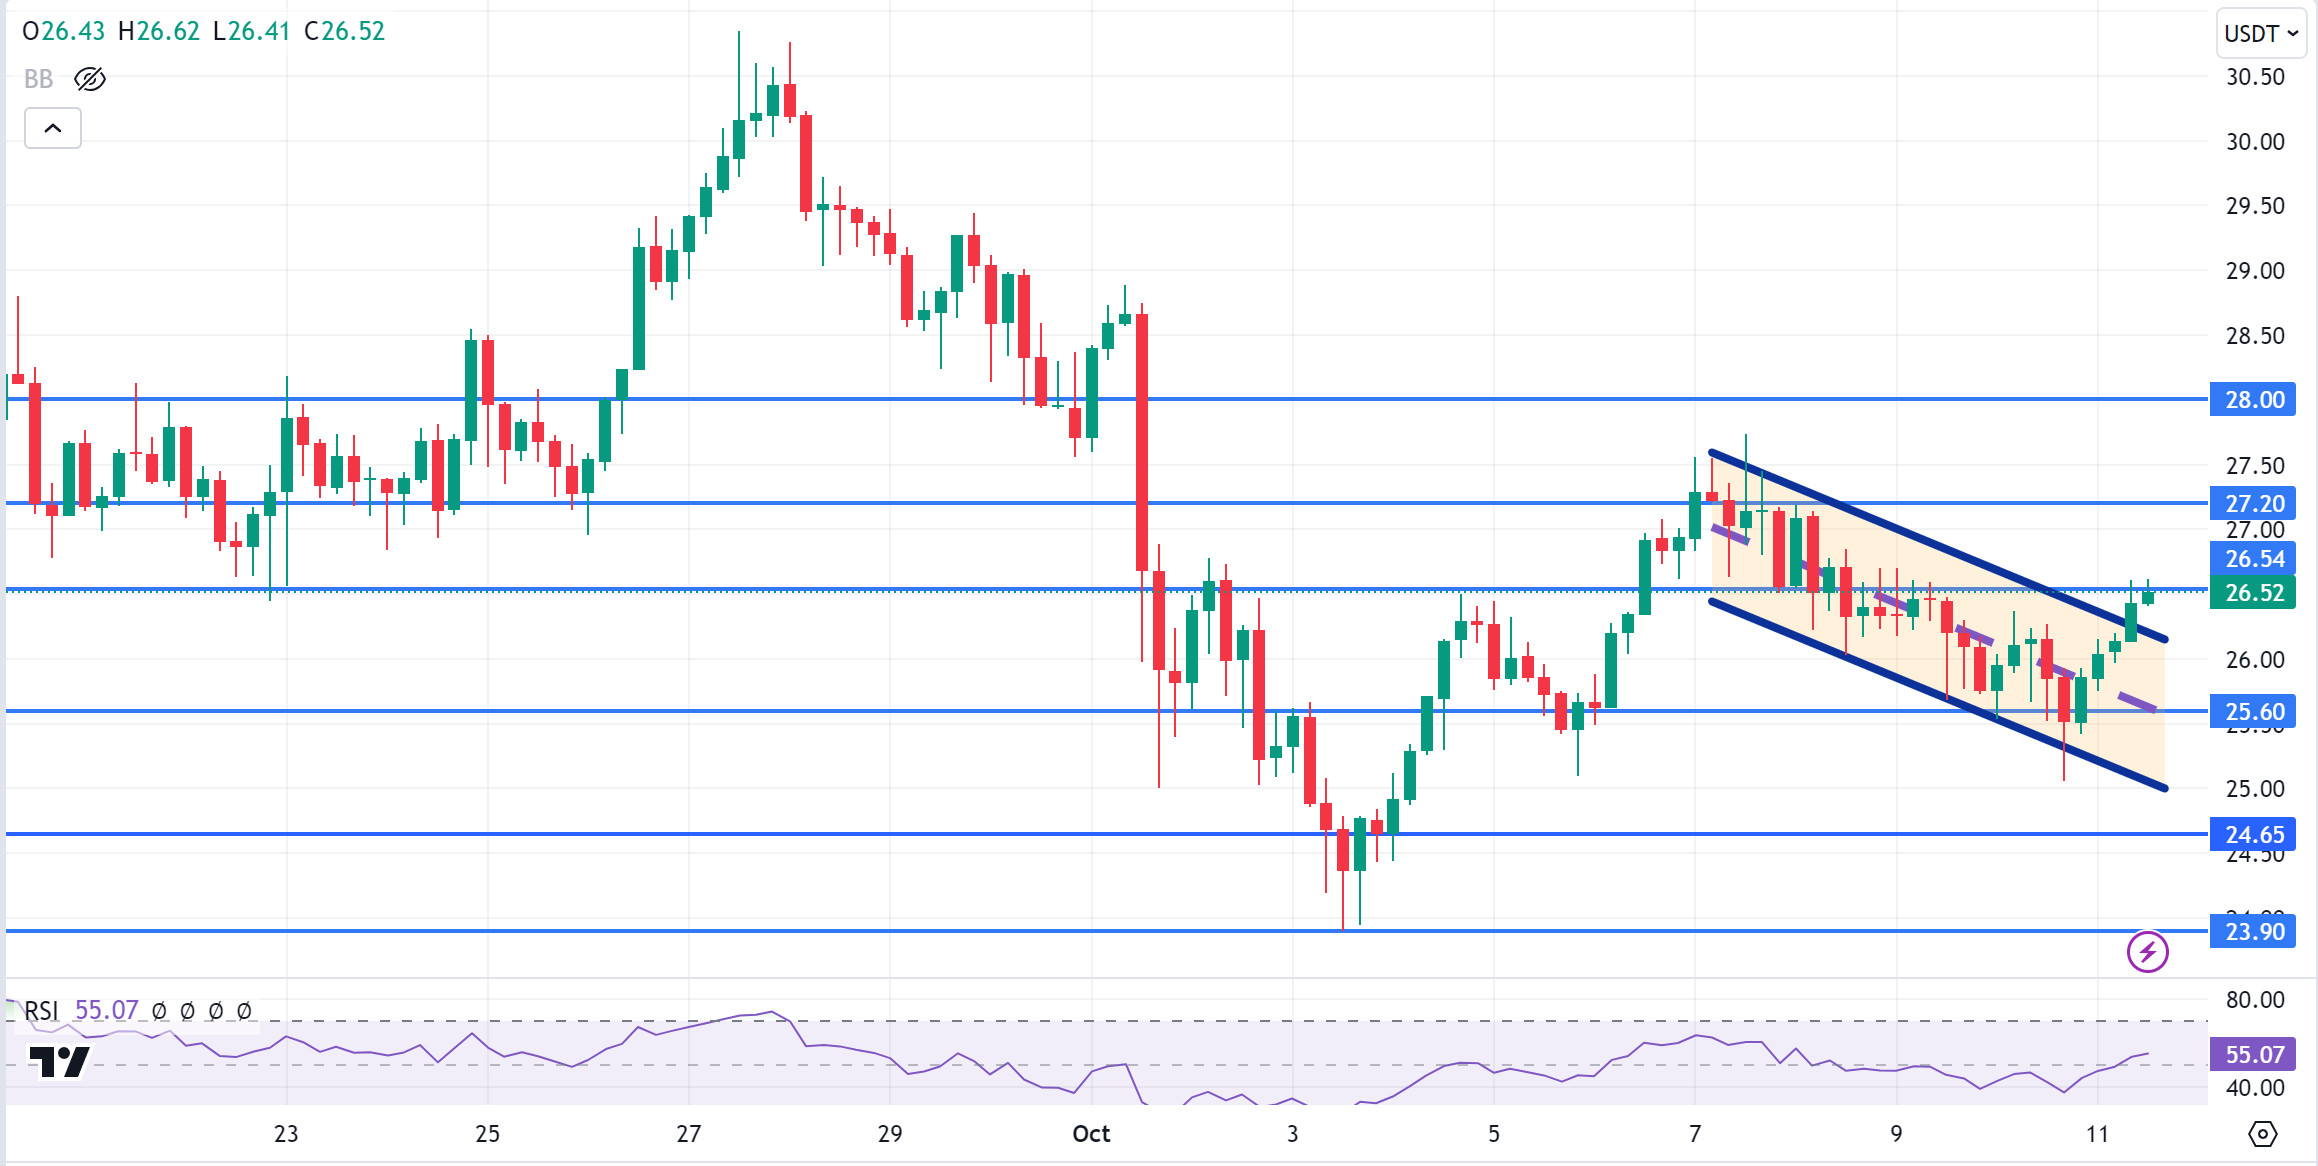
AVAX, which opened today at 25.85, is trading at 26.52, up about 2.5% during the day. News flows from the Middle East will be important for the market.
On the 4-hour chart, it is trying to break the upper band of the falling channel and with the RSI 55 value, some decline can be expected from these levels. In such a case, it may test 25.60 support. In case of positive news that the tension in the Middle East is decreasing, purchases may increase. In such a case, we can test the 27.20 resistance by closing the candle above the 26.54 resistance and confirm that it breaks the falling channel upwards. As long as it stays above 24.65 support during the day, the desire to rise may continue. With the break of 24.65 support, sales may increase.
Supports 25.60 – 24.65 – 23.90
Resistances 26.54 – 27.20 – 28.00
TRX/USDT
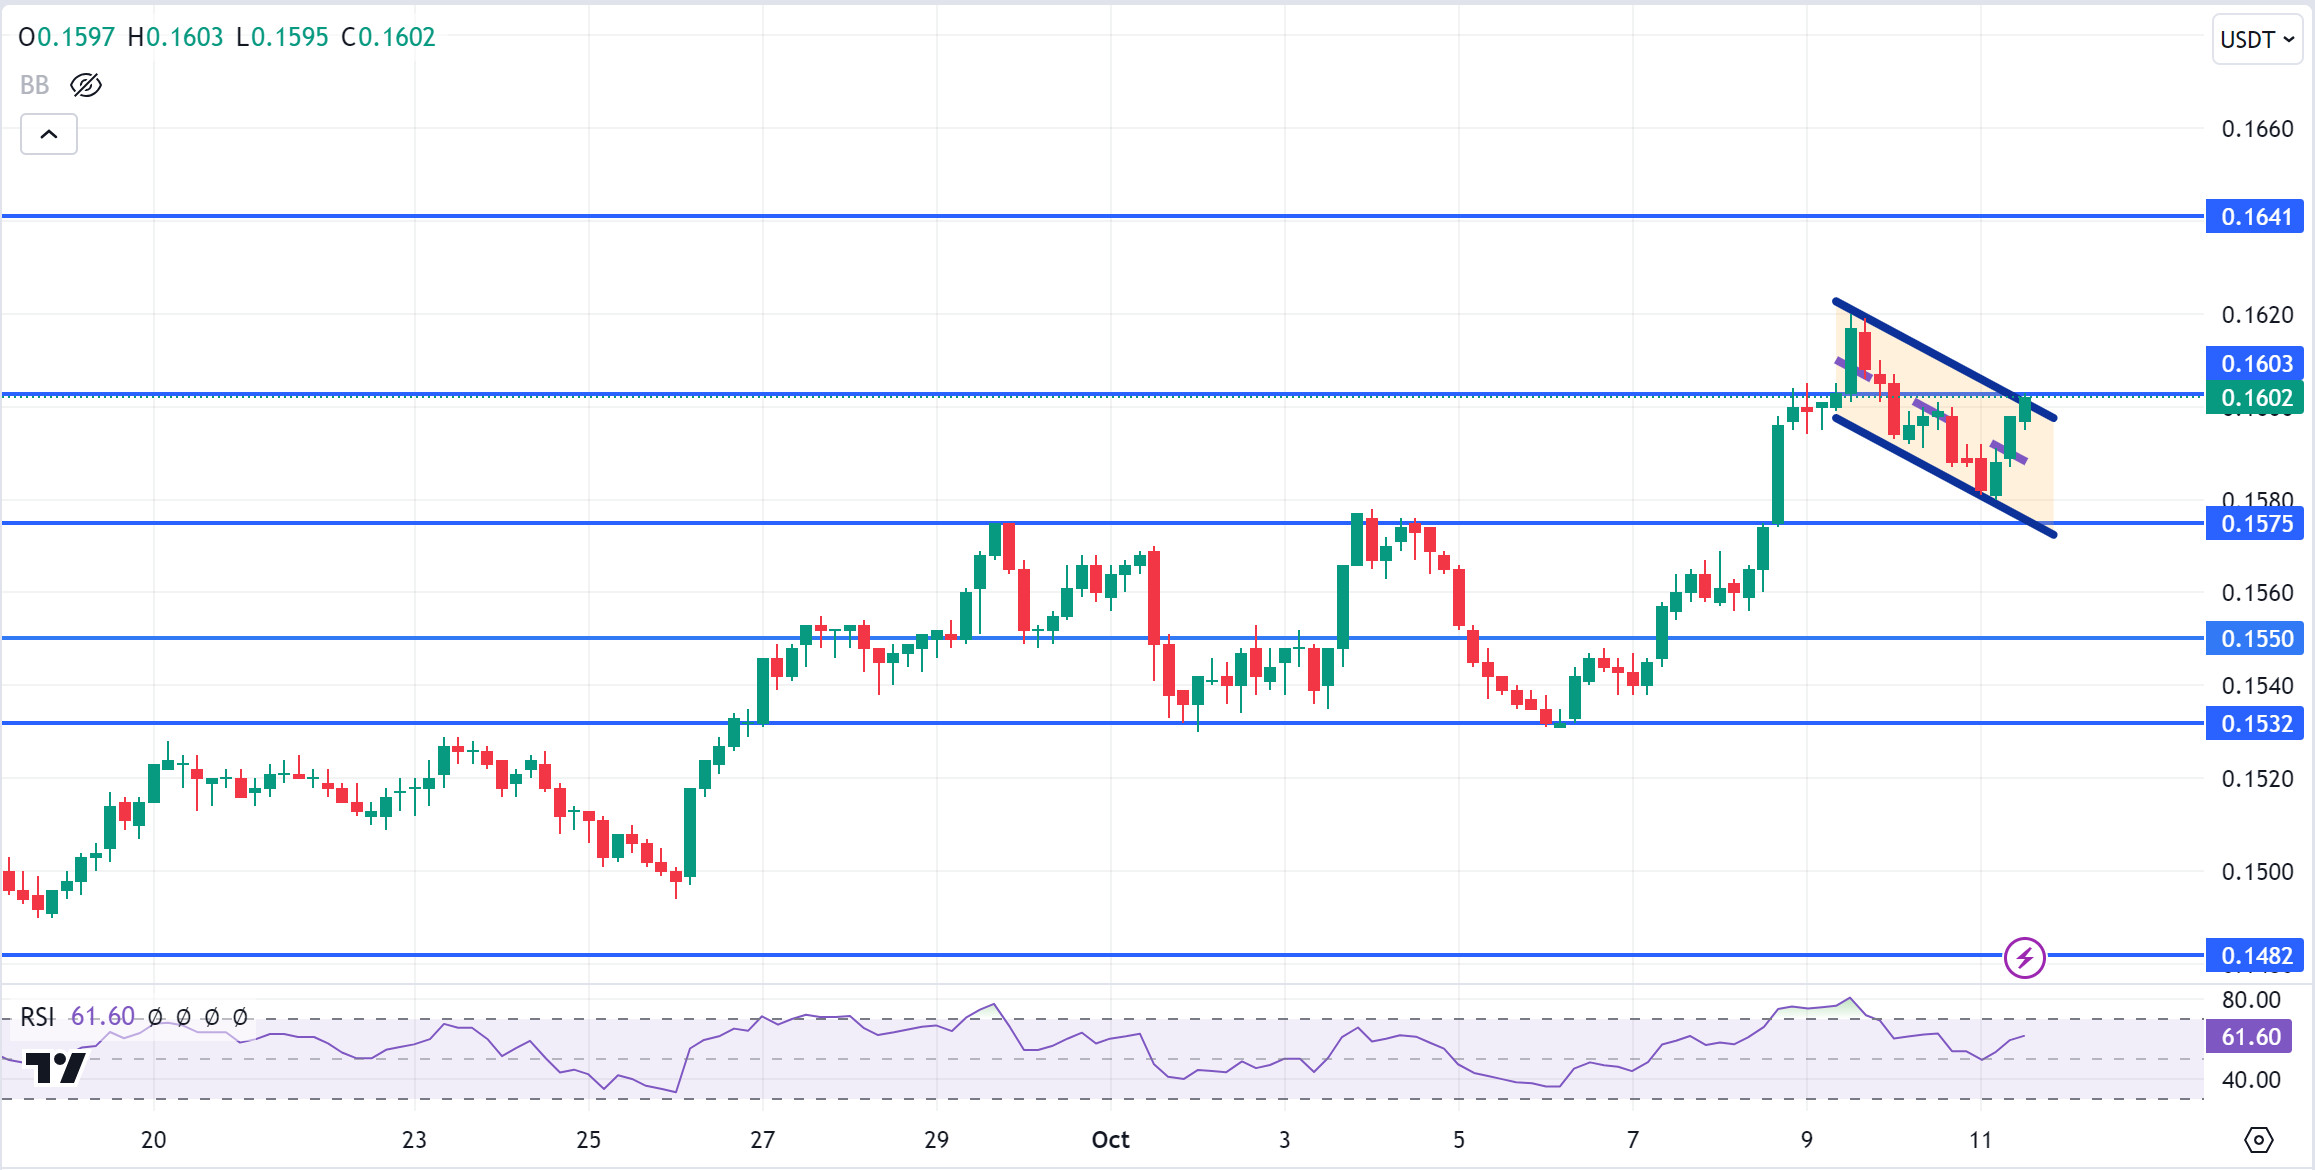
TRX, which started the day at 0.1589, is trading at 0.1602, up about 1% during the day. The market is closely following the news flows regarding the tension in the Middle East. On the 4-hour chart, it is moving in the upper band of the falling channel. With the RSI value of 61, it can be expected to decline slightly from its current level. In such a case, it may move to the lower band of the channel and test the 0.1575 support. If the tension in the Middle East decreases, it may want to break the falling channel upwards with future purchases. In this case, it may test 0.1641 resistance. TRX may continue to be bullish as long as it stays above 0.1482 support. If this support is broken downwards, sales can be expected to increase.
Supports 0.1575 – 0.1550 – 0.1532
Resistances 0.1603 – 0.1641 – 0.1687
XRP/USDT
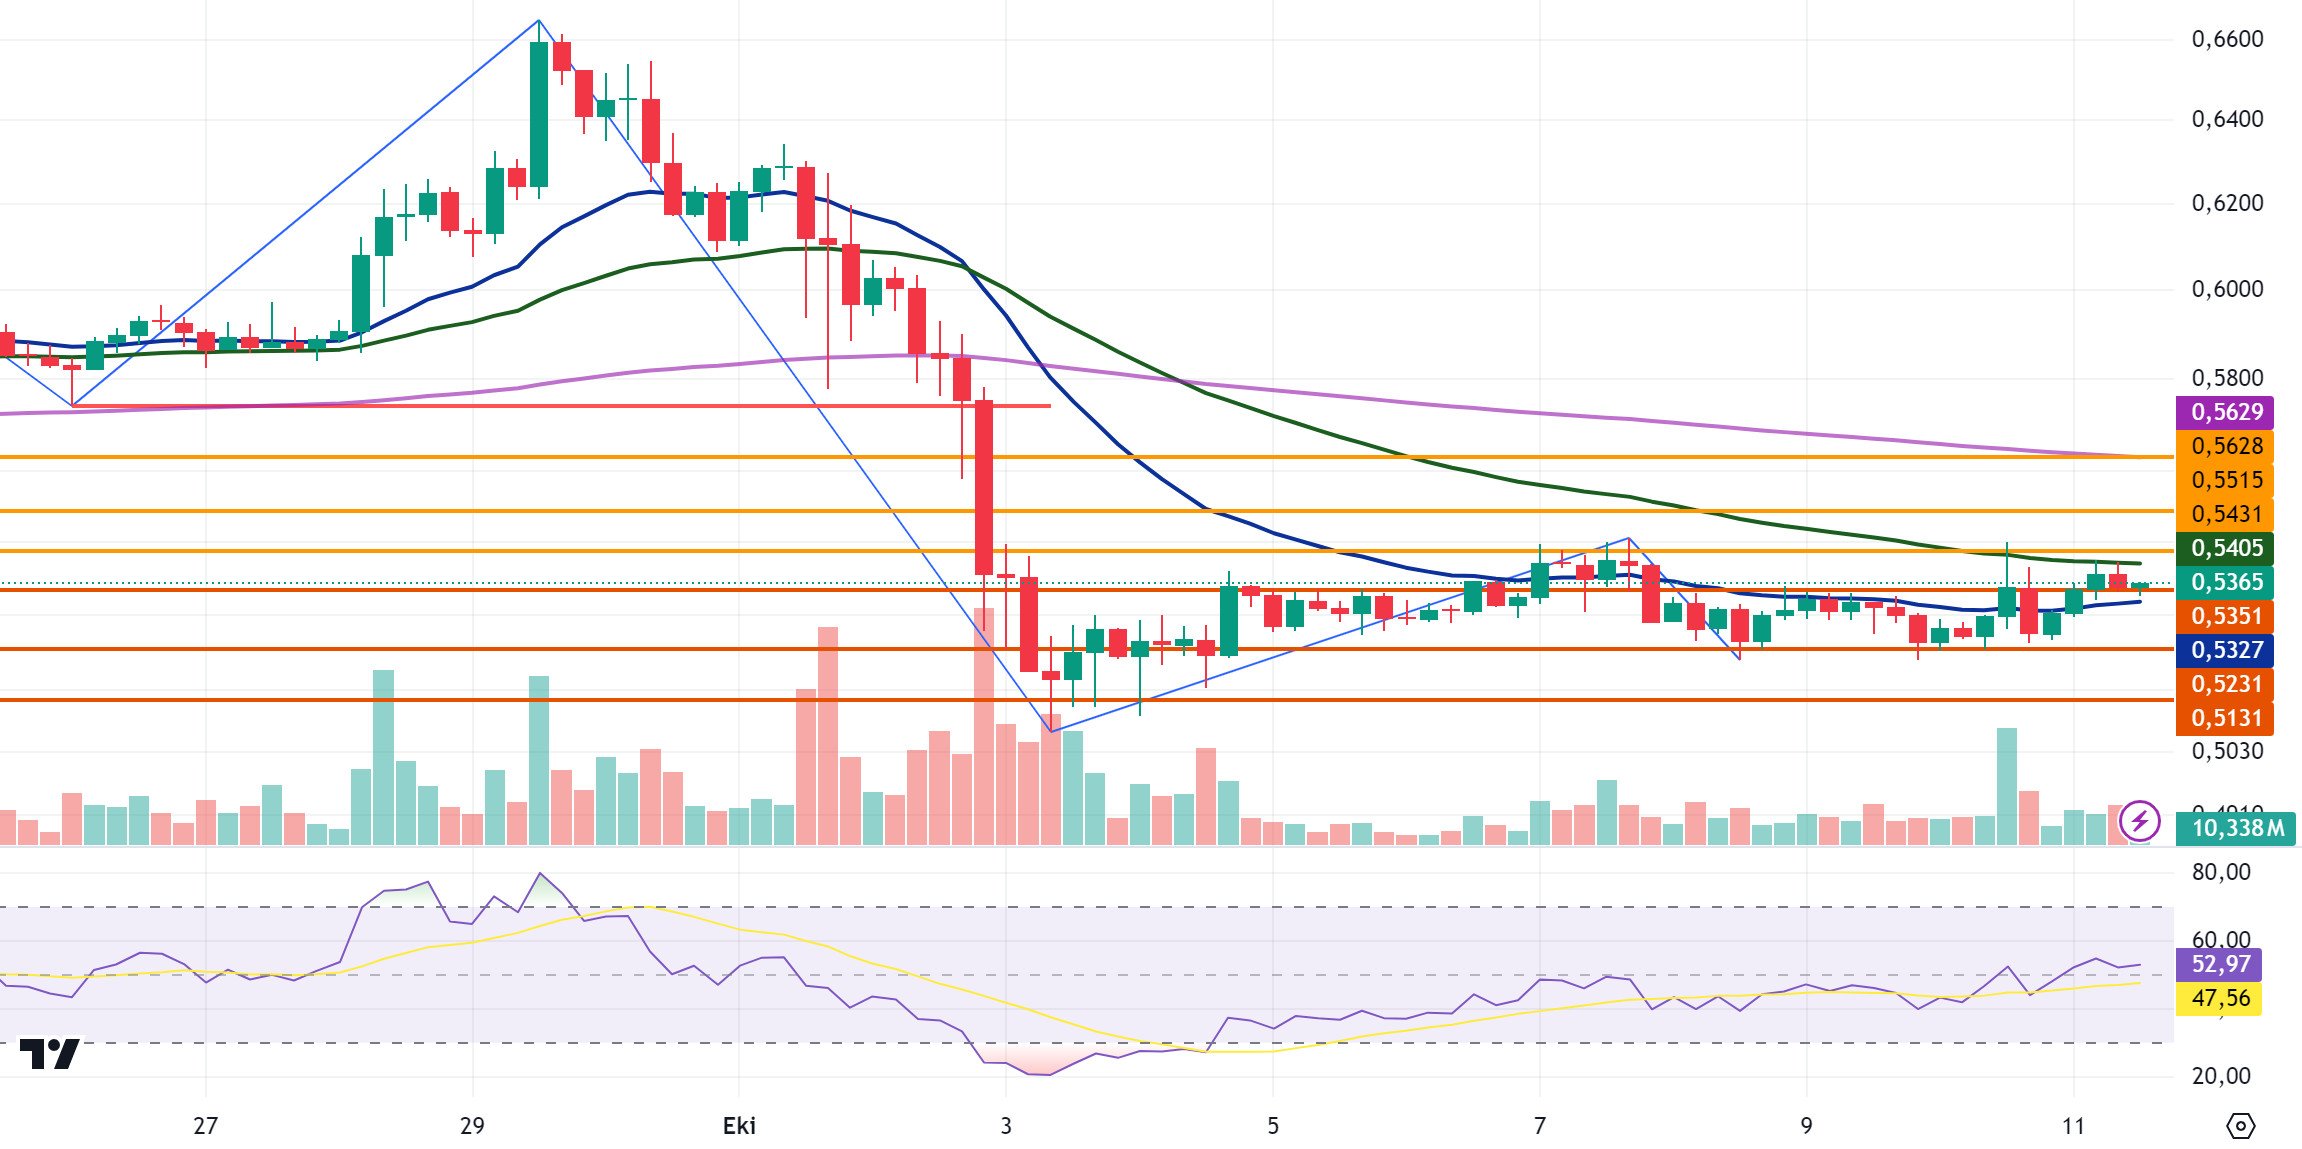
XRP, which started today with a rise, tested the EMA50 level in the continuation of the rise after breaking the EMA20 and 0.5351 levels with its rise in the 4-hour analysis. XRP, which fell with the sales that could not break this level, is currently trading at 0.5365. RSI (14) data is in the neutral zone and XRP may trade in a horizontal band between EMA20 and EMA50 levels. If it turns bullish again and closes the candle above the EMA50 level in the 4-hour analysis and continues to rise, it may test the 0.5431-0.5515-0.5628 levels. In case of a decline, it may test the support levels of 0.5231-0.5131 in the continuation of the decline with the downward break of the 0.5351 and EMA20 level.
On the upside, XRP may decline and offer a short trading opportunity with possible sales at EMA200 and 0.56. In its decline, it may rise with possible purchases at 0.52 and may offer a long trading opportunity.
EMA20 (Blue Line) – EMA50 (Green Line) – EMA200 (Purple Line)
Supports 0.5351 – 0.5231 – 0. 5131
Resistances 0.5431 – 0.5515 – 0.5628
DOGE/USDT
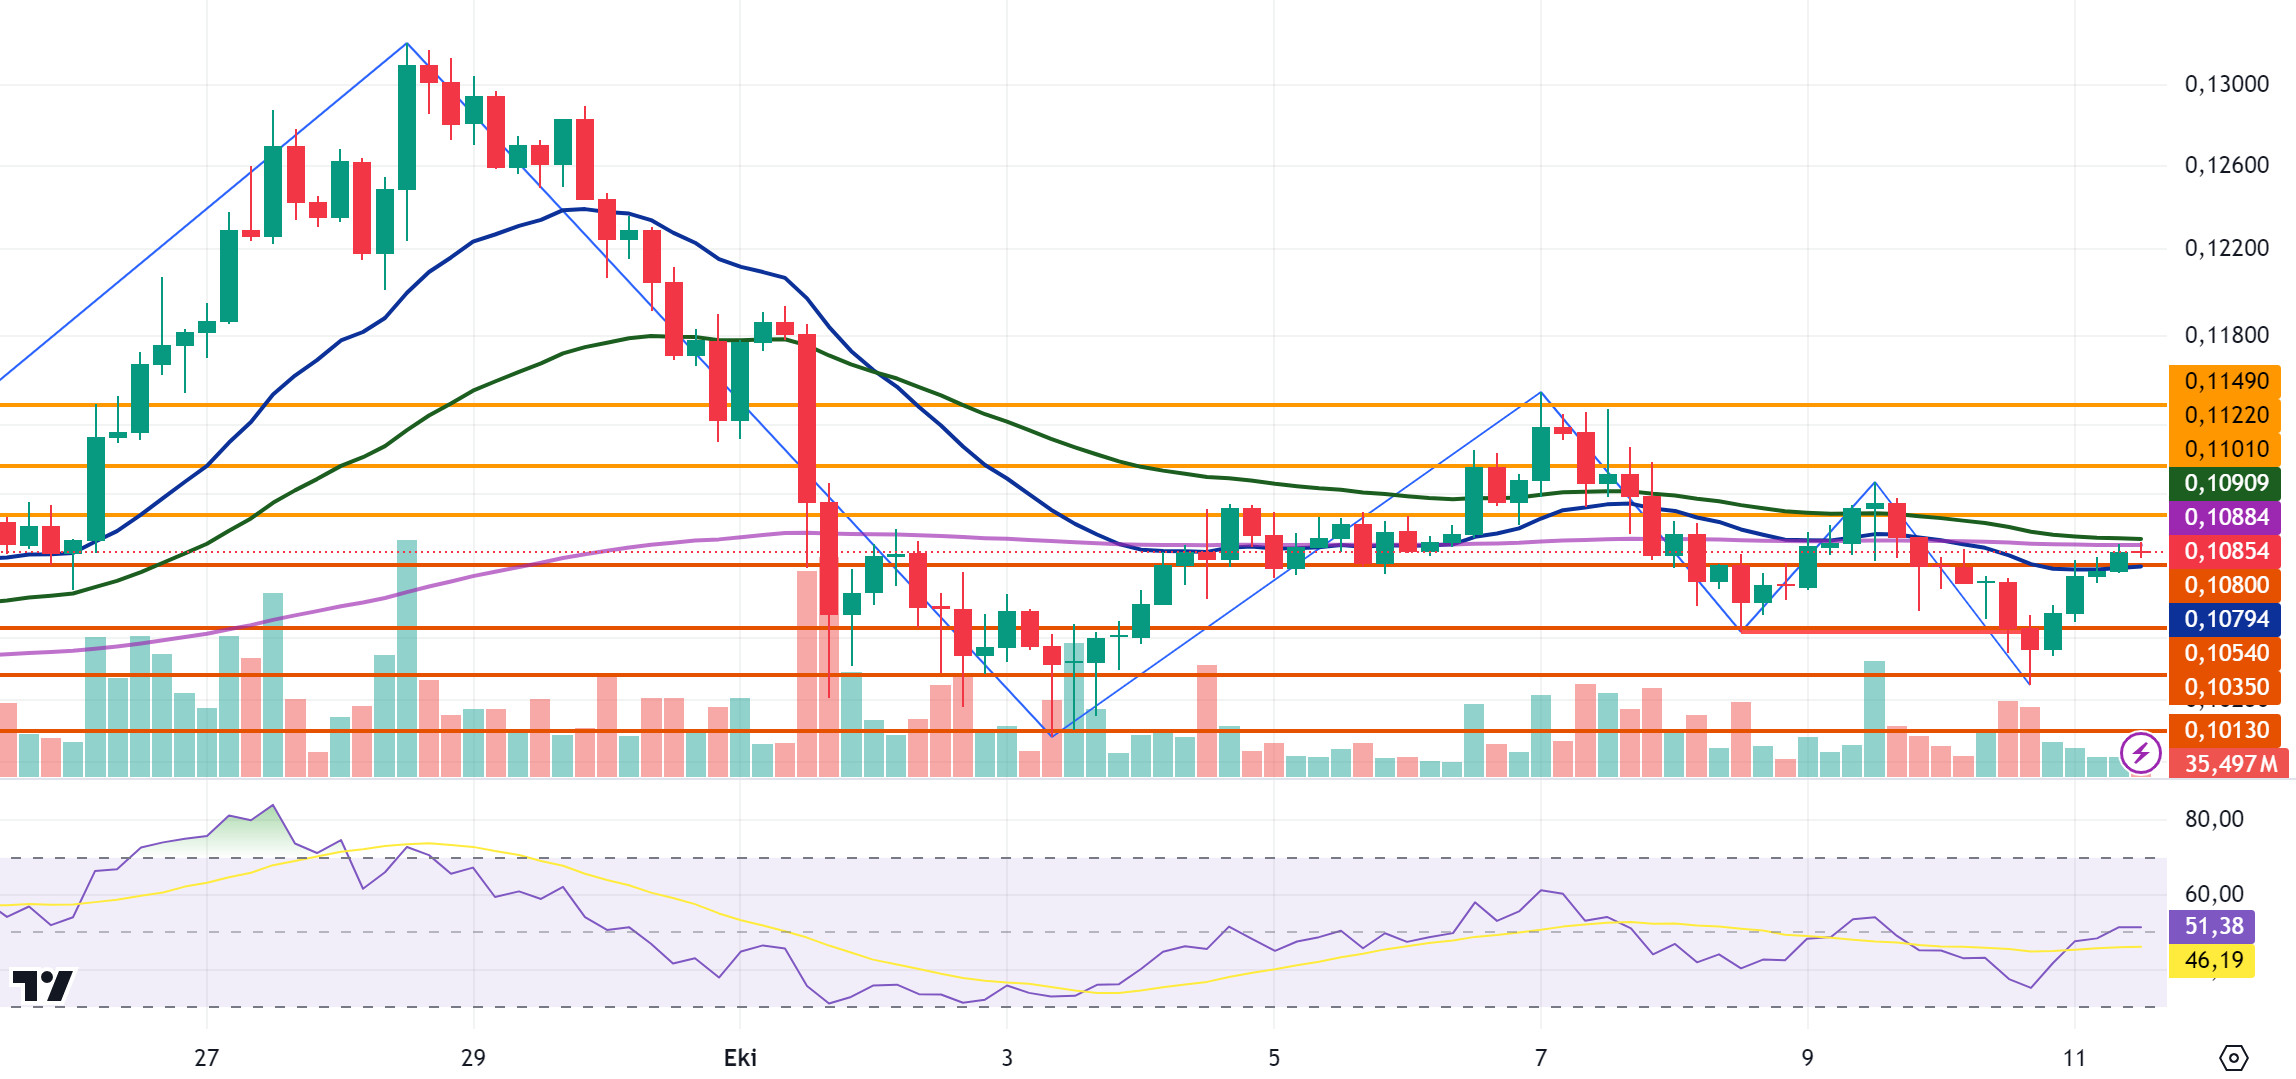
DOGE, which started today at 0.1059, is currently trading at 0.1085 with an increase of about 2.3%. In the 4-hour analysis, it broke the EMA20 and 0.1080 levels with its rise and tested the EMA50 and EMA200 levels in the continuation of the rise. DOGE, which declined with sales from these levels, may test the resistance levels of 0.1101-0.1122-0.1149 in the continuation of the rise if it rises again and breaks the EMA50 and EMA200 levels. In case of a decline, it may test the support levels of 0.1054-0.1035 with the downward break of the EMA20 and 0.1080 levels and the continuation of the decline.
DOGE may decline on its rise with possible sales at 0.11 and may offer a short trading opportunity. In its decline, it may rise with purchases that may come at 0.1080 and may offer a long trading opportunity.
EMA20 (Blue Line) – EMA50 (Green Line) – EMA200 (Purple Line)
Supports 0.1080 – 0.1054 – 0.1035
Resistances 0.1101 – 0.1122 – 0.1149
DOT/USDT
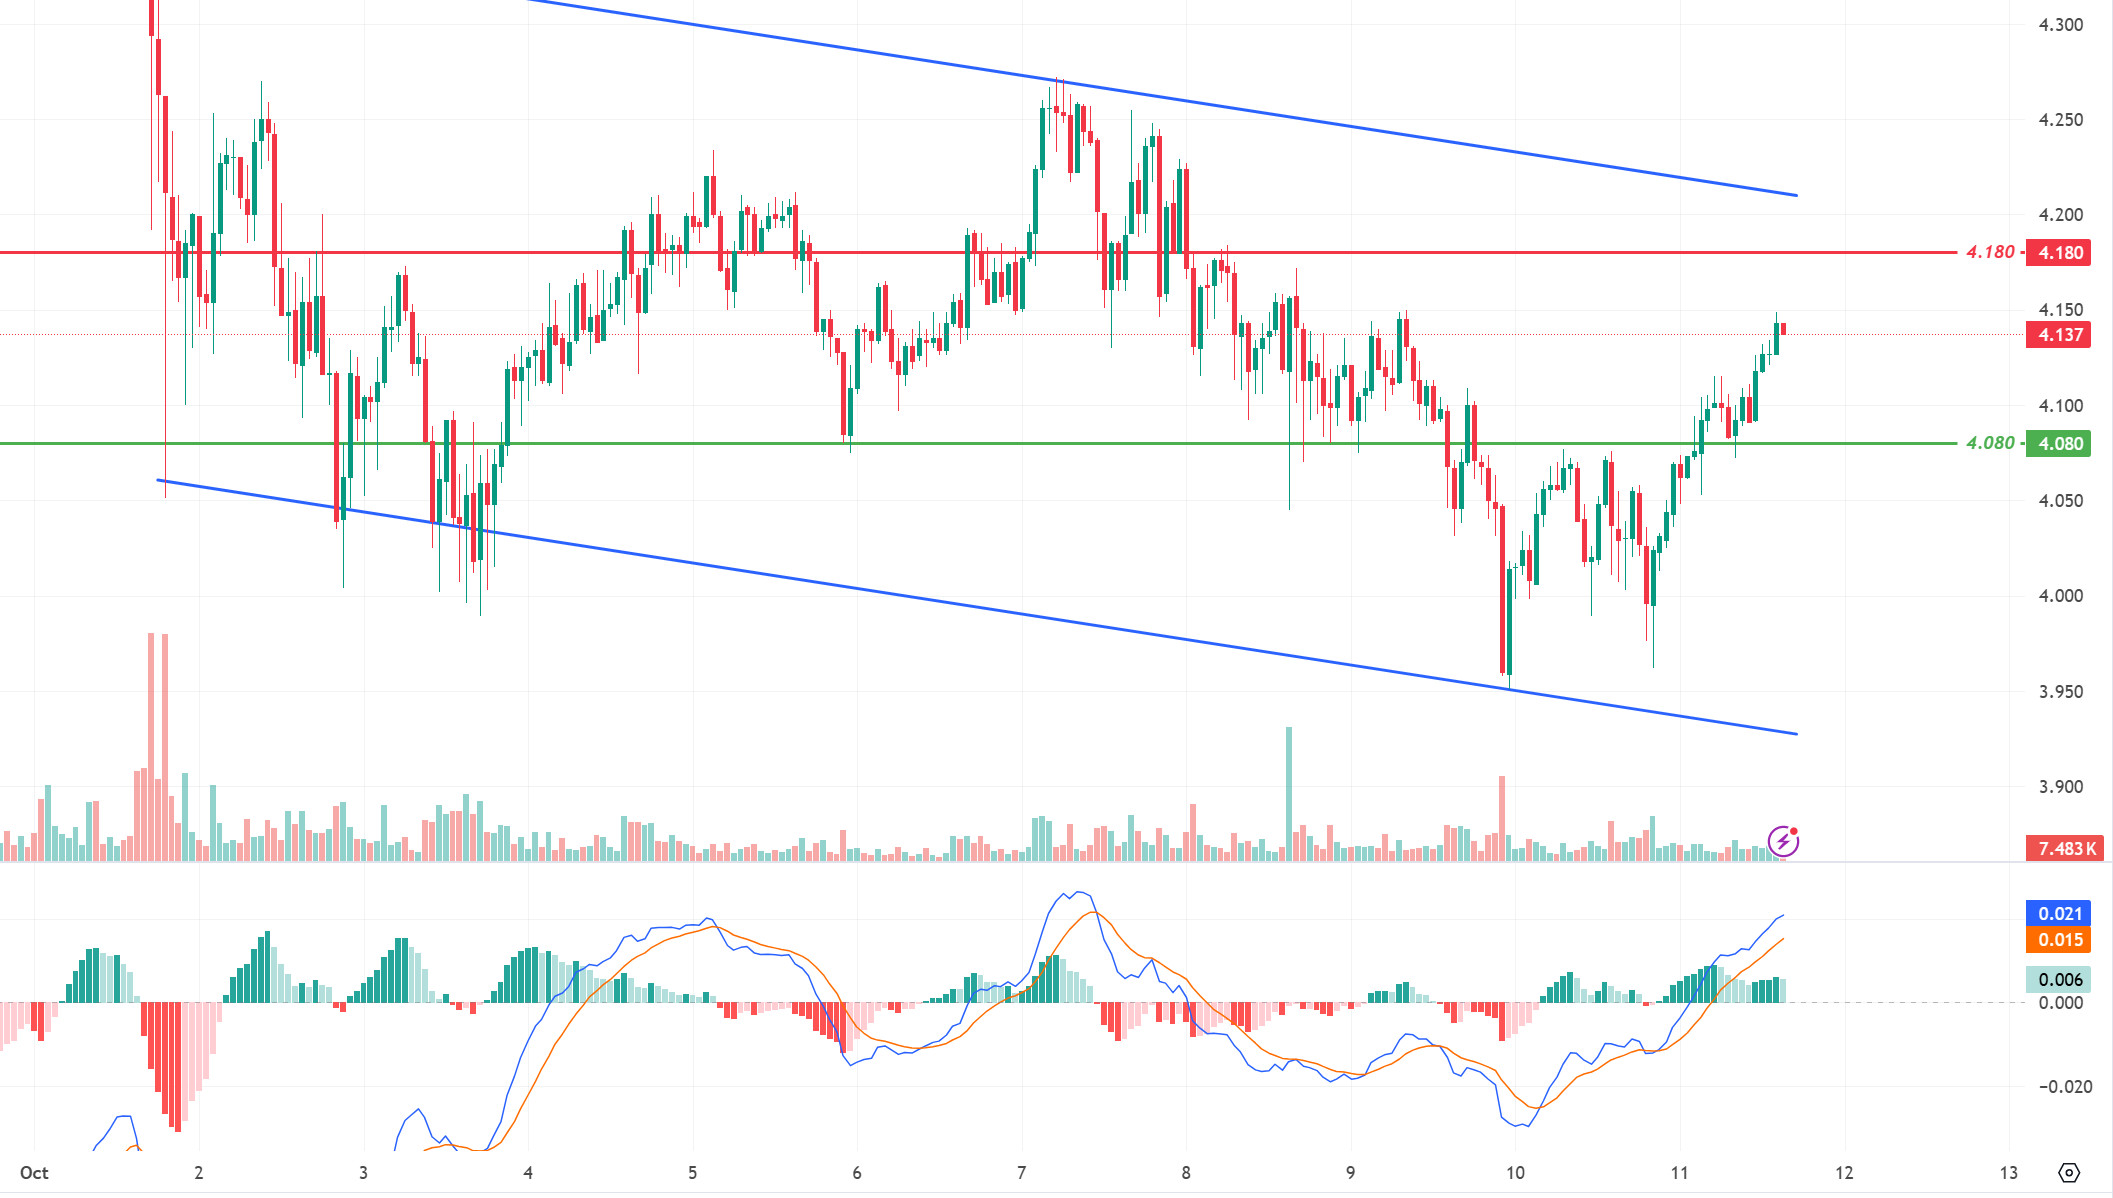
When we examine the Polkadot chart, the price has achieved persistence above the 4.080 level. Staying above the 4.080 level, the price is moving towards the resistance level of 4.180 band. When we examine the MACD oscillator, we can say that the buyer pressure increased compared to the previous hour. In a positive scenario, the price may want to break the selling pressure at 4,180. On the other hand, if the price wants to make a correction with the decrease in buying power, the first reaction may be the 4.080 band.
Supports 4.080 – 4.010 – 3.975
Resistances 4.180 – 4.210 – 4.250
SHIB/USDT
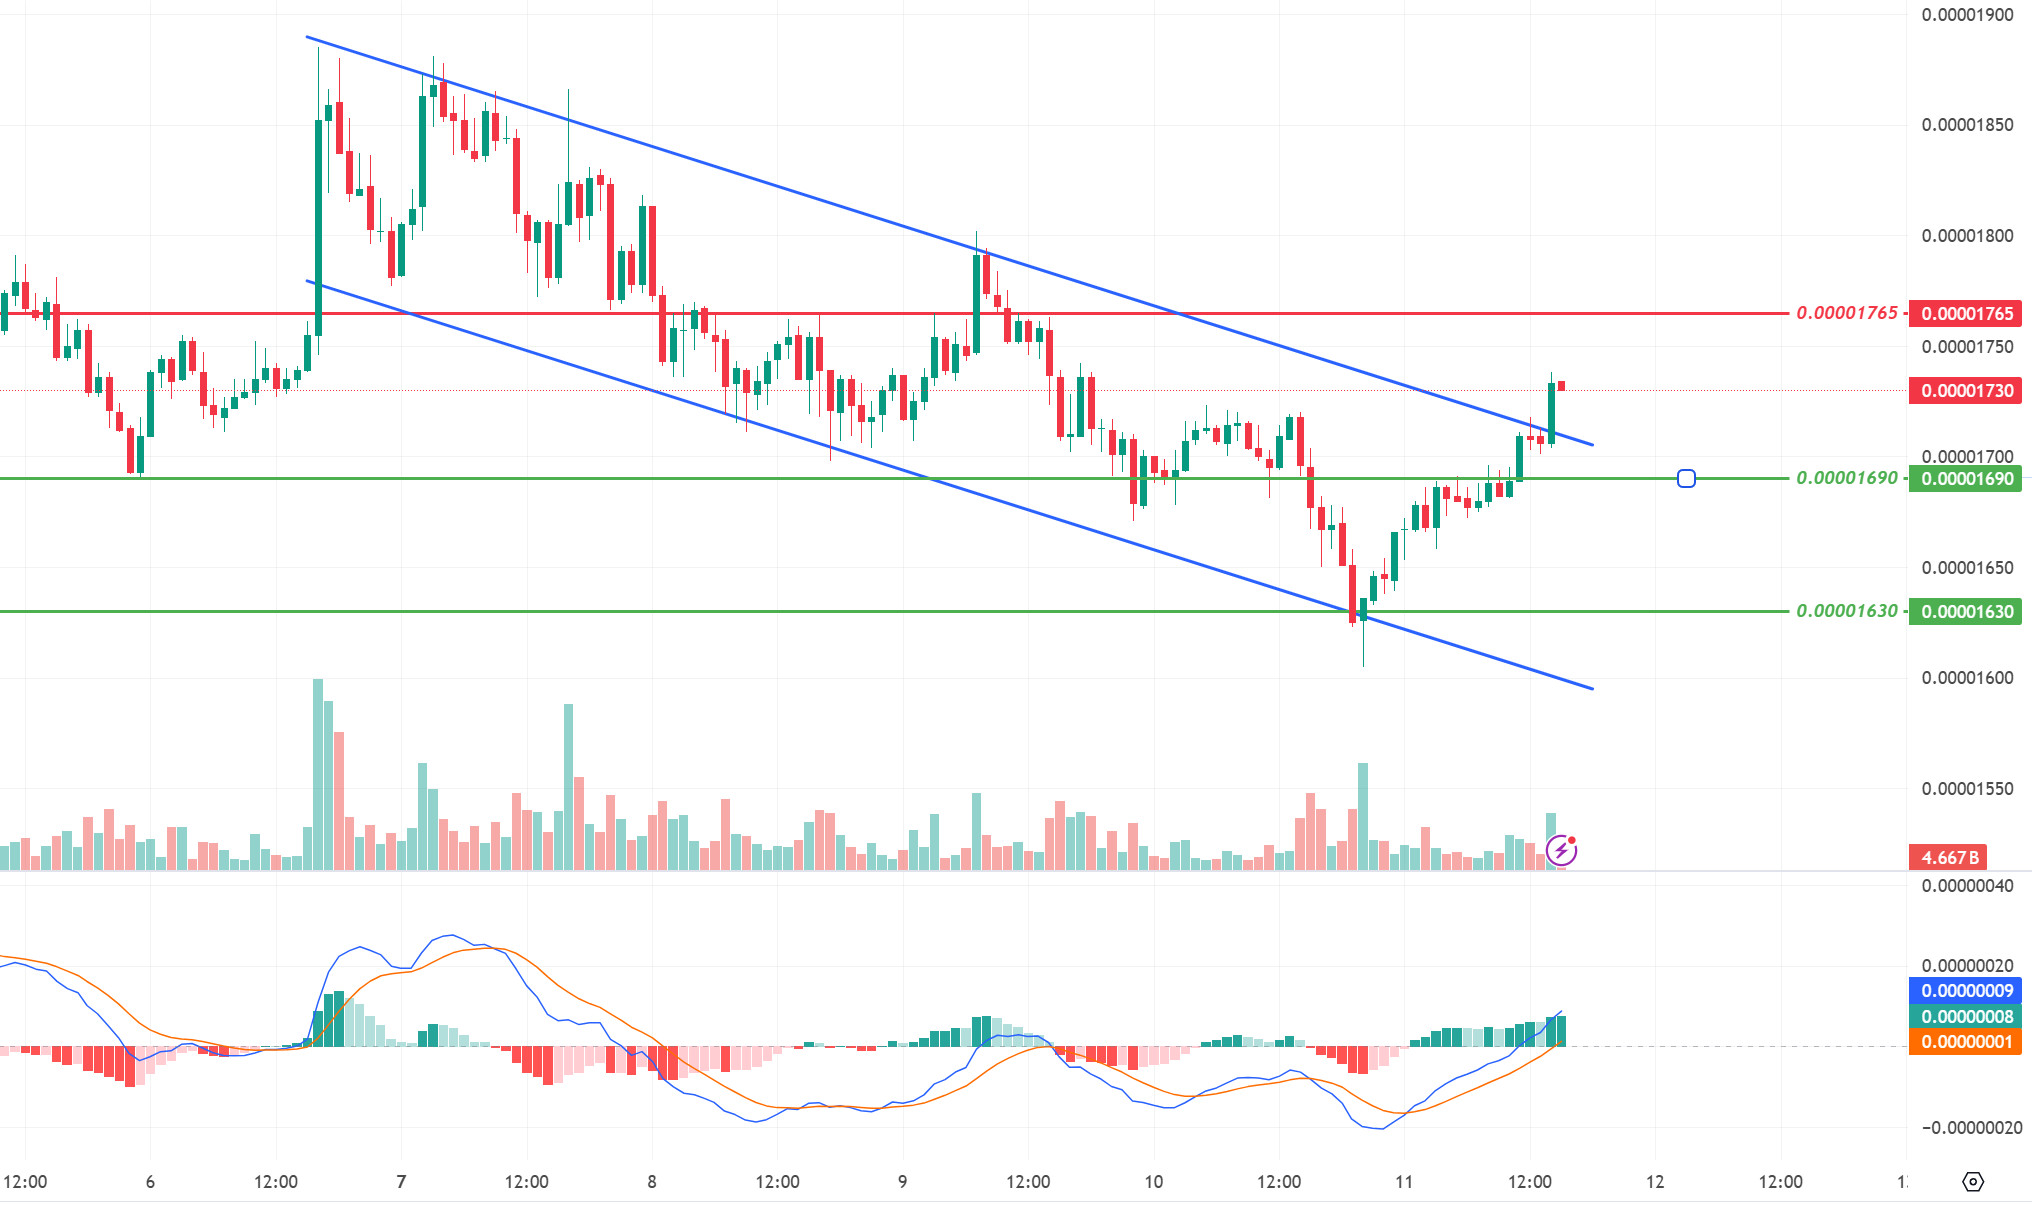
Shiba Inu (SHIB) broke the downtrend up. SHIB, which moved up with the reaction from 0.00001630 levels, rose to 0.00001740 levels with the upside break of the downtrend on the RSI. According to the MACD oscillator, we can say that the buyer pressure increased compared to the previous hour. In this context, the price may move towards the 0.00001765 resistance level. If the rise hardens with the trend breakout, we may see a rise up to 0.00001810 resistance levels. On the other hand, as a correction of this rise, the price may retreat towards 0.00001690 levels.
Supports 0.00001690 – 0.00001630 – 0.00001565
Resistances 0.00001765 – 0.00001810 – 0.00001865
LEGAL NOTICE
The investment information, comments and recommendations contained herein do not constitute investment advice. Investment advisory services are provided individually by authorized institutions taking into account the risk and return preferences of individuals. The comments and recommendations contained herein are of a general nature. These recommendations may not be suitable for your financial situation and risk and return preferences. Therefore, making an investment decision based solely on the information contained herein may not produce results in line with your expectations.
