MARKET SUMMARY
Latest Situation in Crypto Assets
| Assets | Last Price | 24h | Dominance | Market Cap |
|---|---|---|---|---|
| BTC | 64,864.00 | 3.47% | 56.85% | 1,28 T |
| ETH | 2,559.00 | 3.77% | 13.66% | 307,85 B |
| SOLANA | 152.94 | 3.74% | 3.19% | 71,80 B |
| XRP | 0.5384 | 1.15% | 1.35% | 30,50 B |
| DOGE | 0.1130 | 1.30% | 0.73% | 16,53 B |
| TRX | 0.1600 | -1.69% | 0.61% | 13,86 B |
| CARDANO | 0.3543 | 0.47% | 0.55% | 12,39 B |
| AVAX | 29.23 | 0.59% | 0.53% | 11,89 B |
| SHIB | 0.00001799 | 2.29% | 0.47% | 10,61 B |
| LINK | 11.02 | 0.97% | 0.31% | 6,91 B |
| DOT | 4.286 | 2.75% | 0.29% | 6,45 B |
*Prepared on 10.14.2024 at 14:00 (UTC)
WHAT’S LEFT BEHIND
Trump effect benefits Bitcoin and cryptocurrencies
With the US elections approaching, cryptocurrency markets have seen huge fluctuations, with $419 million flowing into Bitcoin. Investors are closing their risky positions, especially focusing on political developments. Ethereum, on the other hand, saw an outflow of $9.8 million and interest waned.
New crypto step from Harris as she falls behind Trump
Kamala Harris, who has fallen behind Donald Trump in polls and betting sites, has now started working on a package that will support black Americans more economically. From easy credit to real estate payment subsidies and cryptocurrencies, Harris is reportedly aiming to stay neck and neck in the race again.
HIGHLIGHTS OF THE DAY
Important Economic Calendar Data
| Time | News | Expectation | Previous |
|---|---|---|---|
| 19:00 | US FOMC Member Waller Speaks | ||
| 21:00 | US FOMC Member Kashkari Speaks |
INFORMATION:
*The calendar is based on UTC (Coordinated Universal Time) time zone. The economic calendar content on the relevant page is obtained from reliable news and data providers. The news in the economic calendar content, the date and time of the announcement of the news, possible changes in the previous, expectations and announced figures are made by the data provider institutions. Darkex cannot be held responsible for possible changes that may arise from similar situations.
MARKET COMPASS
The upcoming US presidential election, tensions in the Middle East, the US Federal Reserve’s (FED) monetary policy shift and the balance sheets of the country’s major companies continue to be on the agenda of global markets. In addition, China’s economy and stimulus measures on the Asian front and further interest rate cuts in Europe are also under the spotlight.
The new week started mixed for traditional markets. Over the weekend, China’s Ministry of Finance’s announcements to support the economy did not go as expected and the Ministry refrained from releasing specific figures. Crypto assets, which have been rumored for some time to be used by investors to fund new purchases of the country’s stocks, which are thought to gain value with incentives, seem to be positively affected by this situation.
As we have stated in our previous reports, we think that the main direction for digital assets is up and we will not be surprised to see some retracement after the rise that started with the weekend.
US futures are slightly positive and the dollar remains strong. The US bond market will be closed today and liquidity may remain somewhat low. Therefore, potential pullbacks or continuation of the uptrend in the rest of the day may be realized with occasional sharp movements.
TECHNICAL ANALYSIS
BTC/USDT
The Bitcoin wind continues to blow on the first day of the week. The election enthusiasm on the US side has turned Bitcoin into an election campaign. Kamala Harris taking steps in this direction against D.Trump causes us to experience a rally in Bitcoin price. The fact that institutions accompany Bitcoin funds in the cutthroat race is another factor that reinforces the rise.
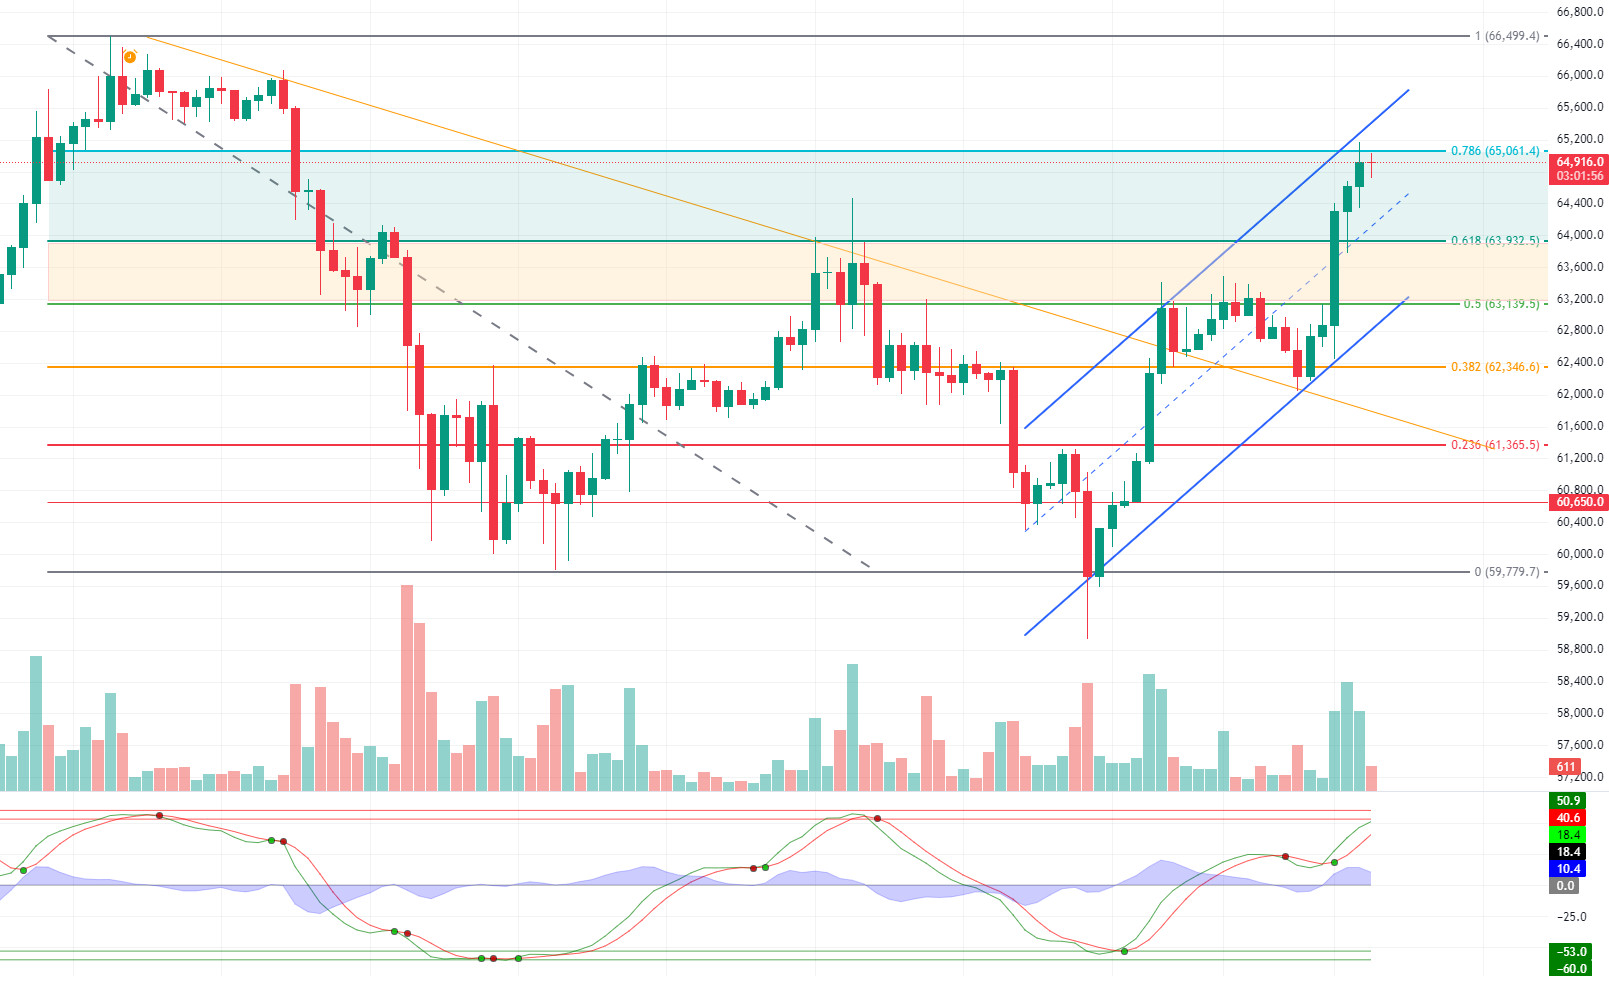
BTC continues to push the fibonacci resistance level of 0.786 (65,061) in the 4-hour technical analysis. BTC, which we observed preparing for a correction before the US market opened, displayed an upward attack again with the positive opening of the US opening session. With momentum weakening, our technical indicators are moving in the overbought zone hourly, which could trigger a possible correction. The support level we will follow in case of a pullback will be 0.618 (63.932).
Supports 63,932 – 63,139 – 62,346
Resistances 65,061 – 66,076 – 67,000
ETH/USDT
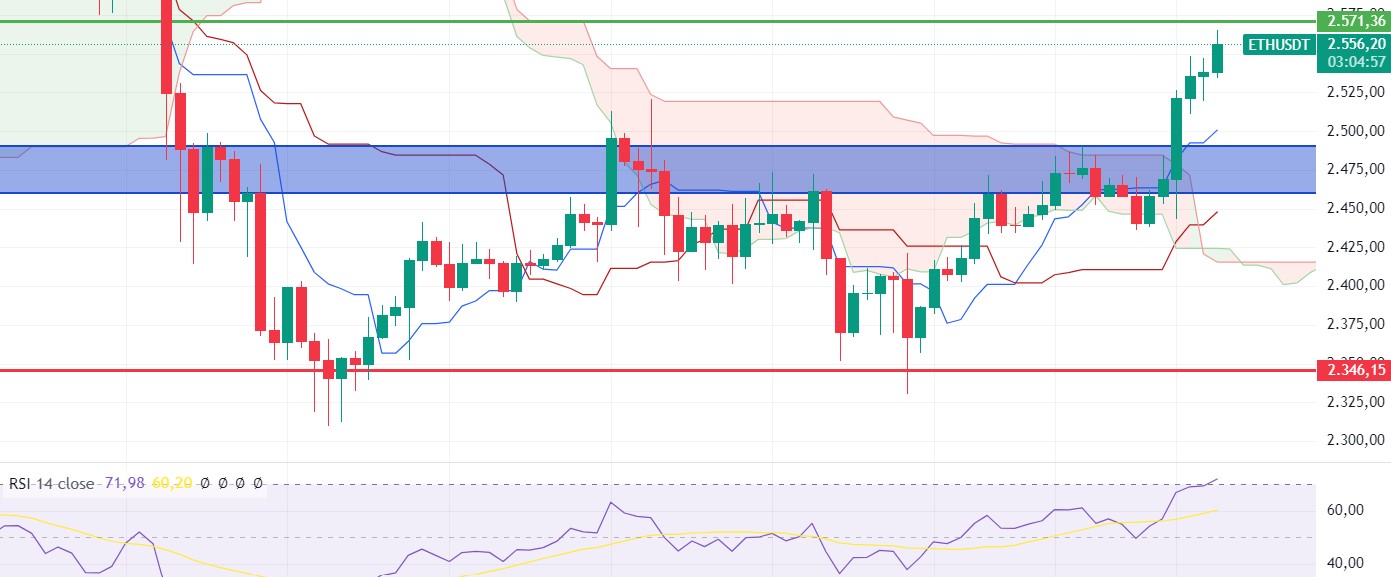
We have stated that Ethereum has a W pattern structure with a W pattern structure exceeding the 2,490 level and that the formation target is the 2,640 level. With its rise during the day, the probability of this pattern continues to rise. Rises up to the 2.571 level can be expected. With the break of this level, the 2,640 level can come quickly. The 2,490 level remains valid as the main support. Closures below this level may delay the positive trend and cause pullbacks to 2,460 – 2,400 levels. While the positive outlook in momentum and OBV continues, we see that RSI has entered the overbought zone. For this reason, it can be expected that the 2.571 level will be quickly exceeded or exceeded after a re-test to 2.540 levels.
Supports 2,490 – 2,460 – 2,400
Resistances 2,571 – 2,669 – 2,815
LINK/USDT
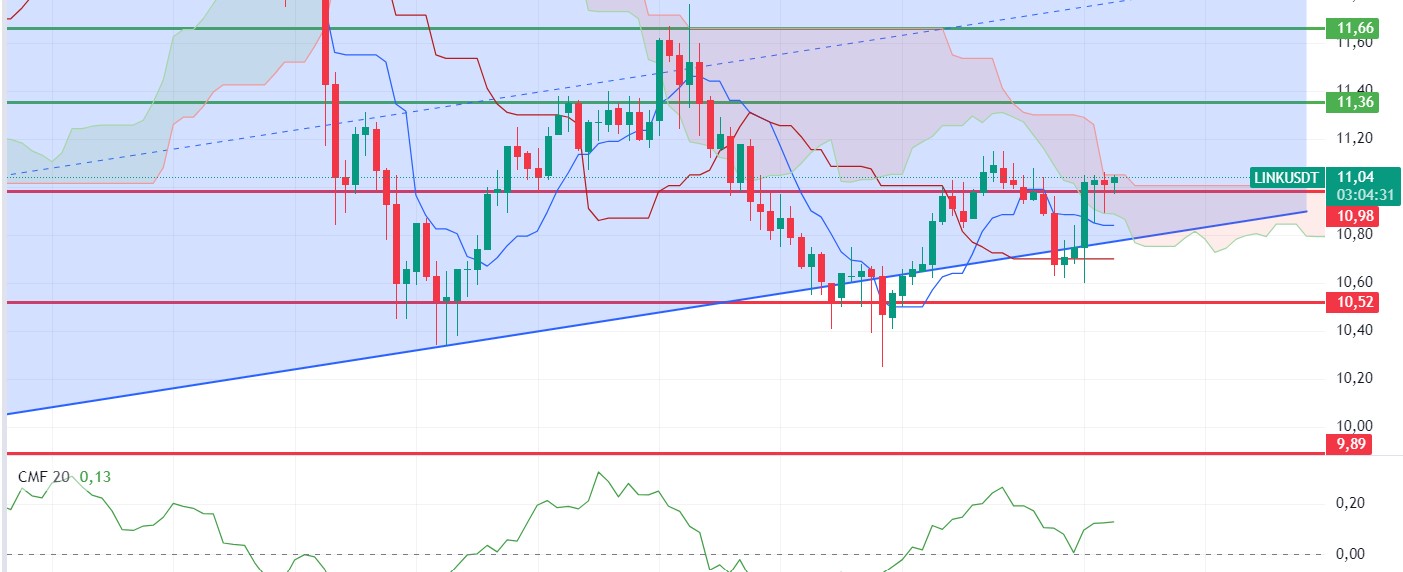
Although LINK broke through the 10.98 resistance, it seems to be stuck in the kumo cloud resistance. Looking at the volume and CMF, it is also noticeable that there is not enough buying appetite yet. Exceeding the 11.06 level of cloud resistance can quickly bring rises up to 11.36 levels during the day. The loss of the 10.98 level may trigger a decline back to the tenkan level of 10.84. For LINK, whose support and resistance areas are very close, it would be healthier for investors to determine the strategy according to the breakdown of the levels.
Supports 10.52 – 10.17 – 9.89
Resistances 10.98 – 10.36 – 11.66
SOL/USDT
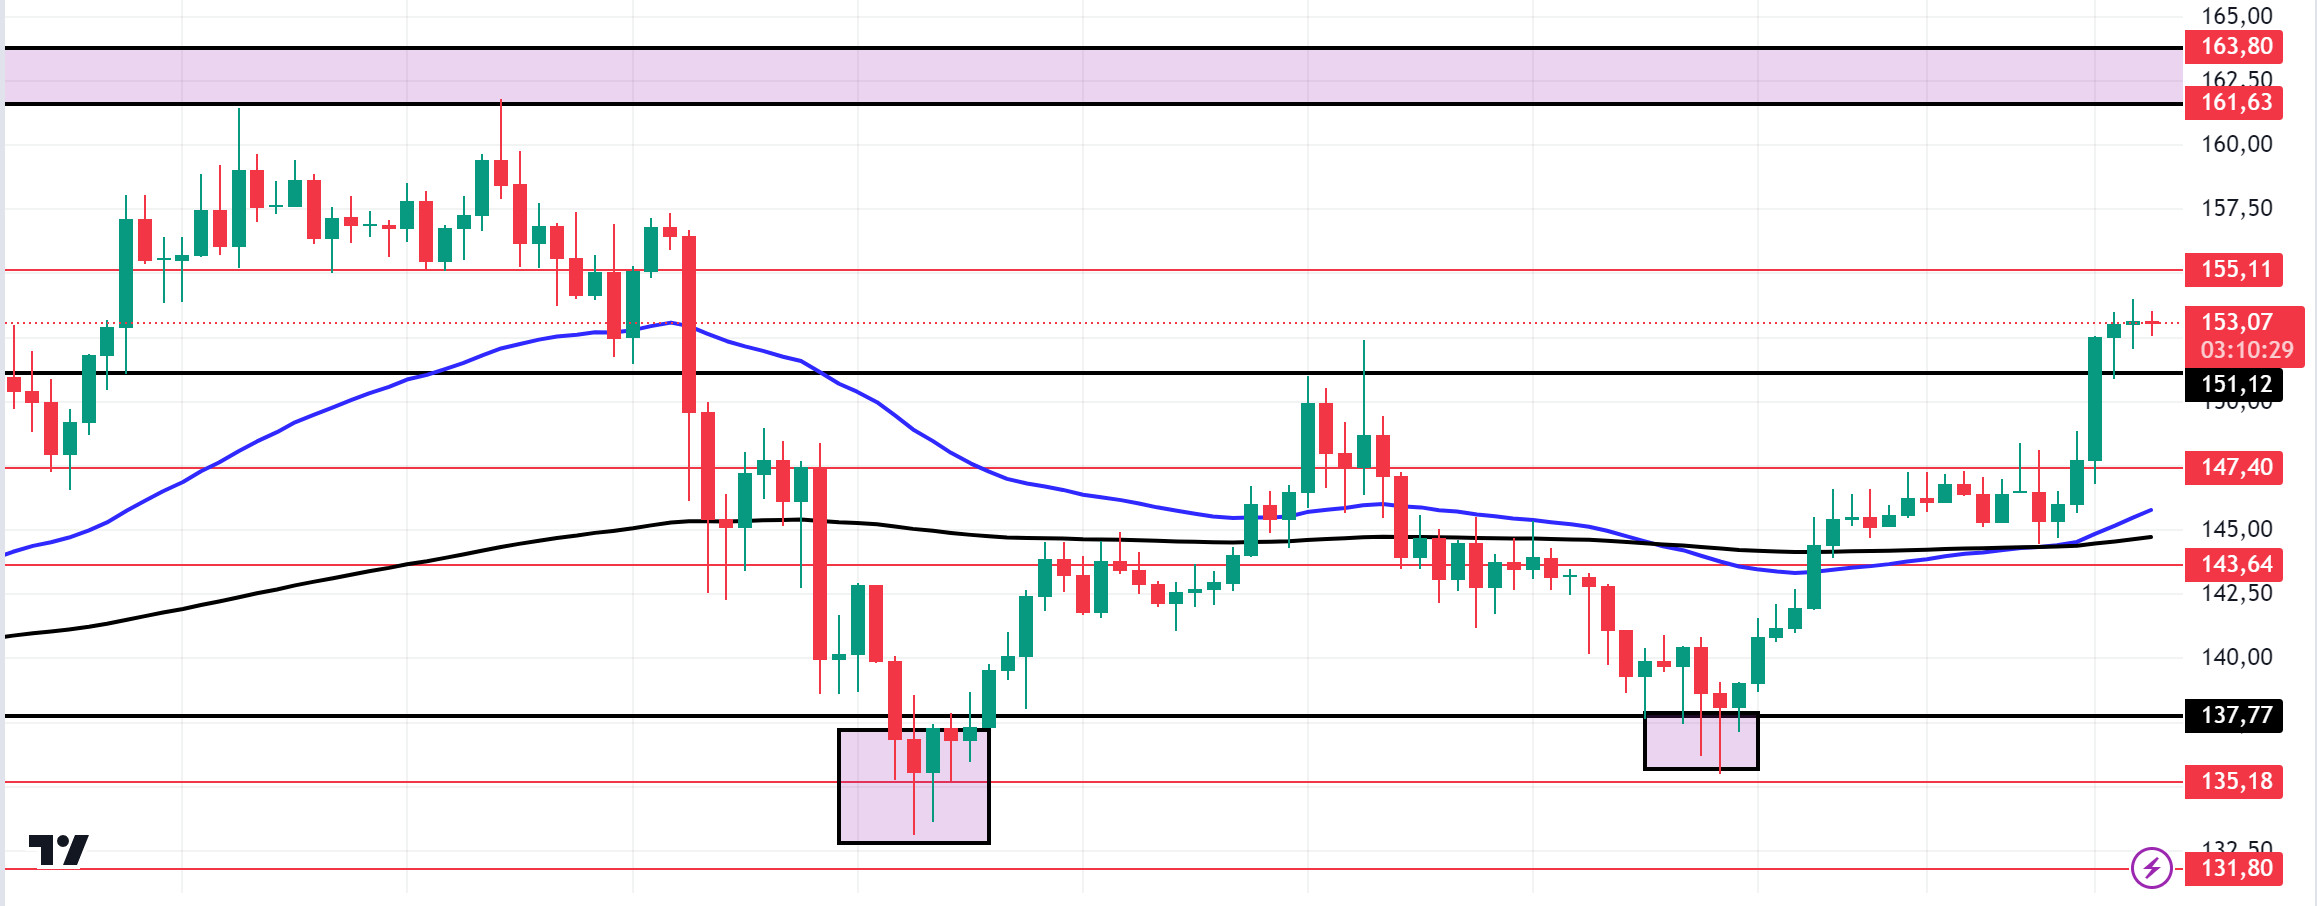
Since our morning analysis, SOL has increased by 1.36%. On the 4-hour timeframe, the 50 EMA crossed the 200 EMA, signaling a potential bullish breakout. This bullishness also means that it broke the symmetrical triangle pattern to the upside. It appears to have decisively broken the 151.12 level, an important resistance. This means that it could test the 163.80 level, the ceiling of the band where it has been consolidating for a long time. The 155.11 level appears as a place of resistance in the rises driven by both macroeconomic conditions and innovations in the Solana ecosystem. If it rises above this level, the rise may continue strongly. In the sales that investors will make due to macroeconomic conditions, the support level of 155.11 – 147.40, which is the place of retreat, should be followed. If the price comes to these support levels, a potential bullish opportunity may arise.
Supports 151.12 – 147.40 – 143.64
Resistances 155.11 – 161.63 – 163.80
ADA/USDT
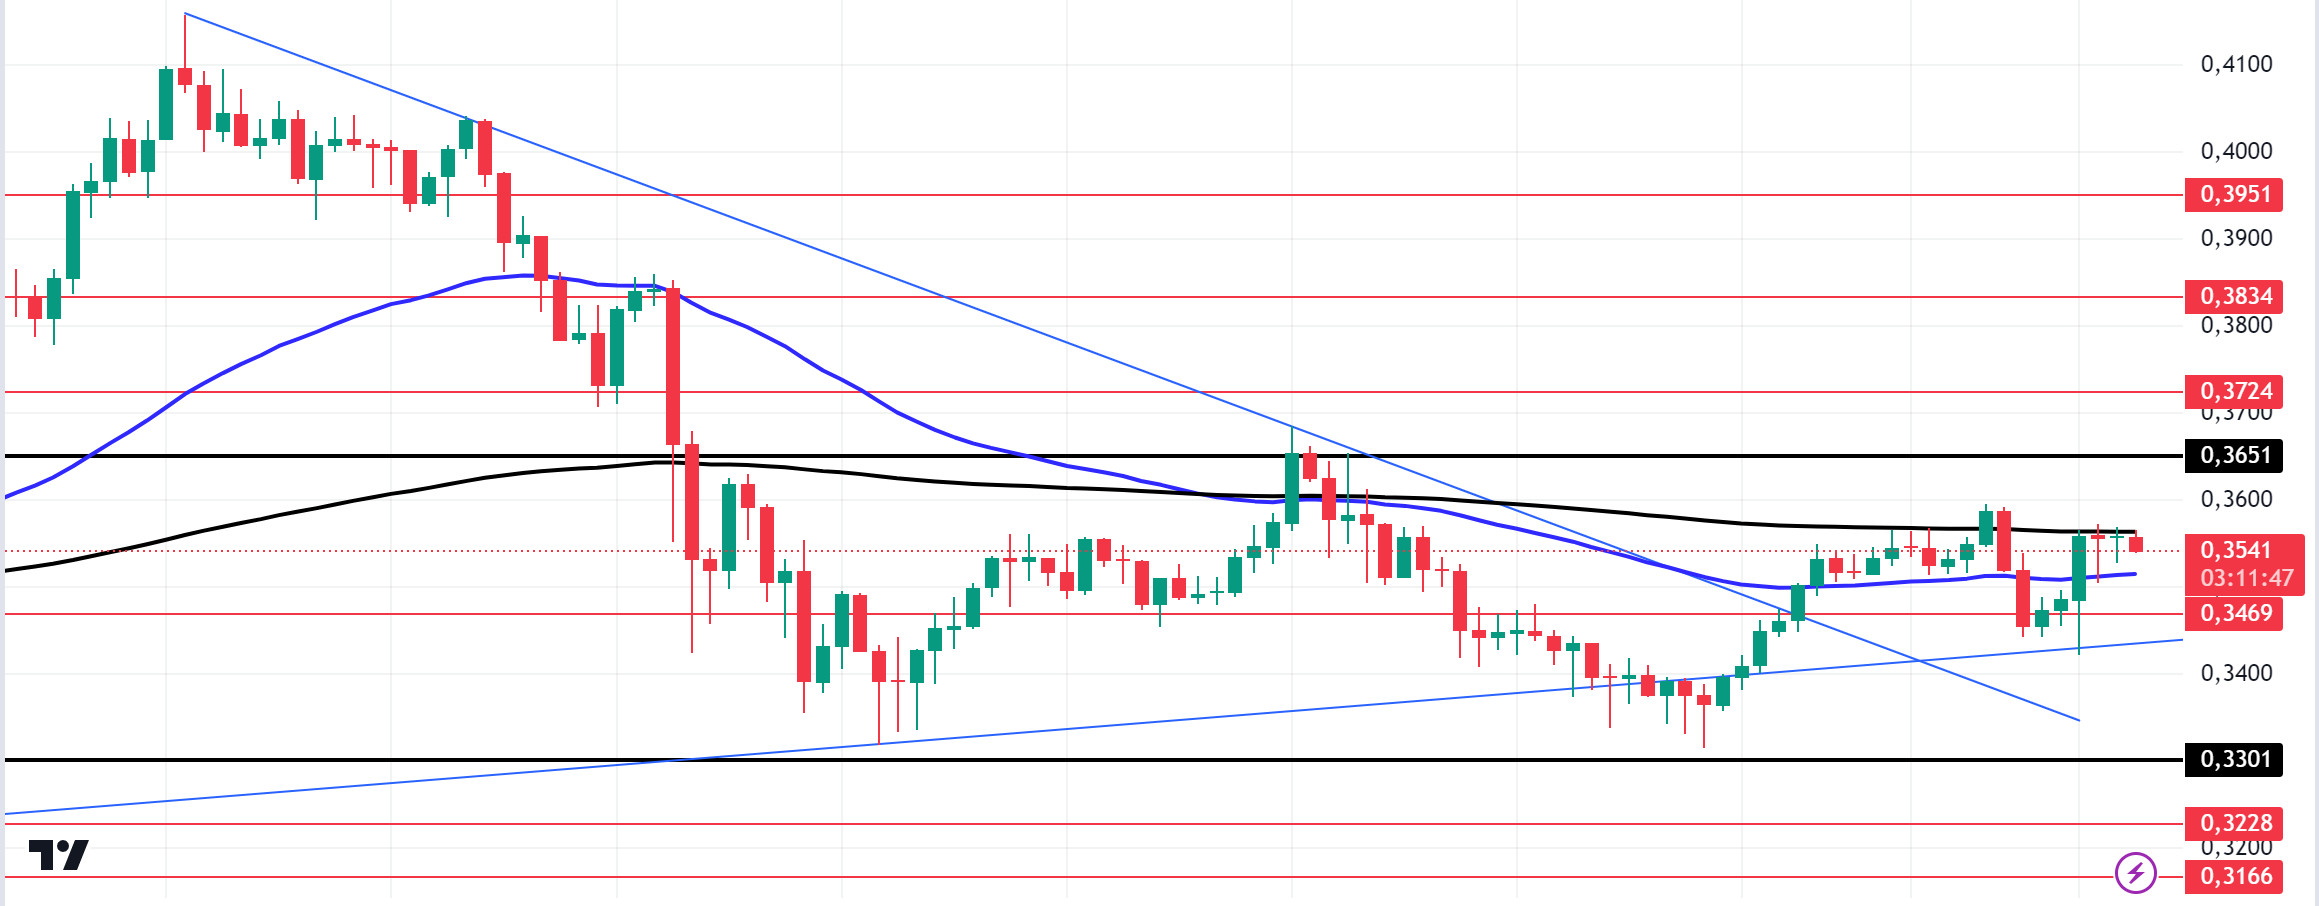
ADA has been flat since our analysis in the morning. On the 4-hour chart, the downtrend that started on September 27 was broken by whale movements and seems to have received support from the downtrend level. This could be a bullish sign. On the other hand, the 50 EMA continues to hover below the 200 EMA. 200 EMA has become resistance to the price. More signals may be needed for a rise. However, a double bottom formed on our chart. If money flows continue to increase and macroeconomic data is positive for cryptocurrencies, the rise may continue. If the money flow decreases and macroeconomic data is negative for cryptocurrencies, 0.3301 is a strong support point and can be followed as a good buying place.
Supports 0.3469 – 0.3301 – 0.3228
Resistances 0.3651 – 0.3724 – 0.3834
AVAX/USDT
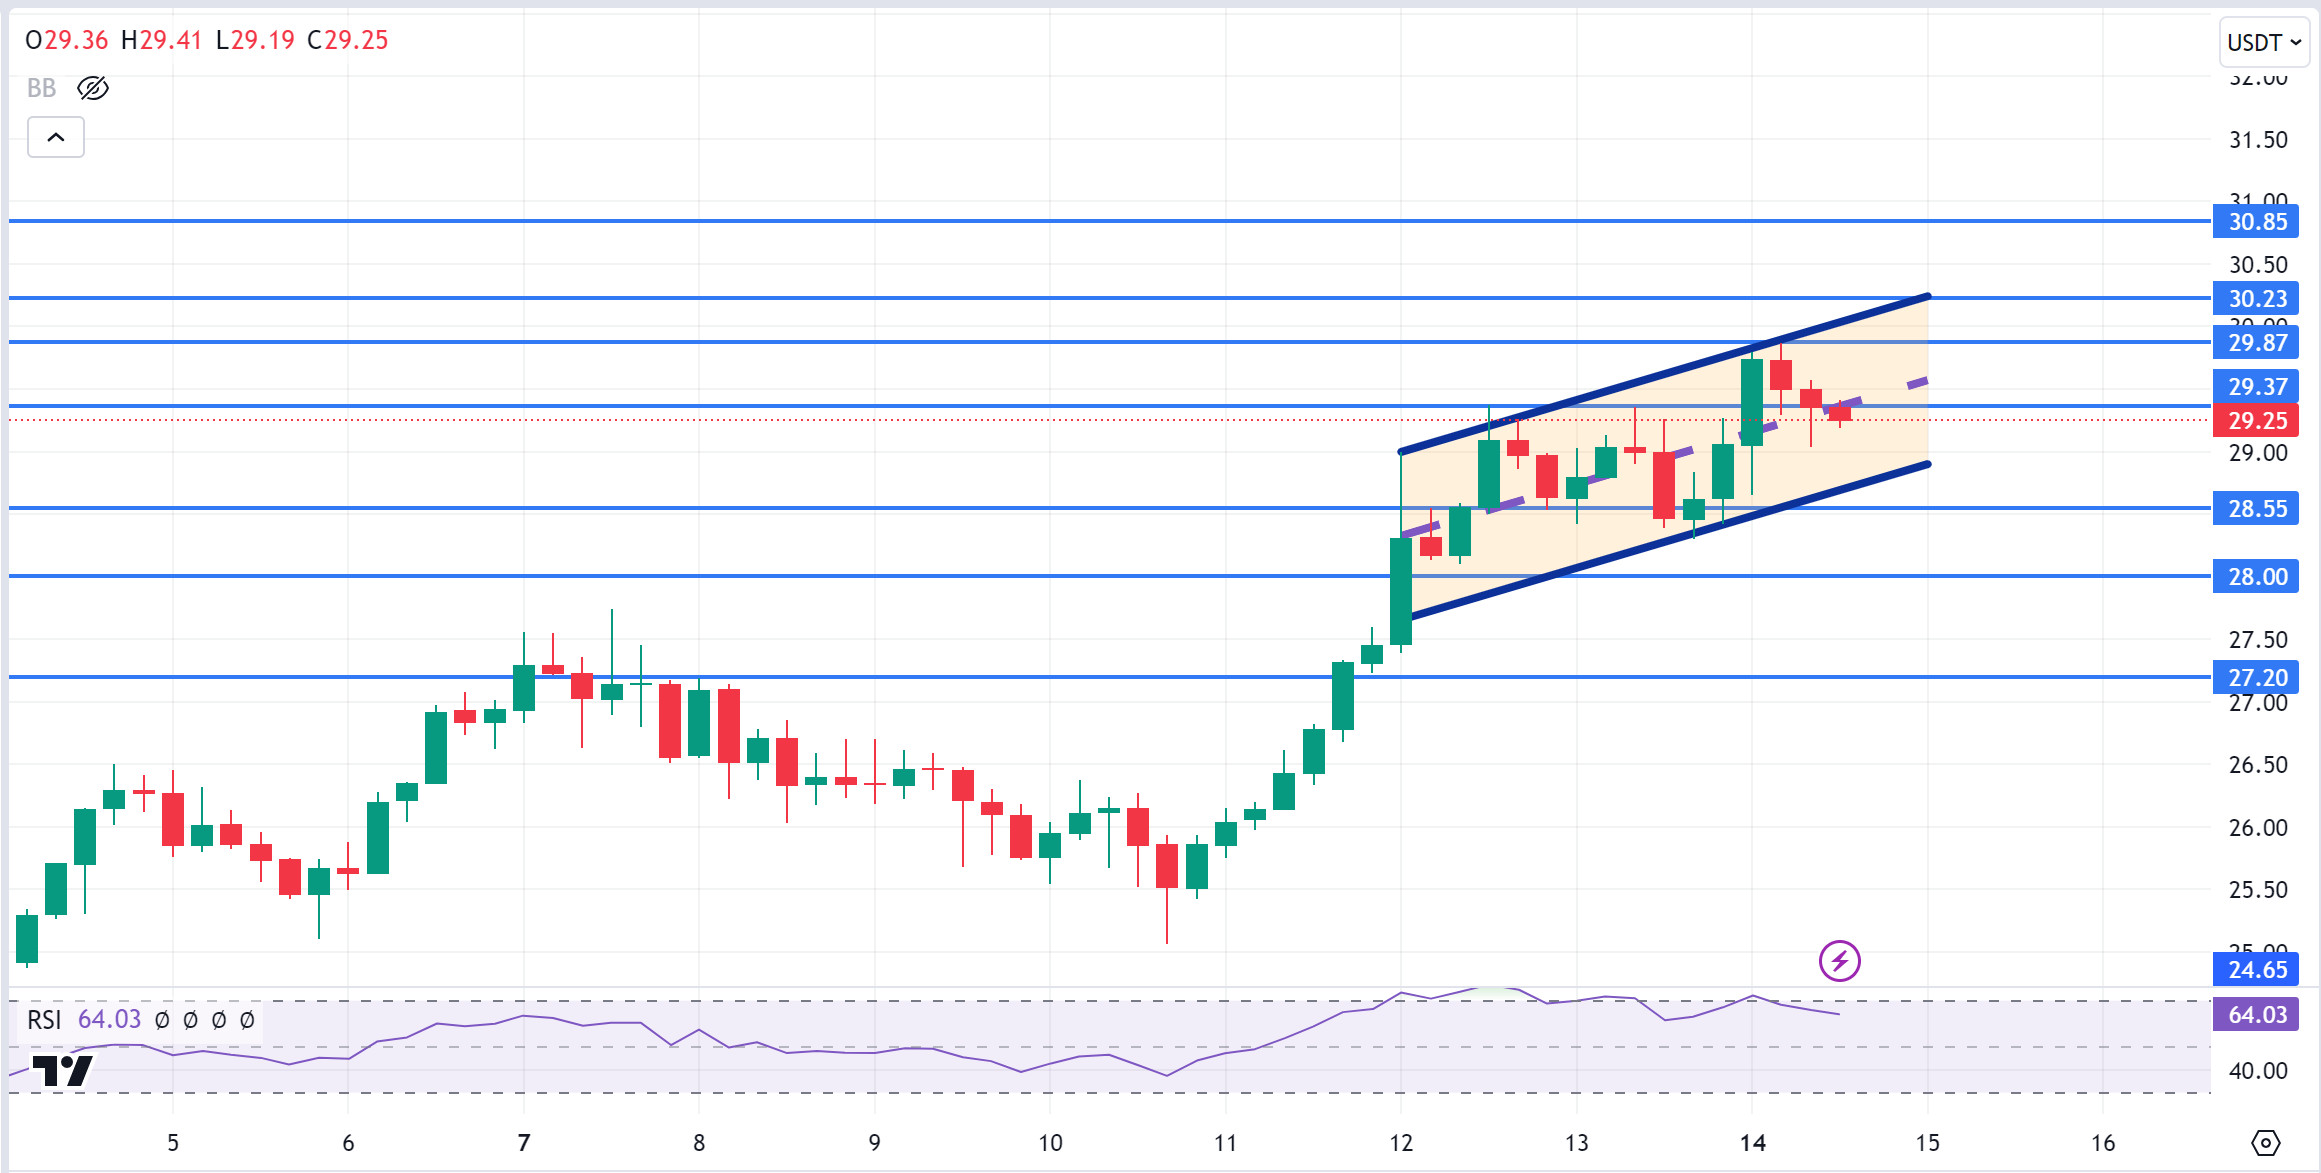
AVAX, which opened today at 29.05, is trading at 29.25, up about 1% during the day. Today may be a low volume day, especially since there is no planned data to be announced by the US and expected to affect the market. News flows from the Middle East will be important for the market.
On the 4-hour chart, it is moving in the middle band of the ascending channel. The RSI is very close to the overbought zone with a value of 64 and can be expected to move to the lower band from here. In such a case, it may test 28.55 support. In case of positive news that the tension in the Middle East is decreasing, purchases may increase. In such a case, it may test 29.87 resistance. As long as it stays above 24.65 support during the day, the desire to rise may continue. With the break of 24.65 support, sales may increase.
Supports 28.55 – 28.00 – 27.20
Resistances 29.37 – 29.87 – 30.23
TRX/USDT
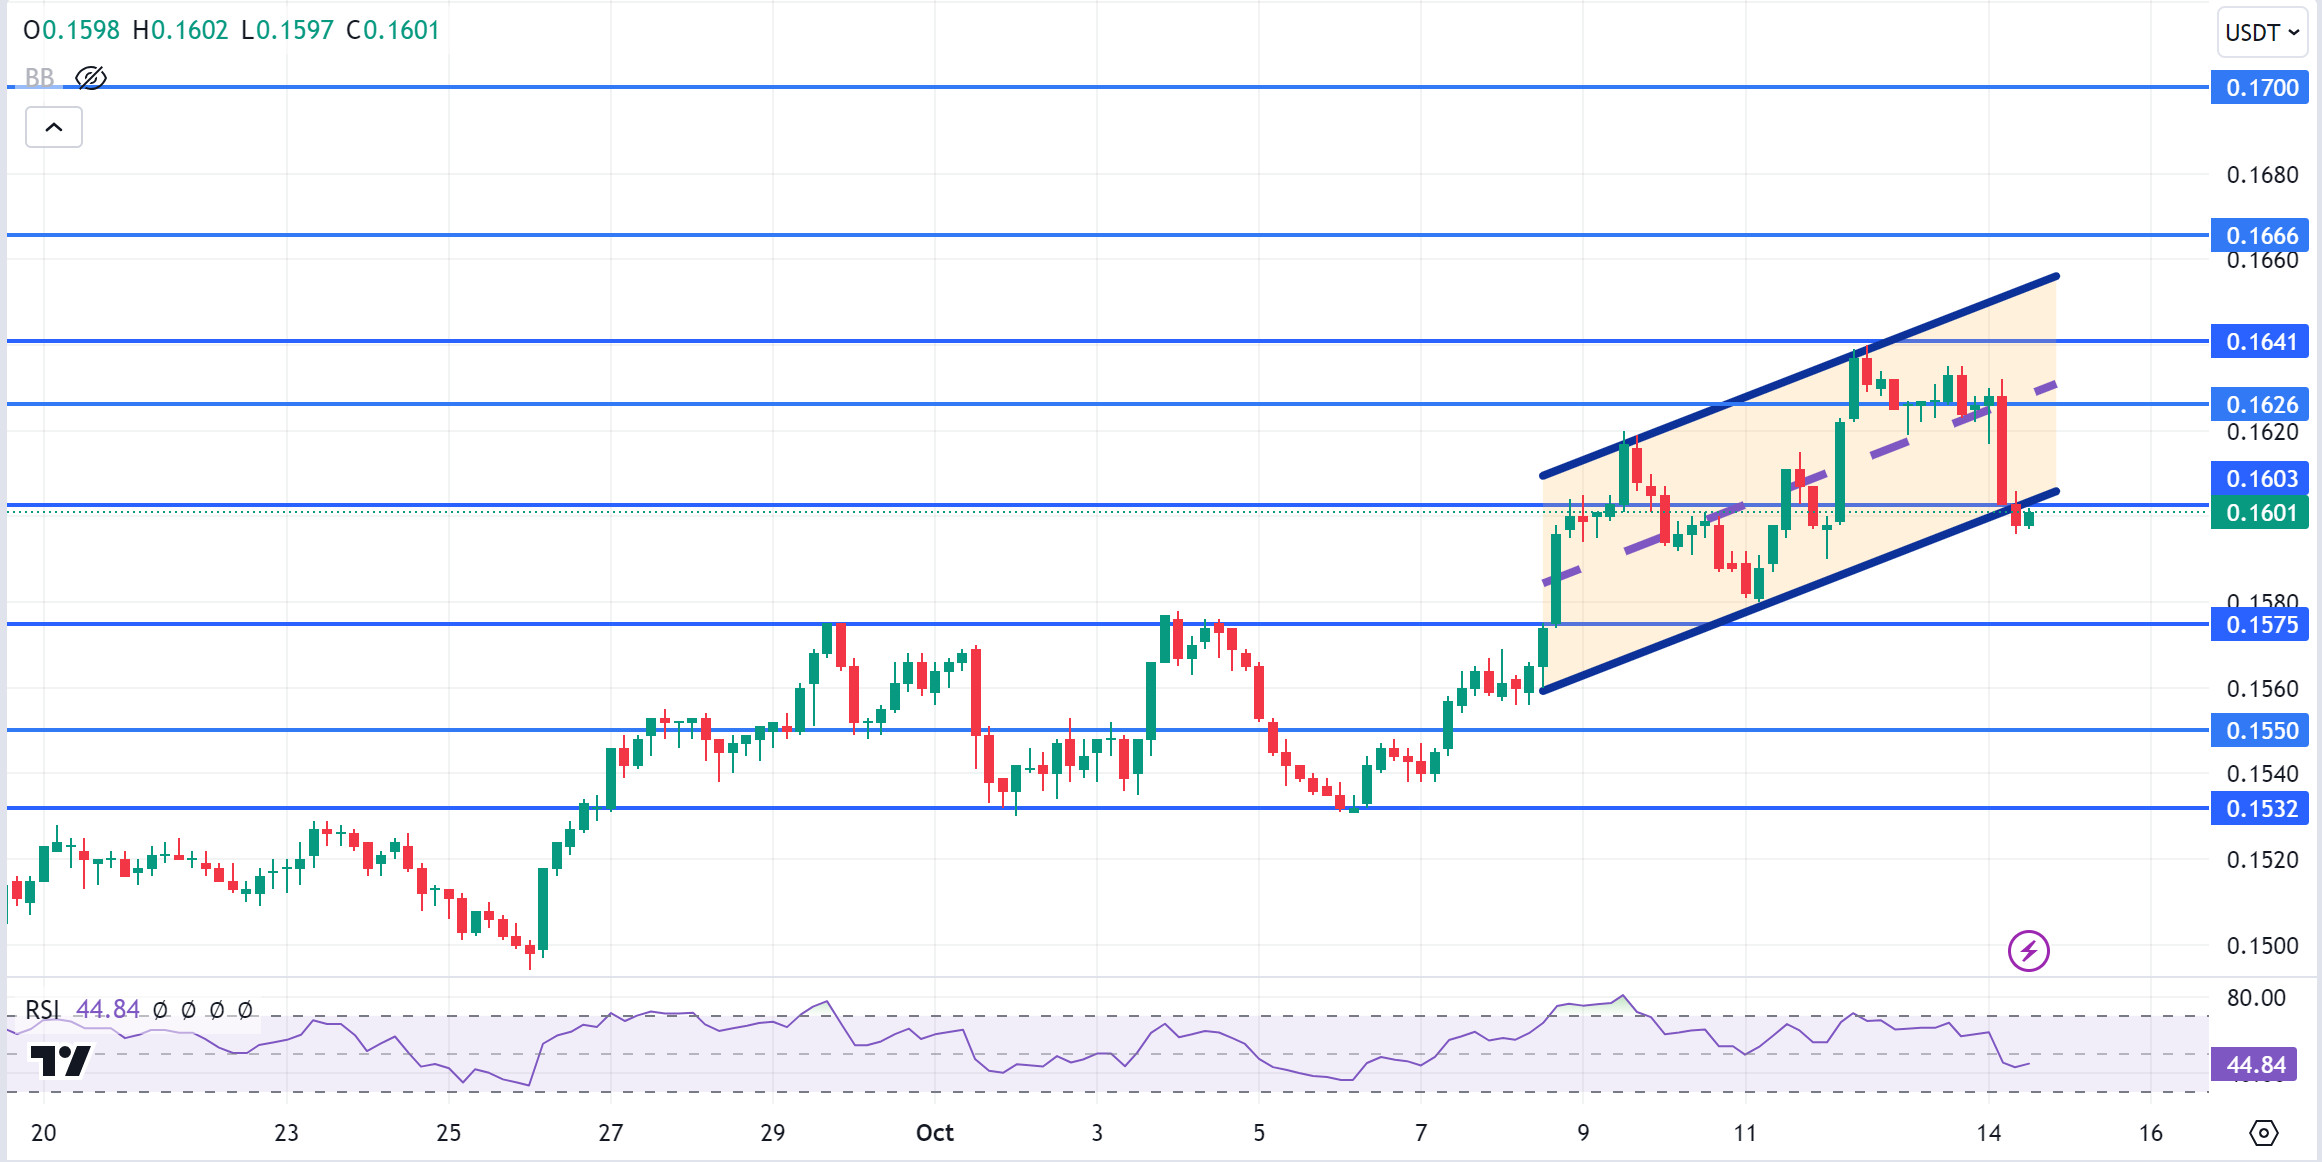
TRX, which started today at 0.1626, is trading at 0.1601, down about 1.5% during the day. There is no scheduled data for the market today. The market will be closely following the news flows regarding the tension in the Middle East.
On the 4-hour chart, it tries to break the lower band of the rising channel upwards. With the RSI value of 44, it can be expected to rise slightly from its current level. In such a case, it may move to the middle band of the channel and test the 0.1626 resistance. However, if it cannot close the candle above 0.1603 resistance, it may test 0.1575 support with the selling pressure that may occur. As long as TRX stays above 0.1482 support, the desire to rise may continue. If this support is broken downwards, sales can be expected to increase.
Supports 0.1575 – 0.1550 – 0.1532
Resistances 0.1603 – 0.1626 – 0.1641
XRP/USDT
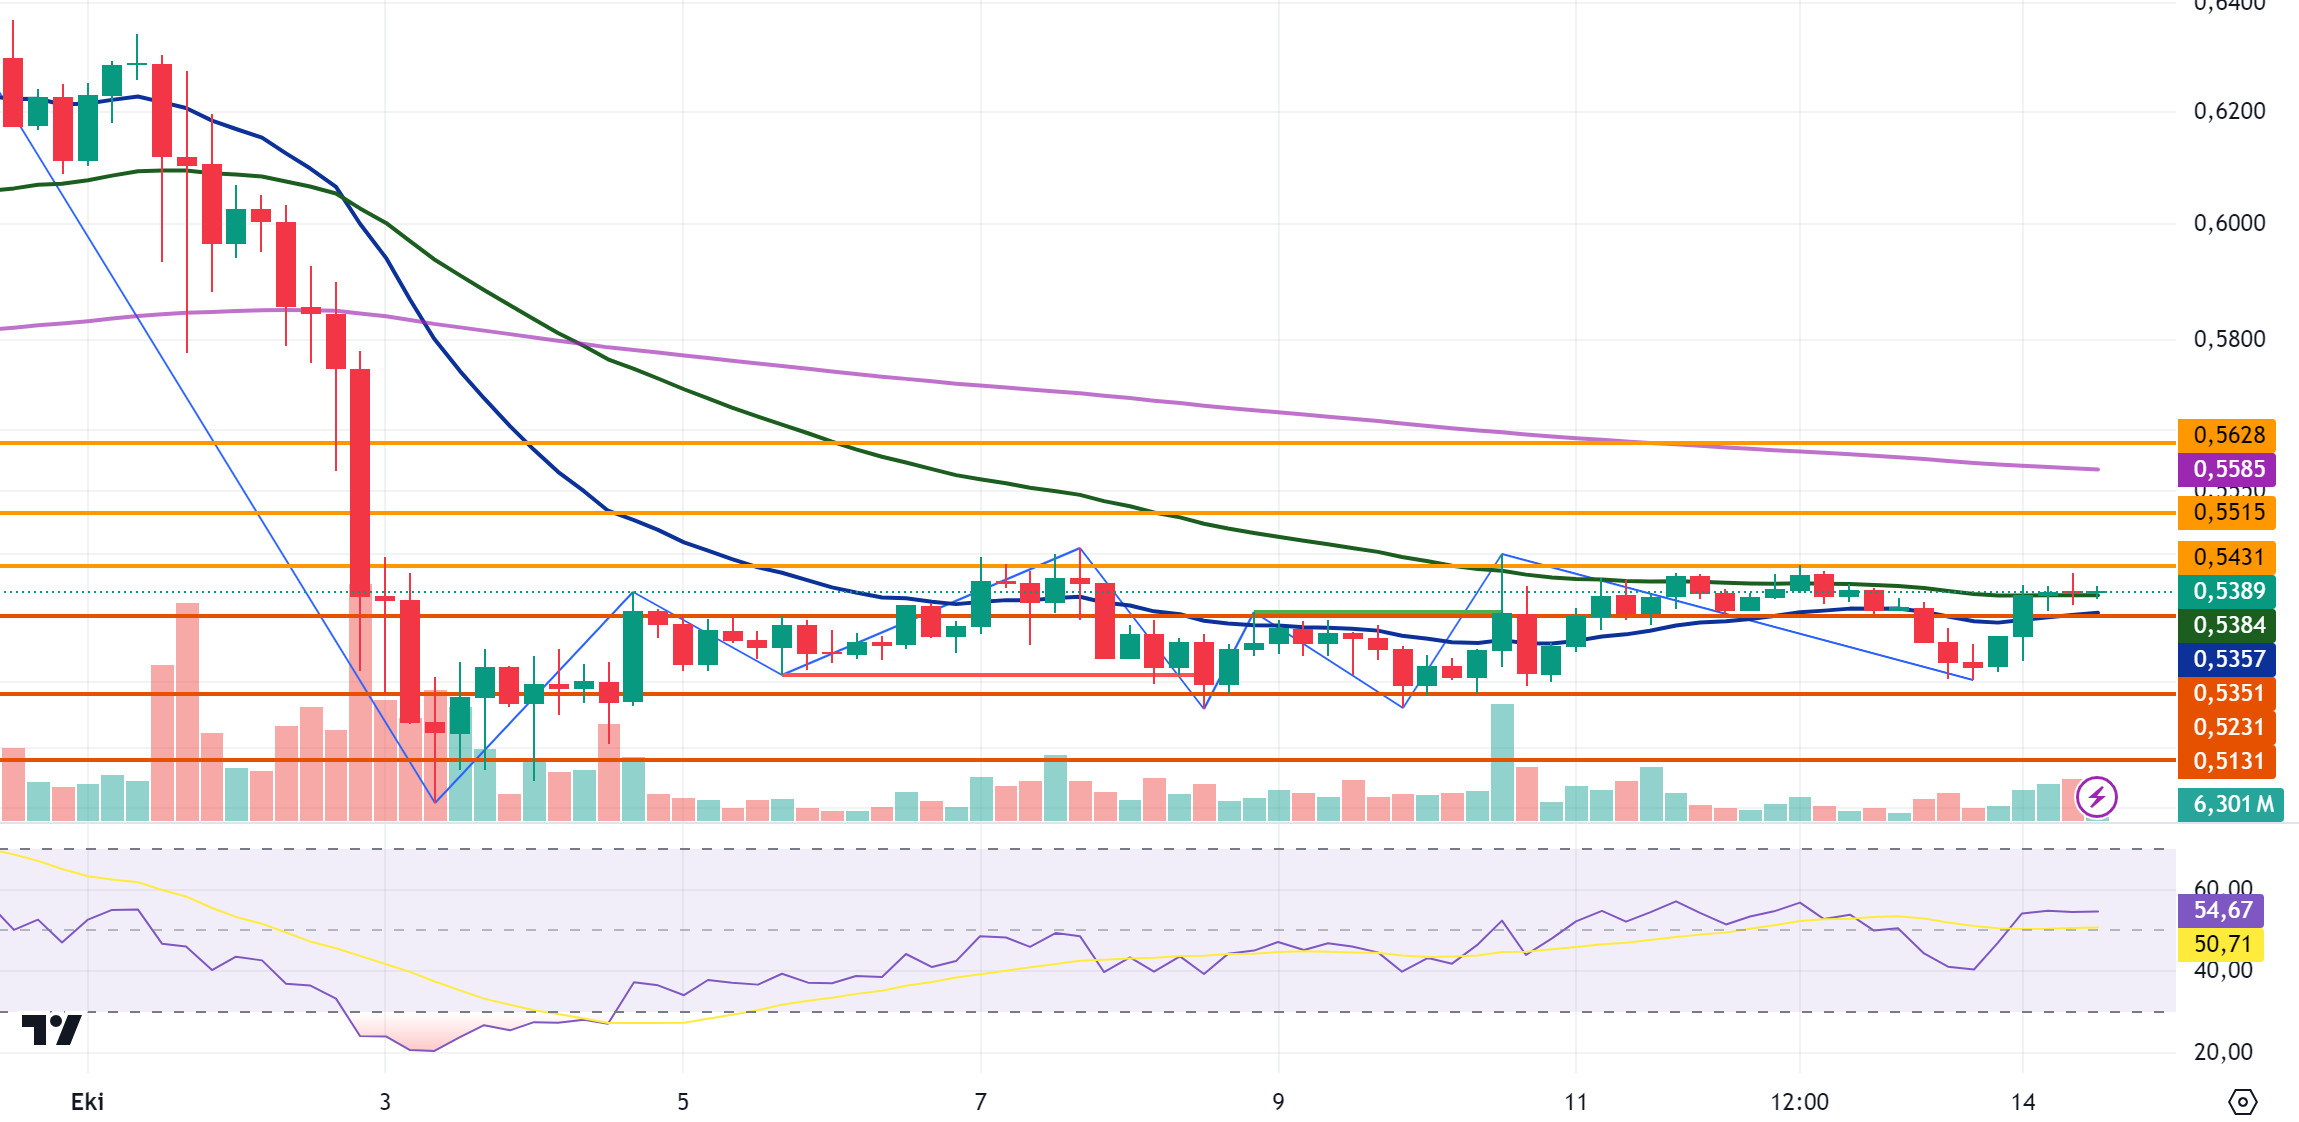
XRP saw the 0.5380 level on the opening candle in the 4-hour analysis today and then continues to move sideways at this level. XRP is currently trading at 0.5389. It is foreseeable that the sideways movement will continue in this period when there are no positive or negative developments in XRP. The RSI data is 54.67 and is in the neutral zone. The crypto market is in an uptrend and an increase in XRP value may also occur in this process. With the horizontal movement turning bullish, XRP may test the resistance levels of 0.5431-0.5515-0.5628. If it declines with possible negative developments, it may test the support levels of 0.5351-0.5231-0.5131.
As XRP moves within a horizontal band, momentary declines and rises may occur. In case of a decline, if the EMA20 and 0.5351 level are broken, the decline may deepen and offer a short trading opportunity. If it fails to break these levels and rises with possible purchases, it may offer a long trading opportunity.
EMA20 (Blue Line) – EMA50 (Green Line) – EMA200 (Purple Line)
Supports 0.5351 – 0.5231 – 0.5131
Resistances 0.5431 – 0.5515 – 0.5628
DOGE/USDT
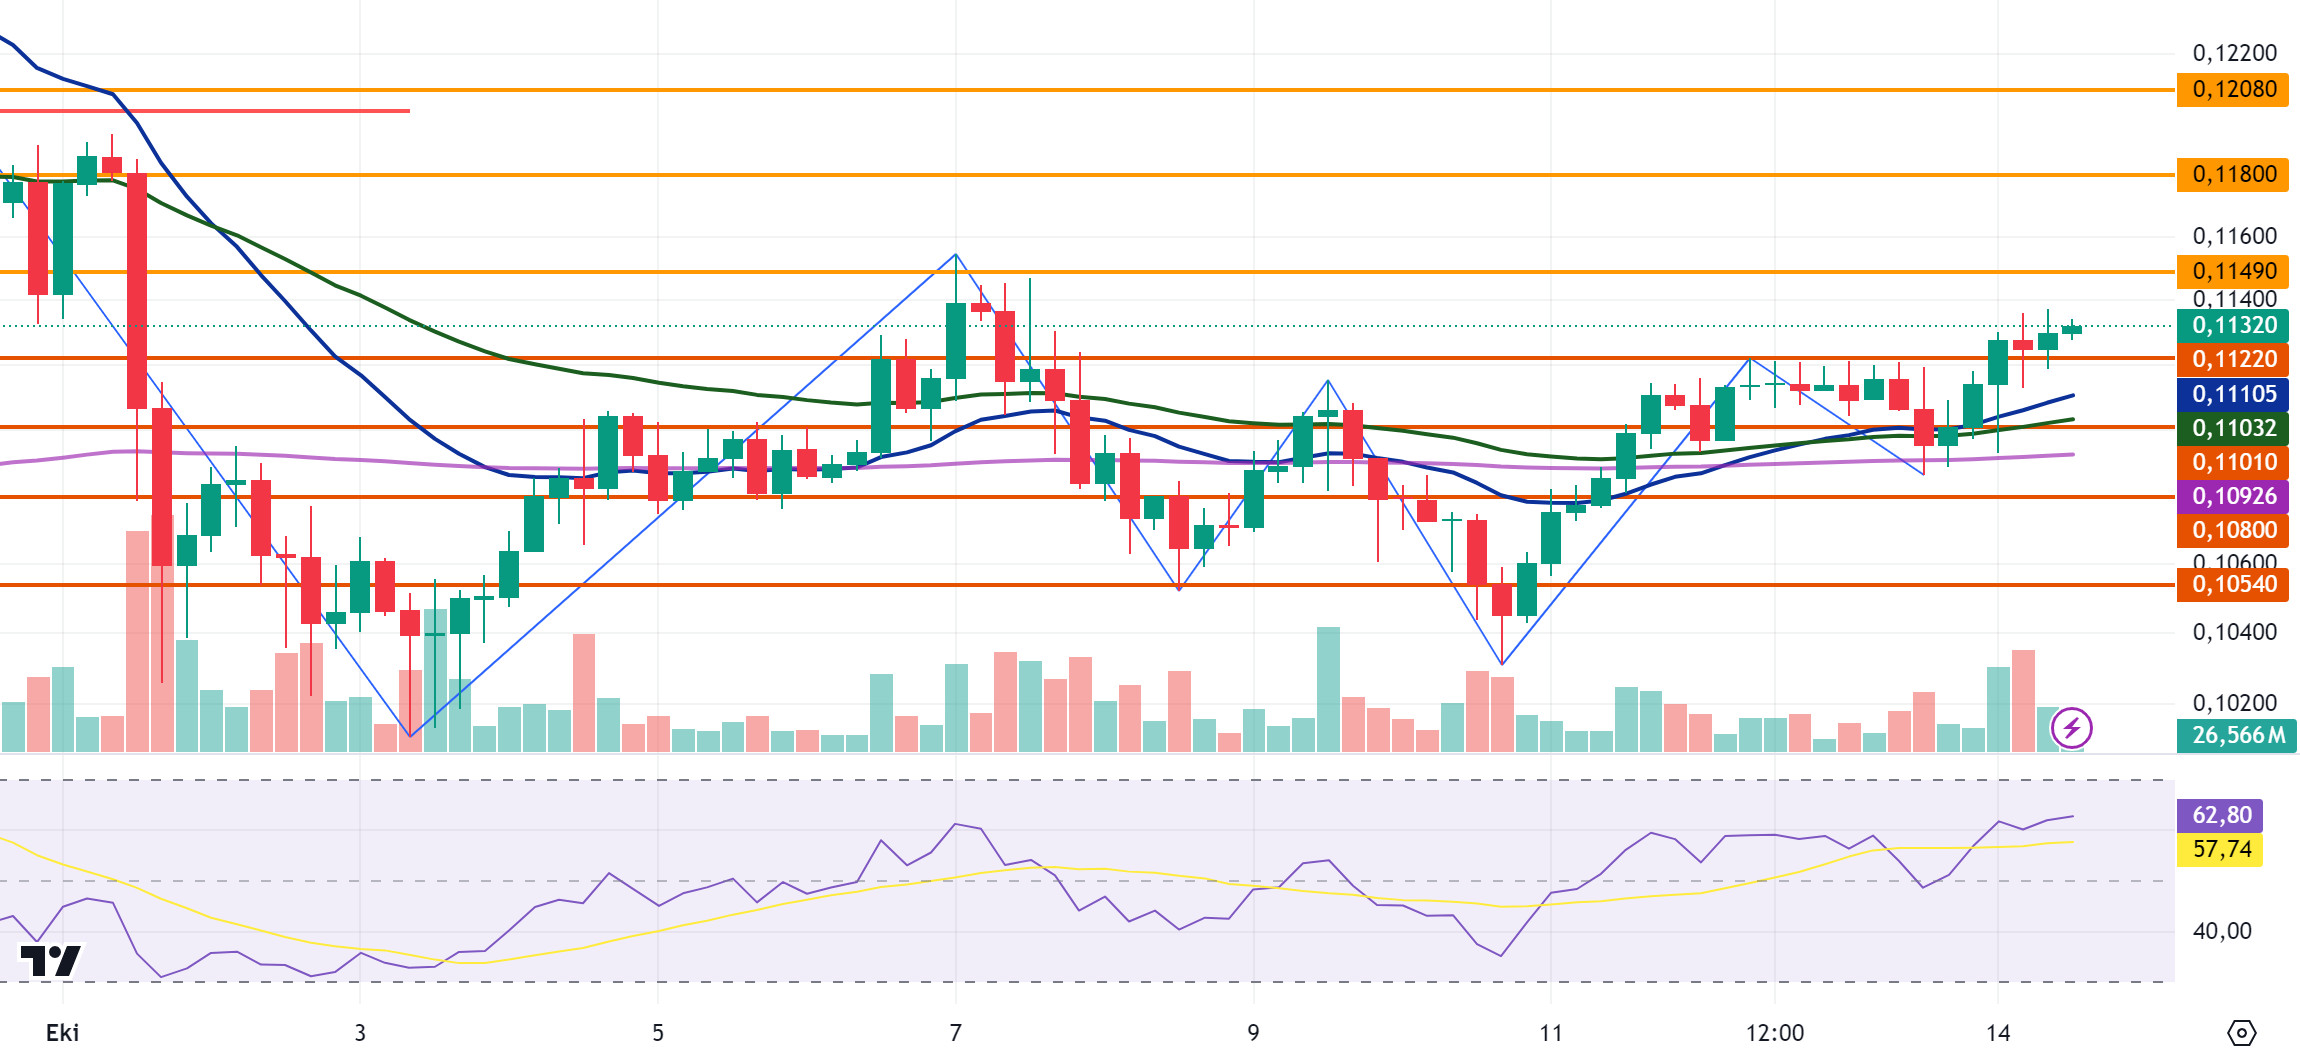
DOGE continues to trade between 0.1122 and 0.1149 levels after breaking the 0.1122 level with a rise on the opening candle on the 4-hour analysis. DOGE is currently trading at 0.1132 today, up 1.5% on a daily basis. The uptrend in the crypto market is also observed in DOGE, which moves in parallel with the market. If the rise in DOGE continues, it may test the resistance levels of 0.1122-0.1149-0.1180. In case of a decline, DOGE may test 0.1101-0.1080-0.1054 support levels with its decline.
DOGE may decline in its rise with possible sales at 0.1180 and may offer a short trading opportunity. In its decline, it may rise with purchases between 0.1100 and 0.1115 levels and may offer a long trading opportunity.
EMA20 (Blue Line) – EMA50 (Green Line) – EMA200 (Purple Line)
Supports 0.1101 – 0.1080 – 0.1054
Resistances 0.1122 – 0.1149 – 0.1180
DOT/USDT
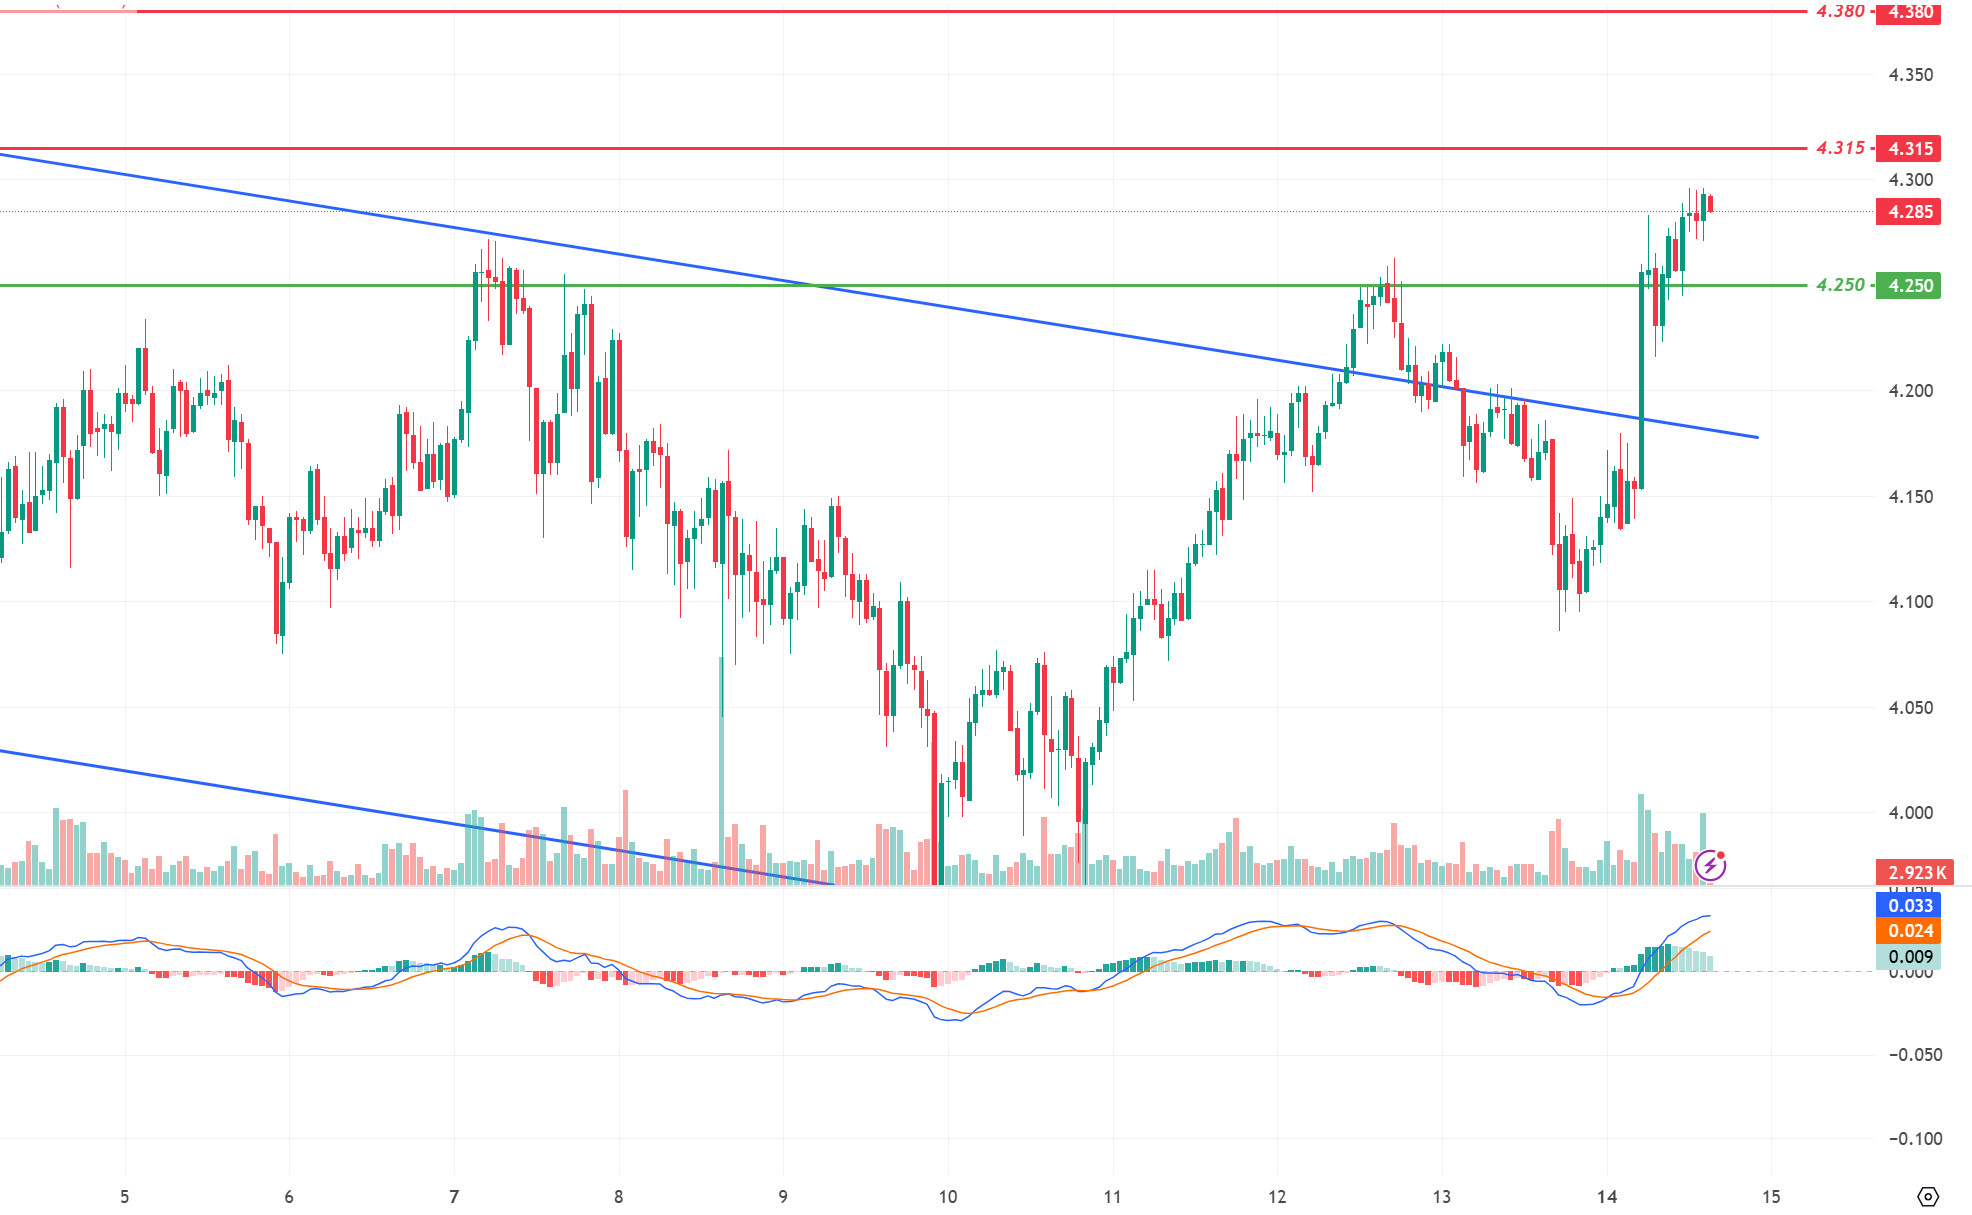
Rising with the trend break, Polkadot (DOT) broke the 4,250 resistance level upwards. Staying above the 4,250 level, DOT continues its upward movement. According to the MACD oscillator, we see that the buying pressure has decreased compared to the previous hour. The price may want to make a correction of this rise in a negative scenario. In this correction, the first support point may be 4,250 levels. On the other hand, with this rise, the price may move up to the resistance level of 4,315. In case the price maintains above the 4,315 level, we can expect increased selling pressure at 4,380 levels.
Supports 4.250 – 4.210 – 4.180
Resistances 4.315 – 4.380 – 4.405
SHIB/USDT
Shytoshi Kusama, lead developer of Shiba Inu, has warned of fraudulent claims against SHIB billionaire wallets. Kusama stated that such claims should not be accepted without verification and suggested that wallet owners prove their ownership by transferring a certain amount of SHIB. Concerns about transparency and security have been raised in the community, especially following allegations that Ryoshi holds over $1 billion in SHIBs. Kusama’s statements emphasize caution and verification by investors.
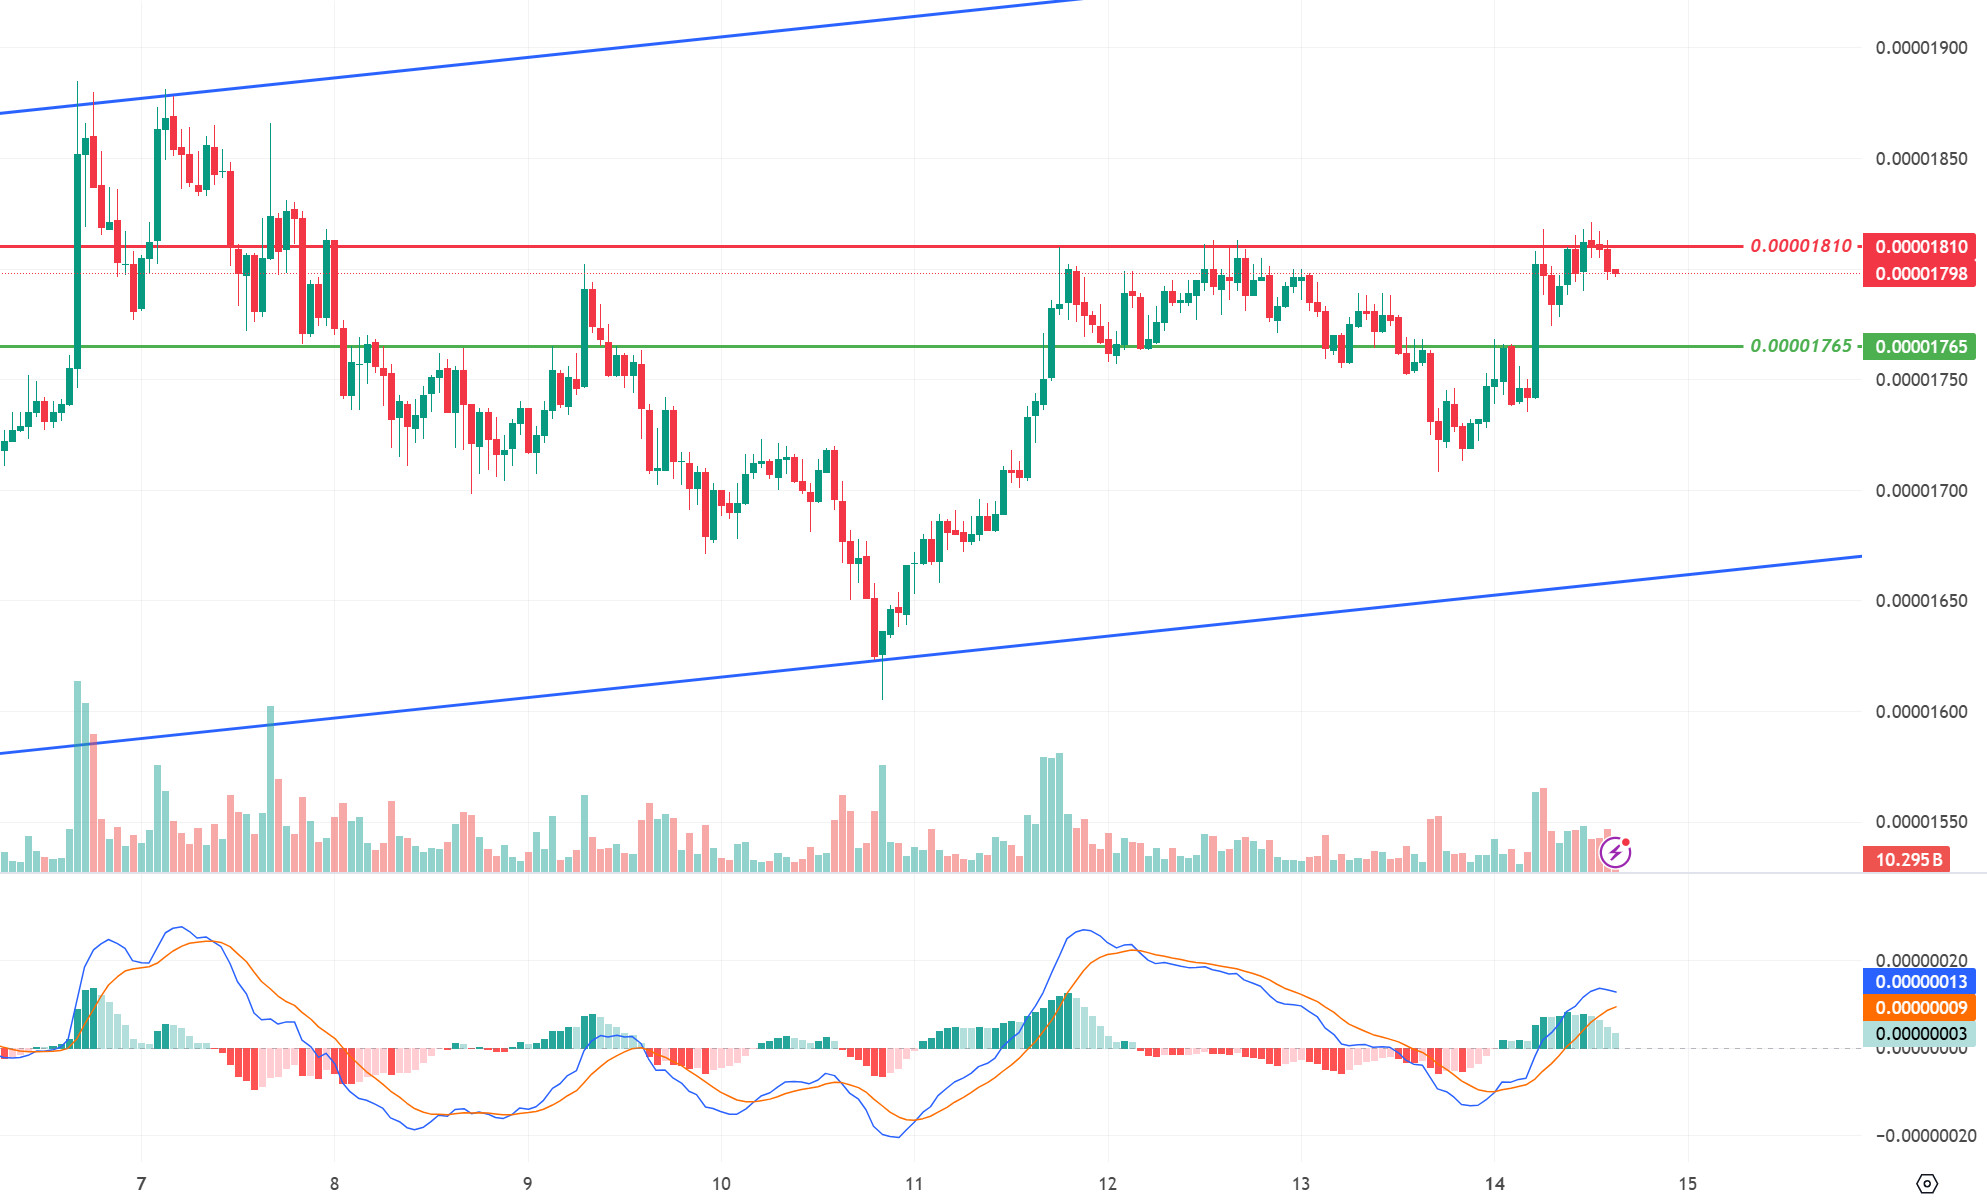
When we examine the chart of Shiba Inu (SHIB), it seems that the price could not break the resistance level of 0.00001810. When we examine the MACD oscillator, we see that the buying pressure has decreased compared to the previous hour. SHIB, which corrected with increasing selling pressure at 0.00001810, may fall to 0.00001765 levels if the selling pressure continues. On the other hand, if the price maintains above the 0.00001810 level, we can see a movement towards the next resistance level of 0.00001865.
Supports 0.00001765 – 0.00001690 – 0.00001630
Resistances 0.00001810 – 0.00001865 – 0.00001900
LEGAL NOTICE
The investment information, comments and recommendations contained herein do not constitute investment advice. Investment advisory services are provided individually by authorized institutions taking into account the risk and return preferences of individuals. The comments and recommendations contained herein are of a general nature. These recommendations may not be suitable for your financial situation and risk and return preferences. Therefore, making an investment decision based solely on the information contained herein may not produce results in line with your expectations.


