
MARKET SUMMARY
Latest Situation in Crypto Assets
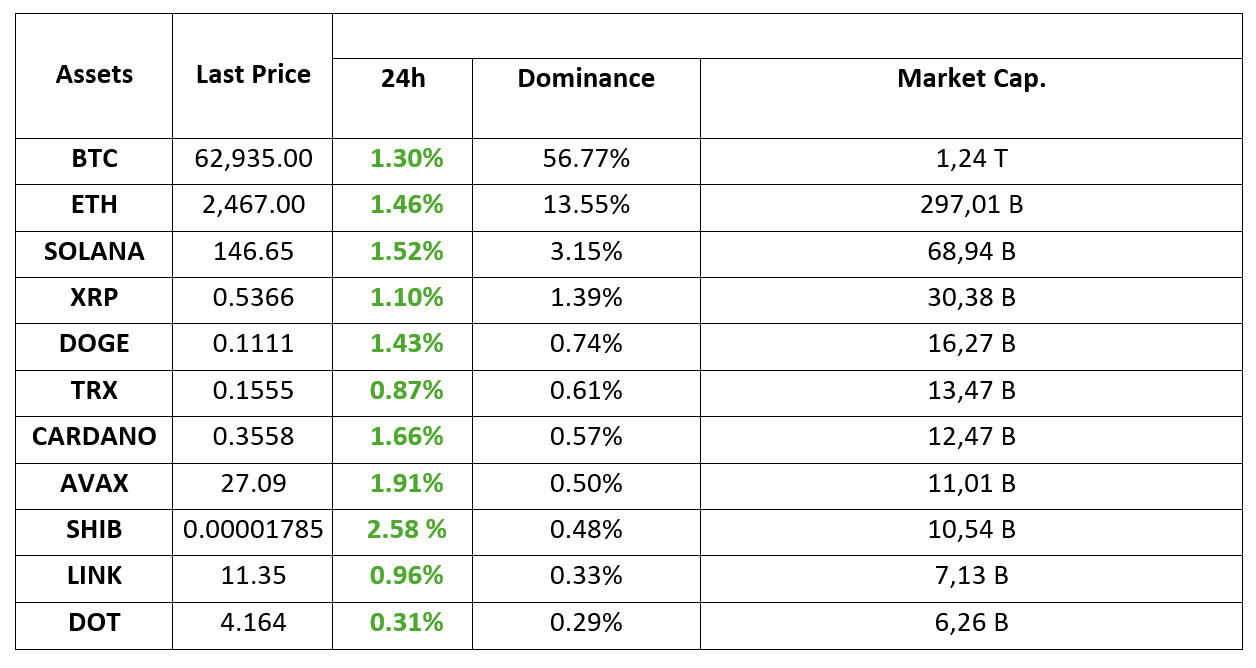
*Prepared on 10.07.2024 at 14:00 (UTC)
WHAT’S LEFT BEHIND
The company that saw salvation in Bitcoin
The Japan-based investment firm bought Bitcoin once again. With its $6.9 million purchase, the company increased its BTC holdings to 639. After the purchase announcement, the company’s shares also increased by more than 10%.
Net outflows of $159 million in crypto funds
Cryptocurrency funds closed last week with a net loss of $159 million. Bitcoin funds were at the top in both inflows and outflows. Ether funds also sold off, while altcoin funds closed the week largely positive.
Elon Musk arrives, Donald Trump takes the lead
Elon Musk, known for his support for Donald Trump in the US presidential election, yesterday attended Trump’s rally in Pennsylvania, where he survived an assassination attempt months ago. After Musk’s speech, Trump surged ahead of Kamala Harris in polls and betting sites.
HIGHLIGHTS OF THE DAY
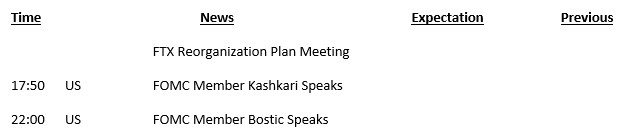
INFORMATION
*The calendar is based on UTC (Coordinated Universal Time) time zone. The economic calendar content on the relevant page is obtained from reliable news and data providers. The news in the economic calendar content, the date and time of the announcement of the news, possible changes in the previous, expectations and announced figures are made by the data provider institutions. Darkex cannot be held responsible for possible changes that may arise from similar situations.
MARKET COMPASS
Markets seem to be in search of balance after the increased risk appetite following the strong US employment data. On the first working day of the week, digital assets gave back some of their gains. US index futures also point to a negative opening. The dollar index is also holding on to its gains.
The statements of the Federal Open Market Committee (FOMC) officials will be monitored later in the day. Especially on Thursday and Friday, important macro data will come from the US and may shape market perception. Ahead; we think that the correction in digital assets after the recent upward trend is due to the nature of the market. The main direction looks up for now, but possible news from the Middle East, the upcoming presidential election in the US and the macro agenda will be under the spotlight and stand out as the dynamics to be monitored.
We think that the uptrend may find its ground again under the assumption that there is no new variable in the current equation and its components. In this regard, we may observe an ecosystem where buying may gain strength after the consolidation movement currently observed. Positions that will be adjusted with gradual and carefully adjusted steps will be beneficial and may be a useful strategy to reduce risk in a possible increase in volatility.
TECHNICAL ANALYSIS
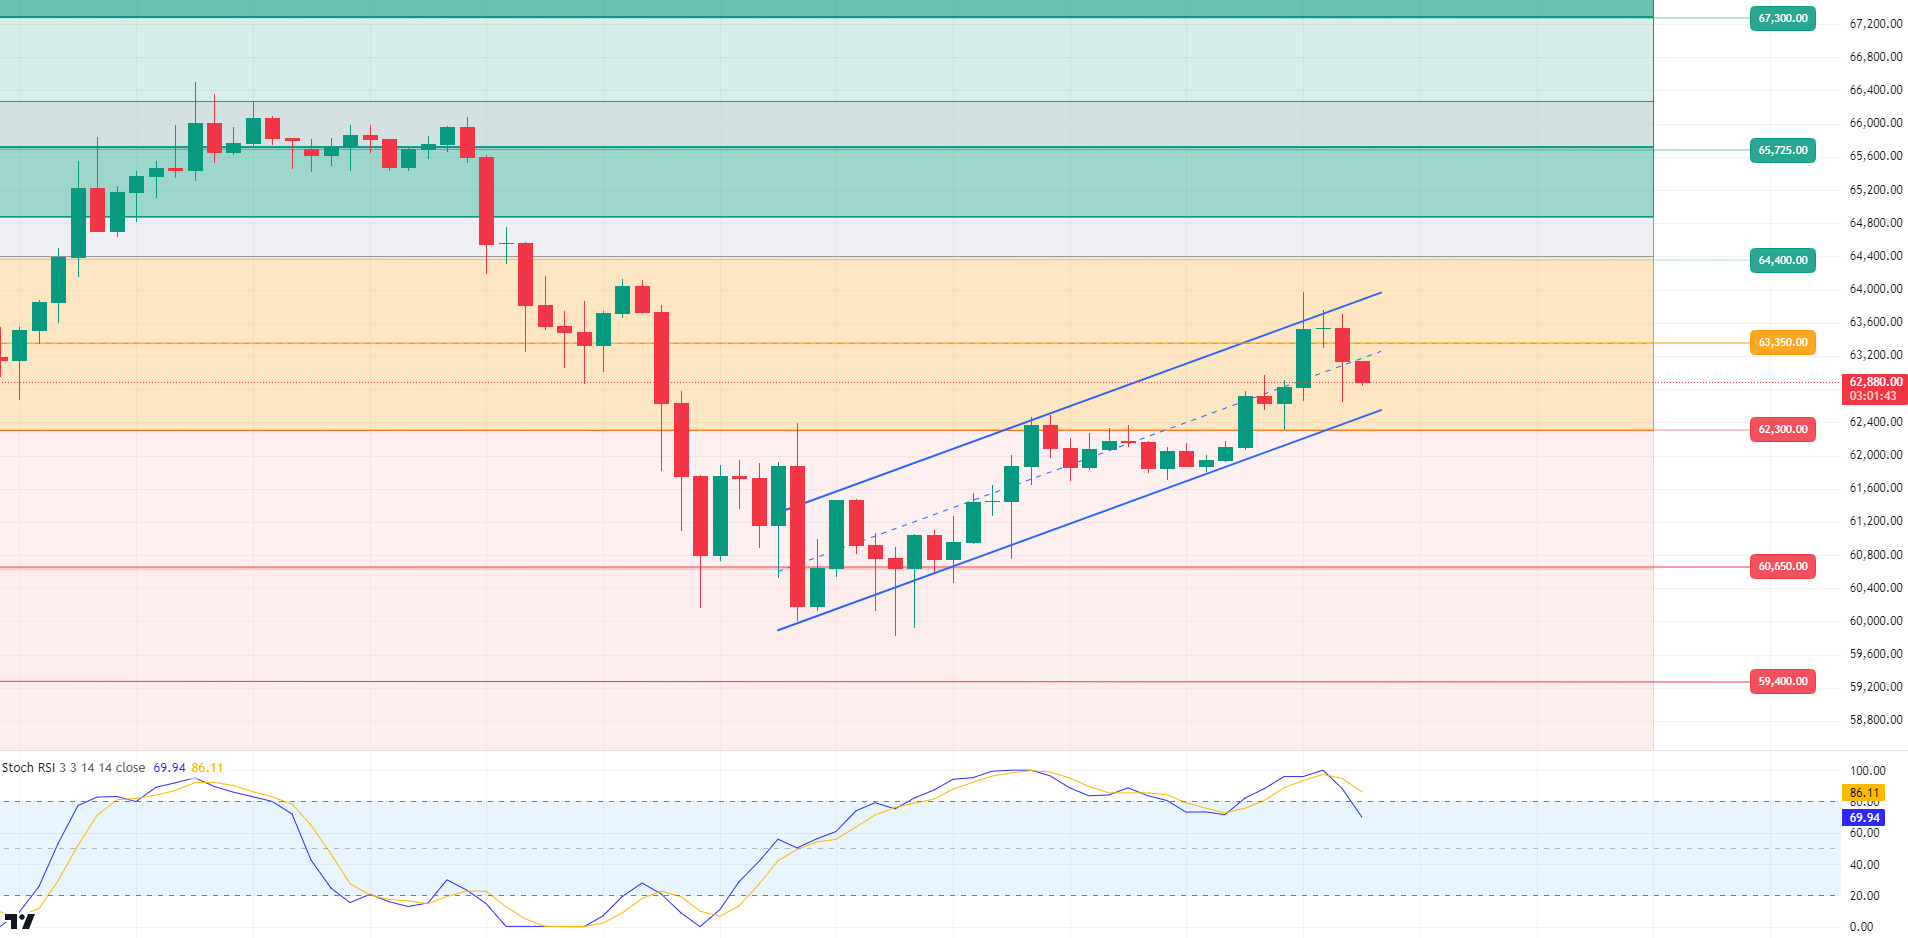
BTC/USDT
Correction from Bitcoin! Bitcoin, which was dominated by the weekend rises, started the first day of the week with a correction and a decline. The important development of the day for Bitcoin came from US presidential candidate D.Trump, who is seen as a crypto candidate. D.Trump, who is backed by Elon Musk’s support, came to the fore in the polls one month before the election, which made crypto investors happy. With the warming of the election atmosphere in the coming days, the fact that the presidential candidates will play their last trump cards on the crypto mass may bring positive developments for the market. In the BTC 4-hour technical analysis, it continues to be priced within the rising trend channel. BTC, which retreated from 64,000 levels, the upper line of the channel, is currently moving at 62,900, just below the middle line of the channel. Unless the middle line is crossed, we can say that selling pressure may continue and a retracement towards the support level of 62,300 may occur. Our technical indicator RSI turning down in 4 hours may confirm a possible pullback. With the positive performance of the US market on the first day of the week, the 64,400 level can be tested if the resistance level 63,350 point is passed in a possible upward movement.
Supports 62,300 – 60,650 – 59,400
Resistances 64,400 – 65,750 – 67,300
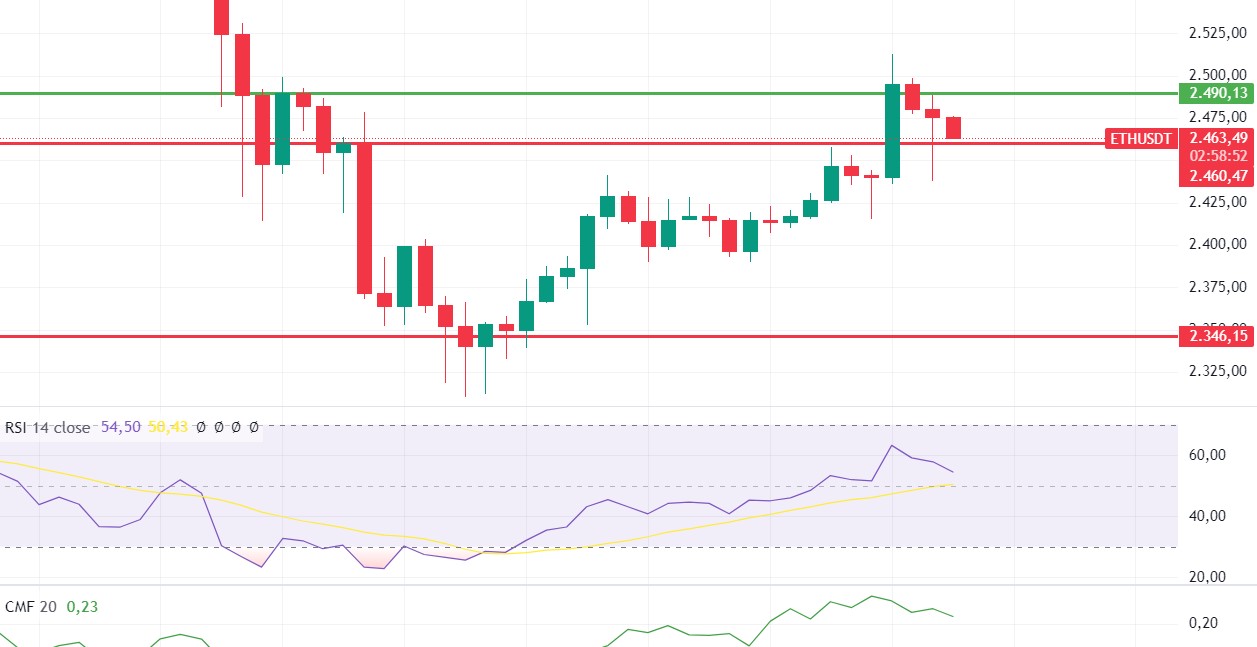
ETH/USDT
Ethereum seems to continue its correction with the RSI negative mismatch in the 4-hour timeframe. Although it fell deeply below the 2,460 level, it regained this level with purchases from the spot side. Although the RSI level retraced, we see that the mismatch continues. We also see that the downward trend has started on CMF. With this data, the correction movement can be expected to continue until the close. With the correction movement, the positive outlook continues unless the 2,460 level is lost. The 2,510 level is the most important resistance level and upward movements may accelerate with the break of this level.
Supports 2,460 – 2,400 – 2,346
Resistances 2,490 – 2,518 – 2,571
LINK/USDT
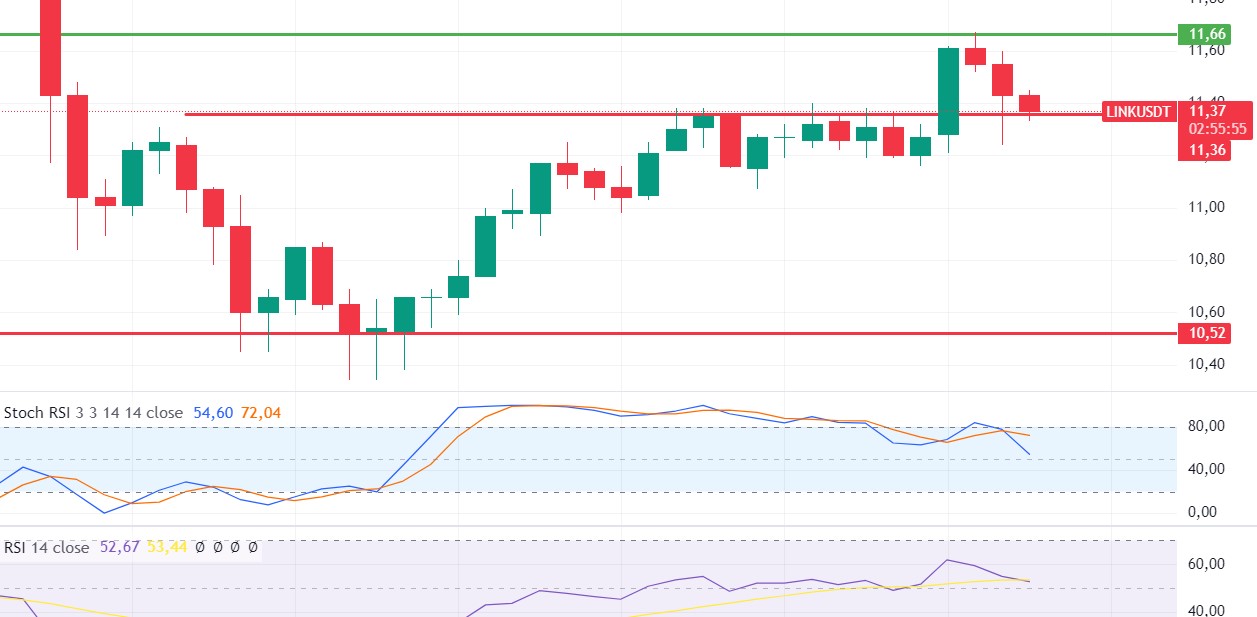
Although LINK lost 11.50 support with the market correction, it is trying to hold on to 11.36 support. Stochastic RSI and OBV have turned negative, while the correction in RSI and MACD look positive. With the loss of the 11.36 level, there may be some further decline. The regain of the 11.50 level may trigger rises up to 11.92 levels.
Supports 11.36 – 11.19 – 10.52
Resistances 11.50 – 11.66 – 11.92
SOL/USDT
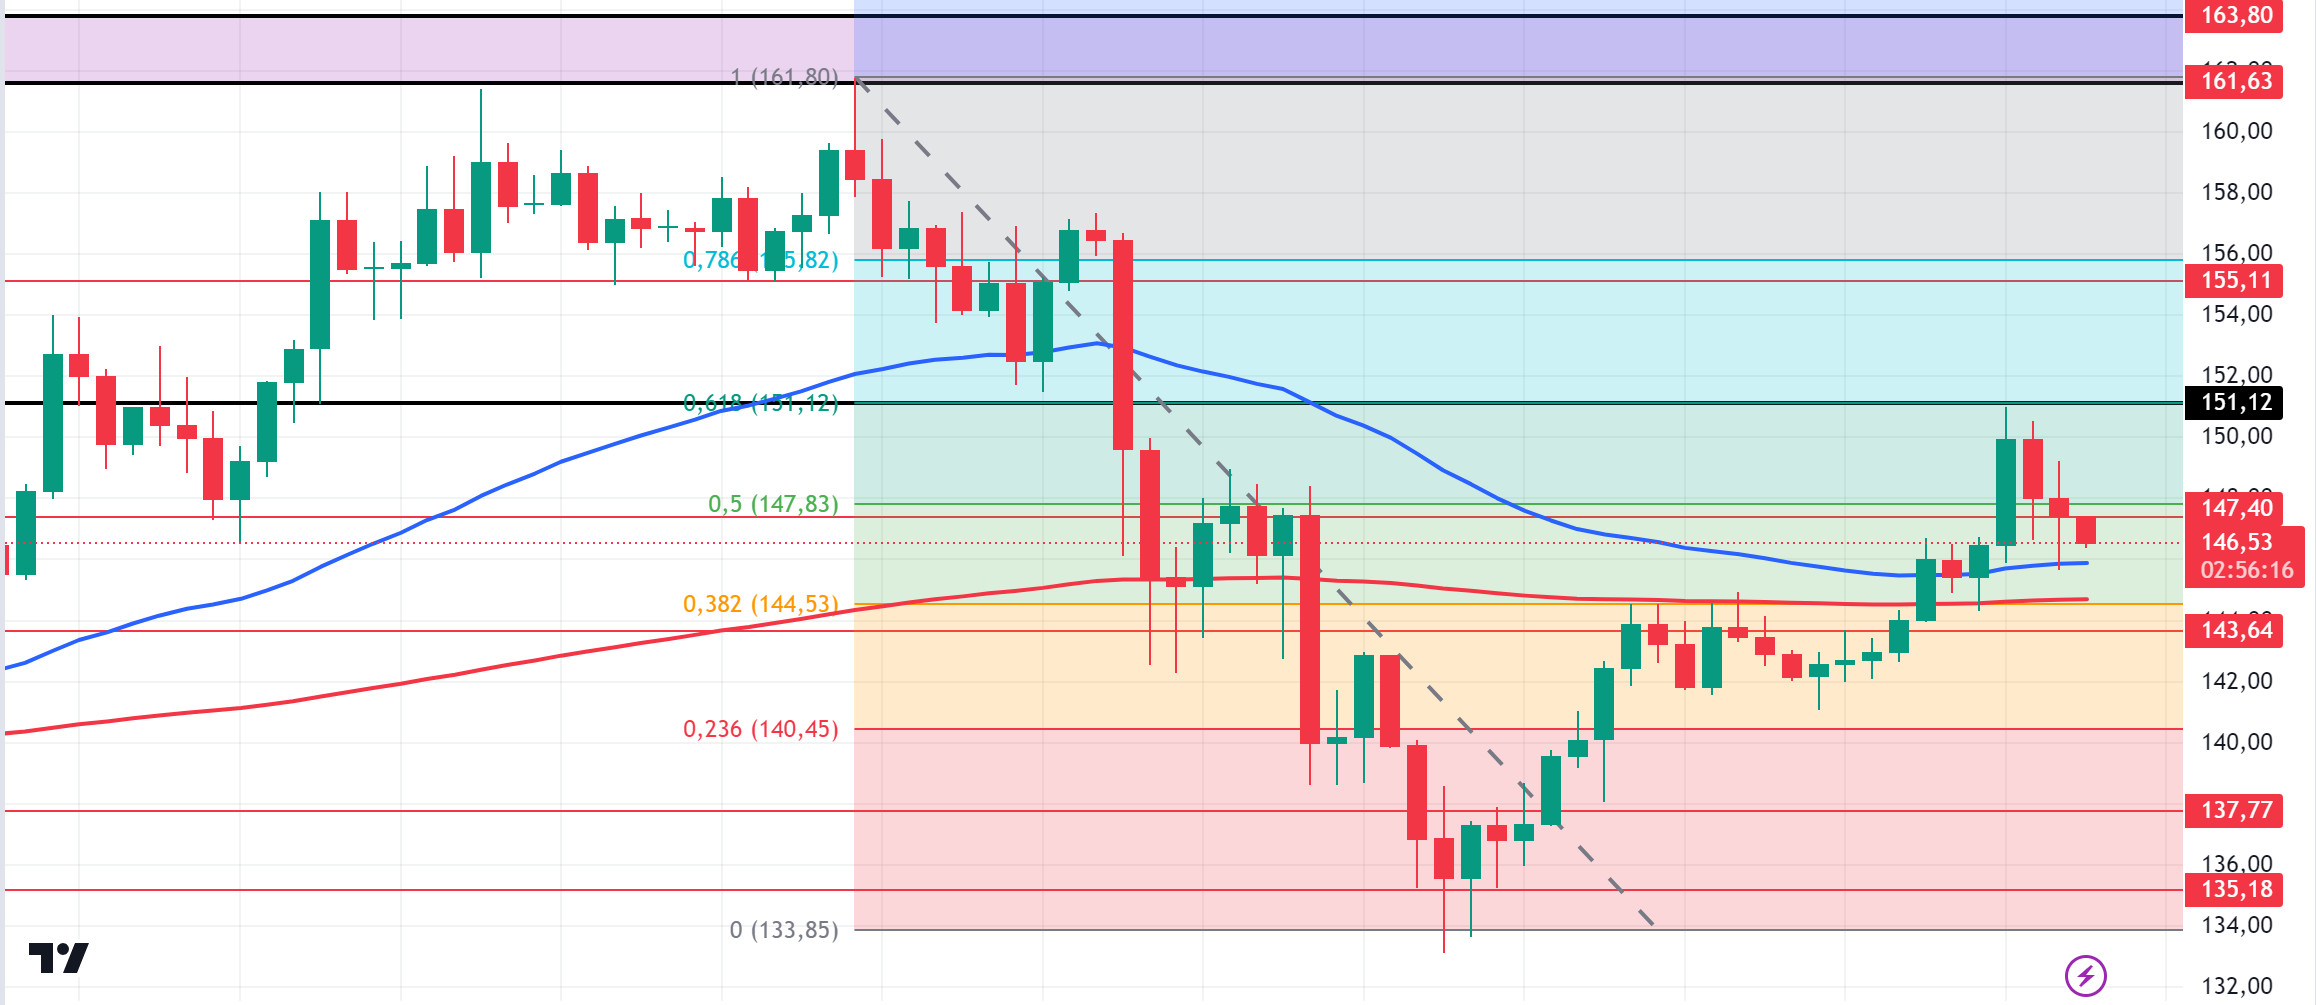
Solana is in the spotlight for different reasons, including Sygnum Bank’s claim that its scalable blockchain could challenge Ethereum’s dominance. In a recent statement, the Swiss bank claimed that there are indications that even institutions with low budgets may prefer Solana’s scalability to Ethereum’s security advantage. On the other hand, 6 Solana-based DeFi protocols recently surpassed $1 billion in total value locked (TVL), further strengthening Solana Network’s strong position and lucrative power in the market. Technically, the price has been accumulating in the 127.17 161.63 band since August 8. It encountered resistance at 0.618 (151.12), the Fibonacci retracement. After this resistance, SOL lost 2.69%. 151.12 resistance level worked and tested here. On the 4-hour chart, the 50 EMA seems to have received support from the 200 EMA. The 151.12 level appears as a resistance level in the rises driven by both macroeconomic conditions and innovations in the Solana ecosystem. If it rises above this level, the rise may continue. In the sales to be made by investors due to political and macroeconomic conditions, the support levels of 147.40 – 143.64 should be followed. If the price comes to these support levels, a potential bullish opportunity may arise.
Supports 147.40 – 143.64 – 137.77
Resistances 151.12 – 155.11 – 161.63
ADA/USDT
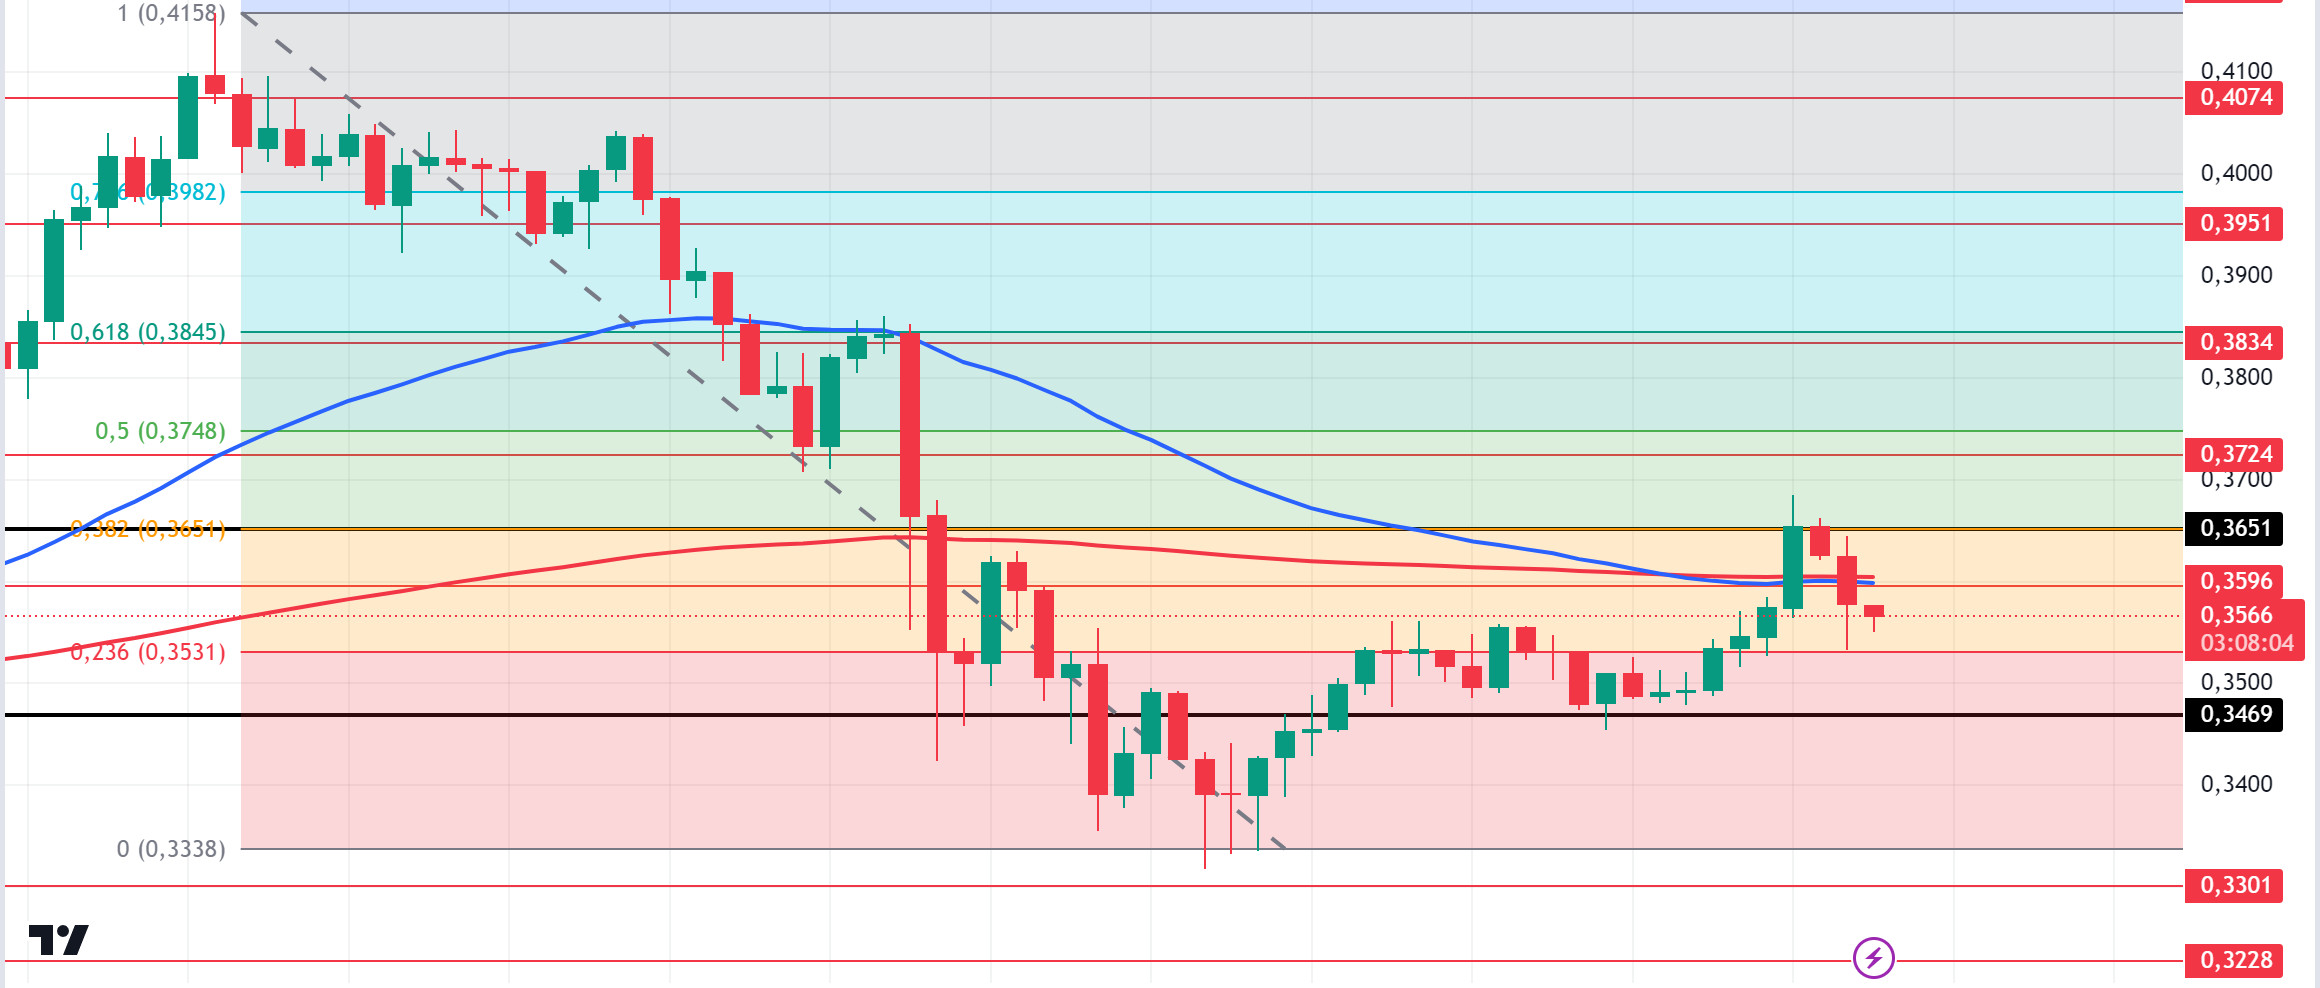
Technically, the 50 EMA has reached the same level as the 200 EMA. If the 50 EMA crosses below or above, it is a situation that can create a trend. On the other hand, when we look at the Fibonacci retracement, the retracement of the decline that started on September 27 has encountered resistance at the Fibonacci value of 0.382 (0.3651). .After this resistance, ADA lost 3.20% at the time of writing. The 0.3469 level stands out as a strong support in the retracements to be experienced with possible political and macroeconomic news. If the positive mood in the ecosystem continues, the 0.3651 level is a strong resistance.
Supports 0.3469 – 0.3301 – 0.3228
Resistances 0.3651 – 0.3724 – 0.3834
AVAX/USDT
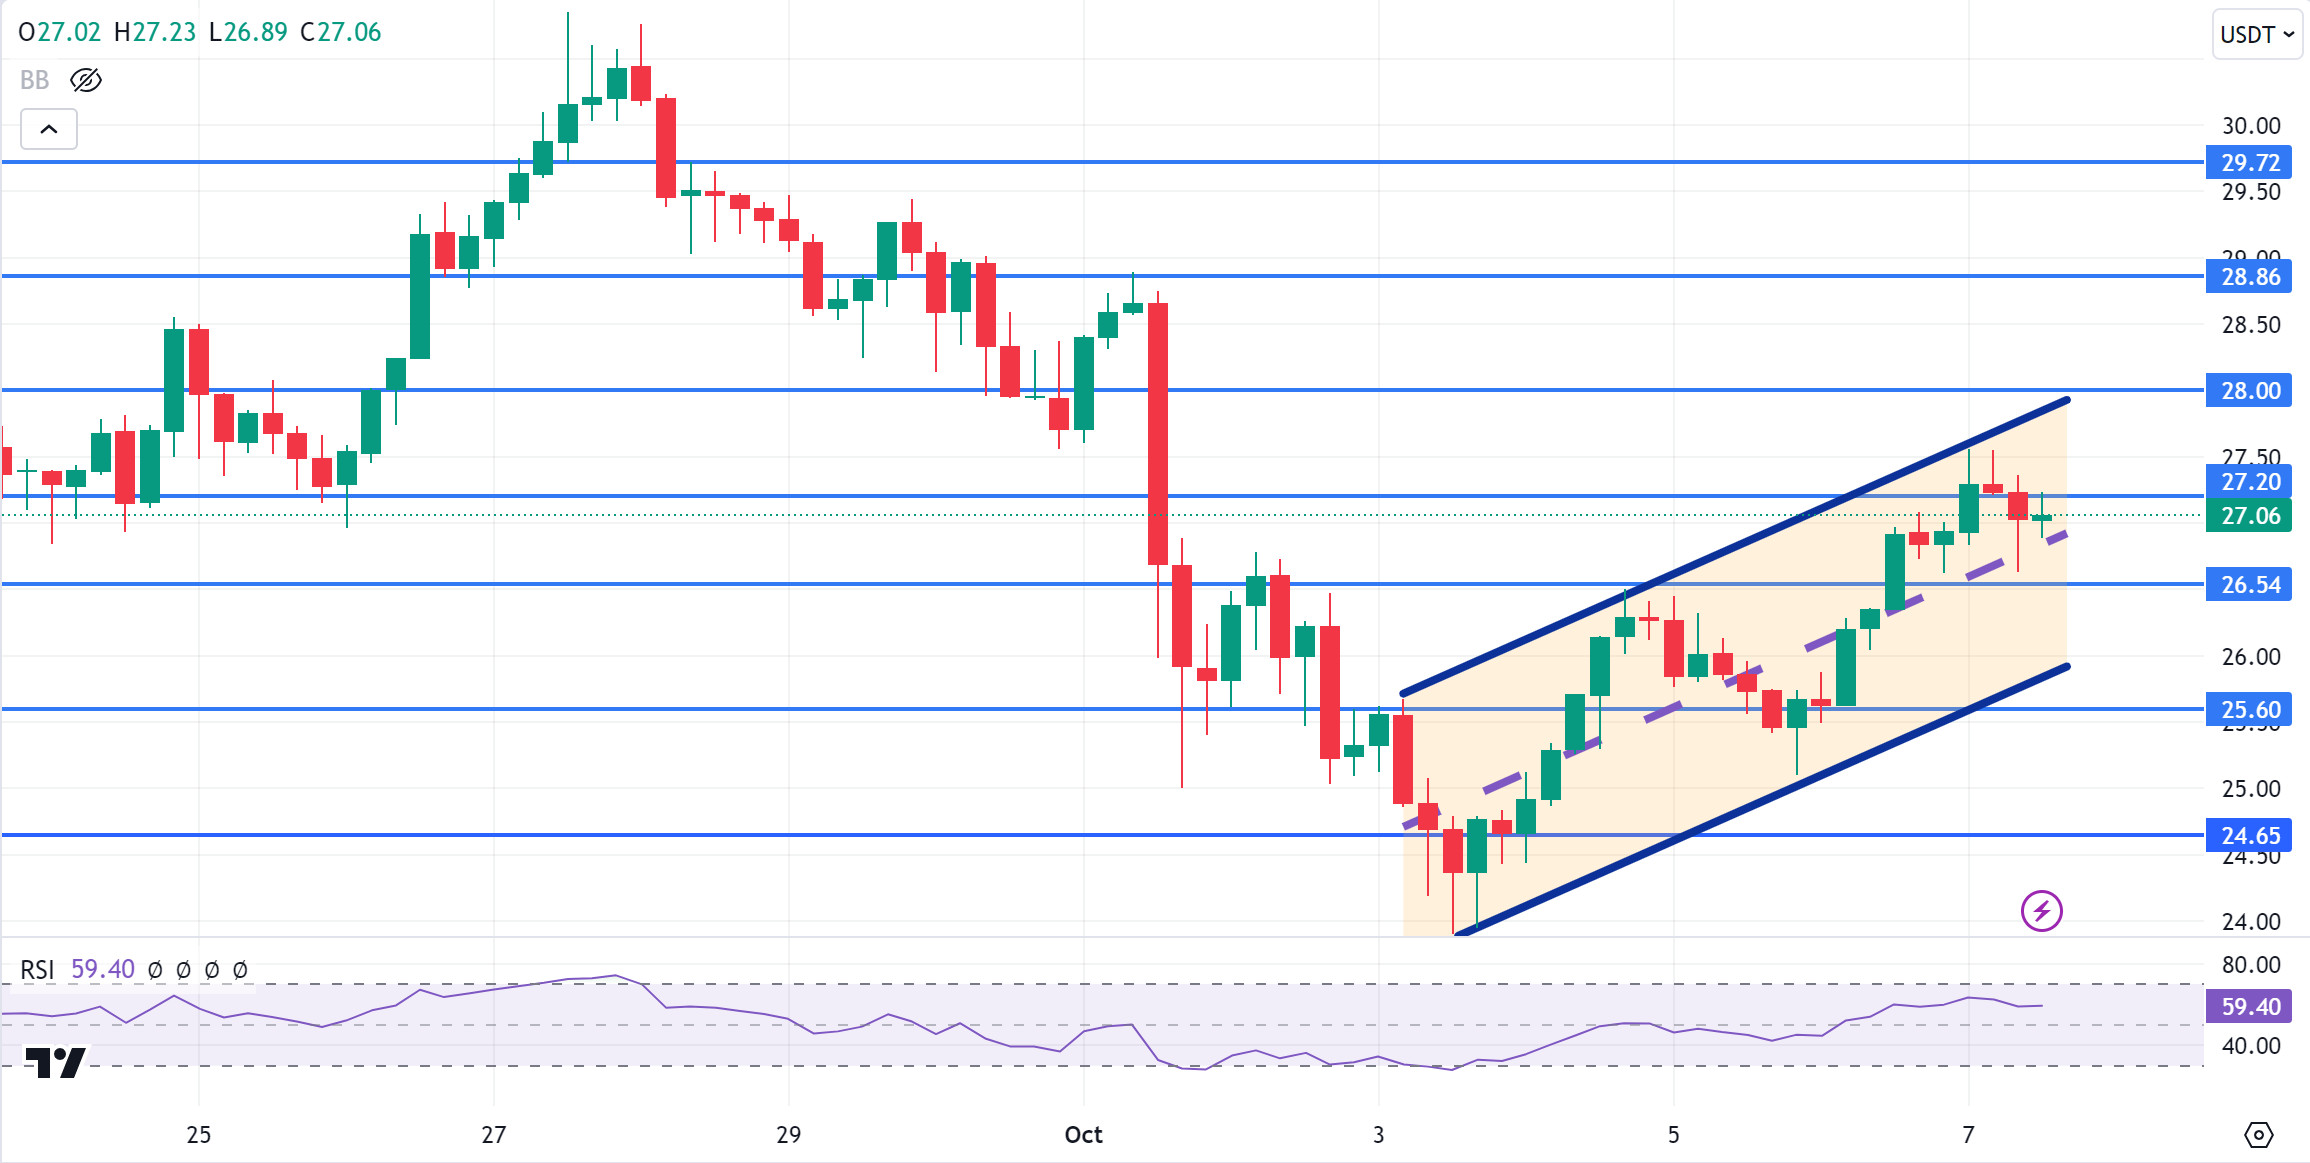
AVAX, which opened today at 26.93, rose slightly during the day and is trading at 27.06. Since there is no planned data coming from the US today, price movement can be expected to be limited and volatility can be expected to remain low. News flows from the Middle East will be important for the market.
It is currently moving within the ascending channel on the 4-hour chart. It is in the middle band of the ascending channel and with the RSI 59 value, it can be expected to make some decline from these levels. In such a case, it may move to the lower band of the channel and test the 26.54 support. In case of positive news that the tension in the Middle East is over, there may be an increase in purchases and it may test the 28.00 resistance. As long as it stays above 24.65 support during the day, the desire to rise may continue. With the break of 24.65 support, sales may increase.
Supports 26.54 – 25.60 – 24.65
Resistances 27.20 – 28.00 – 28.86
TRX/USDT
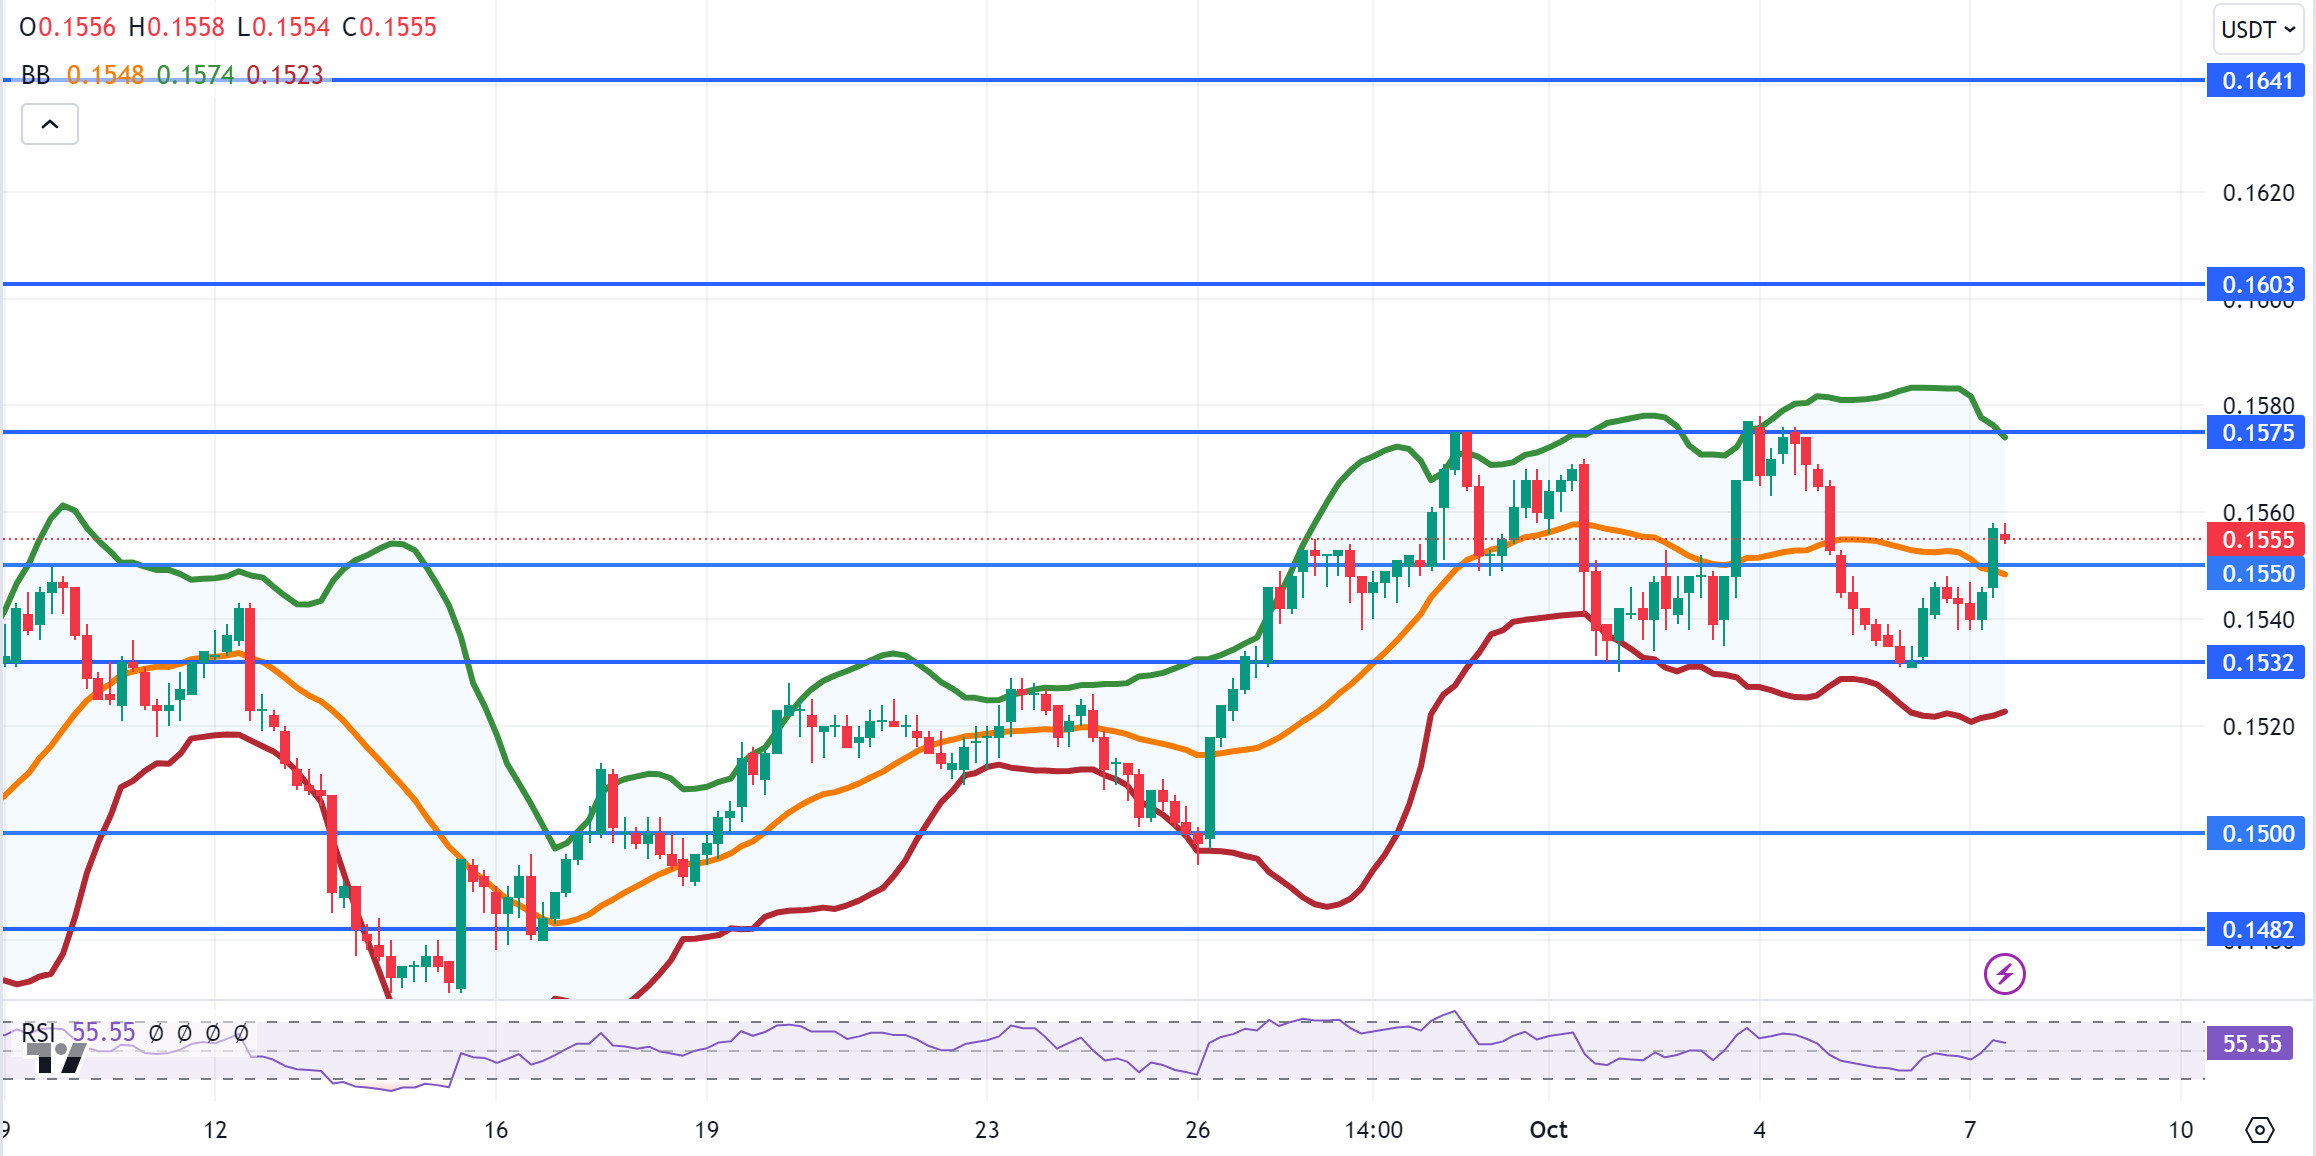
TRX, which started the day at 0.1543, is trading at 0.1555, up about 1% during the day. Since there is no planned data expected to affect the market today, the market will be closely following the news flows regarding the tension in the Middle East. On the 4-hour chart, it is moving upwards from the Bollinger middle band and with the RSI 55 value, it can be expected to rise a little more from its current level. In such a case, it may move to the Bollinger upper band and test the 0.1575 resistance. In case of news flow in the direction of increasing tension in the Middle East, it may test 0.1532 support with selling pressure. As long as TRX stays above 0.1482 support, the desire to rise may continue. If this support is broken downwards, sales can be expected to increase.
Supports 0.1550 – 0.1532 – 0.1500
Resistances 0.1575 – 0.1603 – 0.1641
XRP/USDT
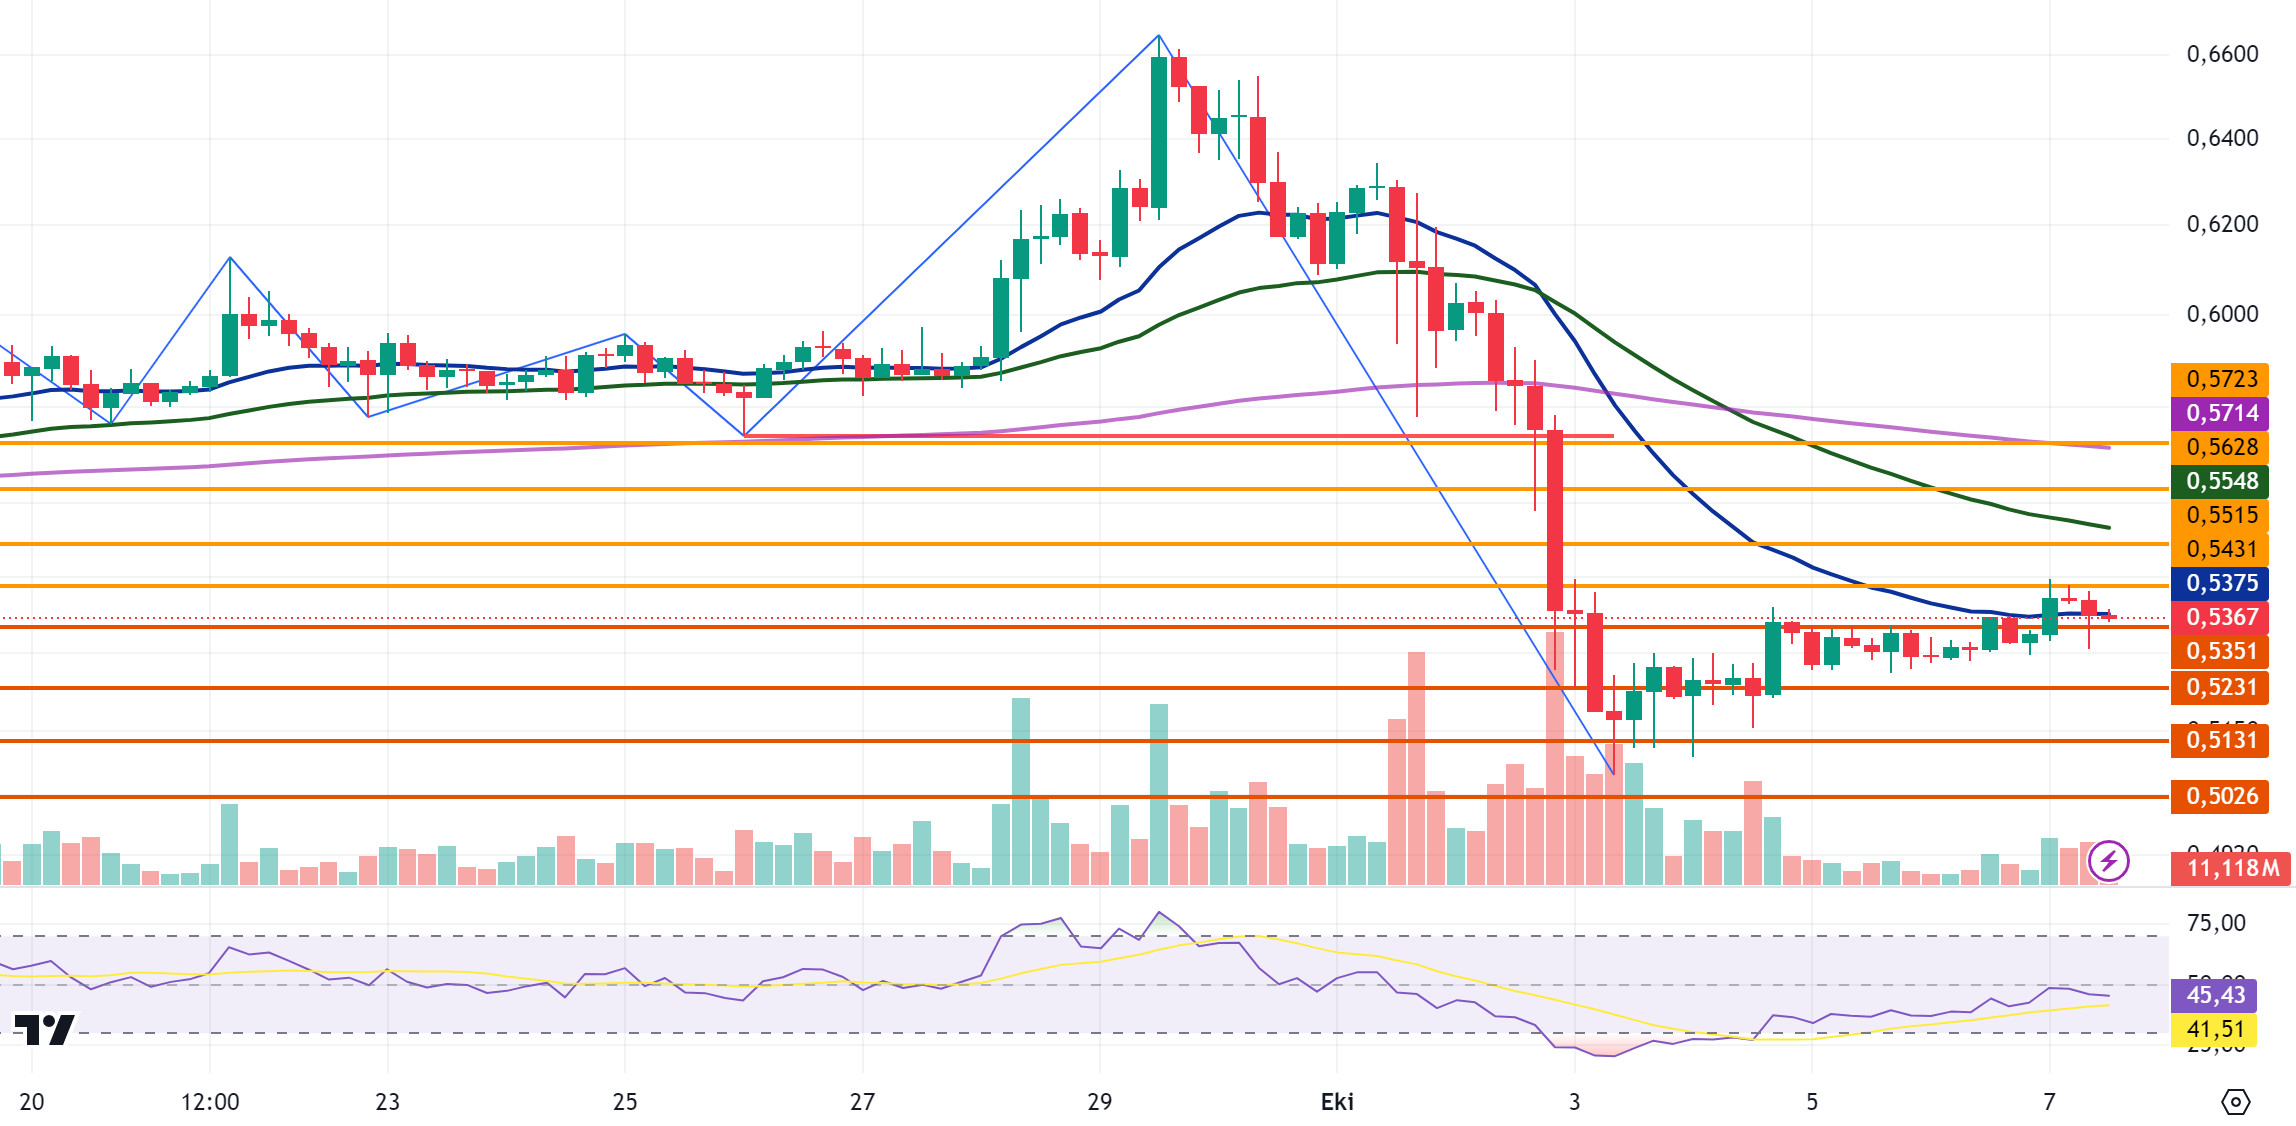
XRP continues to trade in a horizontal band between 0.53 and 0.545 levels in the 4-hour analysis today. In its rise, it fell into a horizontal band with sales at the 0.5431 resistance level. In its decline, it rose into a horizontal band with purchases in the 0.53 support zone. The RSI is at 45.43 and is neither overbought nor oversold and may continue to move within the horizontal band in this process. In case of a decline with negative developments for the crypto market and XRP, it may test the support levels of 0.5351-0.5231-0.5131. In case of positive developments, it may test 0.5431-0.5515-0.5628 resistance levels with its rise.
XRP may fall into a horizontal band with possible sales at the EMA50 level in its rise and may offer a short trading opportunity. In its decline, it may offer a long trading opportunity with purchases that may support in the 0.53 support zone.
EMA20 (Blue Line) – EMA50 (Green Line) – EMA200 (Purple Line)
Supports 0. 5351 – 0.5231 – 0. 5131
Resistances 0.5431 – 0.5515 – 0.5628
DOGE/USDT
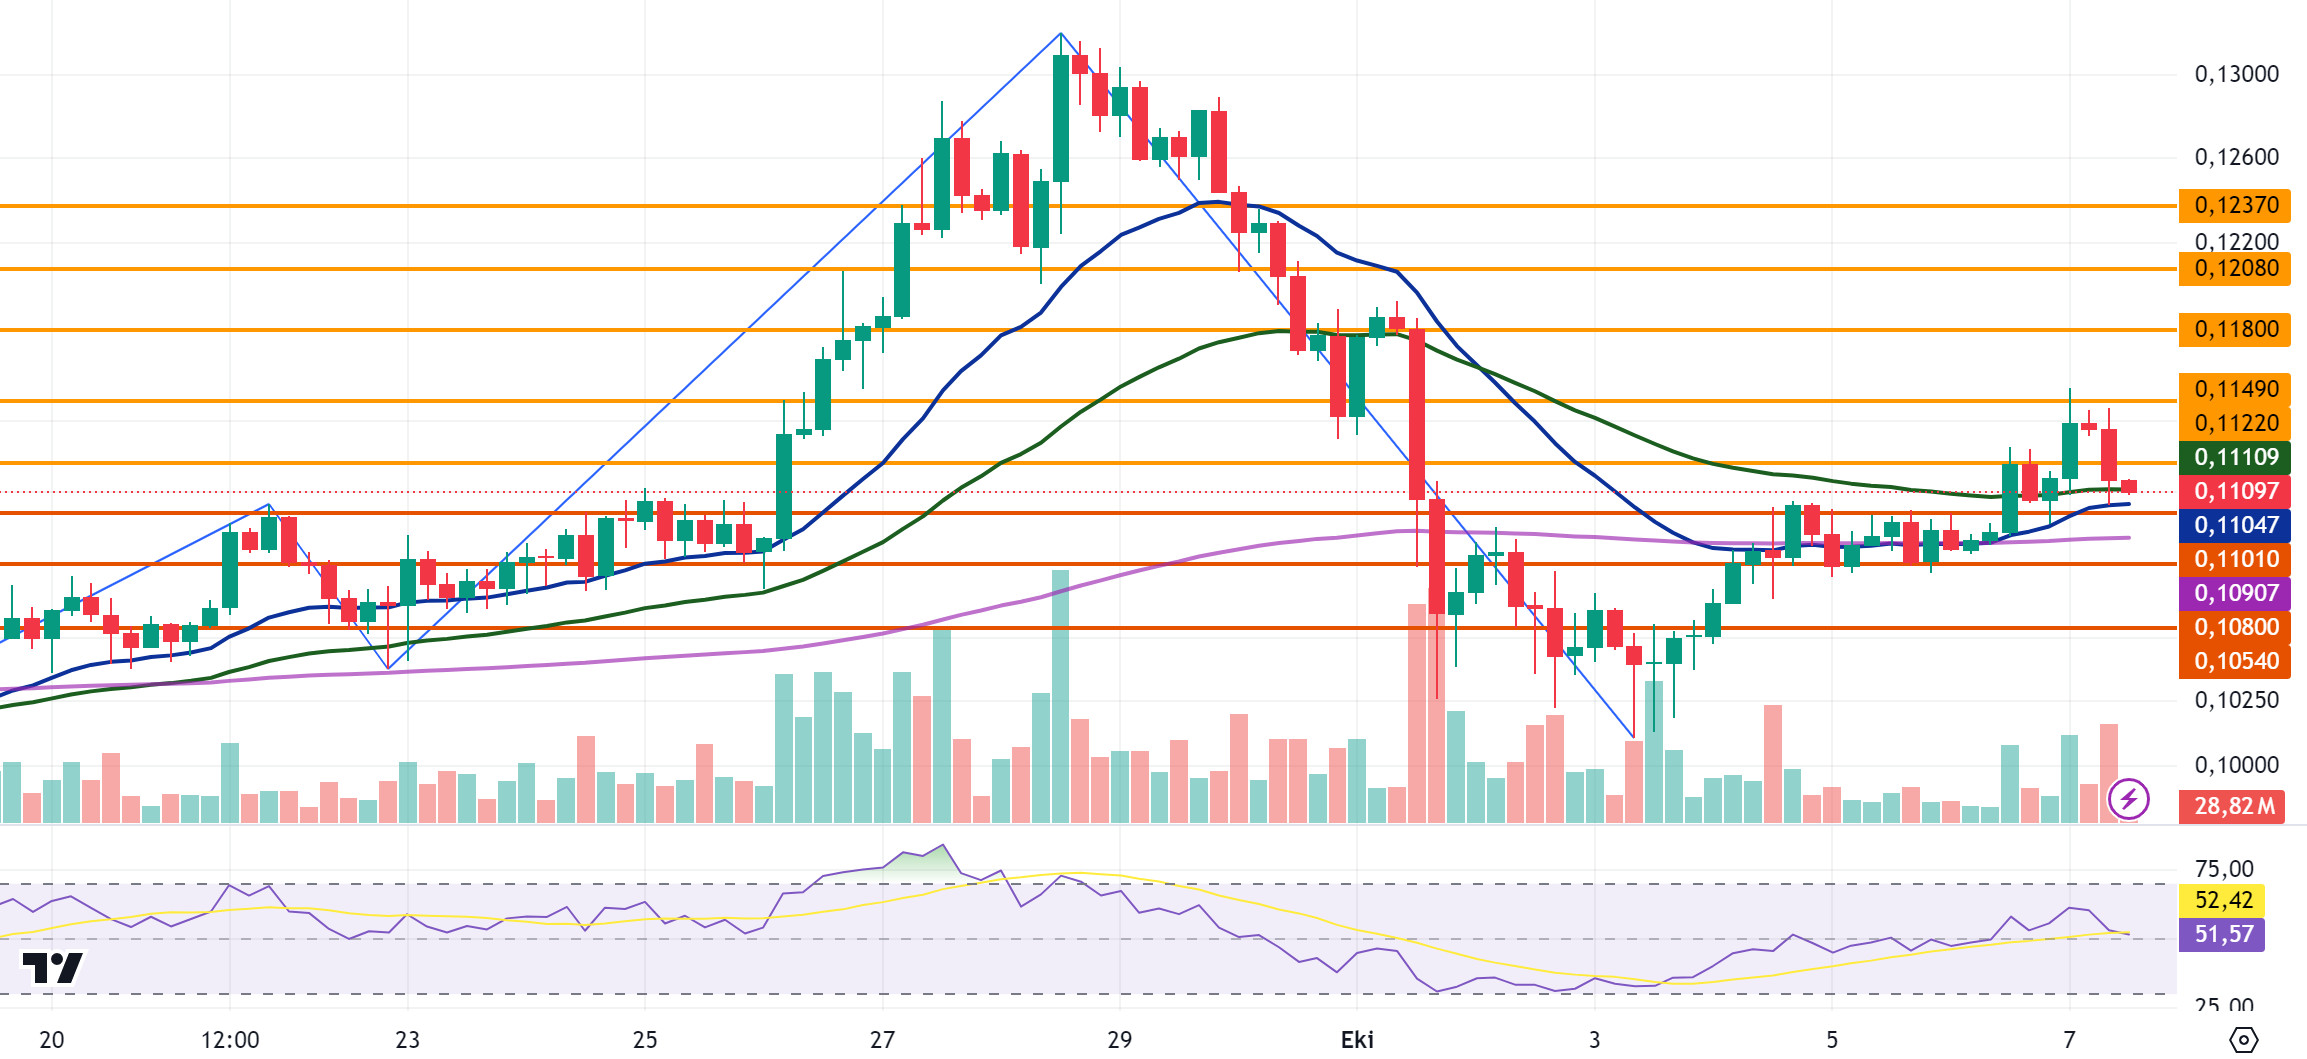
DOGE, which started the day with an increase, rose to 0.1154 and then fell with the sales. In the crypto market, which declined with the ongoing tension in the Middle East and negative news from the region, DOGE fell to the EMA20 level with its decline in the crypto market, and then rose to 0.1114 with the purchases. In the 4-hour analysis, DOGE, which continues to decline, is currently trading at 0.1109. If the decline continues with negative developments, DOGE may test 0.1101-0.1080-0.1054 support levels with its decline. In the event that the ongoing tension in the Middle East falls and the crypto market starts to rise again with positive developments on behalf of the crypto market, it can test the resistance levels of 0.1122-0.1149-0.1180.
In the DOGE decline, it may rise again with the purchases that may come at the EMA20 and 0.1101 support level and may offer a long trading opportunity. If these levels are broken down, the decline may deepen and offer a short trading opportunity.
EMA20 (Blue Line) – EMA50 (Green Line) – EMA200 (Purple Line)
Supports 0.1101 – 0.1080 – 0.1054
Resistances 0.1122 – 0.1149 – 0.1180
DOT/USDT
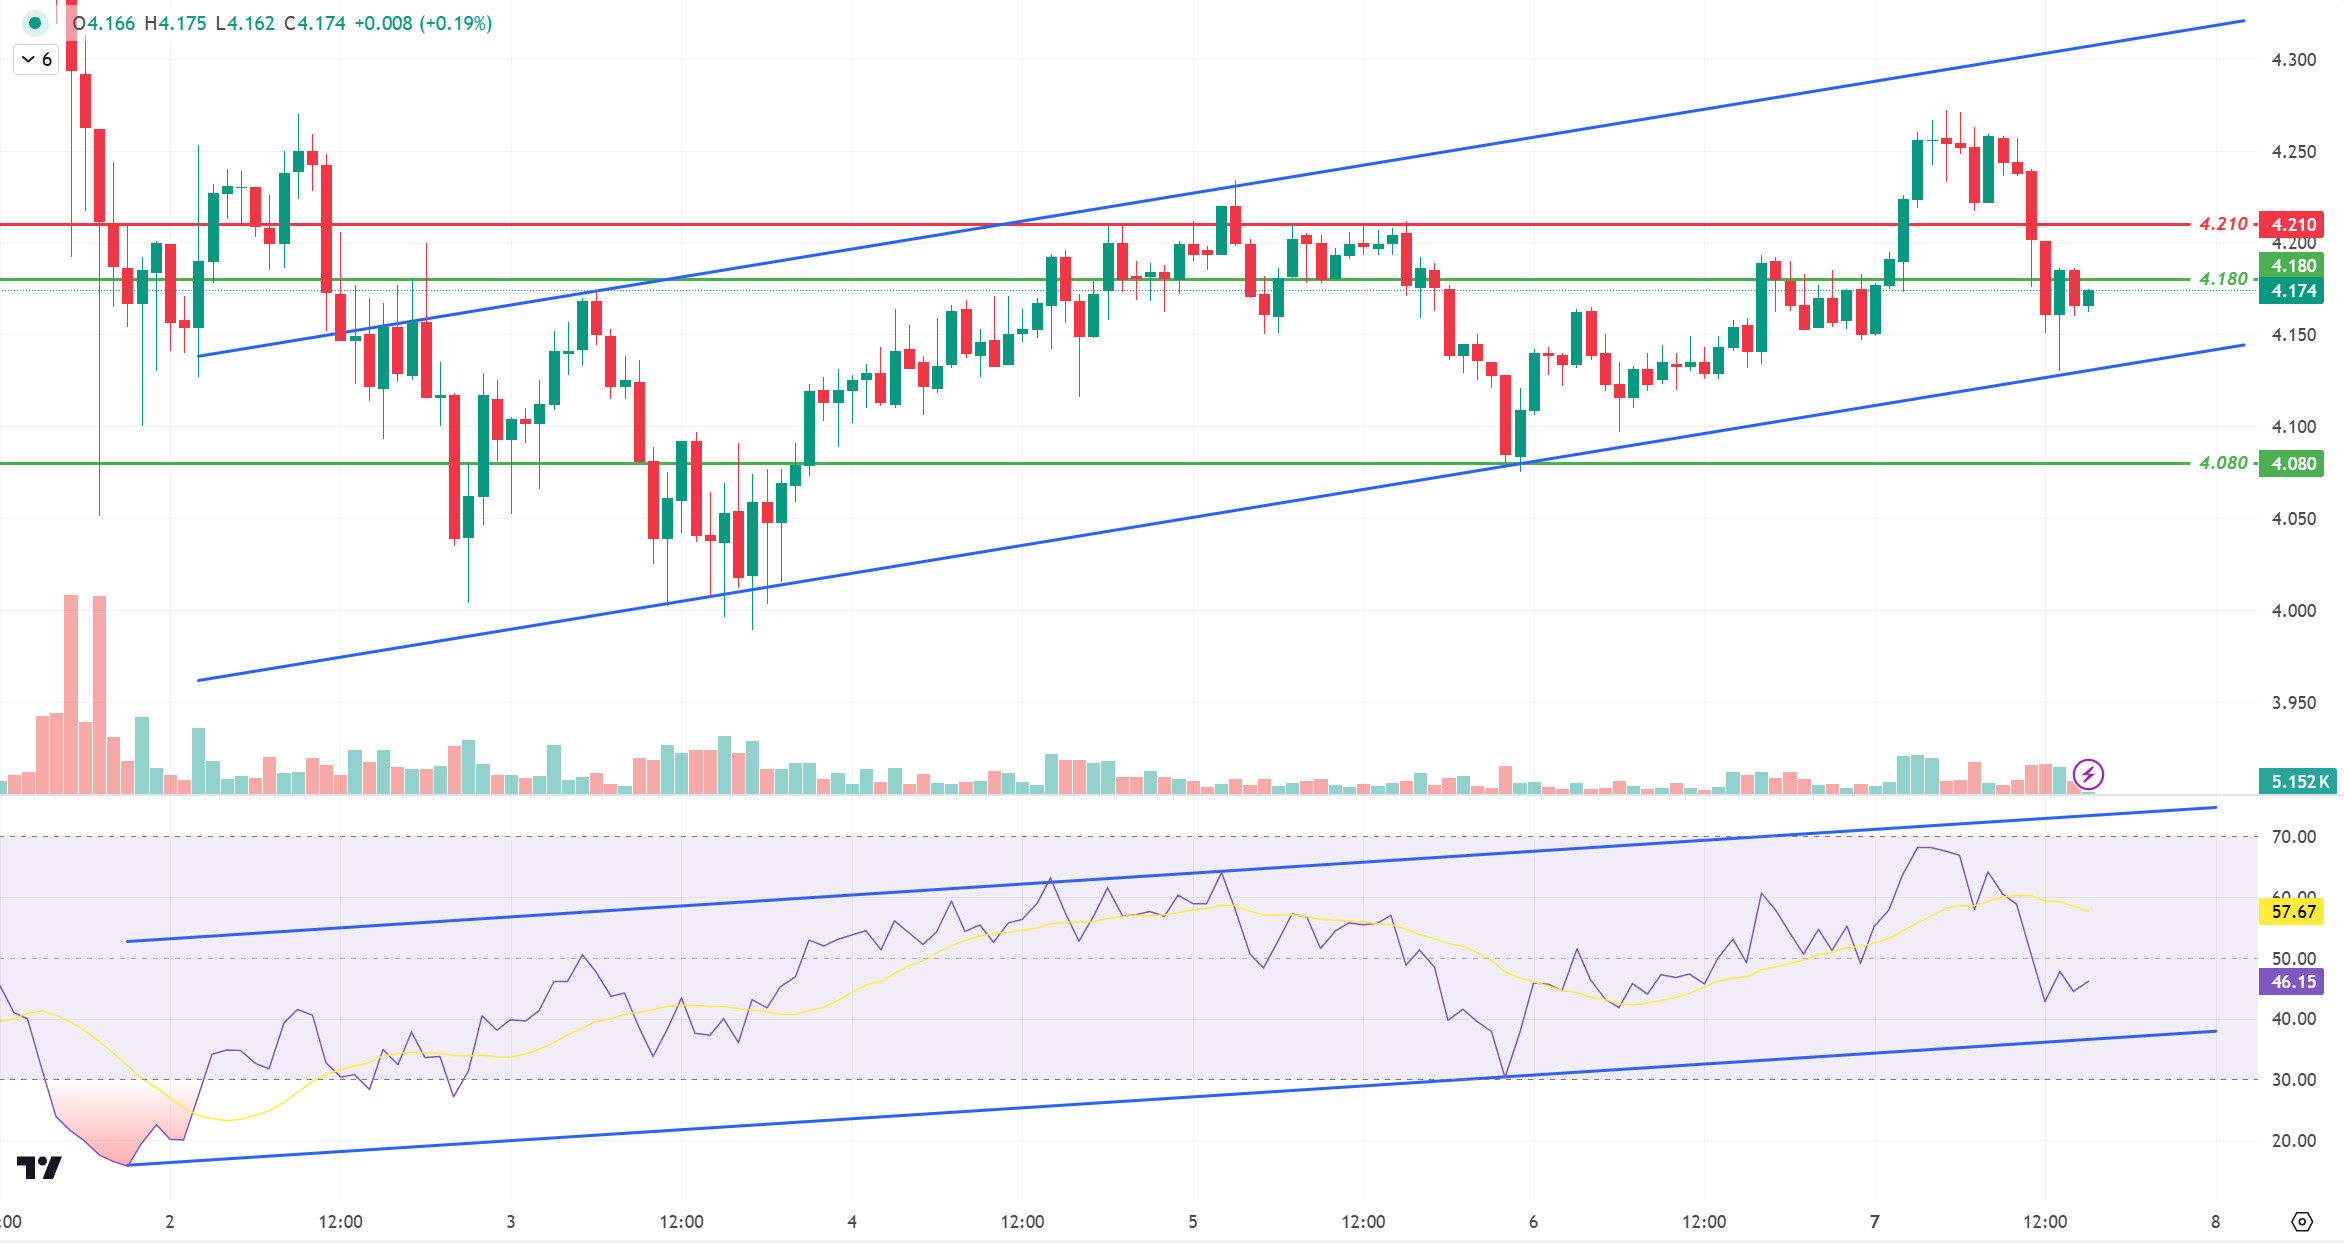
When we examine the Polkadot (DOT) chart, the price seems to have reacted from the lower band of the rising channel. When we examine the RSI, we see that it is moving towards the lower band of the rising channel. Accordingly, the price may retest the lower band of the ascending channel. On the other hand, the price may move towards the upper band of the rising channel with the candle closures above the 4.180 level.
Supports 4,180 – 4,080 – 3,975
Resistances 4.210 – 4.265 – 4.380
SHIB/USDT
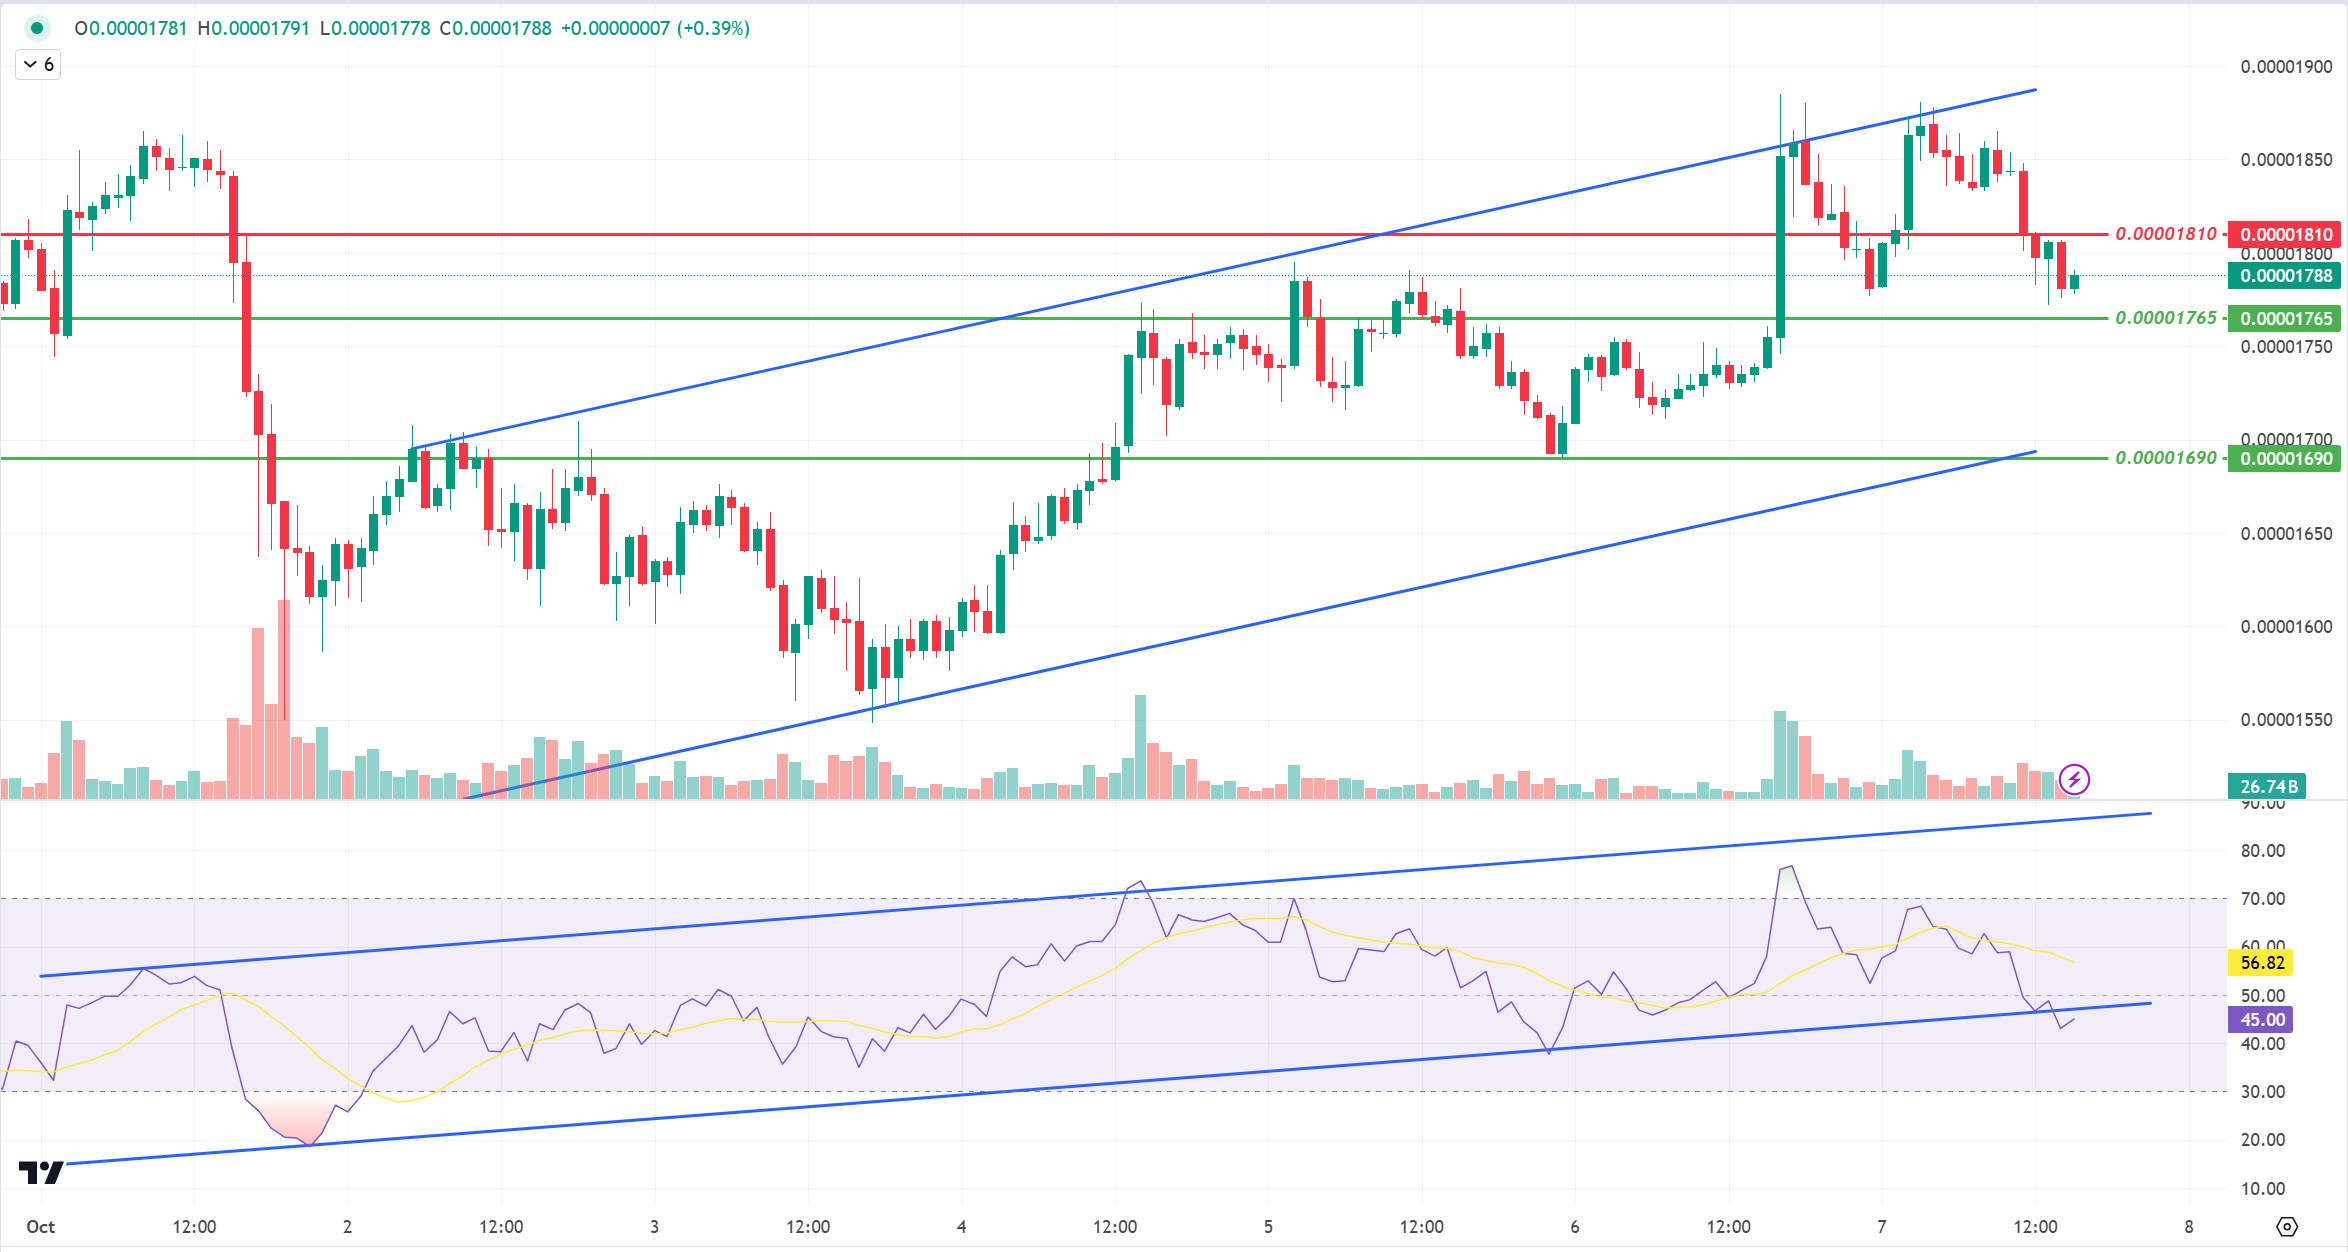
Shiba Inu (SHIB) burn rate increased by 544.55%. This increase indicates a positive change in the SHIB ecosystem. In total, over 410 trillion SHIBs were burned and the circulating supply decreased to 583 trillion. On the SHIB chart, the price broke the 0.00001810 support down with a reaction from the 0.00001860 resistance level. We see that the RSI broke down the lower band of the rising channel. In this context, we can expect the price to retreat to 0.00001765 levels. On the other hand, if the buyer pressure increases with the increase in burning rates, the first resistance level may be 0.00001810 levels.
Supports 0.00001765 – 0.00001690 – 0.00001630
Resistances 0.00001810 – 0.00001895 – 0.00001945
LEGAL NOTICE
The investment information, comments and recommendations contained herein do not constitute investment advice. Investment advisory services are provided individually by authorized institutions taking into account the risk and return preferences of individuals. The comments and recommendations contained herein are of a general nature. These recommendations may not be suitable for your financial situation and risk and return preferences. Therefore, making an investment decision based solely on the information contained herein may not produce results in line with your expectations.
