MARKET SUMMARY
Latest Situation in Crypto Assets
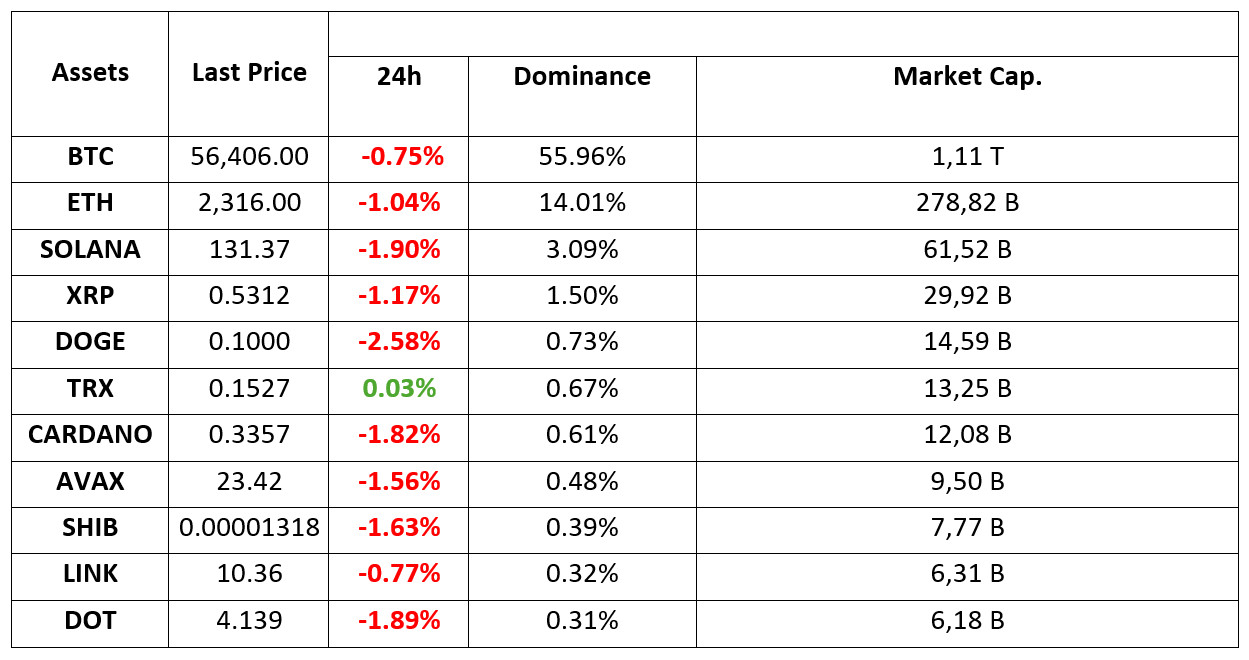
*Table prepared on 11.09.2024 at 14:00 (UTC)
WHAT’S LEFT BEHIND
Critical Inflation Data Announced in the US!
As of today, inflation data from the US was on the agenda of the cryptocurrency industry and traditional financial markets. US inflation data was announced in line with expectations. The fact that the data came in line with expectations reduced the impact on financial markets.
- US Annual Consumer Price Index (CPI): Previous: 2.9%, Expected: 2.5%, Announced: 2.5%
- US Monthly Consumer Price Index (CPI): Previous: 0.2%, Expected: 0.2%, Released: 0.2%
- US Annual Core Consumer Price Index (CPI): Previous: 3.2%, Expected: 3.2%, Announced: 3.2%
- US Monthly Core Consumer Price Index (CPI): Previous: 0.2%, Expected: 0.2%, Released: 0.3
Goldman Sachs: Fed More Likely to Cut Rate by 25 Basis Points
Goldman Sachs said it expects a 25 basis point cut, more in line with the Fed’s cautious approach. With inflation slowing and growth concerns persisting, the Fed’s priority will likely be to gradually ease policy to support the economy without reigniting inflationary pressures. The upcoming FOMC meeting will provide more clarity on the Fed’s thinking.
Remarkable Activity in Ethereum!
A wallet address starting with 0xfEB… associated with Vitalik Buterin, co-founder of the largest altcoin Ethereum (ETH), recently sold 190 WETH on-chain worth approximately $440,000. This recent transaction is another example of Vitalik’s addresses making significant moves in the cryptocurrency market.
HIGHLIGHTS OF THE DAY

INFORMATION:
*The calendar is based on UTC (Coordinated Universal Time) time zone. The economic calendar content on the relevant page is obtained from reliable news and data providers. The news in the economic calendar content, the date and time of the announcement of the news, possible changes in the previous, expectations and announced figures are made by the data provider institutions. Darkex cannot be held responsible for possible changes that may arise from similar situations.
MARKET COMPASS
US Inflation and the Fed
The highly anticipated inflation data for August was announced in the US. Annual Consumer Price Index (CPI) fell to a 3.5-year low of 2.5% in line with expectations, while core CPI rose by 0.3%, above the 0.2% forecast.
Although the core CPI, which excludes energy and food prices, came in slightly above expectations, it seems to be enough for the markets to shelve the possibility of a 50 basis point rate cut by the US Federal Reserve (FED) on September 18. We saw an upward trend in the dollar after the data. On the other hand, this also justified the FED’s shift in focus to the labor market.
In addition to the CPI data, which strengthened expectations that the FED will not make a “Jumbo” rate cut at its most recent meeting, we can state that the fear of a recession has diminished somewhat and the markets are pointing to a slight revival of economic activity in the US. The US indices are slightly negative as the US indices have moved away from the start of a rapid interest rate cut. However, we can interpret the fact that we see that losses in digital assets remain limited despite the strengthening dollar index in this way. It would not be wrong to say that the positive mood in European indices is fueled by the expectation that the European Central Bank (ECB) is preparing to cut interest rates tomorrow.
Which way is the compass pointing?
After the critical US data, the focus of the markets still seems to be on the FED. While negative expectations regarding economic health seem to have been somewhat suppressed, the weakening of the possibility of a 50 bps cut by the FED does not leave a big scar for now. Therefore, we can say that until the Federal Open Market Committee (FOMC) decision on September 18 (even if there are developments such as US PPI and ECB interest rate decision before that), markets may be closer to the perception that will support the positive mood.
Although there is no reason for a clear upside in crypto assets, the fact that we have somehow reached the point where the FED is starting to cut interest rates and the possibility of avoiding a recession may limit declines. In this parallel, investors are likely to be more sensitive to looking for excuses for upward pricing behavior. Only the dose of the possible negative impact of the appreciation in the dollar needs to be monitored.
TECHNICAL ANALYSIS
BTC/USDT
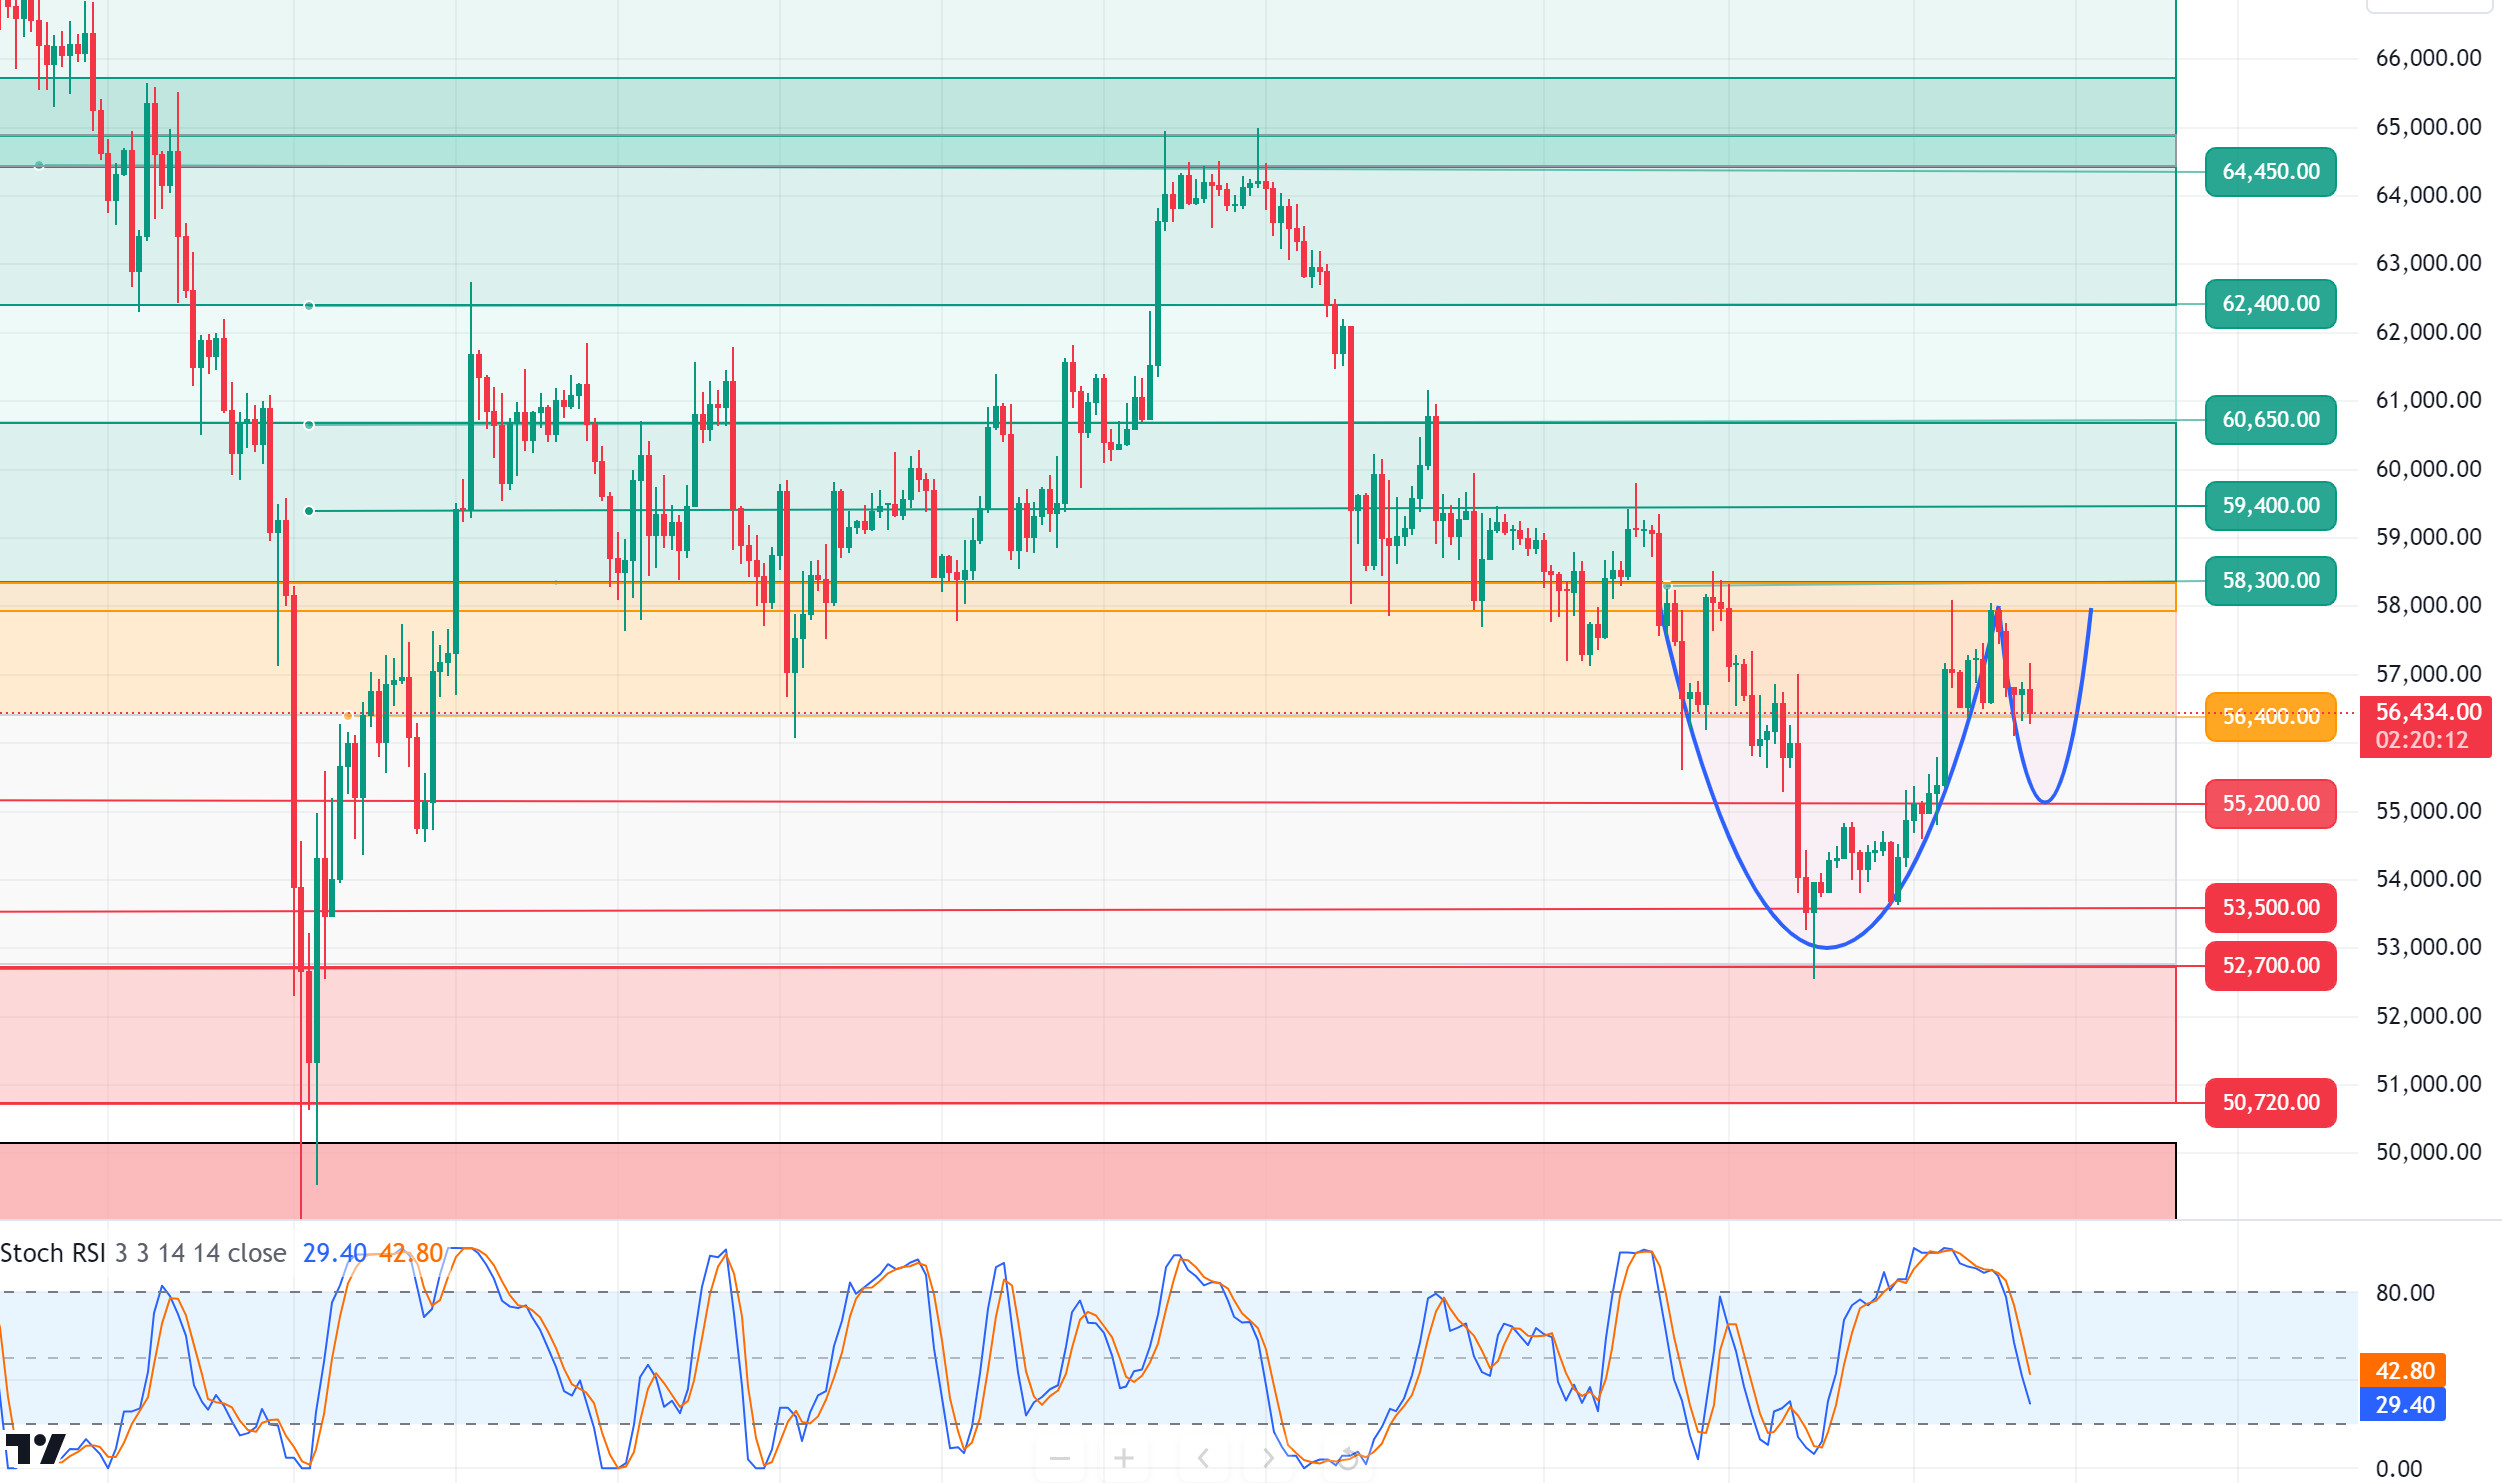
After the critical inflation data! US inflation data, which the market has been eagerly waiting for a long time, was announced within expectations. As the data came in line with expectations, it reduced the impact on financial markets. Inflation is on a downtrend on an annual basis, but the higher-than-expected monthly increase in core inflation indicates that price pressures continue. This may have an impact on the Central Bank’s policies because core inflation, rather than the general trend of inflation, shows longer-term price movements. In light of this data, the Fed may have to pursue a careful balancing policy, raising the possibility of a 25bps rate cut. In this case, the flow of money into risky assets may fall slightly and the Bitcoin price may be priced before the interest rate meeting. For the short term, BTC was trading at 56,400 on the 4-hour technical analysis, which was the pre-data support level. BTC, which is currently pushing 57,000 levels, may gain upward momentum and bring a move towards the resistance level of 58,300 if the US stock market opening session is positive. Otherwise, our bowl-and-handle pattern is not yet complete, and the 55,200 level may be tested again in case of negative pricing. With the completion of the handle part of the pattern, it may bring positive pricing in the long term and the previously mentioned 60,650 level can be targeted.
Supports 55,200 – 56,400 – 53,500
Resistances 57,200 – 58,300 – 59,400
ETH/USDT
Ethereum, which exhibits highly volatile movements with the release of inflation data, continues its movements in the cloud. Kumo cloud support and resistances continue to work quite well. In this context, the break of the 2,307 level may create a negative structure, while the break of the 2,358 level may trigger sharp upward movements. Especially with the positive mismatch in MFI, it is possible to see rises with the Asian opening. In addition, the fact that the price came down with the sales on the futures side while the spot side was buying in the last downward movement strengthens the bullish expectations.
Supports 2,307 – 2,273 – 2,194
Resistances 2,358 – 2,400 – 2,451
LINK/USDT
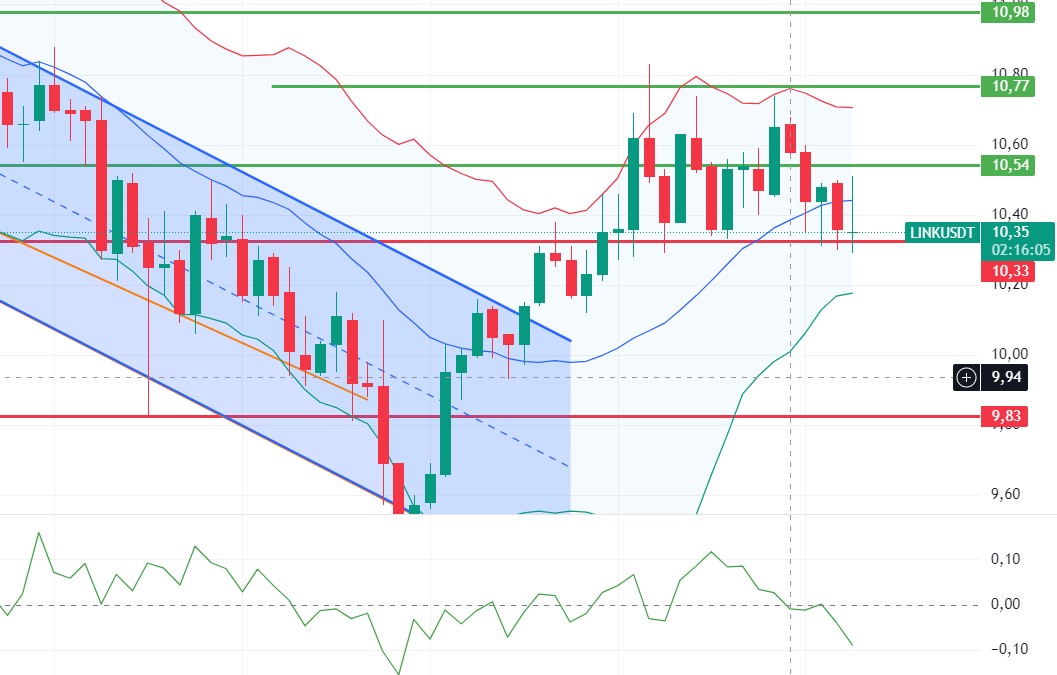
The structure on LINK is neutral again. With the break of the Bollinger mid-band, RSI and CMF looked positive, while it broke down again and entered the accumulation zone. For LINK, which entered a very low-volume period with the negative flows in Ethereum, we cannot say that a positive trend started before 10.77 was gained. It can be expected to go back and forth between 10.33 – 10.54 levels during the day. The break of the 10.33 level may bring a deep decline.
Supports 10.33 – 9.82 – 9.47
Resistances 10.54 – 10.98 – 11.45
SOL/USDT
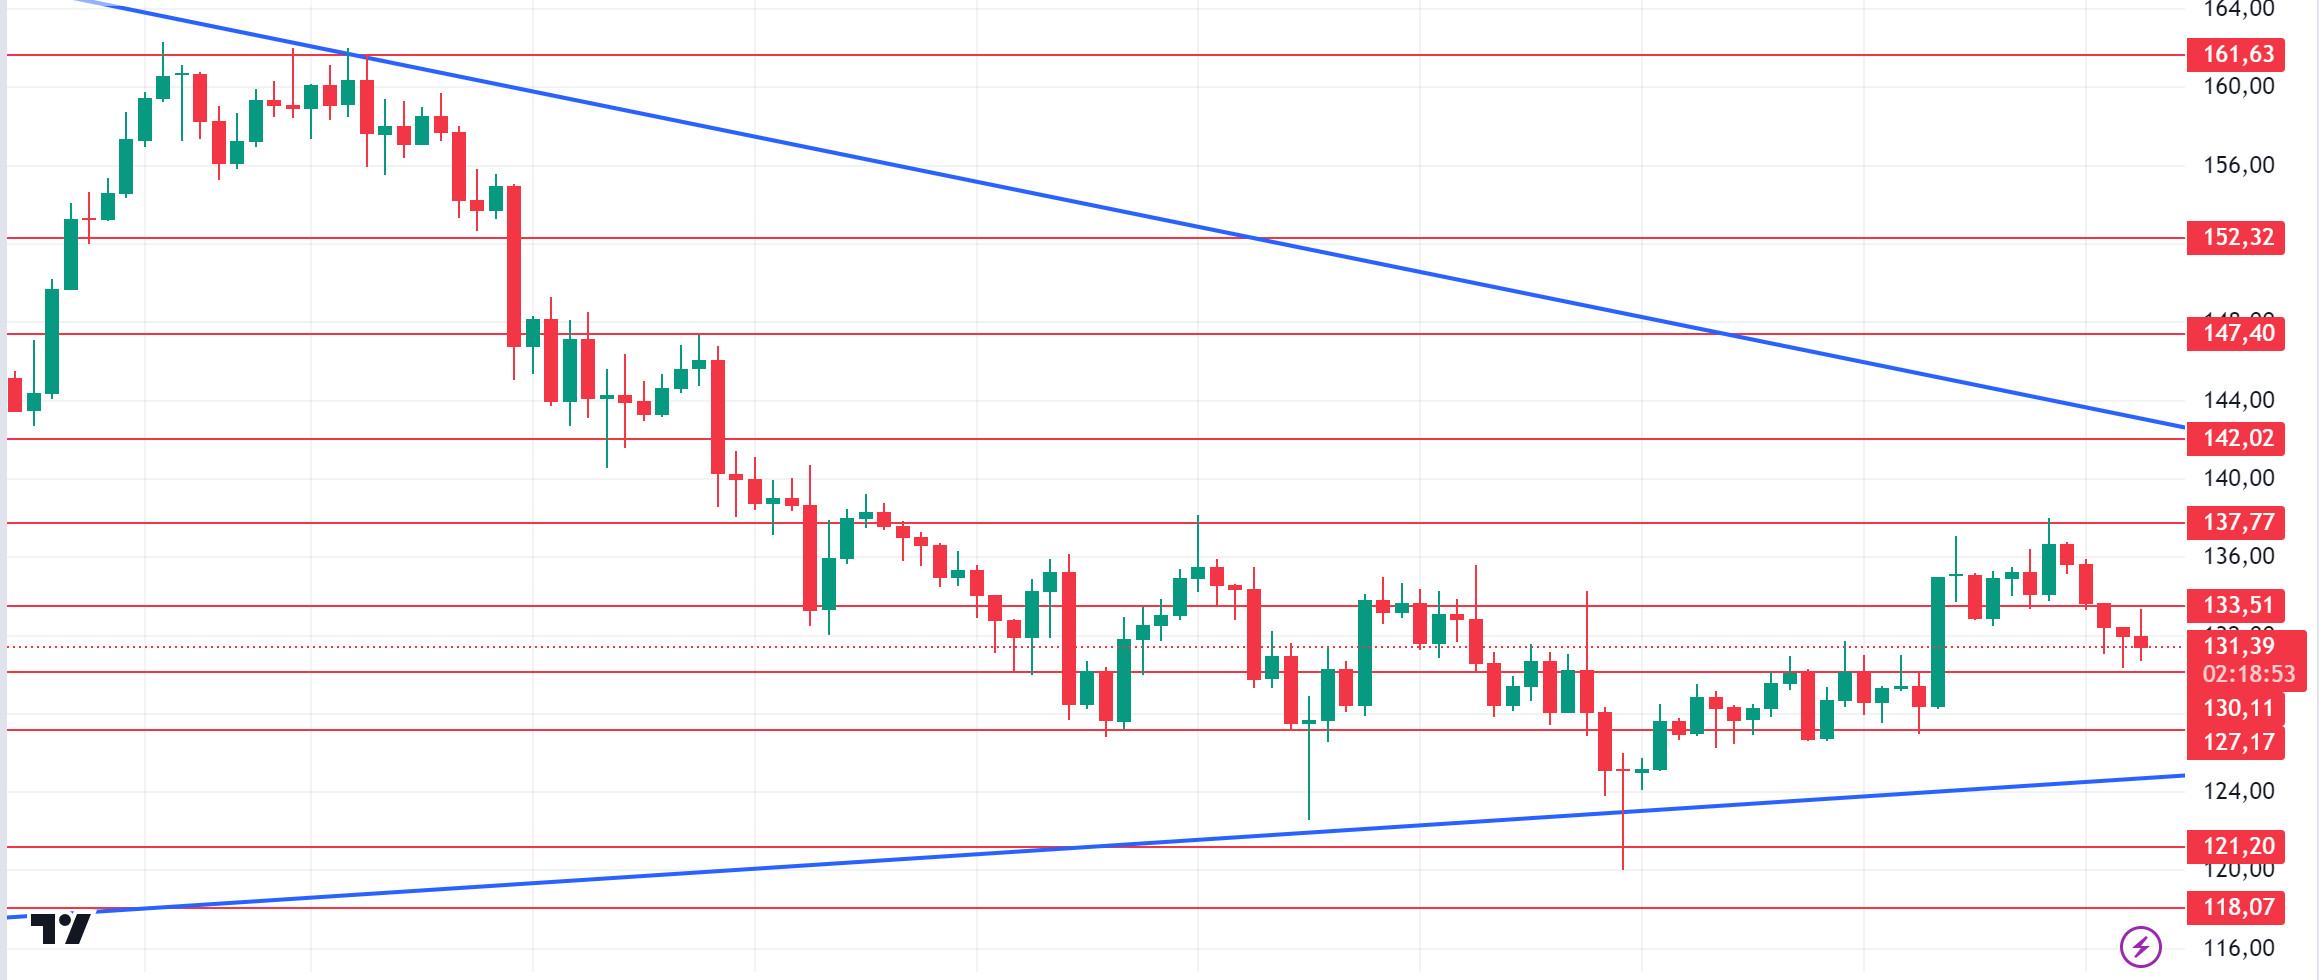
Today, the consumer price index inflation data from the US came in at 2.5% as expected. This caused the cryptocurrency market to fall slightly. On the other hand, last week, the meme token platform pump.fun in the Solana ecosystem decreased by 80% this week. Despite this, we can say that interest in Solana increased as TVL increased. Technically, we see a narrowing triangle pattern. SOL tried the important level of $ 138. The fact that these profit-realizing investors and Kamala’s slight superiority over Trump pushed the price down to about $130. But with the recovery of the market, it is currently trading at $ 132. If the rises continue due to the increase in volumes, it may test the resistance levels of 133.51 – 137.77. In case of profit sales due to yesterday’s rises, support levels of 130.11 – 127.17 should be followed.
Supports 130.11 – 127.17 – 121.20
Resistances 133.51 – 137.77 – 142.02
ADA/USDT
Today, the consumer price index inflation data from the US came in at 2.5% as expected. This caused the cryptocurrency market to fall slightly. In the Cardano ecosystem, founder Charles Hoskinson said on the X platform, “Unlike other protocols, ADA staking tokens are not locked.” He pointed out that this will make it possible for holders to spend or move their assets. ADA consolidates in a narrow range between $0.3020 and $0.3950. When we look at the chart of ADA, it is priced at the middle levels of the falling channel. ADA’s market capitalization fell by 1.62% in the last 24 hours, while its total daily volume fell to $ 194 million. This drop in volume may prevent ADA from exceeding the 0.3950 resistance. In this scenario, 0.3319 – 0.3258 levels can be followed as support levels. A stronger volume increase will be needed to confirm the bullish breakout. If the volume increases, 0.3397 – 0.3460 levels can be followed.
Supports 0.3319 – 0.3258 – 0.3206
Resistances 0.3397 – 0.3460 – 0.3540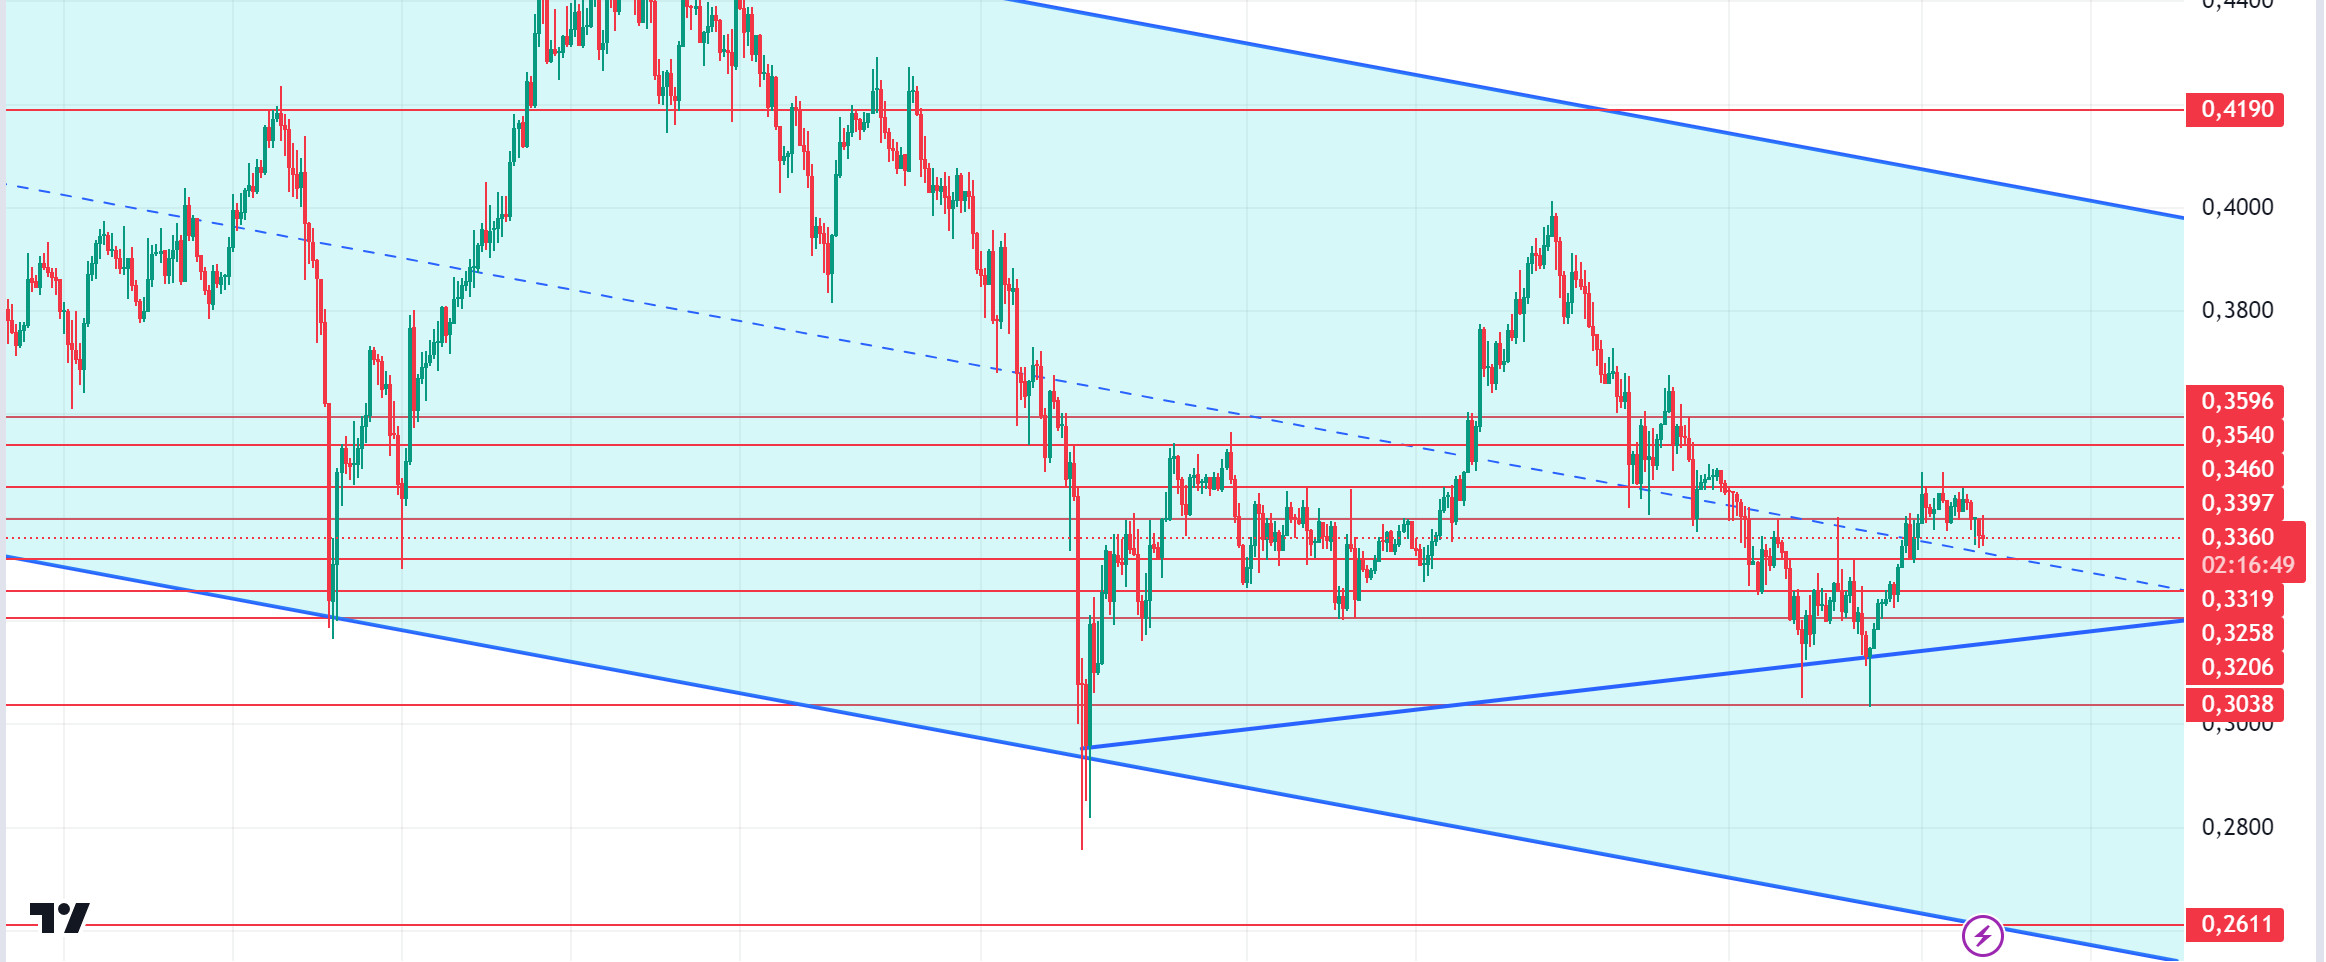
AVAX/USDT
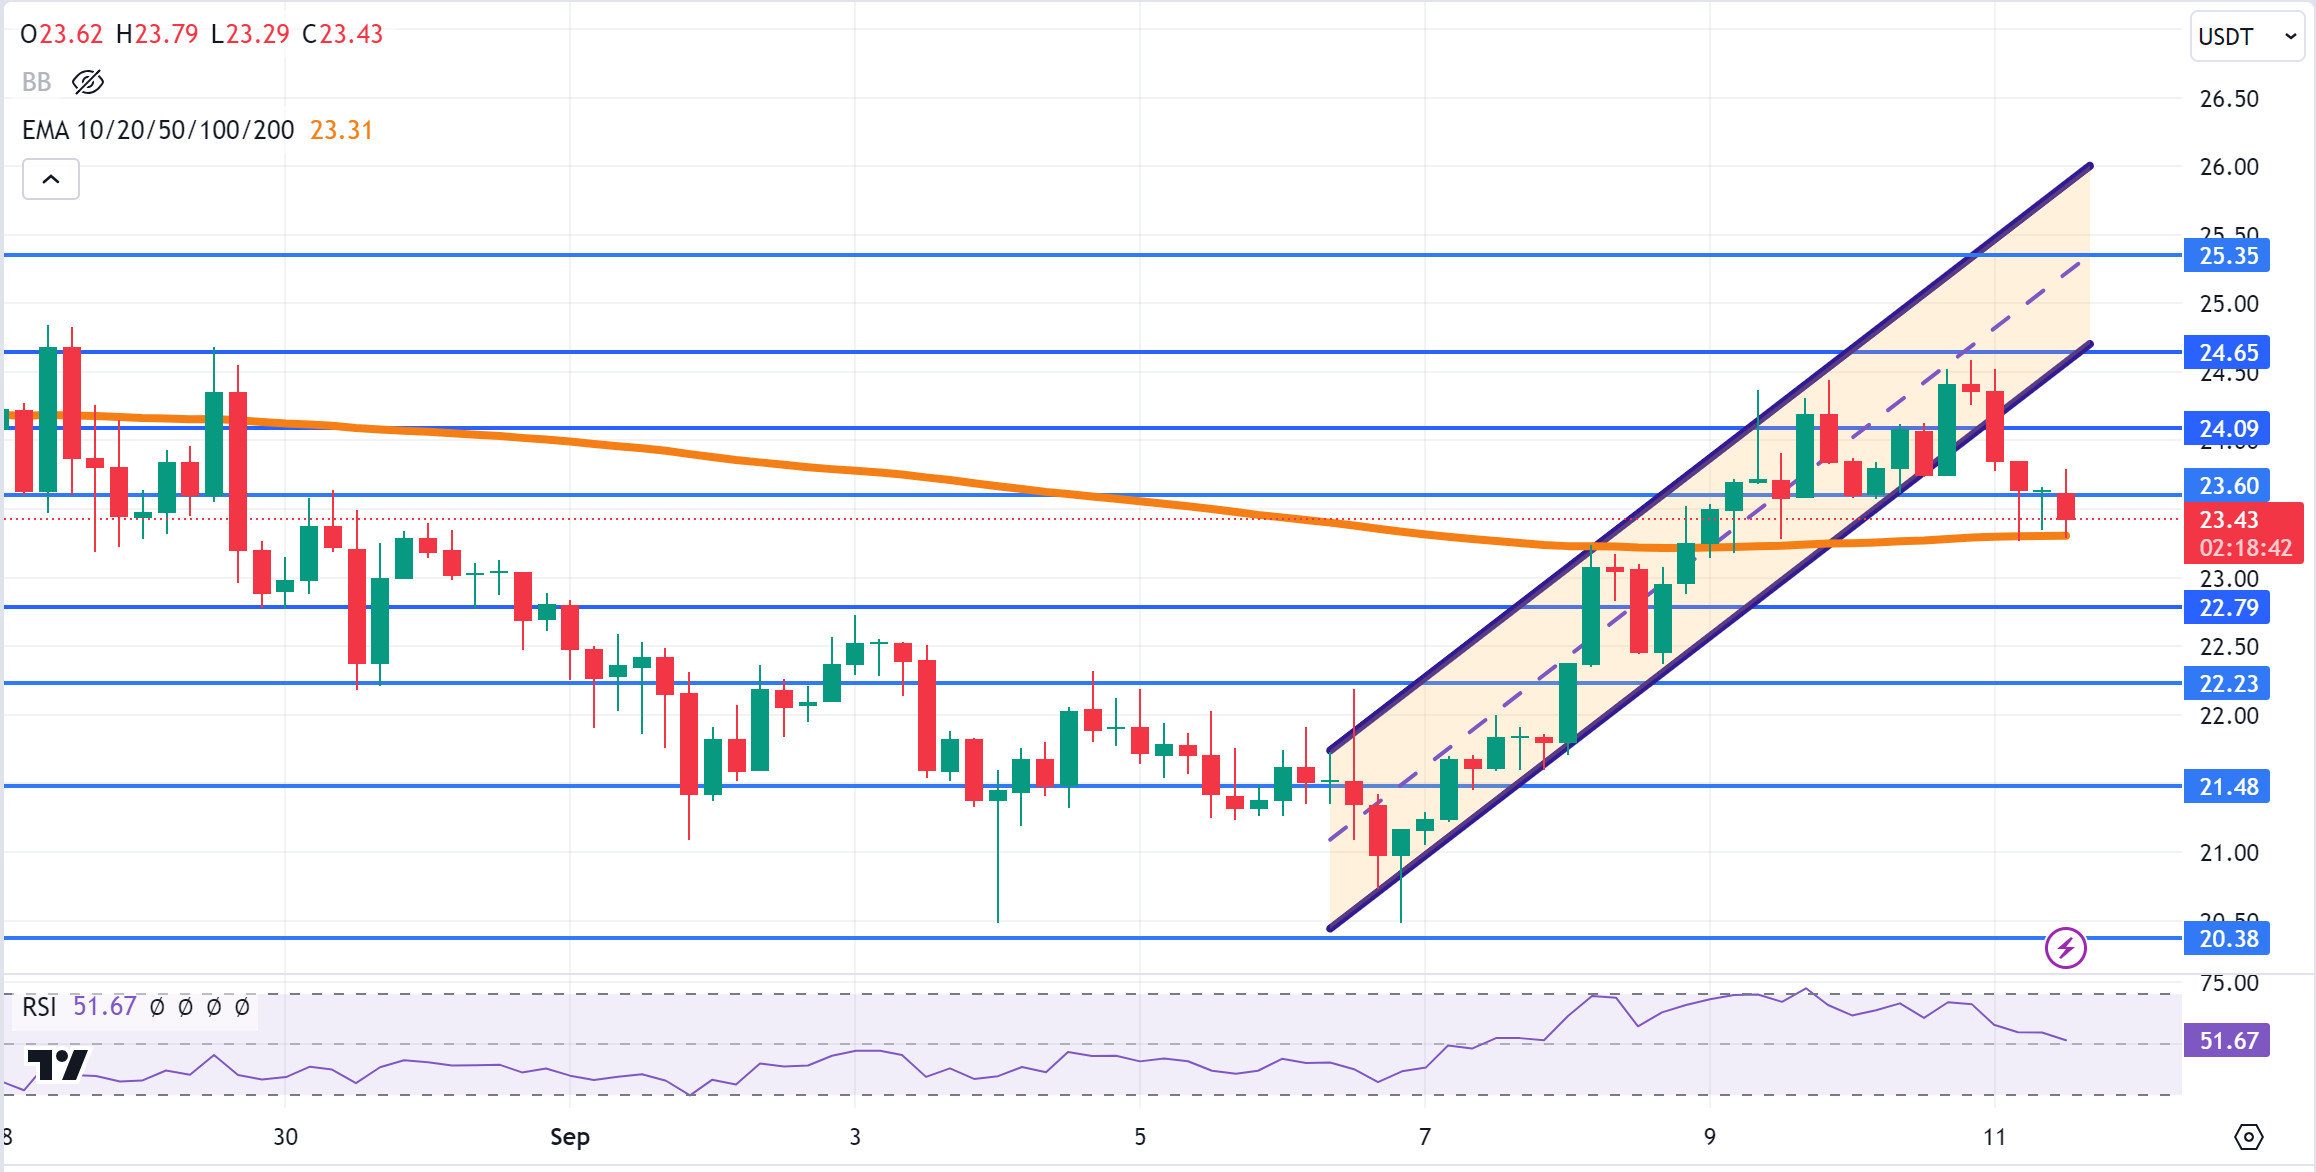
AVAX, which opened today at 24.36, is trading at 23.43 after the consumer price index data announced in line with expectations. AVAX, which fell by about 4% during the day, is seen to react from the EMA200 support by breaking the rising channel downwards on the 4-hour chart. It may rise again with voluminous purchases from here. In such a case, it may test the 24.09 and 24.65 resistances. It may test 22.79 and 22.23 supports with the candle closing below EMA200. As long as it stays above 20.38 support during the day, we can expectthe bullish appetite to continue. With the break of 20.38 support, sales may increase.
(EMA200: Orange)
Supports 23.60 – 22.79 – 22.23
Resistances 24.09 – 24.65 – 25.35
TRX/USDT
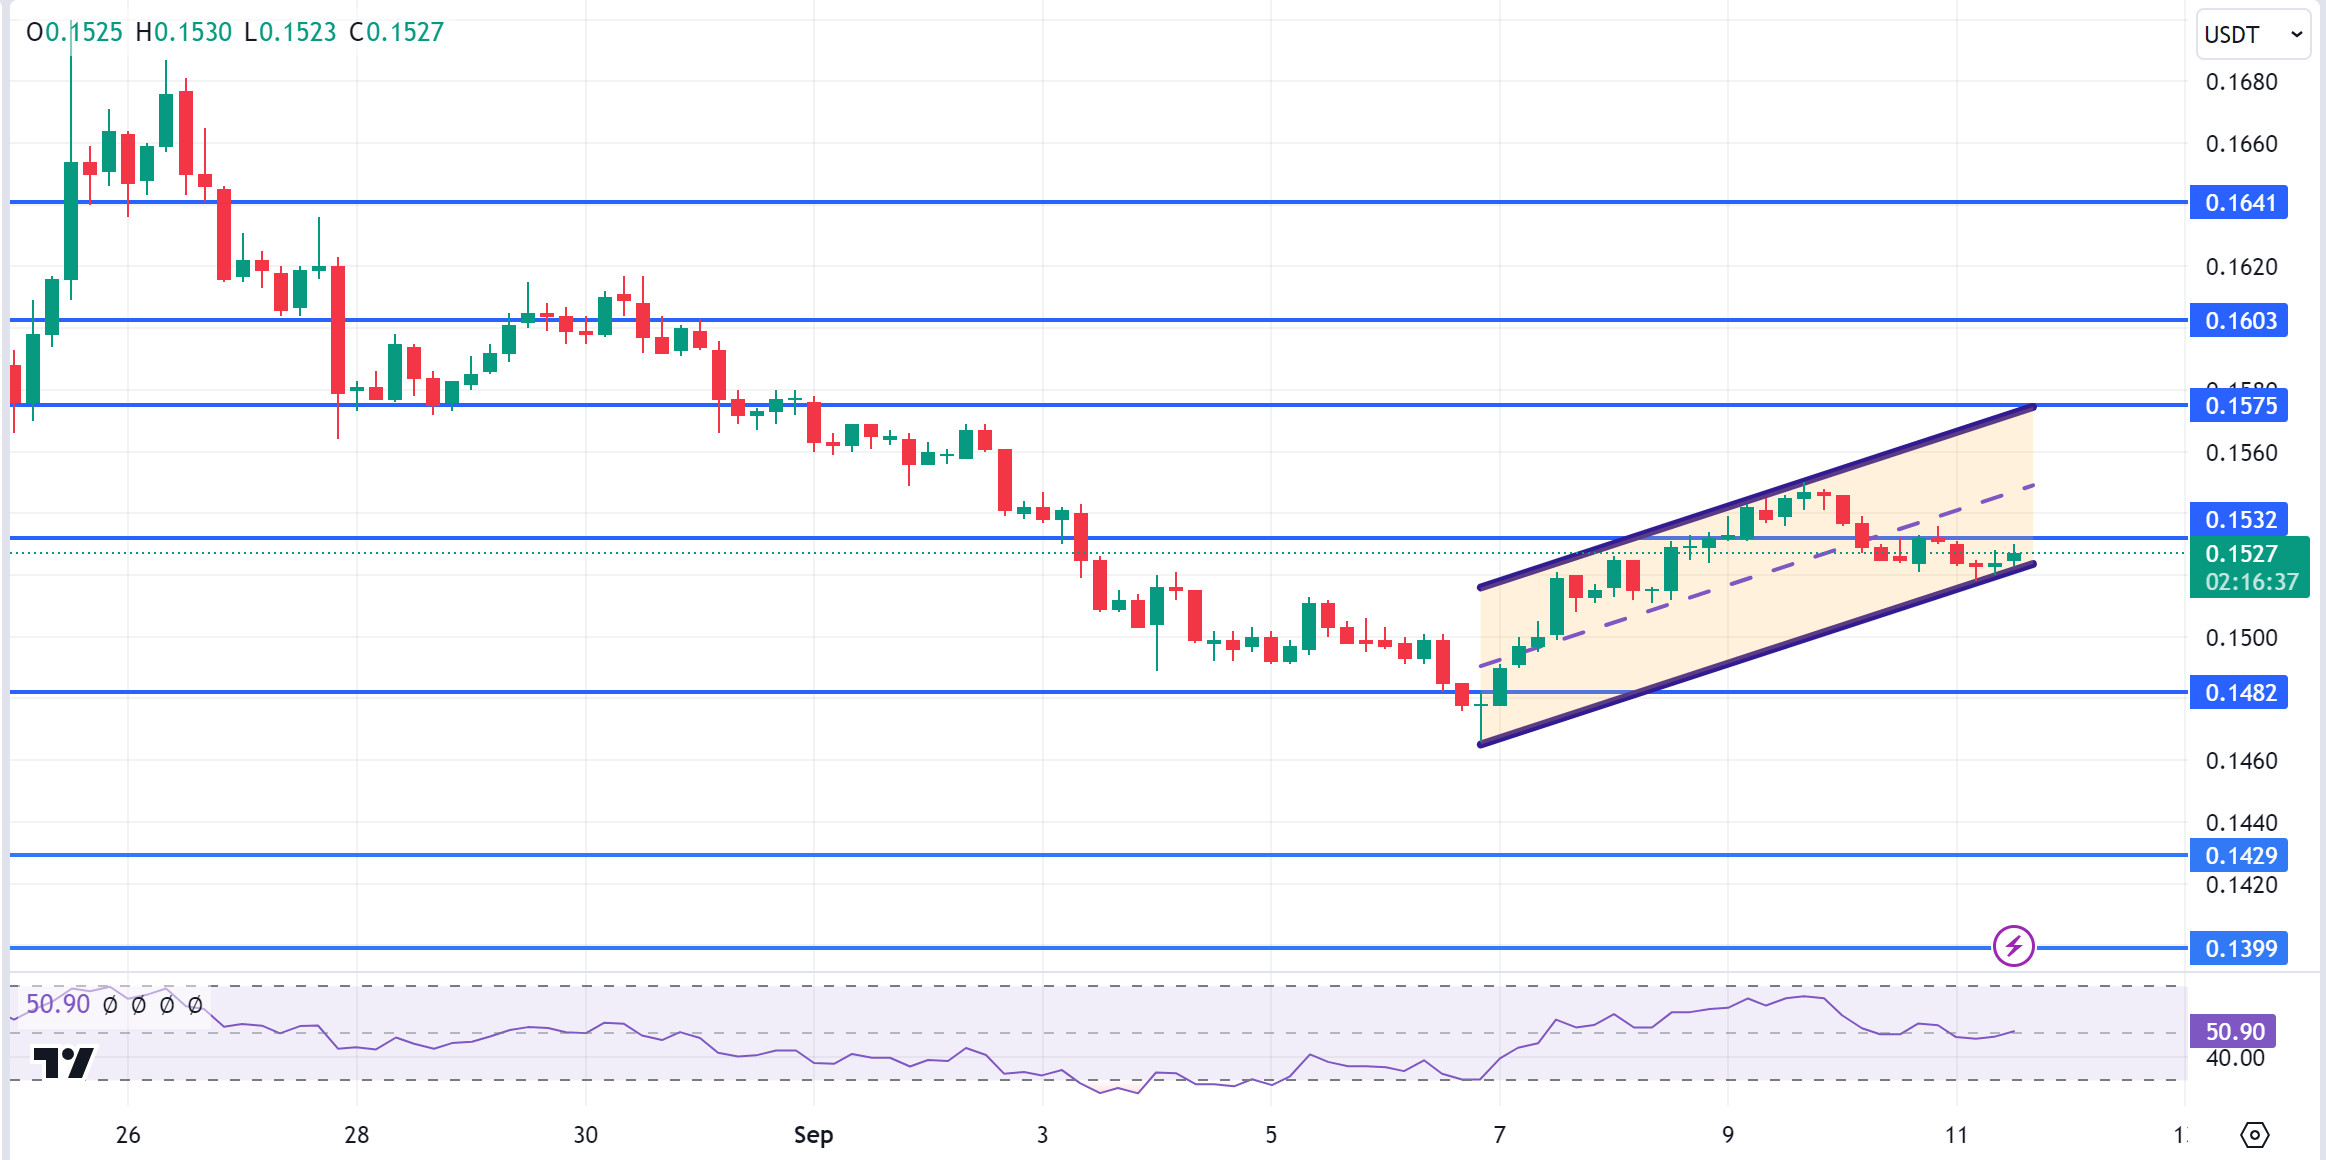
TRX, which started today at 0.1530, is currently trading at 0.1527. Today, as expected, volatility seems to have increased after the US consumer price index data, which was announced as 2.5% annually. TRX continues to move in an ascending channel on the 4-hour chart. It is in the lower band of the channel and we see that the buying reactions from here are weak. If a voluminous buying reaction comes, it can move to the middle and upper band of the channel. In this case, it can test 0.1532 and 0.1575 resistances. If there is no reaction from the lower band of the channel and the decline continues, it may want to test 0.1482 support. As long as TRX stays above 0.1482 support, it can be expected to continue its upward demand. If this support breaks down, sales may increase.
Supports 0.1482 – 0.1429 – 0.1399
Resistances 0.1532 – 0.1575 – 0.1603
XRP/USDT
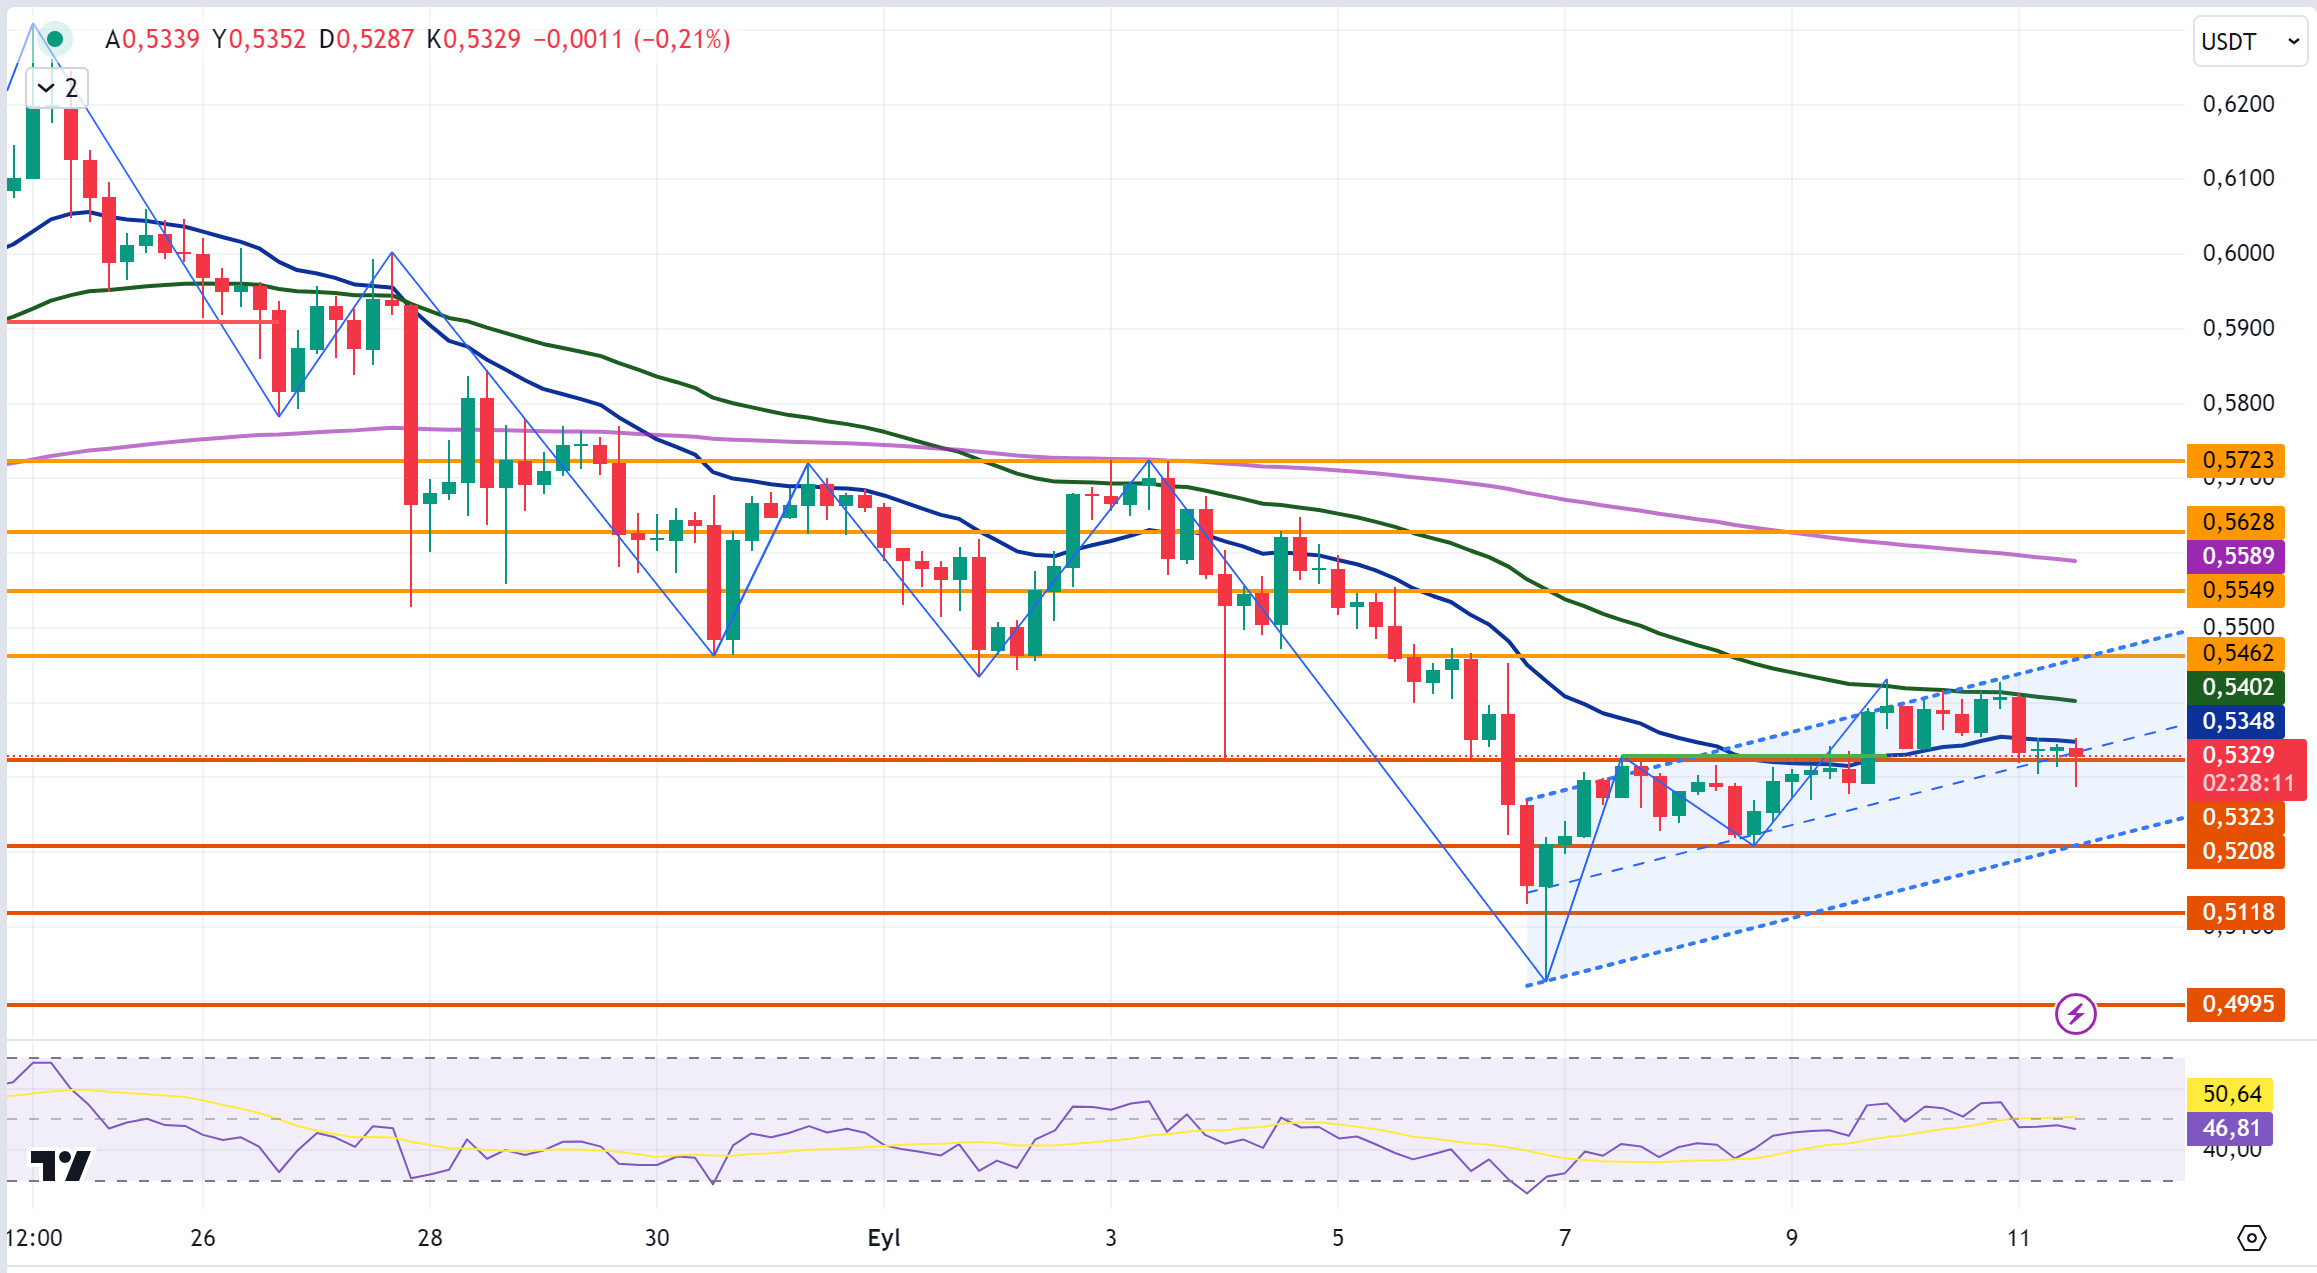
XRP continues to trade at 0.5329 with a 1.5% loss compared to its starting level today. In today’s 4-hour analysis, after breaking the EMA20 (Blue Color) level with the decline it experienced in the first candle, it tested the 0.5323 support level and failed to break it and rose with the reaction purchases. In its rise, it also tested the EMA20 level upwards and could not break it. When we analyze the 4-hour analysis, XRP continues to move in a horizontal band stuck between the EMA20 level and the 0.5323 support level today. If the crypto market and XRP continue to rise after the positive developments that may come on behalf of the crypto market and XRP and continue its rise by breaking the EMA20 level, XRP may test the resistance levels of 0.5462-0.5549-0.5628. On the contrary, if the developments are negative, it may test the 0.5323-0.5208-0.5118 support levels if it continues its decline by breaking the 0.5323 support level.
Supports 0.5323 – 0.5208 – 0. 5118
Resistances 0.5462 – 0.5549 – 0.5628
DOGE/USDT
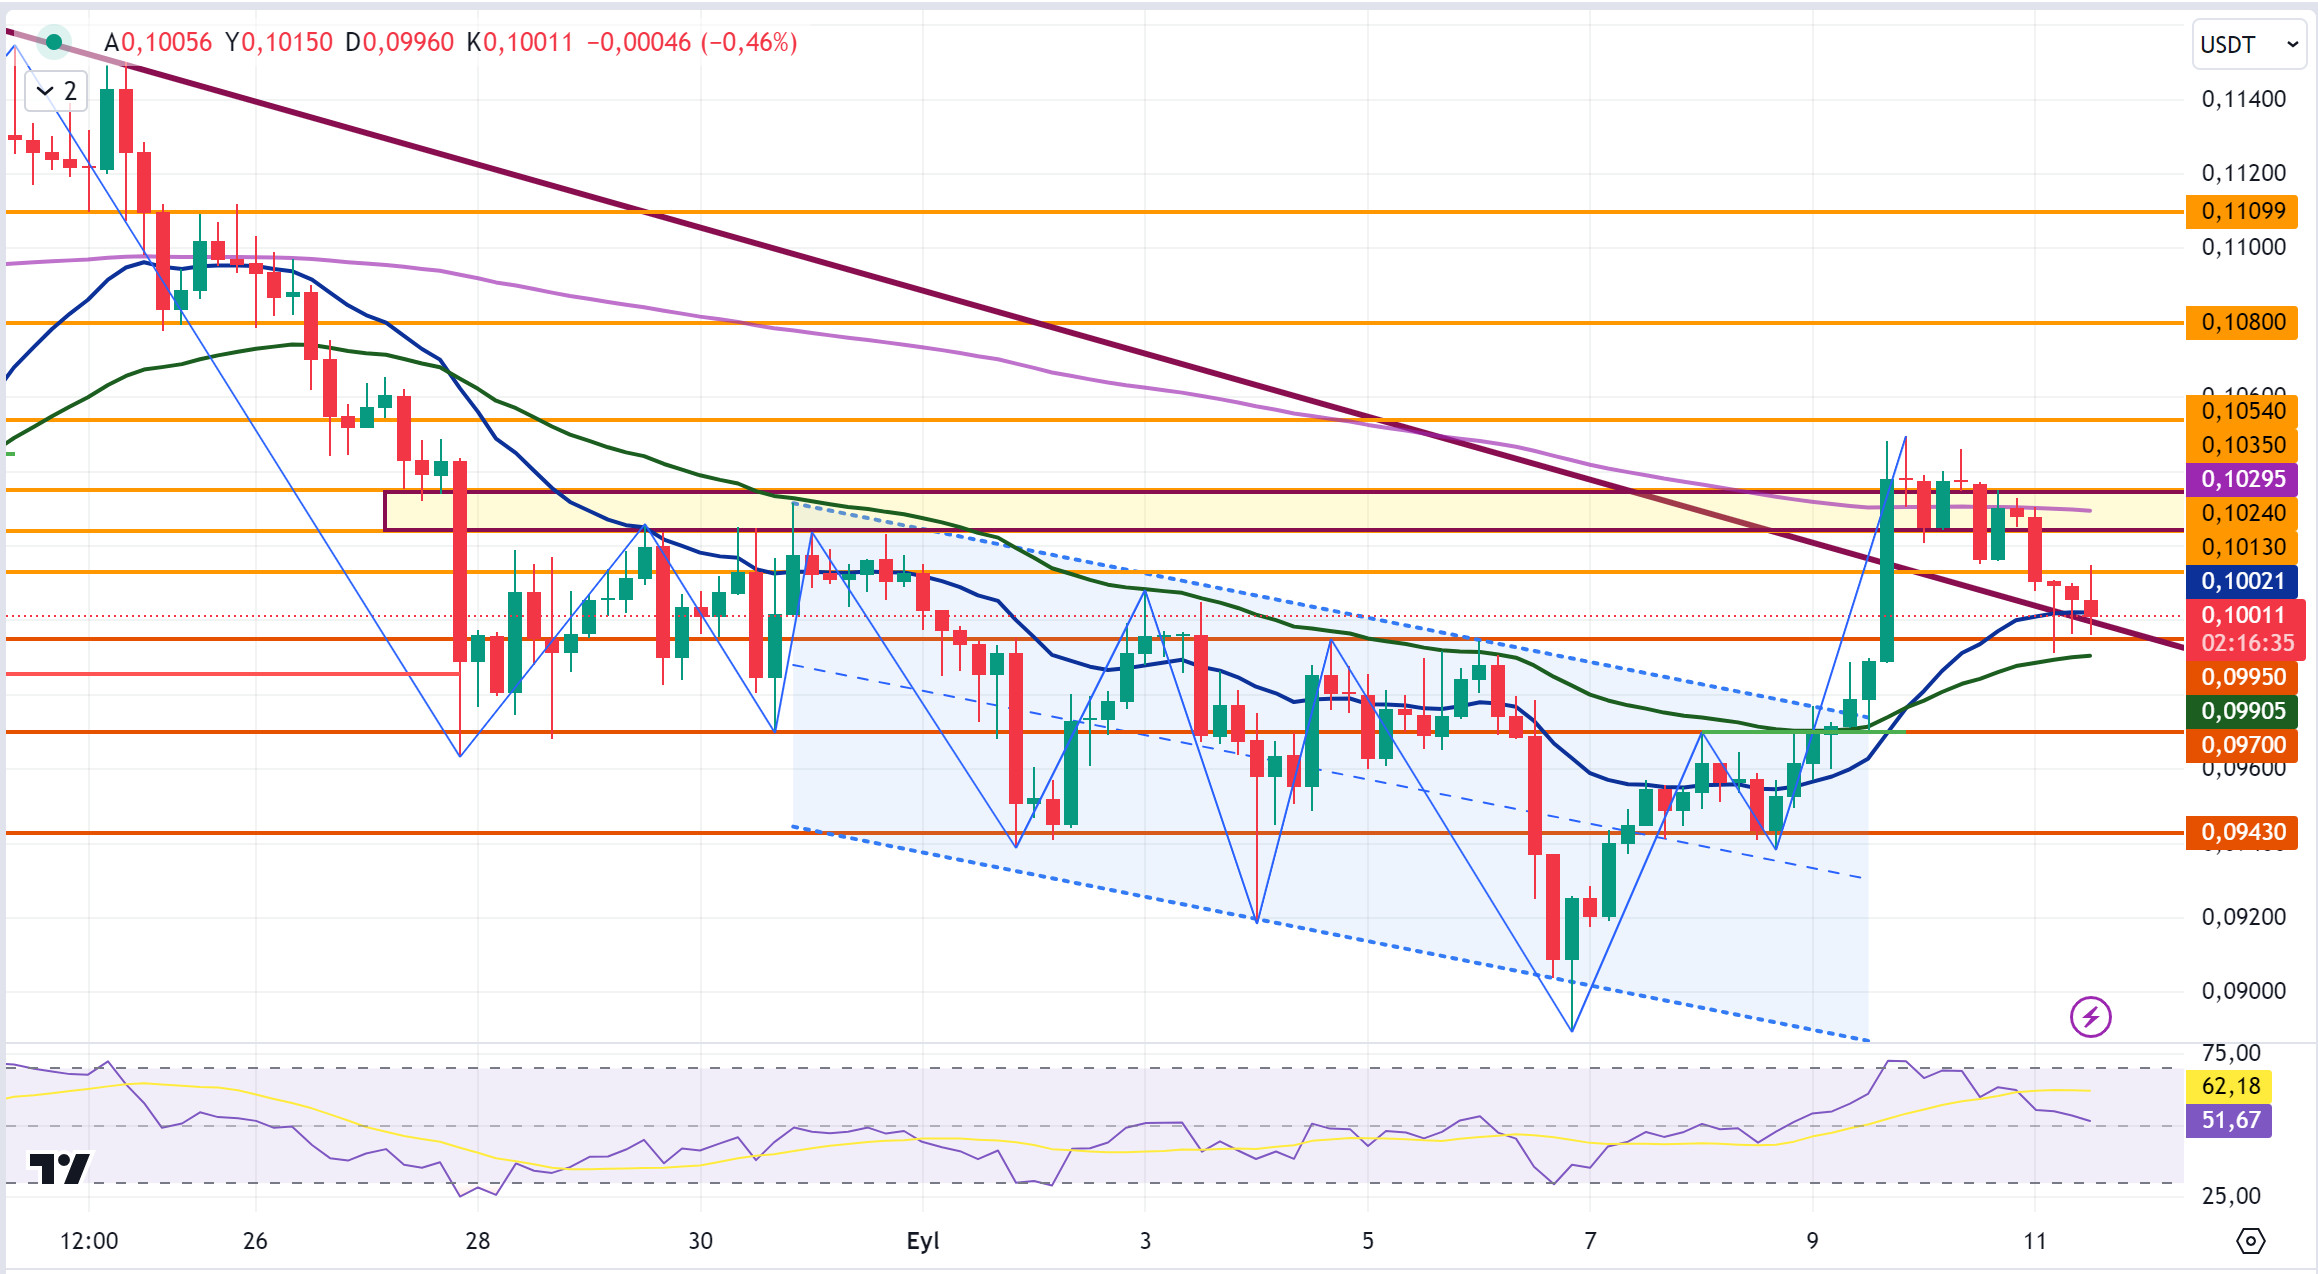
DOGE lost 2.75% of its value with the decline it experienced today and is currently trading at 0.1001. DOGE, which moved within the horizontal band of 0.1024-0.1035 before the presidential debate within the scope of the US presidential election race, broke the support level of 0.1013 in the first candle in the 4-hour analysis today and fell to 0.1010 level after the presidential debate was negative for the crypto market. DOGE, which continued to decline afterwards, recovered with reaction purchases at the 0.0995 support level during the decline. When we examine the 4-hour analysis, DOGE made a horizontal band change with its last decline and is currently moving within the 0.0995-0.1013 horizontal band. DOGE, which moves in parallel with the crypto market, will retest the 0.1013 resistance level by rising in case of positive developments on behalf of the market. If the level in question is broken, it can test the resistance levels of 0.1035-0.1054-0.1080. Otherwise, it may test the support levels of 0.0995-0.0970-0.0943 as the decline continues.
Supports 0.0995 – 0.0970 – 0.0943
Resistances0.1035 – 0.1 054 – 0.1080
DOT/USDT
The Polkadot ecosystem has taken an important step towards interoperability between blockchains. Web3 Foundation and Scytale Digital have made a $2.5 million seed investment in a new protocol called Hyperbridge. Hyperbridge is a secure and scalable cross-chain communication technology built on Polkadot. Furthermore, Hyperbridge has gained a parachain slot on Polkadot, strengthening the platform’s deep integration in the ecosystem.
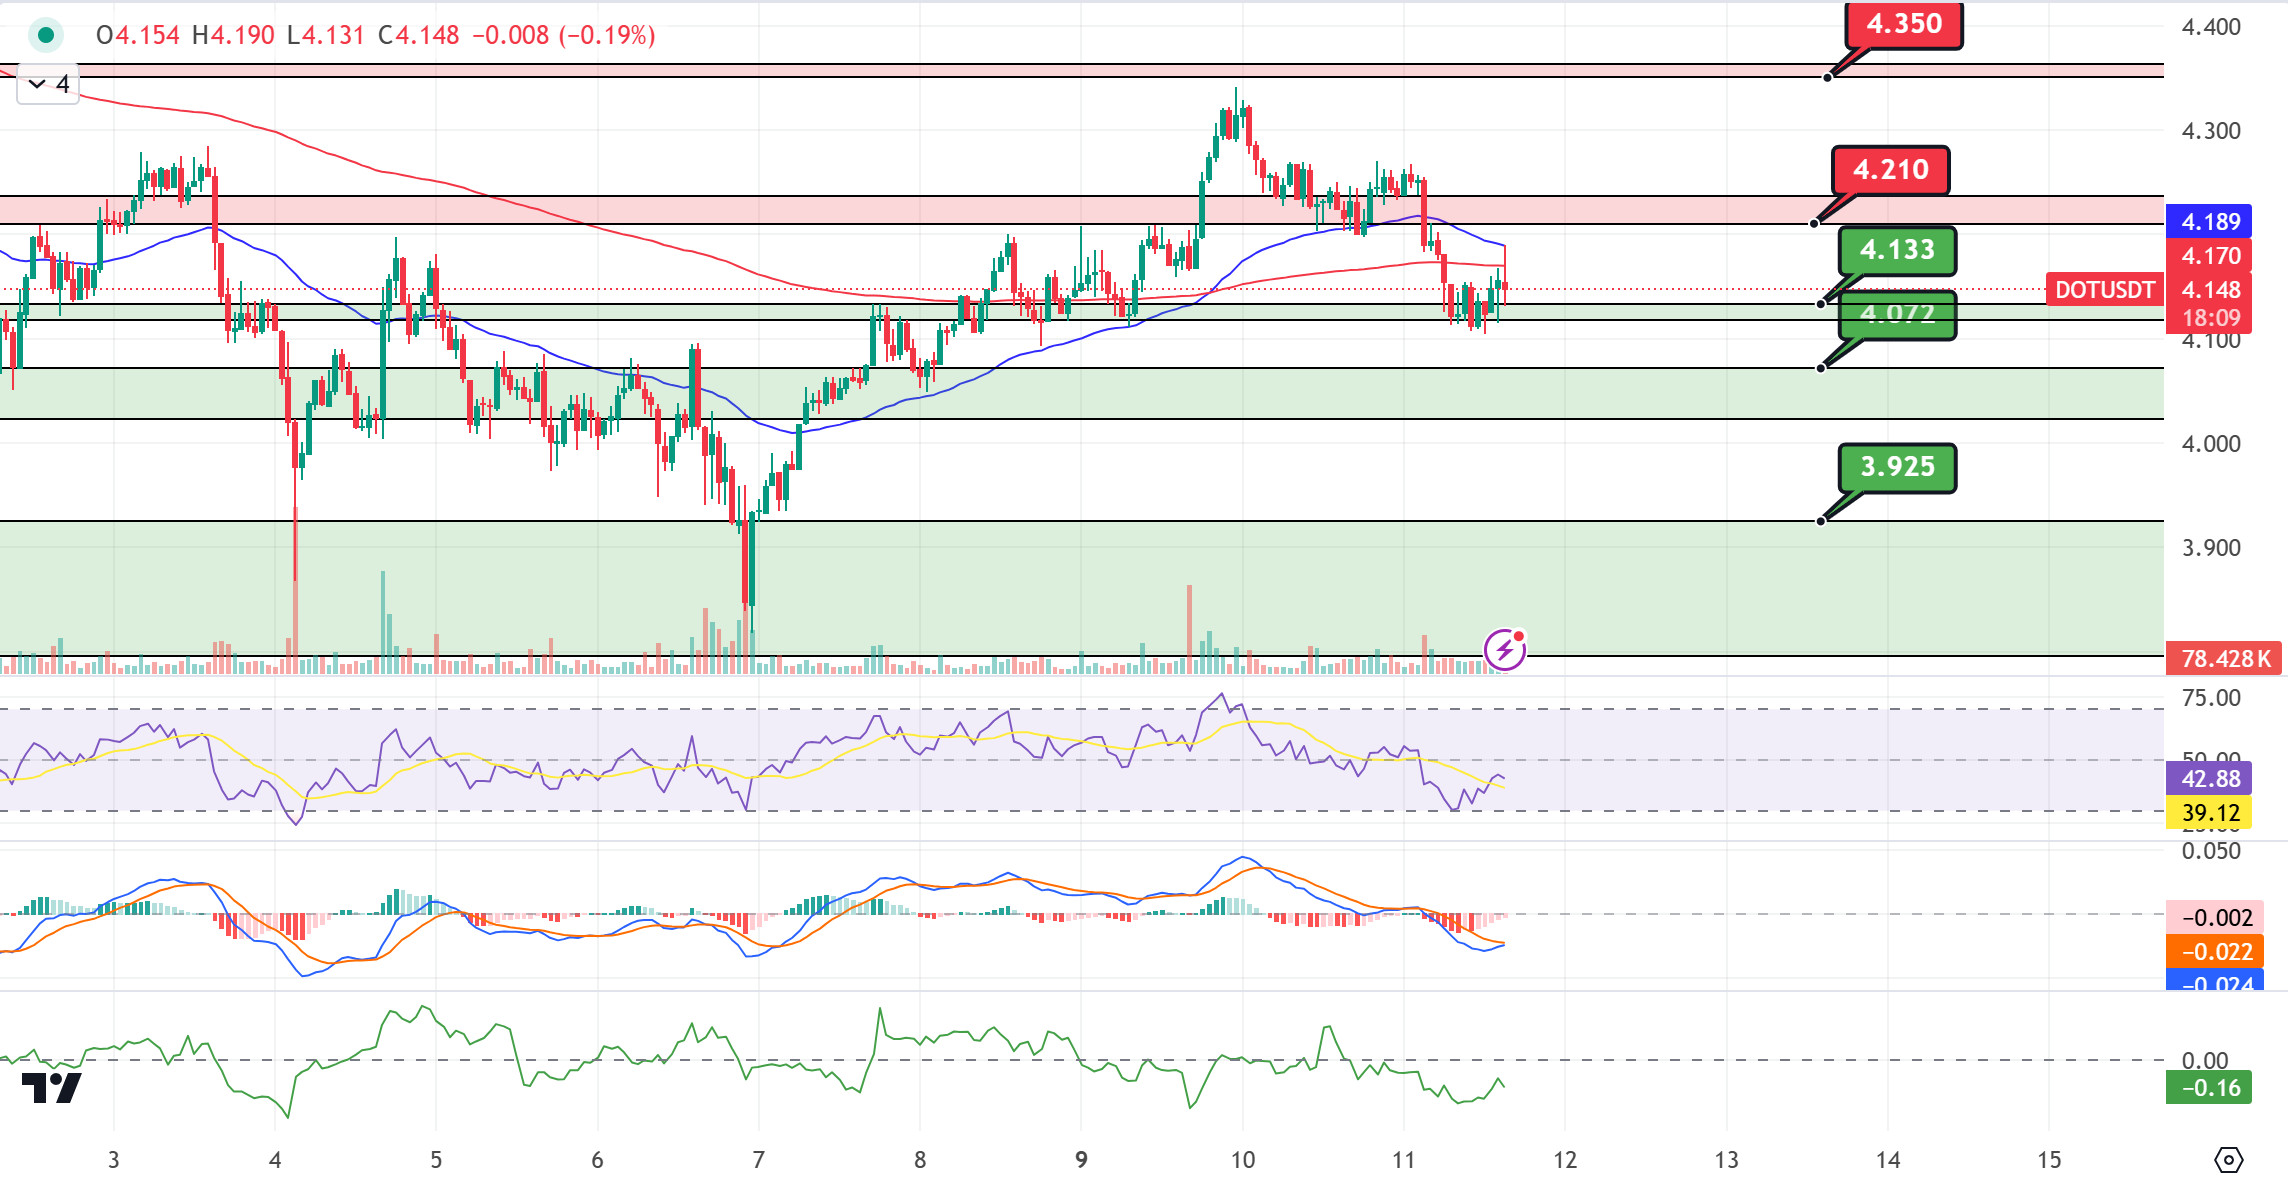
When we examine the DOT chart, the price rose to the EMA 50 level with the reaction from the support of 4.133 and was rejected again. When we examine the MACD oscillator, we see that the selling pressure has decreased compared to the previous hour. In a positive scenario, if the price maintains above the EMA200 level, it may rise towards the next resistance level of 4,210. On the other hand, in case of increased selling pressure, if the price moves below the 4,133 level, it may retreat to the next support level of 4,072.
(Blue line: EMA50, Red line: EMA200)
Supports 4,133 – 4,072 – 3,925
Resistances 4.210 – 4.350 – 4.454
SHIB/USDT
The Shiba Inu (SHIB) ecosystem recorded a burn rate increase of 8193% in the last 24 hours. During this period, 3.1 million SHIBs were removed from circulation. Although the burns briefly boosted the price, SHIB fell back to $0.00001324. Market volume decreased by 20.54% to $135.49 million. Price fluctuations continue despite deflationary efforts.
As for the SHIB chart, the price rose up to the EMA200 and was rejected from this level. Analyzing the MACD oscillator, we see that the selling pressure decreased compared to the previous hour. If the price holds above the EMA200, its next target could be the first resistance level of 0.00001358. On the other hand, the price may retreat to the first support level of 0.00001300 with the reaction from EMA200.
(Blue line: EMA50, Red line: EMA200)
Supports 0.00001300 – 0.00001271 – 0.00001227
Resistances 0.00001358 – 0.00001412 – 0.00001443
LEGAL NOTICE
The investment information, comments and recommendations contained herein do not constitute investment advice. Investment advisory services are provided individually by authorized institutions taking into account the risk and return preferences of individuals. The comments and recommendations contained herein are of a general nature. These recommendations may not be suitable for your financial situation and risk and return preferences. Therefore, making an investment decision based solely on the information contained herein may not produce results in line with your expectations.


