
MARKET SUMMARY
Latest Situation in Crypto Assets
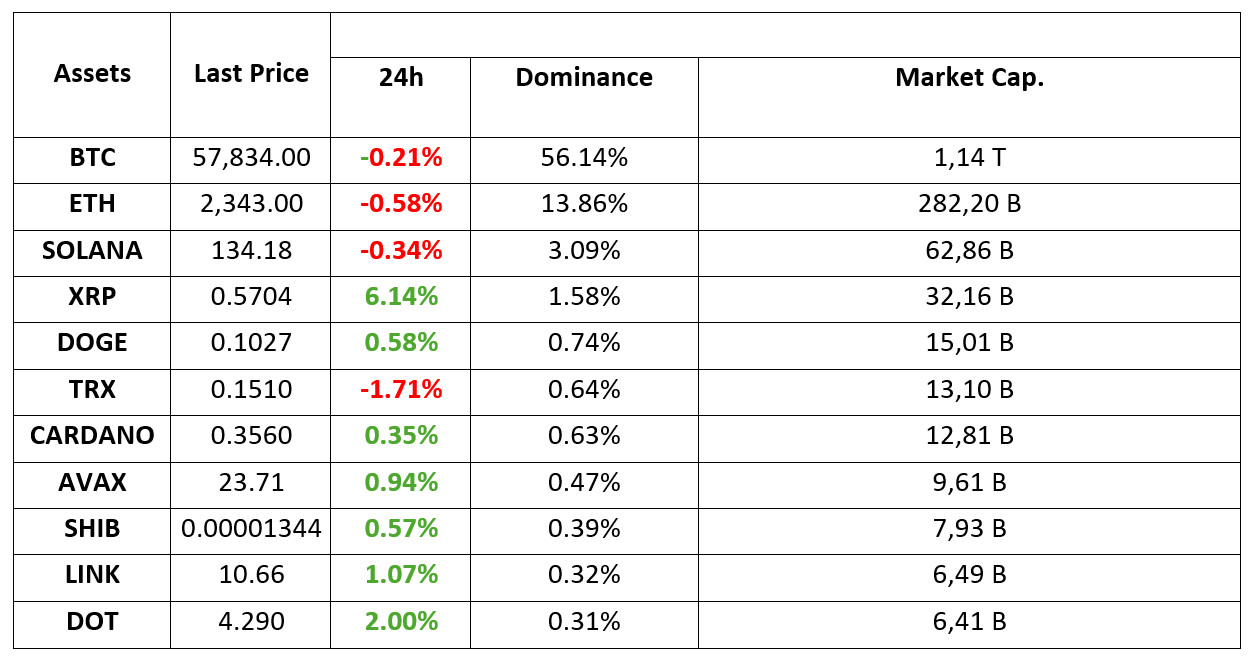
*Table prepared on 13.09.2024 at 07:00 (UTC)
WHAT’S LEFT BEHIND
Donald Trump is Coming with DeFi Project! Available September 17th
Donald Trump is returning to the cryptocurrency world on September 17th with a new platform, World Liberty Financial. The platform is built on financial independence and Blockchain technology. The launch on X Spaces is generating a lot of interest around the world.
CryptoQuant: Bitcoin Signals Bullish Signals Amid Dwindling Reserves
Recent data reveals that decreasing Bitcoin reserves and increasing stablecoin reserves on exchanges are indicative of a potential price increase. Investors need to be careful. Because while these trends have historically led to price jumps, market conditions may be signaling an upside breakout for Bitcoin.
SEC Chairman Gary Gensler is in hot water!
US Securities and Exchange Commission Chairman Gary Gensler has been criticized by Republican lawmakers over allegations of politically connected hiring. Gensler’s harsh sanctions, especially against the cryptocurrency world, are also raising controversy. Former President Donald Trump says he will dismiss Gensler if he wins the election.
HIGHLIGHTS OF THE DAY
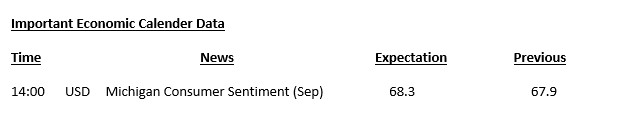
INFORMATION
*The calendar is based on UTC (Coordinated Universal Time) time zone. The economic calendar content on the relevant page is obtained from reliable news and data providers. The news in the economic calendar content, the date and time of the announcement of the news, possible changes in the previous, expectations and announced figures are made by the data provider institutions. Darkex cannot be held responsible for possible changes that may arise from similar situations.
MARKET COMPASS
Global markets focused on the US Federal Reserve’s interest rate decision to be announced on September 18. Although the inflation data released this week did not support a “Jumbo” rate cut by the FED in September, recent statements and pricing in the bond market indicate that this issue is still on the table.
William Dudley, former president of the New York Fed, stated that he sees room for a 50 basis point rate cut at next week’s Federal Open Market Committee (FOMC) meeting. Markets were not expecting such a move after inflation data (both CPI and PPI) came in above expectations on a monthly basis. According to the CME FedWatch Tool, the likelihood of a 25 basis point rate cut was as high as 80% but dropped to 57% after Dudley’s remarks. The dollar index gave back its gains and US bonds appreciated, causing yields to fall.
Taking this last equation into account, when we look at the current pricing, we see that the pricing in the equity markets has turned flat. While the decline in the dollar brought a rise in the Japanese Yen, we saw a sell-off in the Japanese stock market in parallel. However, the preparation for next week seems to be more dominant in European and US indices.
Although you would think that the possibility of a 50 basis point rate cut at the Fed’s most recent meeting should support risk appetite, the situation seems a bit calmer. The only notable money flows so far have been in the bond markets. The potential optimism in risk sentiment has not been reflected in equity markets and digital assets.
The pressure on bitcoin from the September 4 peak may be due to the fact that the cash glut is taking place on the bond side. Major global investors seem to be preparing for the Fed’s interest rate decision. In this parallel, we can say that it is thought-provoking that the rise is not strong with the 50 basis point interest rate cut coming back to the fore (although a 25 basis point cut is still seen as a greater possibility). In addition, the decline in the dollar index did not have any reflection on crypto assets. Until the September 18 FOMC meeting, this situation, which leaves a gap in the equation, can be expected to bring a rise to crypto assets. However, it is necessary to question why this gap is not reflected in current prices and does not support the rise.
We have seen many times that markets prefer to remain cautious ahead of critical developments. Exactly how big the FED will start cutting interest rates remains uncertain. Therefore, we can say that it will not be surprising to see horizontal price changes, occasional sharp and short-term rises and falls for no reason.
TECHNICAL ANALYSIS
BTC/USDT
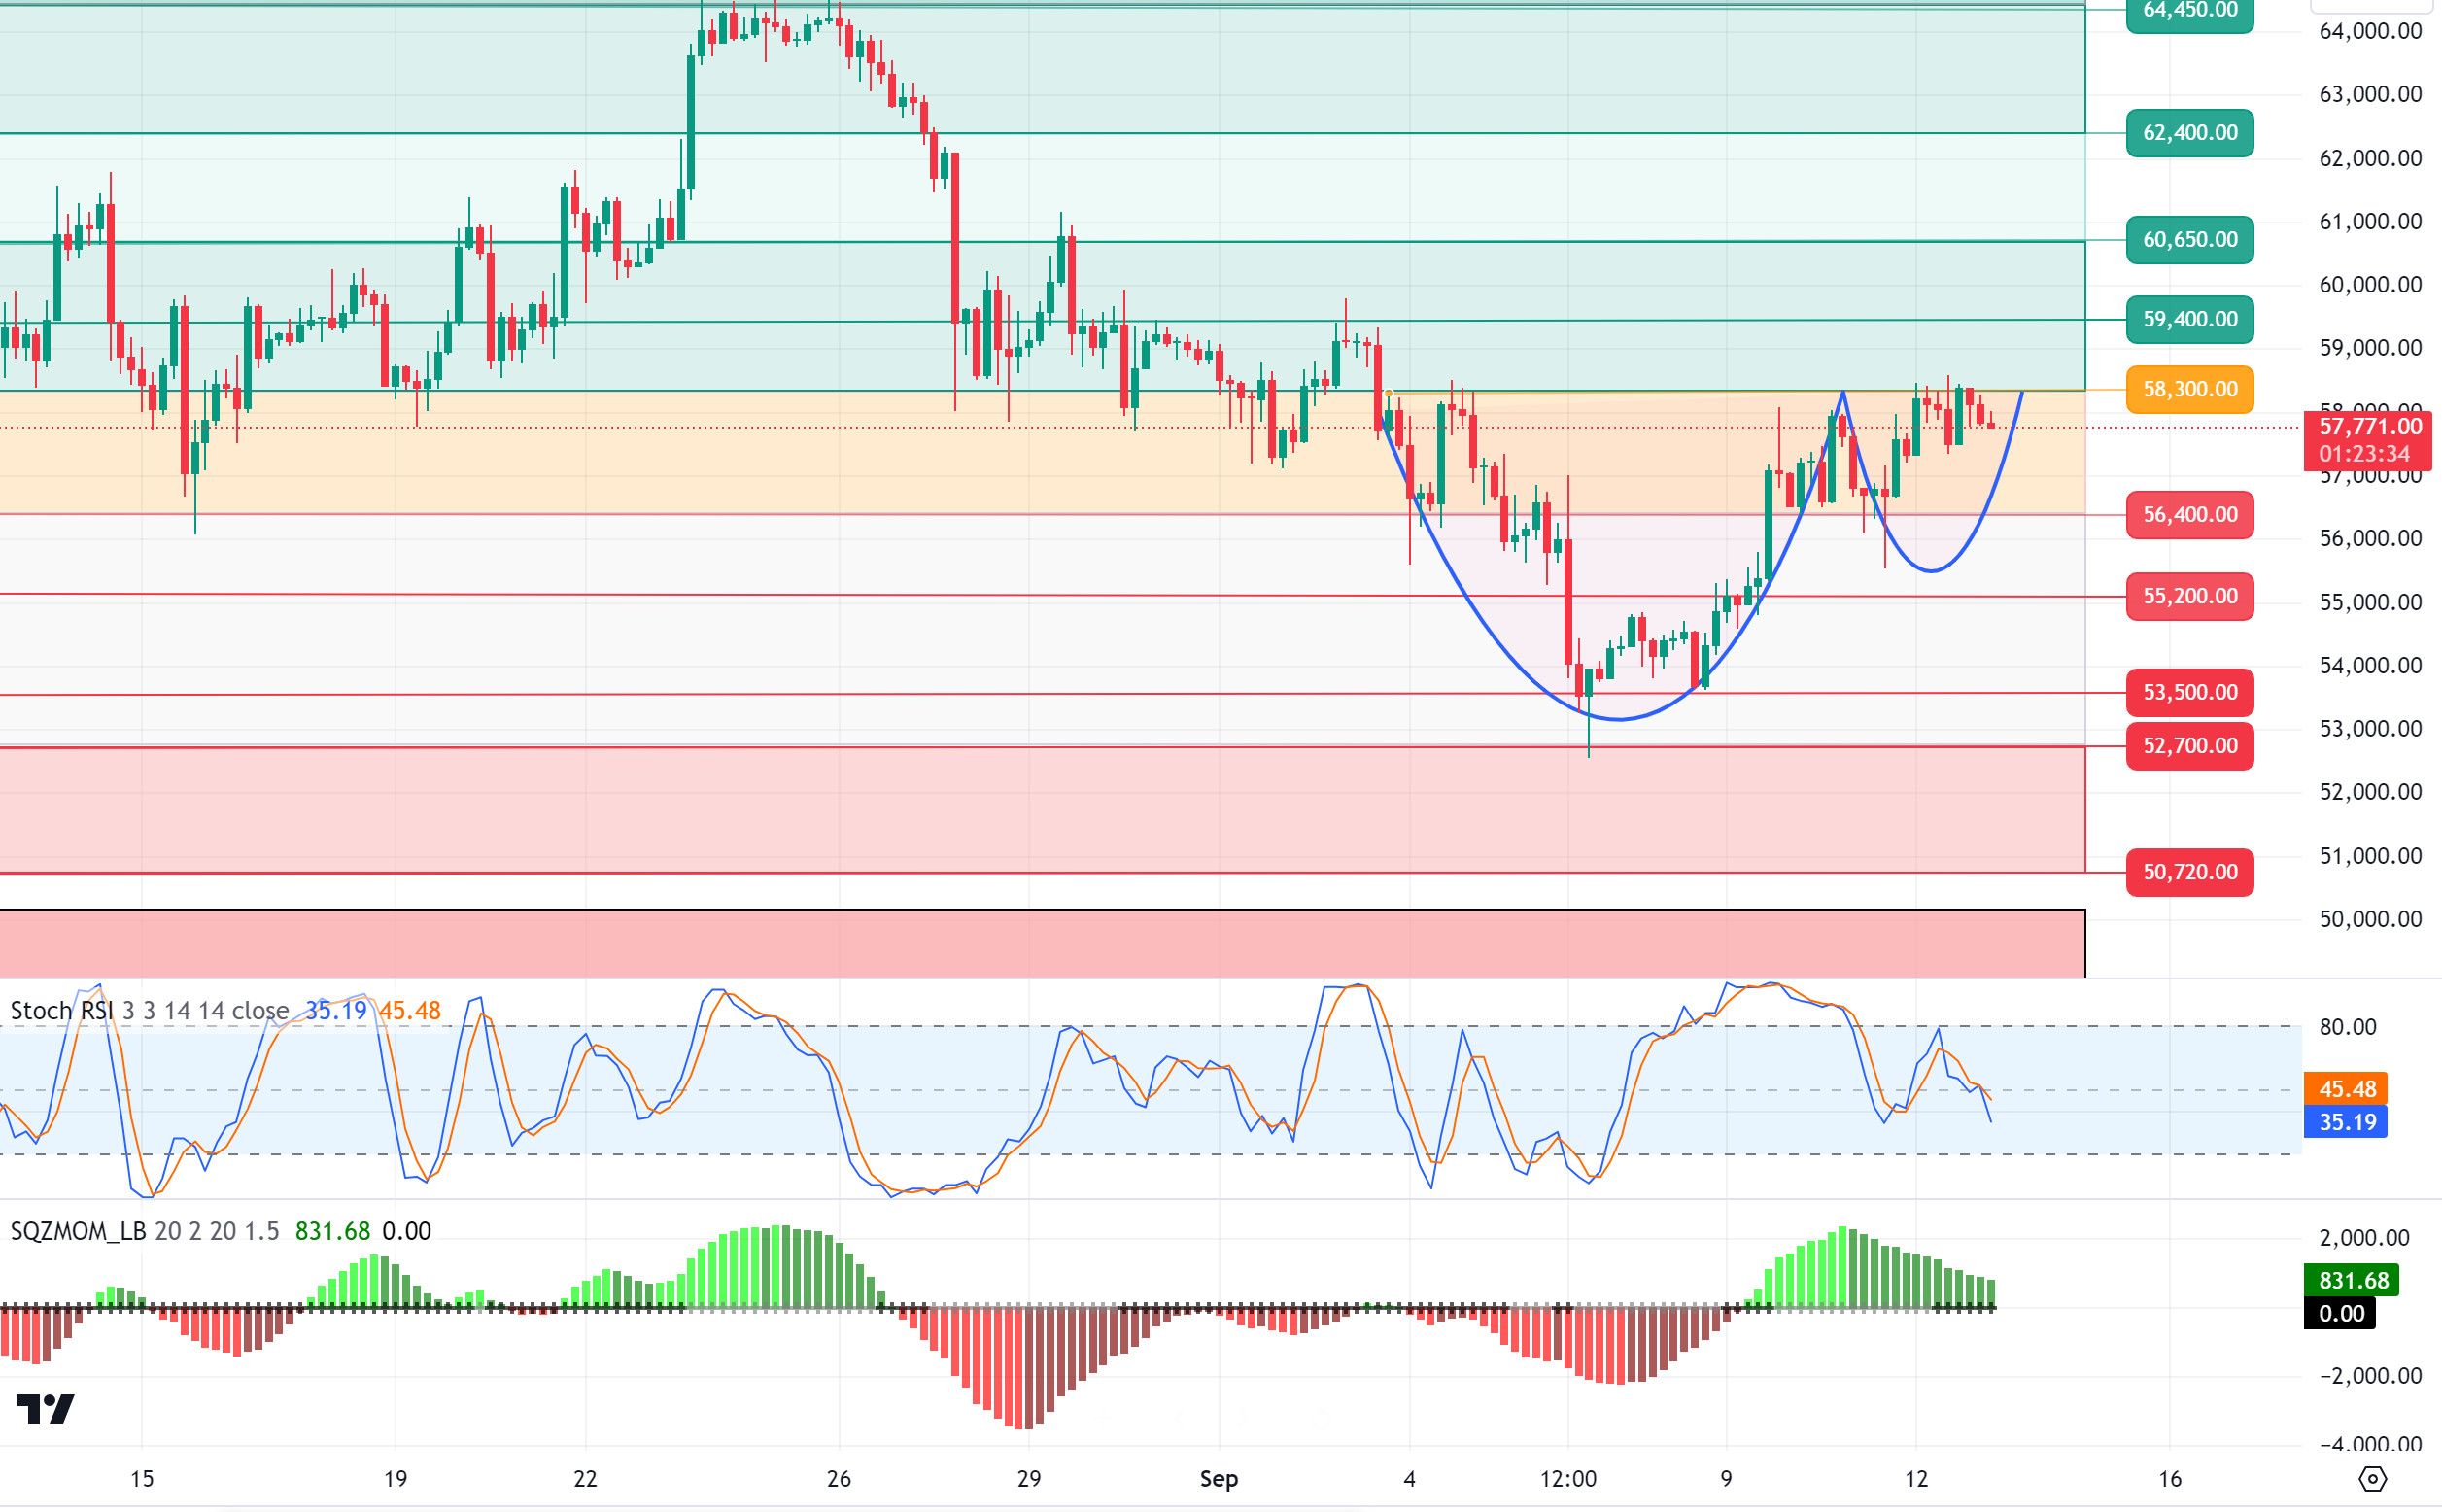
Will there be a breakout in Bitcoin? Bitcoin, which is in the midst of a busy agenda, is expected to break out in the face of optimistic macroeconomic data. With the FED interest rate meeting just around the corner and the market pricing in an interest rate cut, the resulting increase in liquidity could boost Bitcoin and risky assets. As a matter of fact, Bitcoin continues to stand strong by pushing the 58,000 level despite ETF outflows and miner sales in recent days. In the light of the latest data, the decreasing Bitcoin reserves in the stock exchanges may be among the factors affecting its strong stance. The size of the options expiring today indicates that there may be serious fluctuations in Bitcoin prices. This could lead to sudden price movements in the market. Prices may move sharply up or down. In the BTC 4-hour technical analysis, the price continues to push the resistance level at 58,300, which it has tested several times but has yet to break. In case of a breakout, the range could extend towards the psychological resistance zone at 60,650. In case of a pullback, the 56,400 level may serve as support as the RSI turns down and the momentum indicator weakens.
Supports 57,200 – 55,200 – 56,400
Resistances 58,300 – 59,400 – 60,650
ETH/USDT
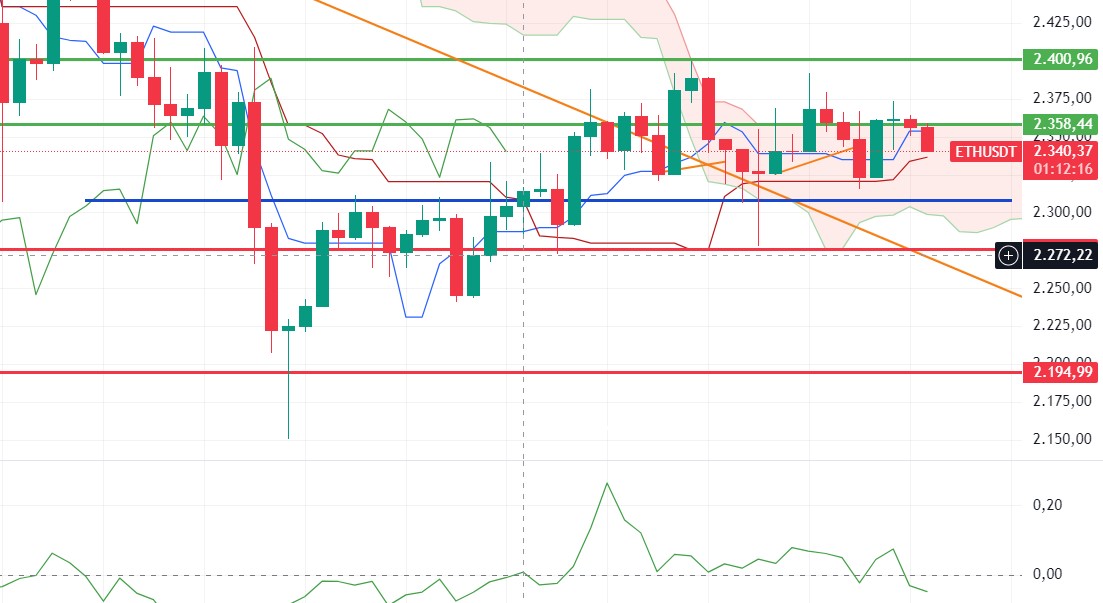
Ethereum, which tried to attack the 2,400 levels as expected, entered the kumo cloud again as the Asian stock markets opened slightly negative. There are positive mismatches in CMF and MFI. Provided that the 2,336 tenkan level is not lost, it seems possible to see an attack to 2,400 levels. The most important main support level can be determined as 2,308. The breakdown of this level is quite negative and may cause a pullback to 2,194 levels.
Supports 2,307 – 2,273 – 2,194
Resistances 2,358 – 2,400 – 2,451
LINK/USDT
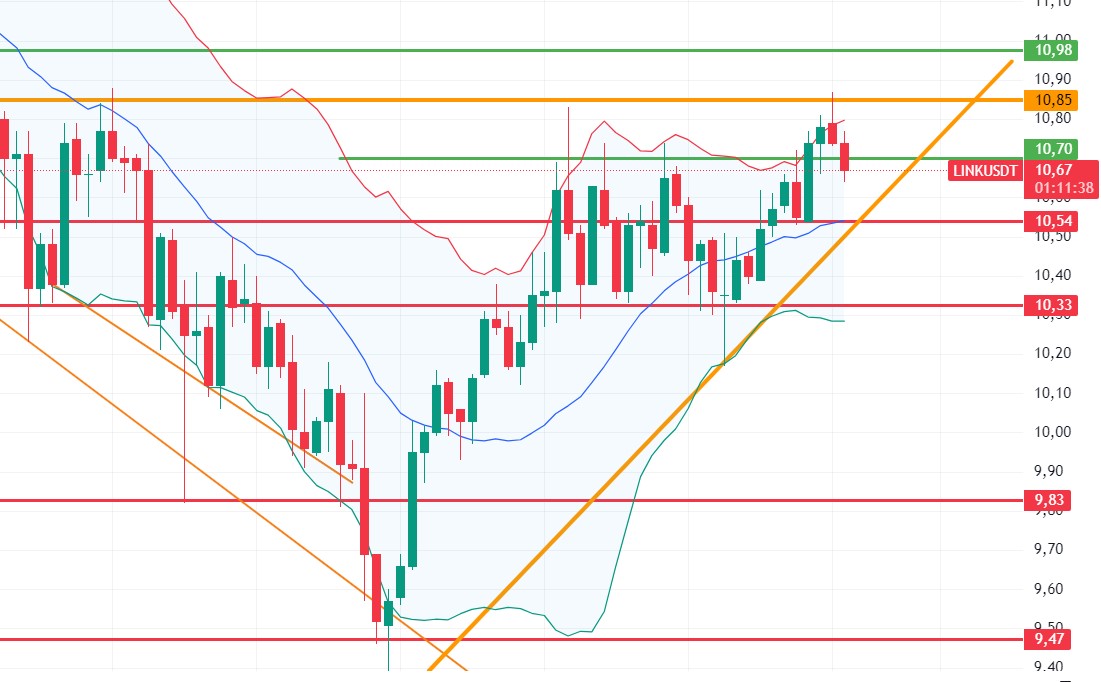
LINK, which managed to rise to 10.85 levels as expected yesterday, fell below 10.70 level again with the retreat of the markets. The first of the two most important levels during the day for LINK, which draws a neutral image by all indicators, is 10.54, which is the bollinger middle band and trend support level, and 10.85 level. It is important to act according to the breaks.
Supports 10.54 – 10.33 – 9.83
Resistances 10.70 – 10.85 – 11.45
SOL/USDT
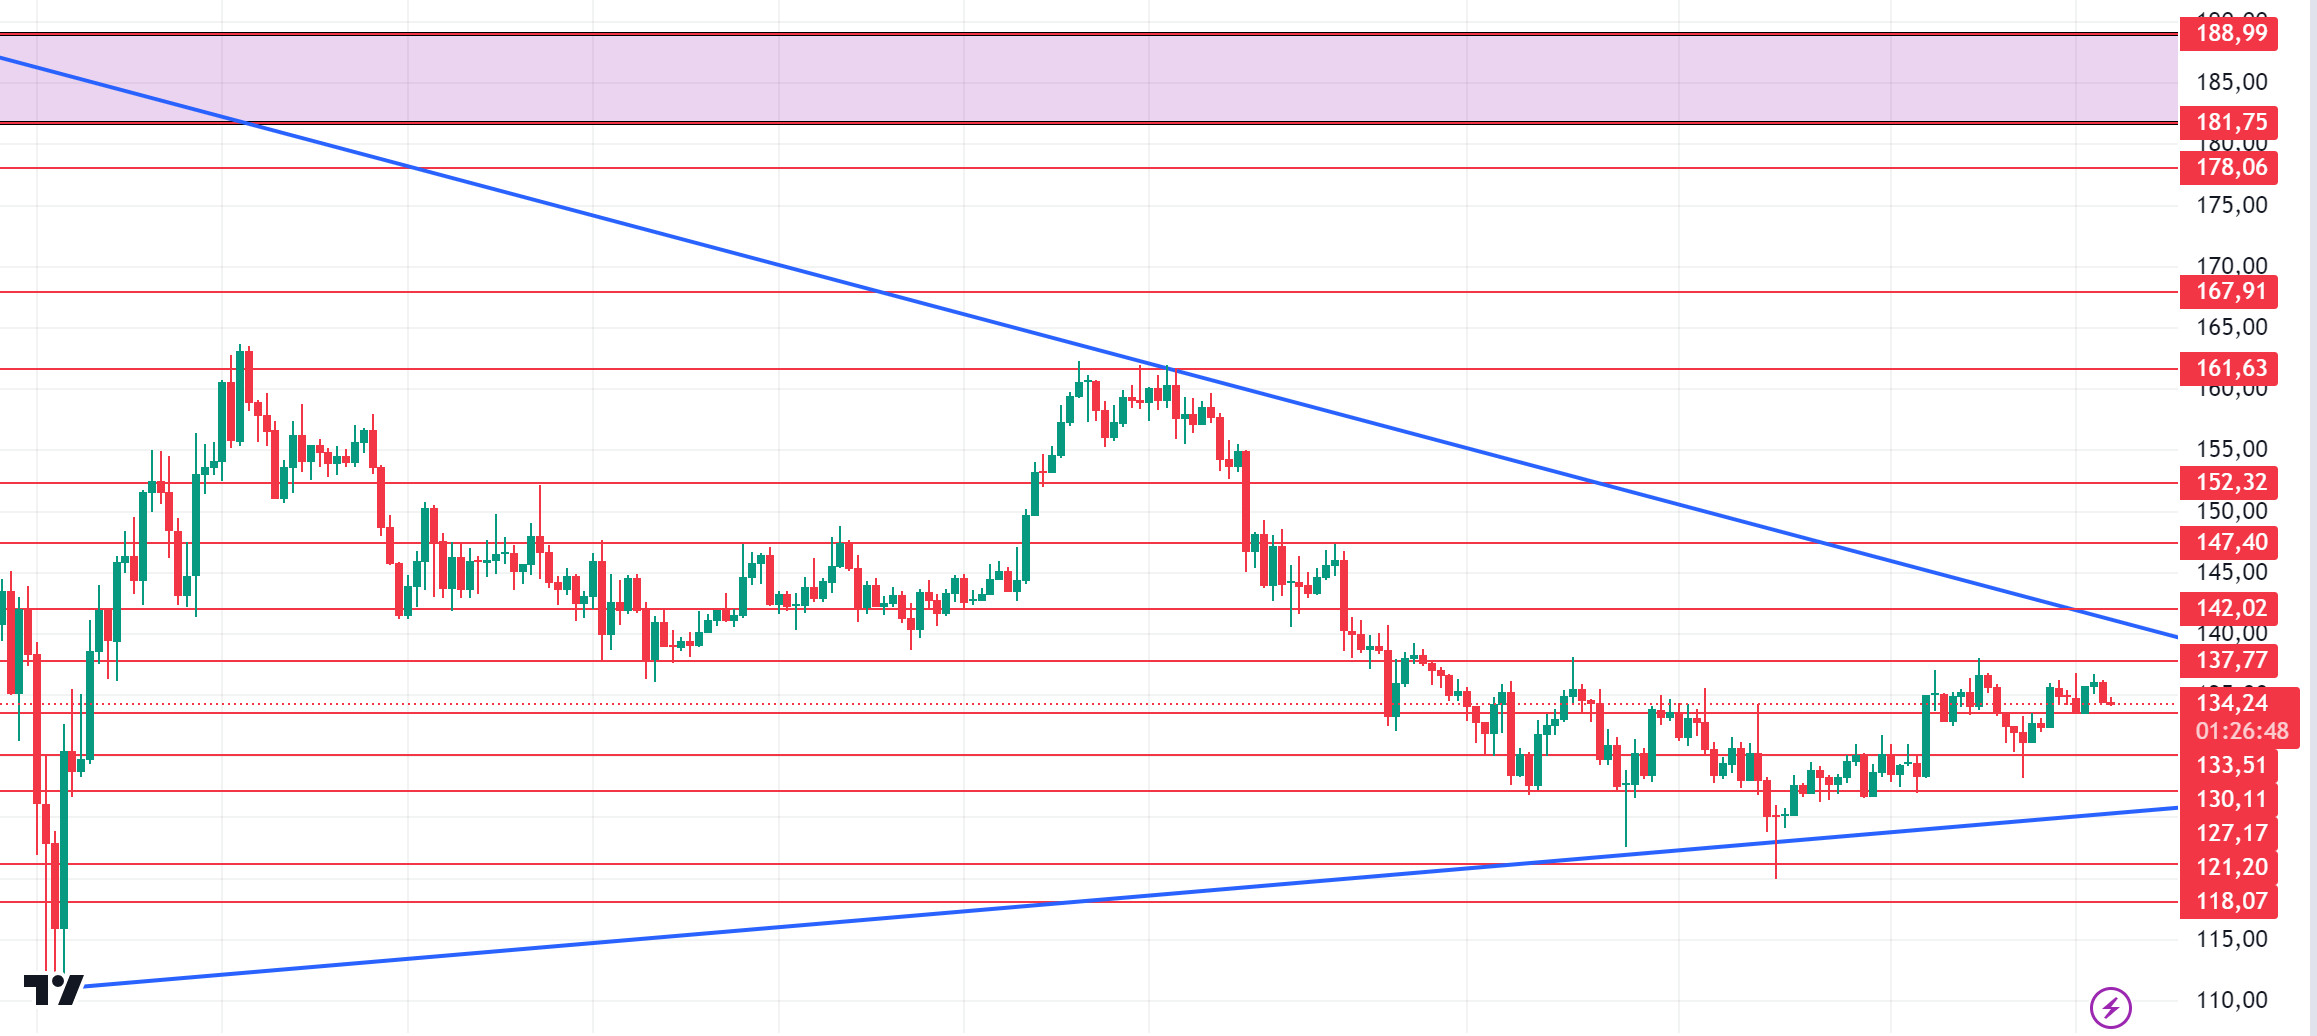
The launch of Donald Trump’s DeFi project World Liberty Finance will take place on September 16th. Trump also added that “we are embracing the future with crypto and leaving the slow and outdated big banks behind.” In the Solana ecosystem, according to data from Lookonchain, a Solana whale unlocked 106,213 SOLs worth $14.3 million and transferred them to a centralized exchange. On the other hand, TVL on Perp DEXs also reached a new ATH of 8.2 million SOLs. Solana’s DeFi sector is doing well and DEXs are performing exceptionally well. The total value locked (TVL) on Solana’s continuous DEXs reached a new record of $8.2 million. With that, Breakpoint is almost upon us! Breakpoint is usually home to Solana’s biggest announcements. Last year, Jupiter announced the JUP airdrop, the ecosystem’s largest TGE in 2024. This year, participants are eagerly awaiting announcements and details. The price is currently stabilizing around $134 – $135, potentially setting the stage for a future rebound. Technically, we see a narrowing triangle pattern. SOL seems to have given a bullish signal by trying the important level of $ 138. If the rises continue due to the increase in volumes, it may test the resistance levels 137.77 – 142.02. If it rises above this level, the rise may continue. If investors see a new opportunity and sell, a potential rise should be followed if it comes to support levels 133.51 – 130.11.
Supports 133.51 – 130.11 – 127.17
Resistances 137.77 – 142.02 – 147.40
ADA/USDT
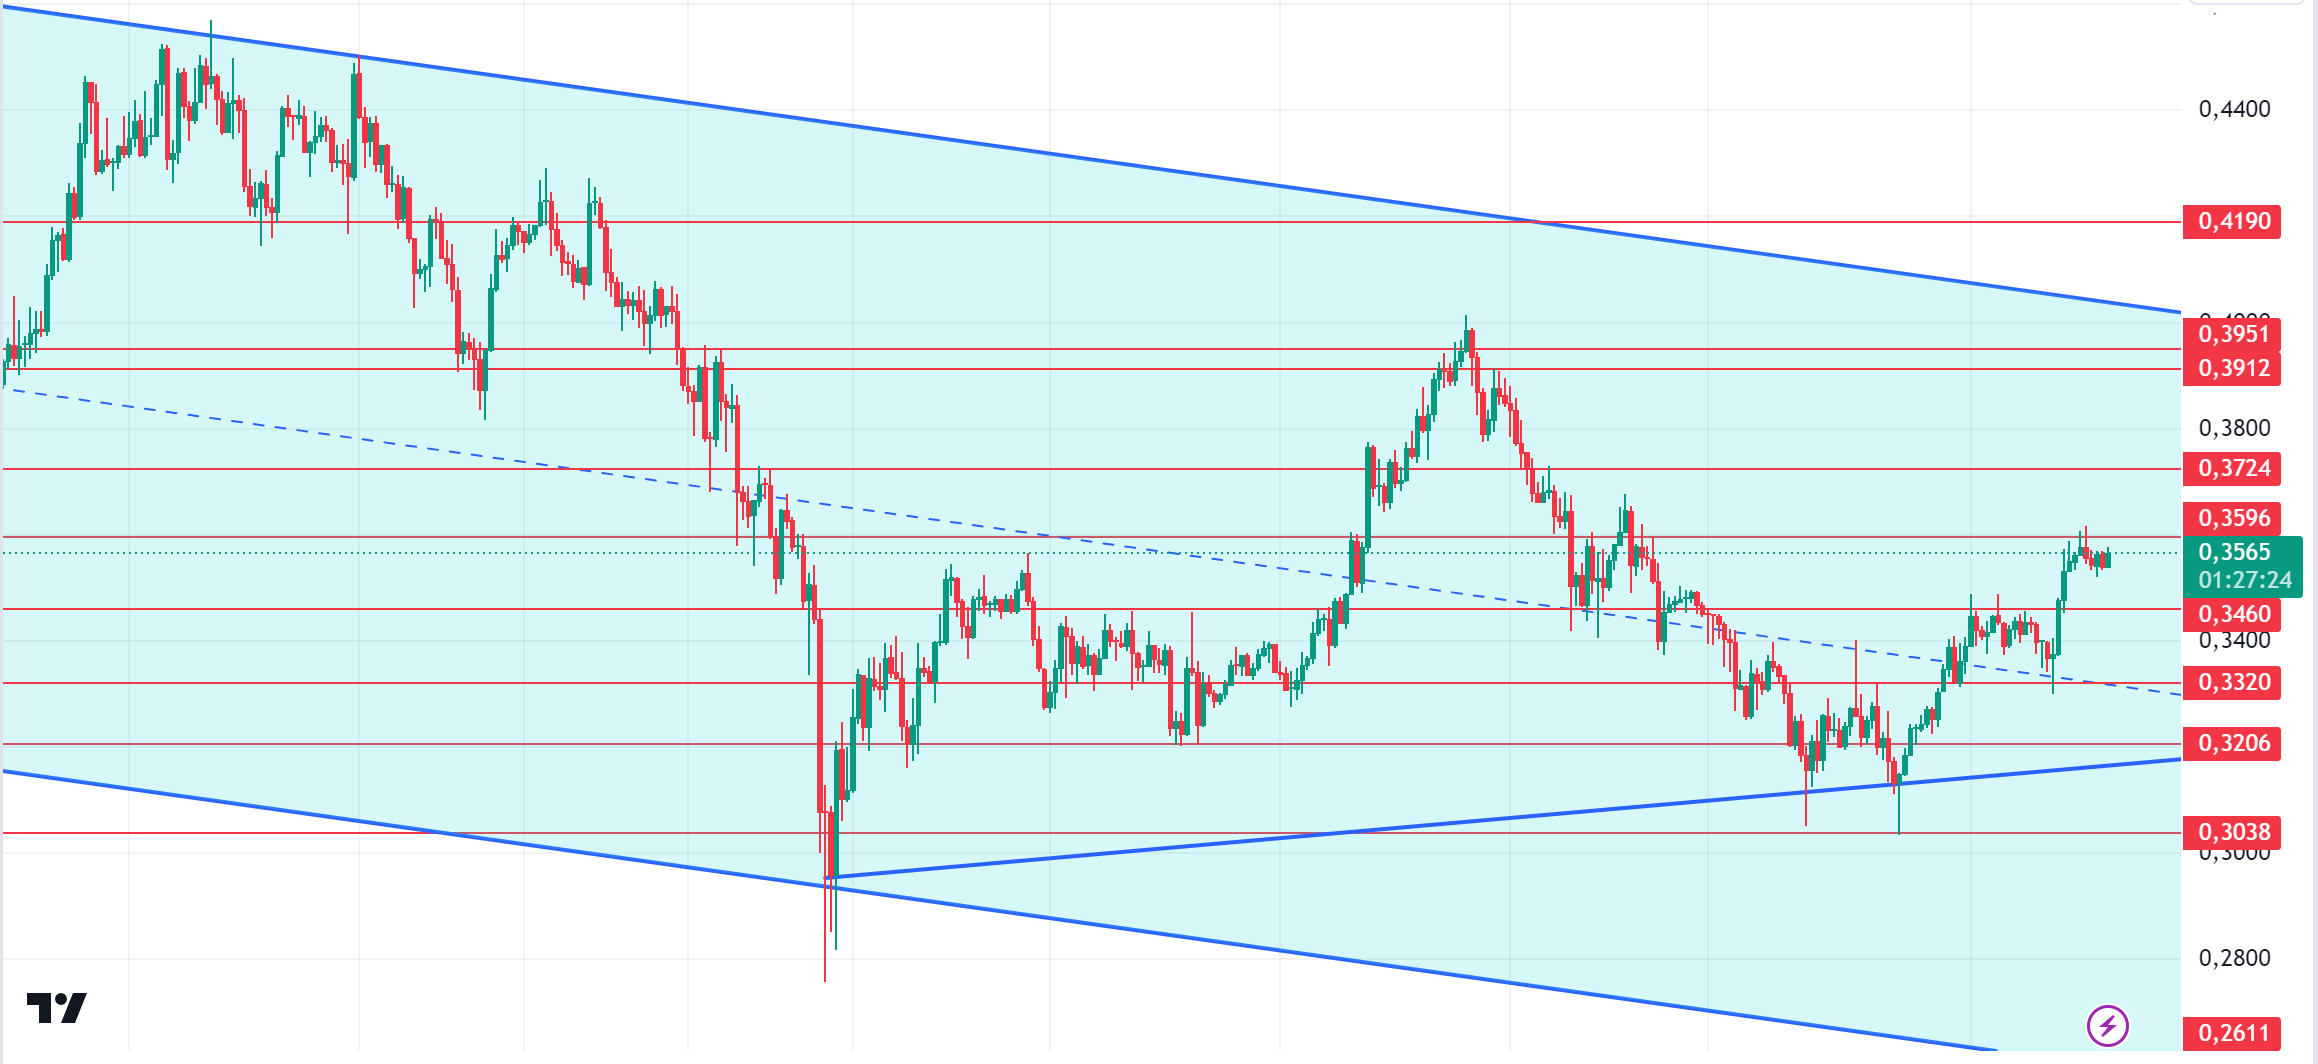
The launch of Donald Trump’s DeFi project World Liberty Finance will take place on September 16th. “We are embracing the future with crypto and leaving the slow and outdated big banks behind,” Trump added. In the Cardano ecosystem, the increase in whale activity could signal significant changes in the market. Cardano [ADA] experienced a surge in whale activity over the past day with a massive $6.08 billion transaction. This was equivalent to ADA’s $17.71 billion, a 6.75% increase in value. Surprisingly, data from IntoTheBlock revealed an unexpected turnaround. Despite the rise, major ADA holders made profits and transferred around 219 million ADA to exchanges. Looking at the chart of ADA, it has broken through the middle level of the falling channel. However, ADA’s price is hovering above a critical resistance. The rise in volume may enable ADA to break through the 0.3951 resistance. In this scenario, 0.3596 – 0.3724 levels can be followed as resistance points. If the volume falls, 0.3460 – 0.3320 levels can be followed.
Supports 0.3460 – 0.3320 – 0.3206
Resistances 0.3596 – 0.3724 – 0.3912
AVAX/USDT
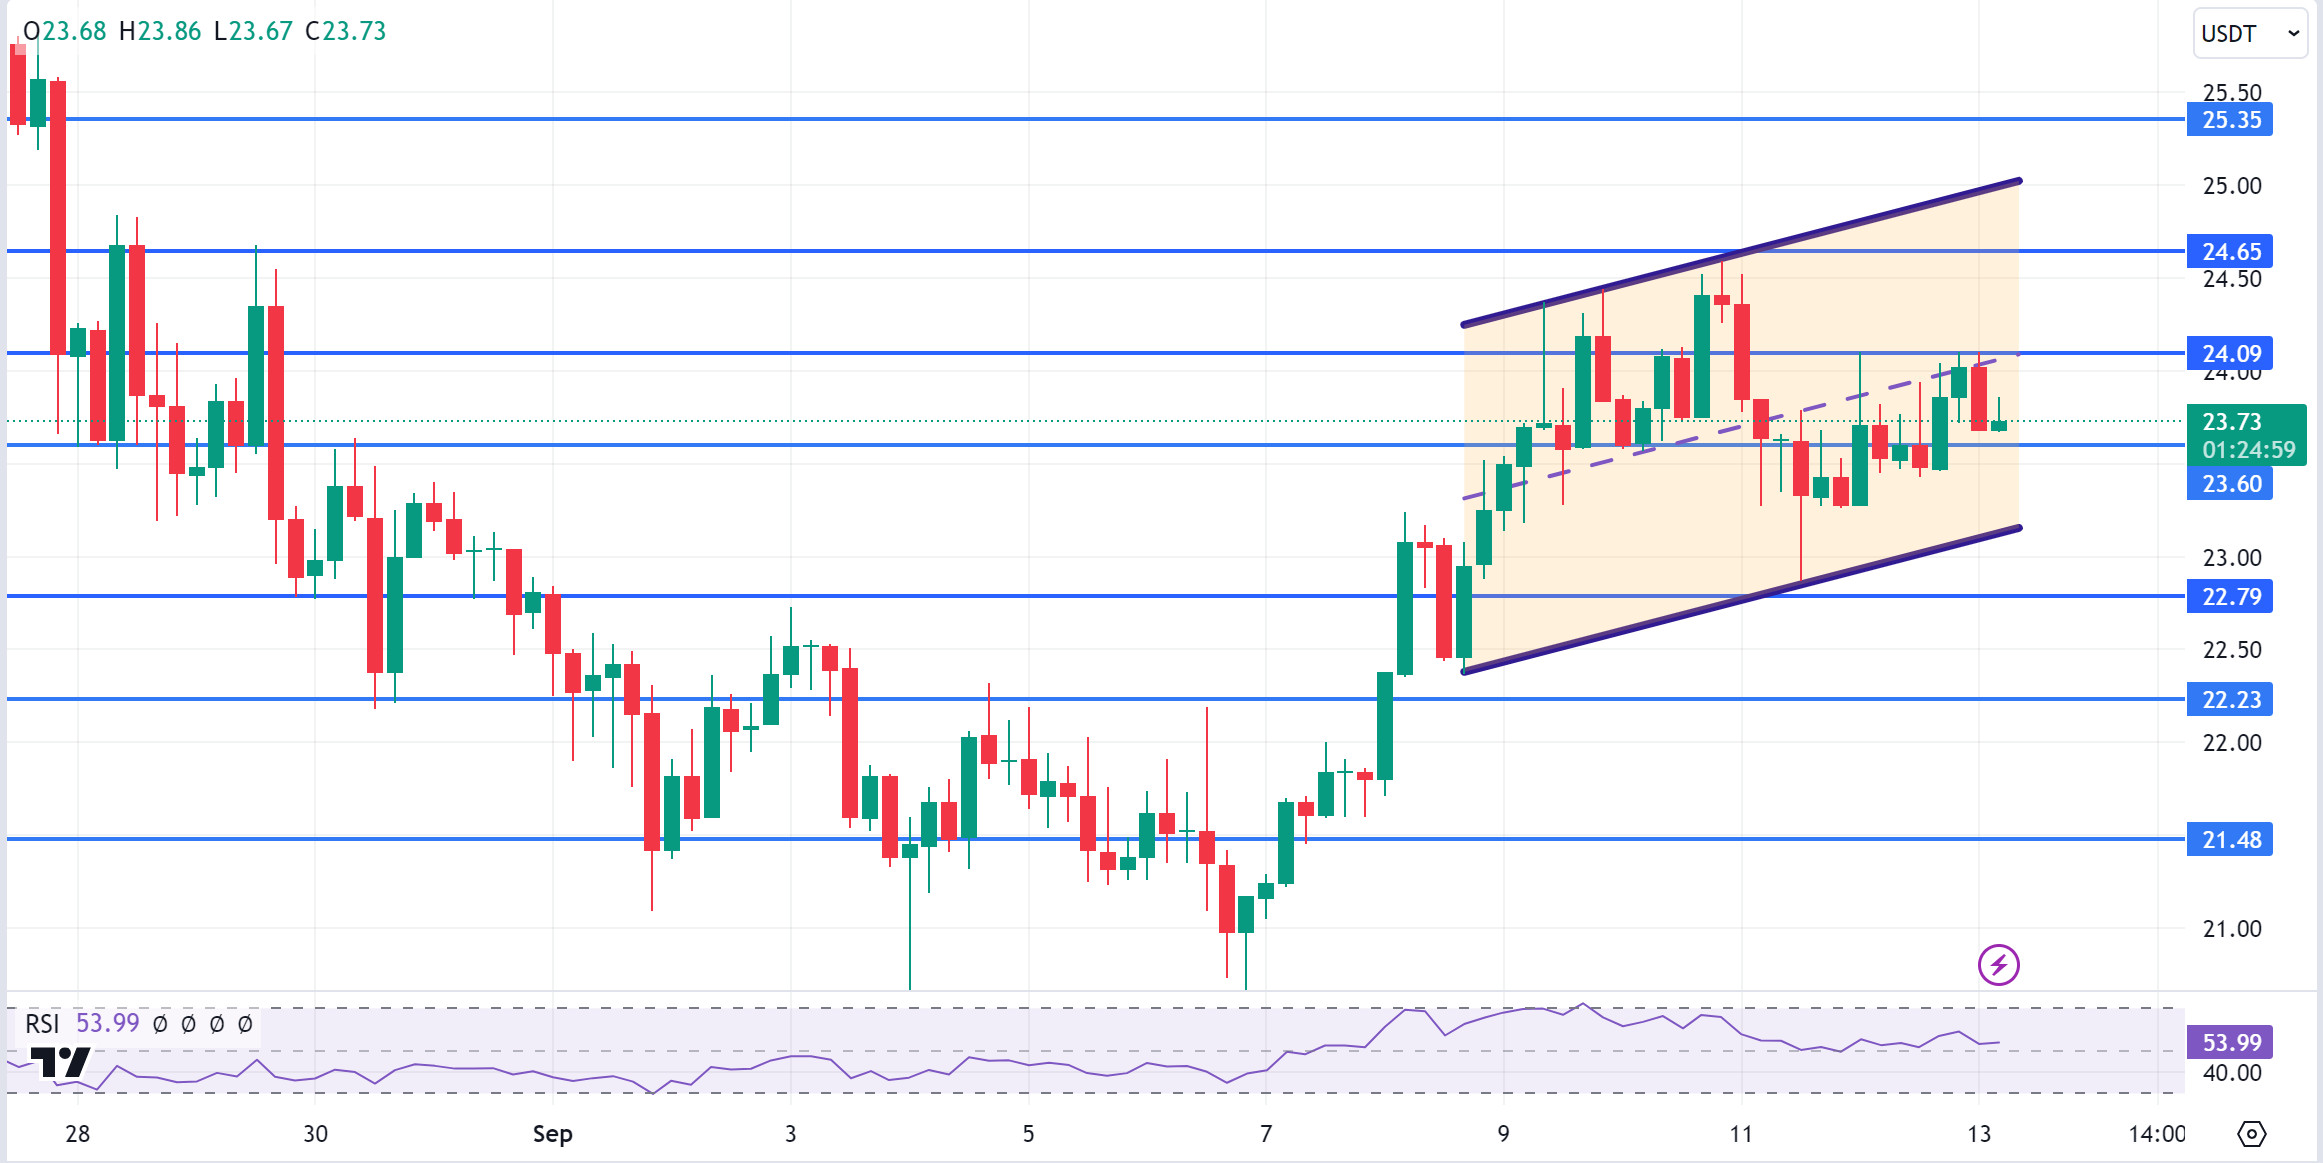
AVAX, which opened yesterday at 23.28, closed the day at 24.02, up about 3%. Since there is no planned data that will affect the markets today, we may have a low volume day.
AVAX, currently priced at 23.73, continues its movement within the rising channel. It tried to break the 24.09 resistance but fell to 23.60 support with the sales reaction from here. With the candle closure above 24.09 resistance, it can test the 24.65 resistance by moving to the upper band of the channel. If it breaks 23.60 support, it may want to test 22.79 and 22.23 supports. As long as it stays above 20.38 support during the day, the desire to rise may continue. With the break of 20.38 support, selling pressure may increase.
Supports 23.60 – 22.79 – 22.23
Resistances 24.09 – 24.65 – 25.35
TRX/USDT
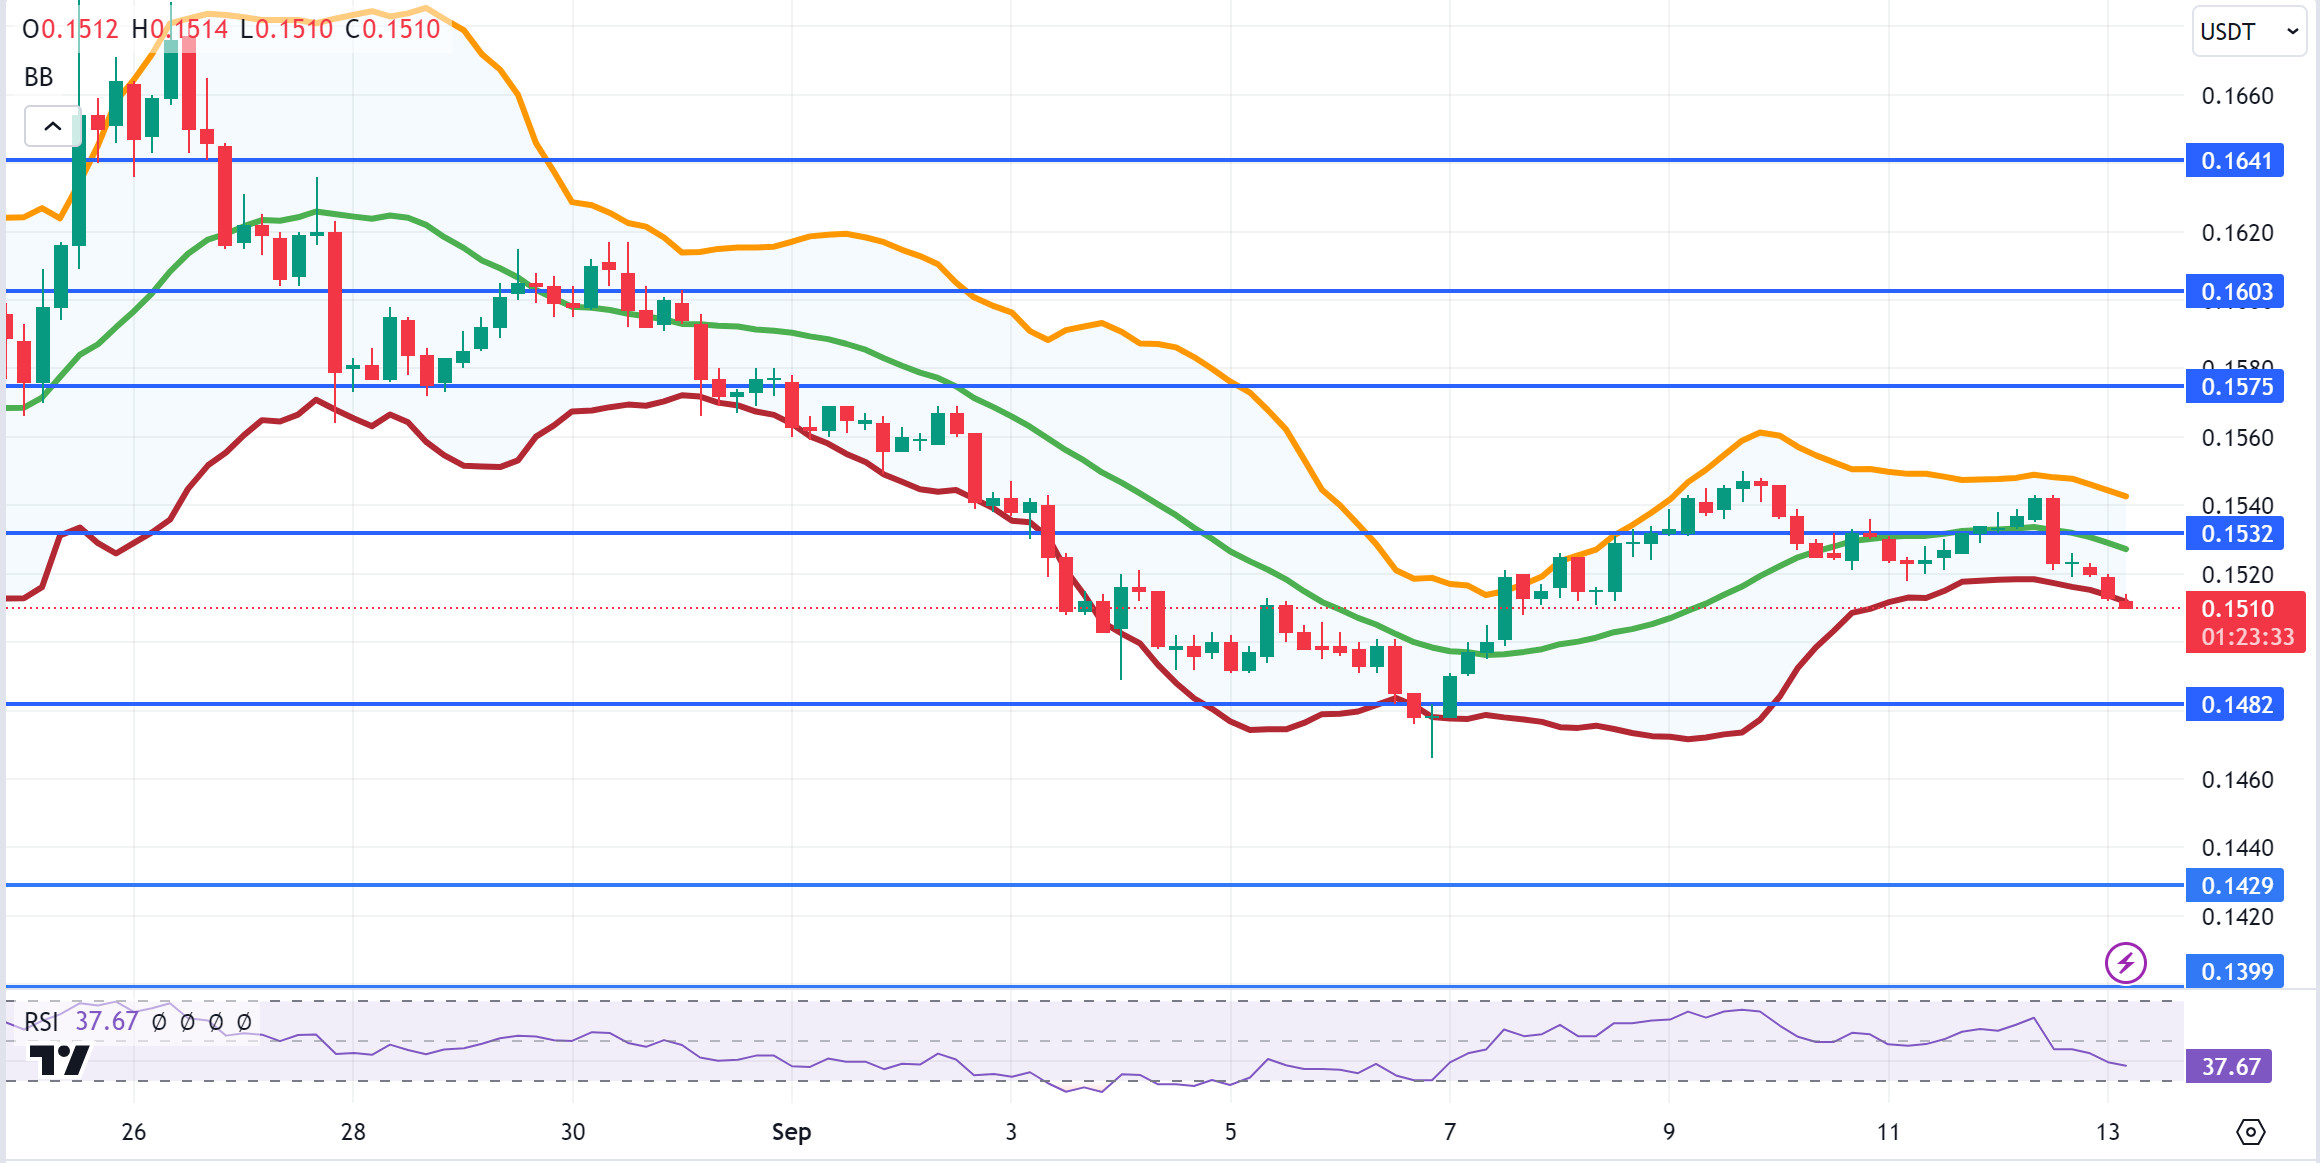
TRX, which started yesterday at 0.1533, closed the day at 0.1520, slightly down. Today, we may see more limited movements with low volatility, especially since there is no planned data flow coming from the US. TRX, which is currently trading at 0.1510 and is in the Bollinger lower band on the 4-hour chart, has approached the oversold zone with RSI 37. An upward reaction can be expected from here. In such a case, it can test the 0.1532 resistance by moving to the Bollinger middle and upper band. If there is no reaction from the Bollinger lower band and the decline continues, it may want to test 0.1482 support. TRX may continue to be bullish as long as it stays above 0.1482 support. If this support is broken downwards, sales can be expected to increase.
Supports 0.1482 – 0.1429 – 0.1399
Resistances 0.1532 – 0.1575 – 0.1603
XRP/USDT
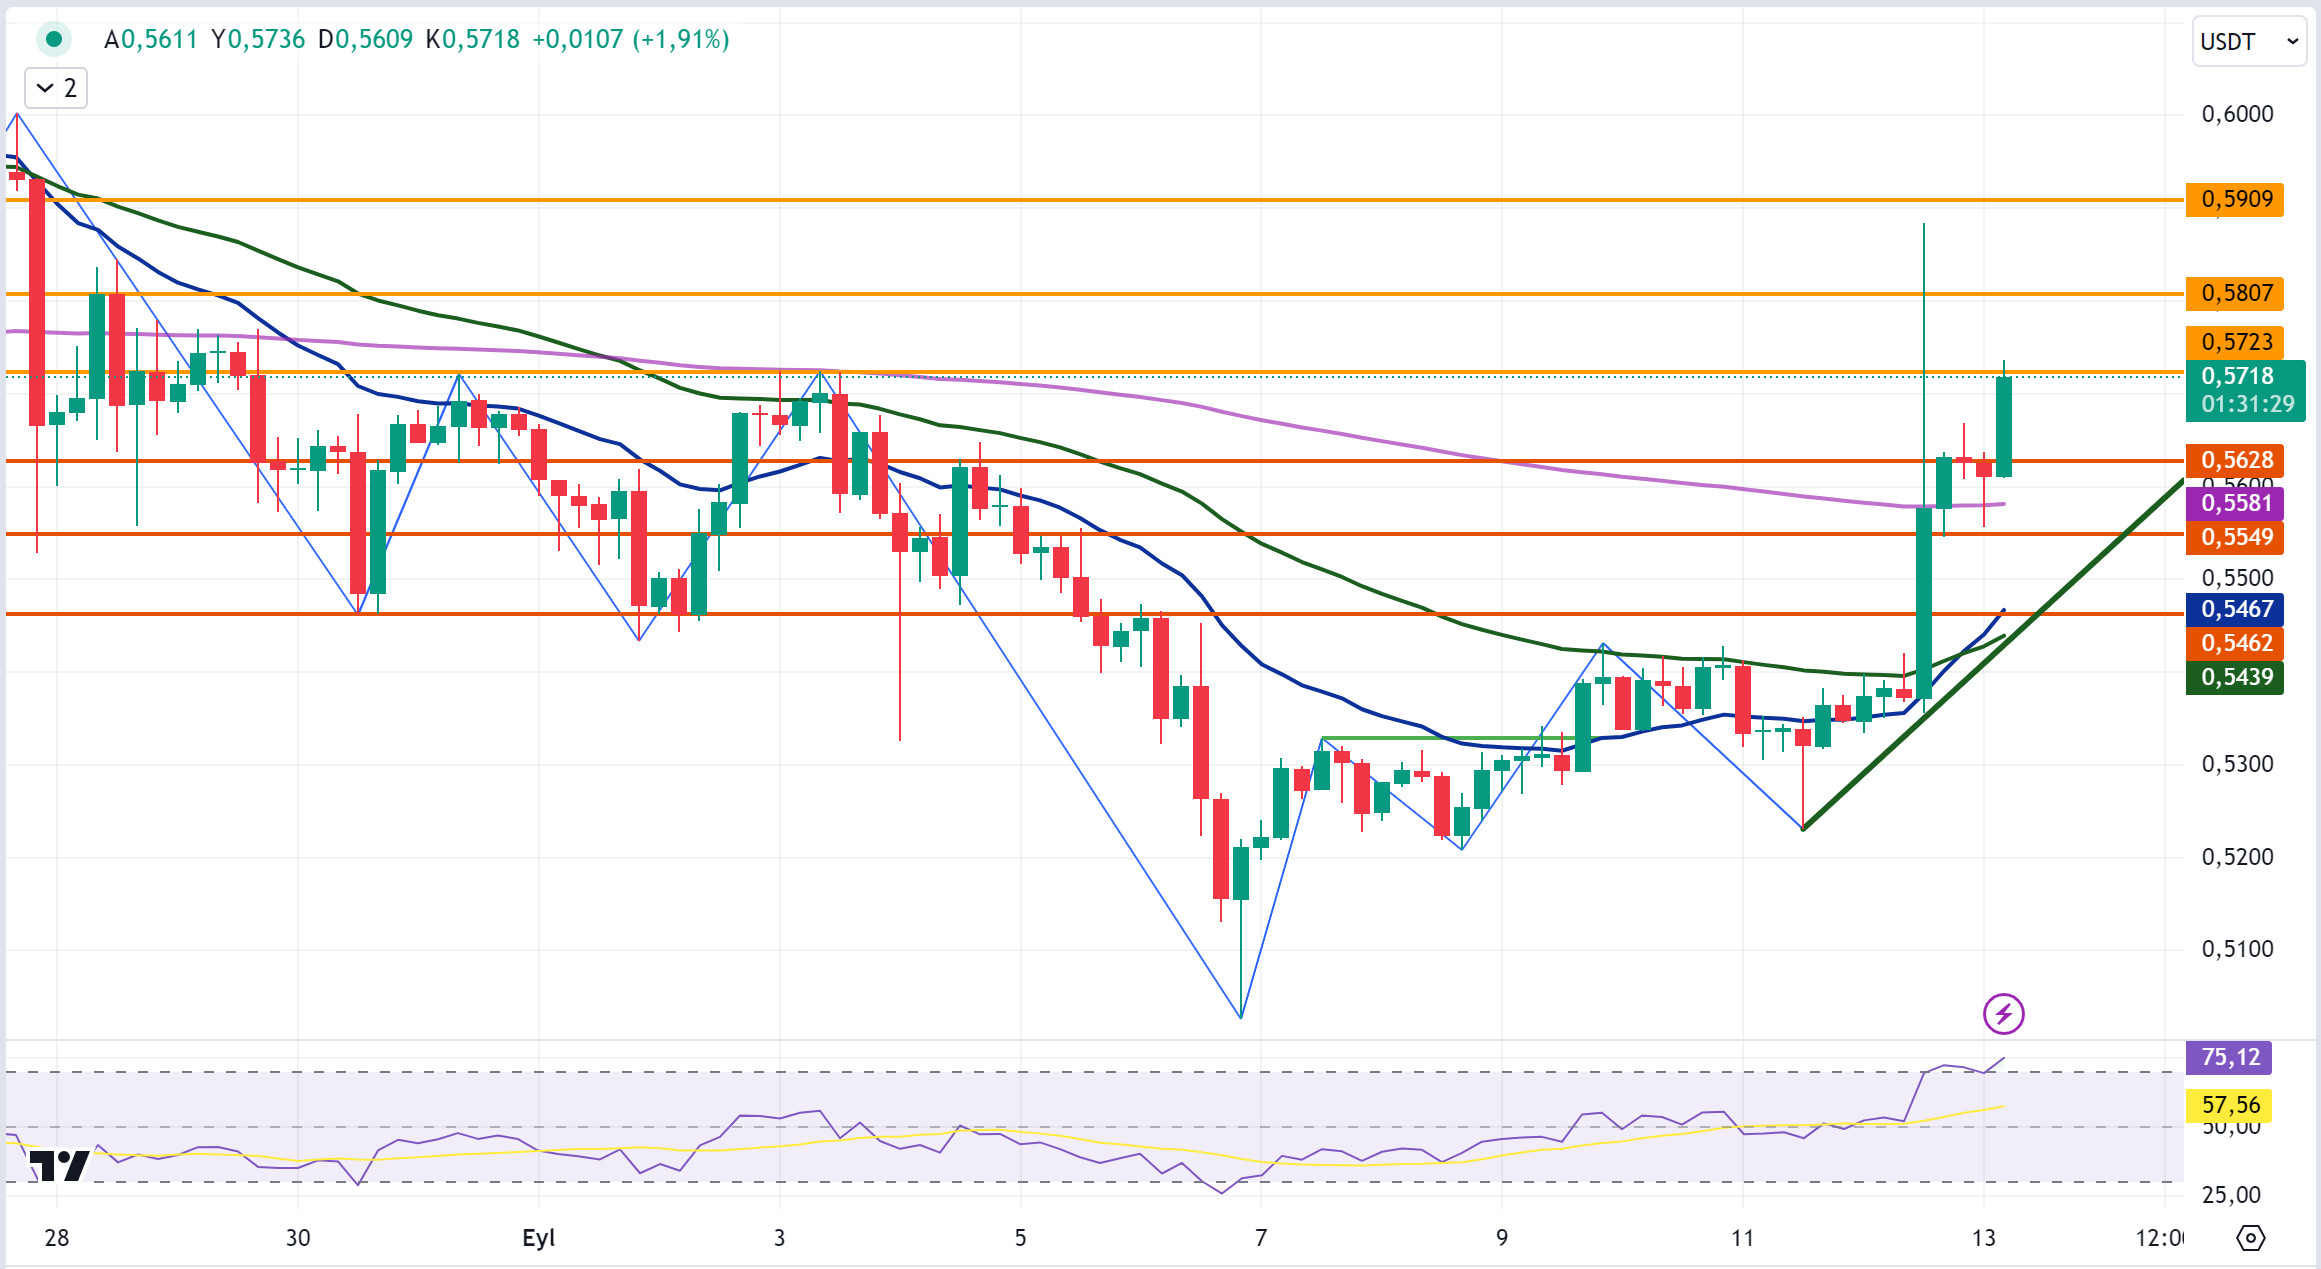
XRP rose sharply to 0.5882 yesterday with the news that Grayscale will launch the first US fund for XRP, after which it declined but closed the day at 0.5624 with a daily increase of 5.2% on a daily basis. In today’s 4-hour analysis, XRP, which started with a decline in the opening candle, started to rise with reaction purchases at the EMA200 (Purple Color) level. XRP, which continued to rise in the last candle, is currently trading at 0.5718 with an increase of about 1.5%. XRP, which is on the rise with the positive development, may retest the 0.5723 resistance level, which it tested in the last candle today and failed to break with the reaction sales, if it continues its uptrend. If this level is broken, it can test the resistance levels of 0.5807-0.5909 with the continuation of the rise. If the 0.5723 level cannot be broken and a decline occurs, the 0.5628 support level appears as a critical level. If this support level is broken and the decline continues, it may test the 0.5549-0.5462 support levels.
XRP may rise with reaction purchases at 0.5628 in case of a decline and may offer a long trading opportunity. It may also offer short trading opportunities if the 0.5628 level is tested and broken with the continuation of the decline.
Supports 0.5628 – 0.5549 – 0. 5 462
Resistances 0.5723 – 0.5807 – 0.5 909
DOGE/USDT
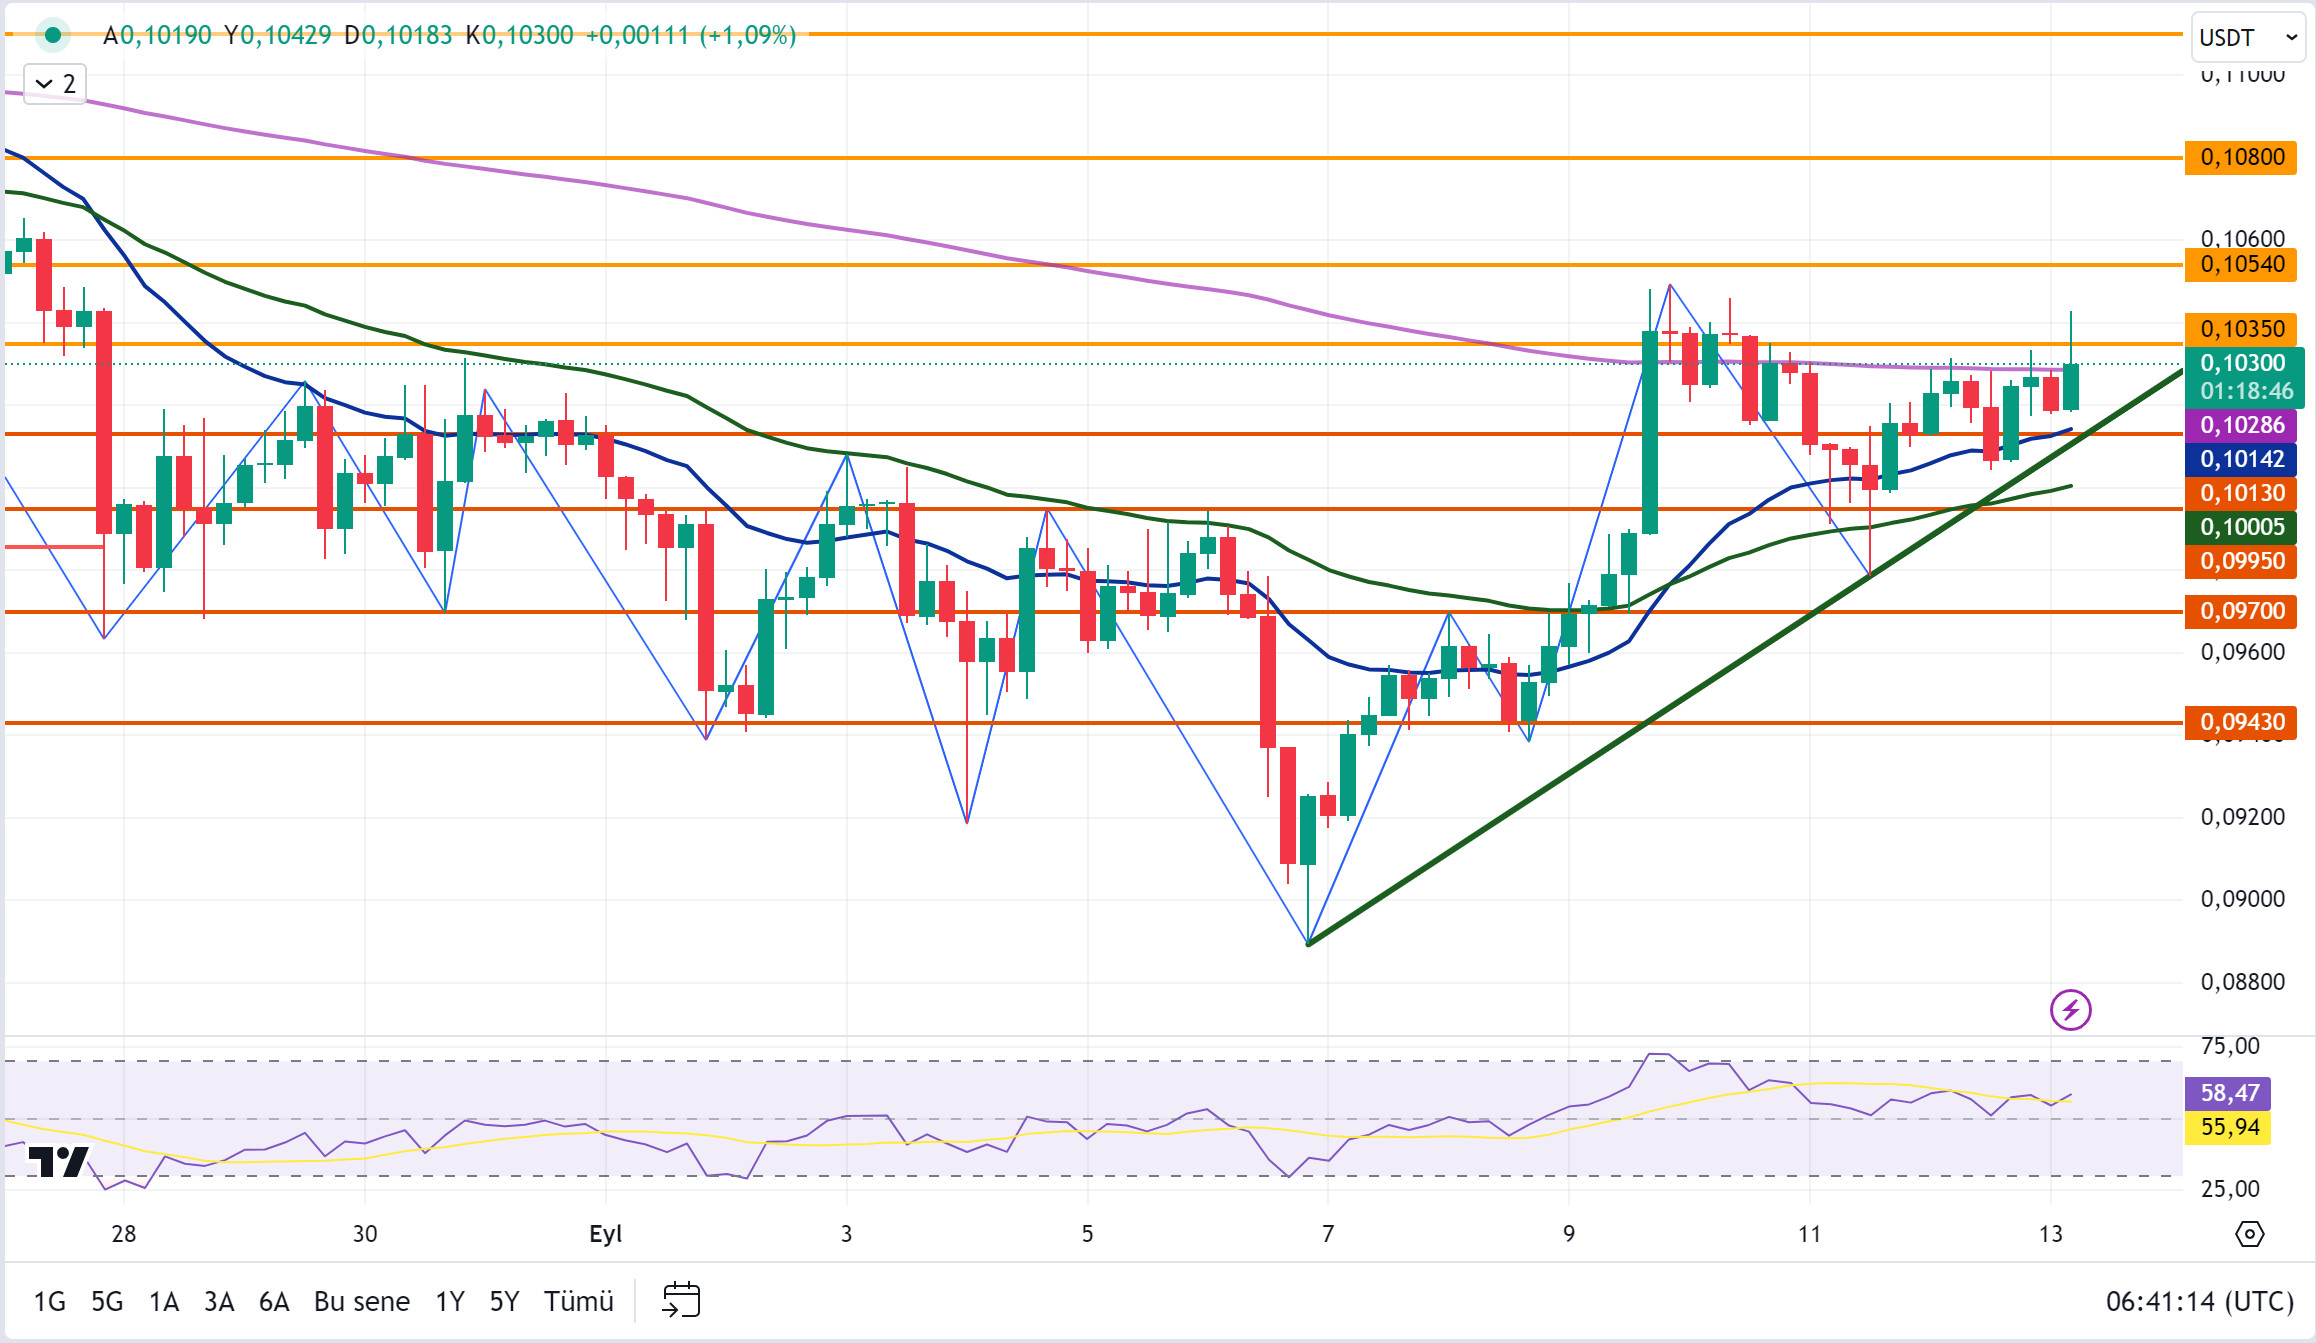
DOGE, which started today at 0.1026, started to rise with a recovery after falling on the first candle in the 4-hour analysis. DOGE, which fell with the reaction sales at the EMA200 (Purple Color) level in its rise in all candles in the 4-hour analysis yesterday, rose to 0.1043 with the rise it experienced in the first 10 minutes in the last candle after experiencing a similar situation in the opening candle today. It then fell to 0.1030 and is currently trading above the EMA200 level. When we analyze the 4-hour analysis for DOGE, the EMA200 level appears as a critical level in the rise. Especially in the rises since yesterday, there has been a decline with the reaction sales at this level. DOGE may test the resistance levels of 0.1035-0.1054-0.1080 with the last candle closing above this level and continuing its rise. In the 4-hour analysis, if the last candle closure is below the EMA200 level, it may test the support levels of 0.1013-0.0995-0.0970 if it declines with the reaction sales that may come.
In the 4-hour analysis, DOGE may offer a long trading opportunity if the EMA200 level is broken and the uptrend continues. On the contrary, if this level cannot be broken and there is a decline with reaction sales, it may offer a short trading opportunity.
Supports 0.1013 – 0.0995 – 0.0970
Resistances 0.1035 – 0.1 054 – 0.1080
DOT/USDT
Kampela became the first fully DAO-funded hardware wallet project, receiving 253,000 DOT funding worth nearly $1 million through DAOs on the Polkadot network. This achievement demonstrates how decentralized governance in the Polkadot ecosystem can support tangible technology innovations, while creating a new model for hardware developments. Funded through the Polkadot Treasury, Kampela is characterized by secure NFC connectivity and battery-free operation.
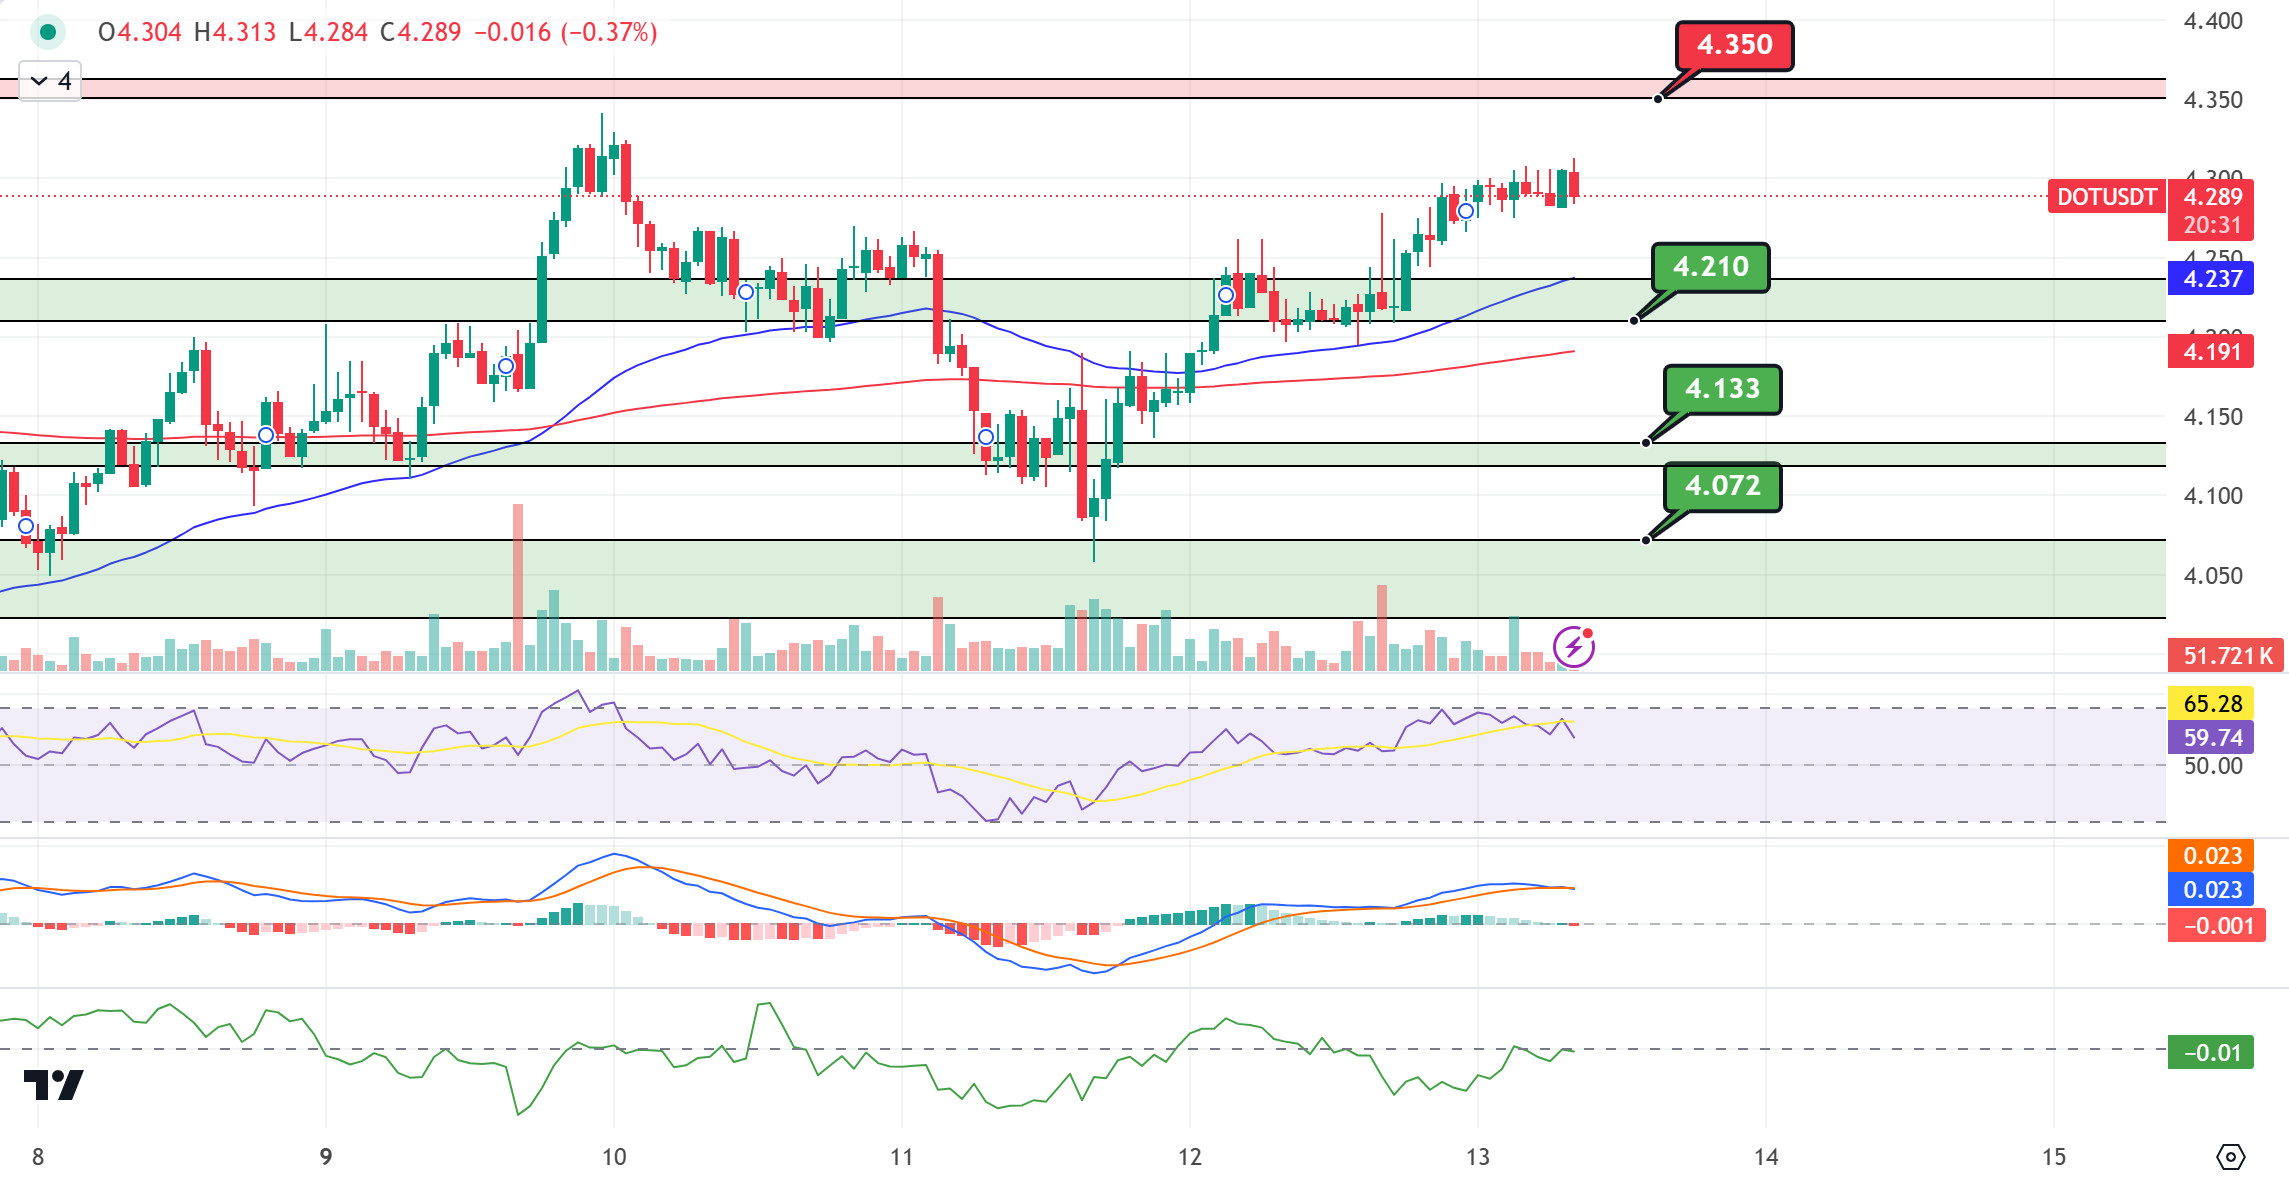
DOT, which moved up with the reaction from the EMA50 level, broke the 4,210 resistance upwards. The price is moving towards the second resistance level at 4,350. In a positive scenario, the price may move towards 4,350 levels if the buyer pressure increases. On the other hand, the price that broke the 4,210 resistance may want to correct this rise. In this context, we can say that the first support levels may be 4,210 levels.
(Blue line: EMA50, Red line: EMA200)
Supports 4,210 – -4,133 – 4,072
Resistances 4.350 – 4.454 – 4.570
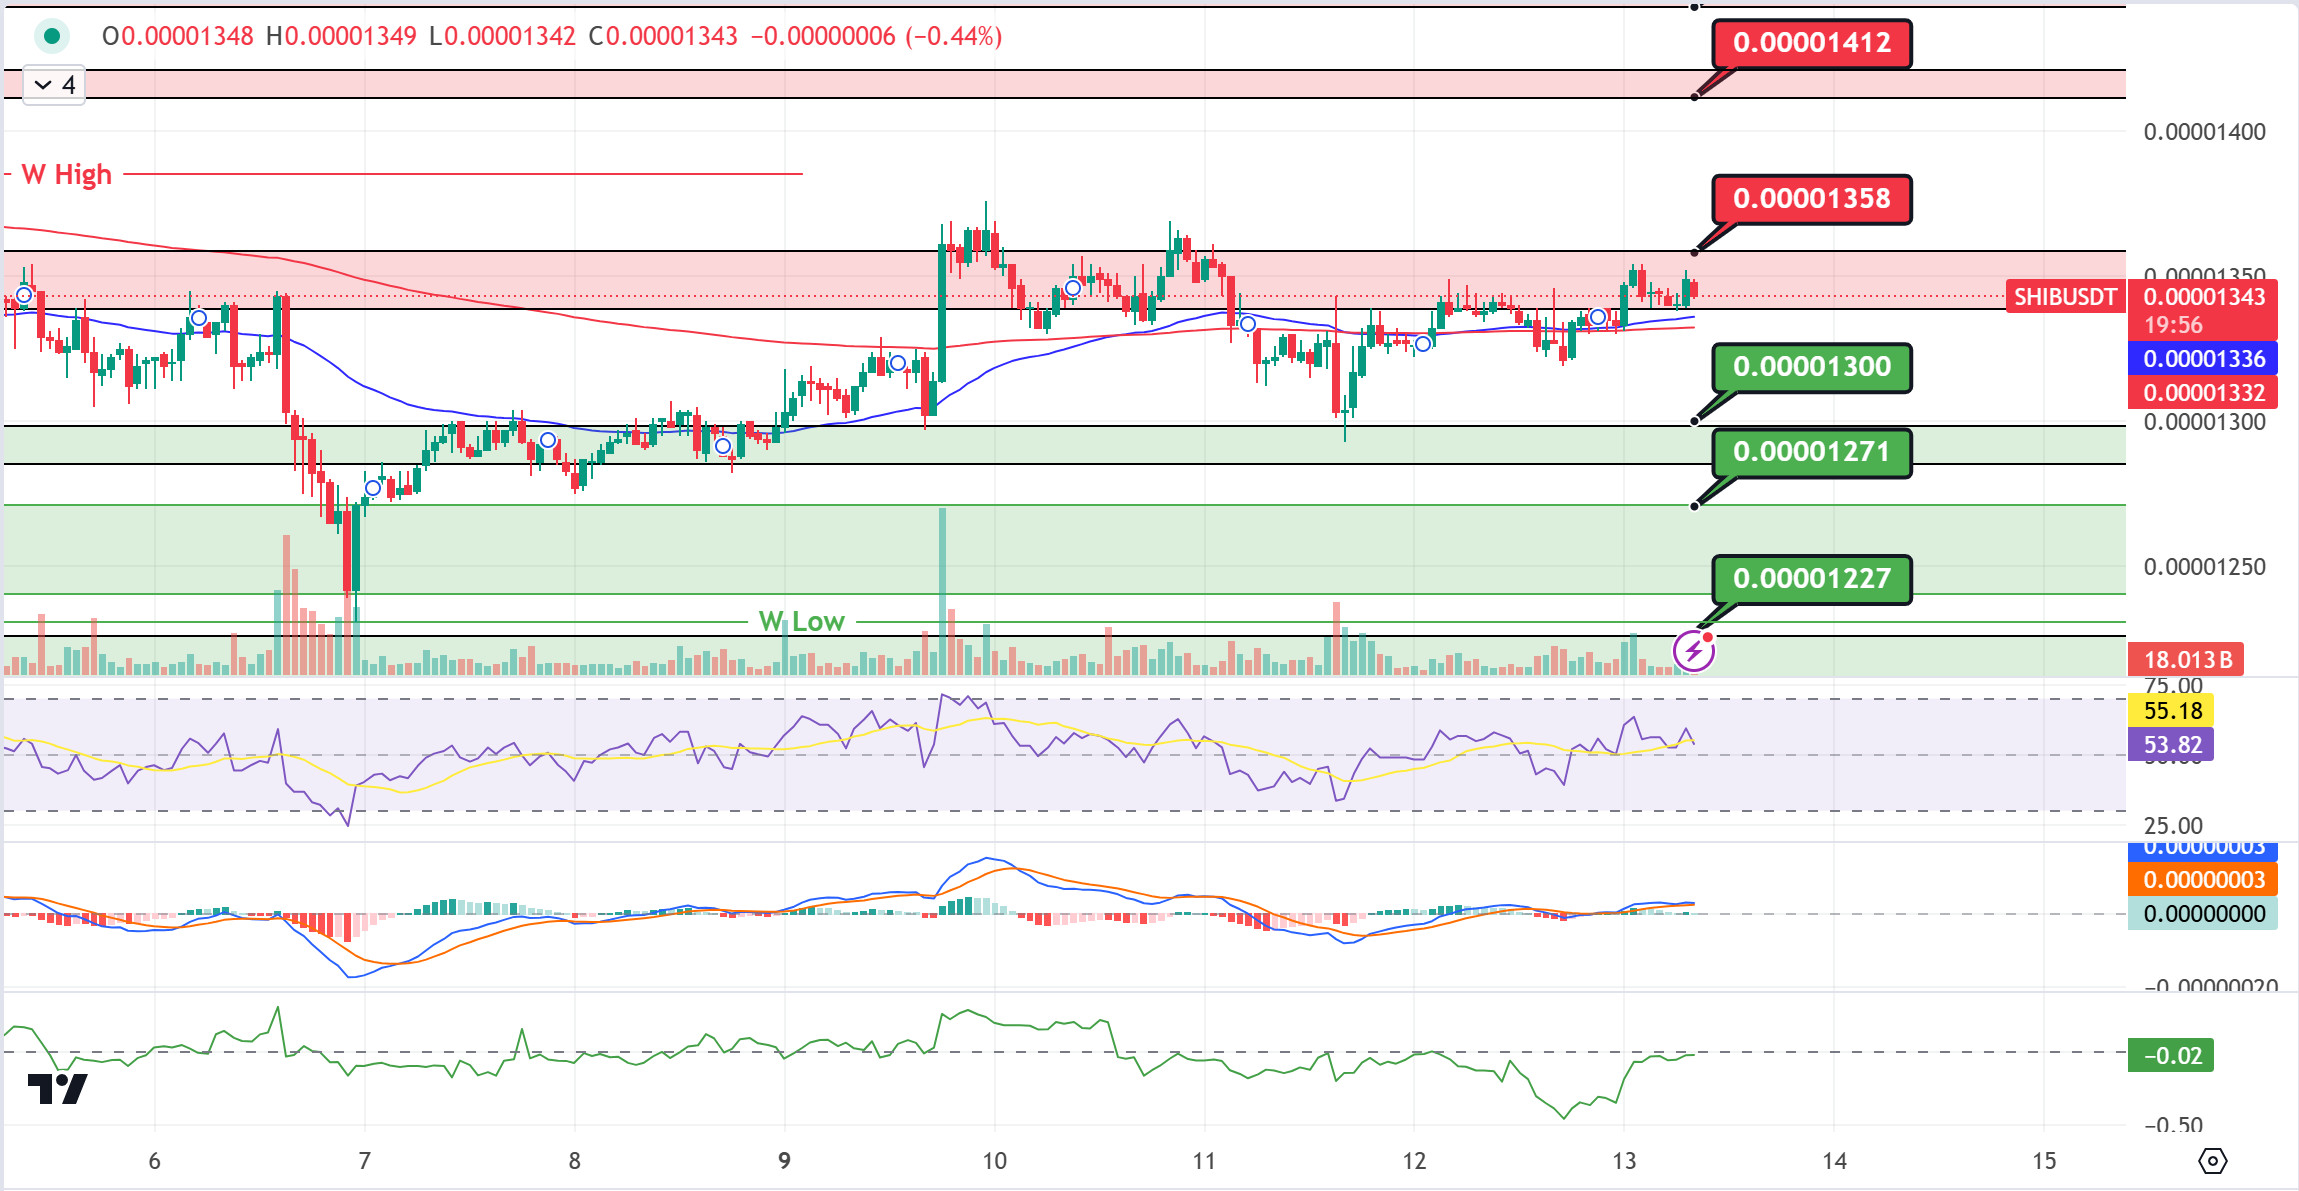
SHIB/USDT
Shiba Inu (SHIB) whale net flows fell by over 30,000% due to market uncertainty, with large investors thought to have reduced their positions. According to Santiment, SHIB could perform strongly as Bitcoin stabilizes and the altcoin season begins. Looking at the chart, SHIB is trending upwards above the EMA50 and EMA200. If SHIB can break the selling pressure at 0.00001358, its next target could be 0.00001412. When we analyse the MACD oscillator, we can say that the buying pressure decreased compared to the previous hour, while when we analyse the CMF oscillator, we can say that the selling pressure continues. In the negative scenario, if the price maintains below the EMA200 and EMA50, the price may retreat to the first support level of 0.00001300.
(Blue line: EMA50, Red line: EMA200)
Supports 0.00001300 – 0.00001271 – 0.00001227
Resistances 0.00001358 – 0.00001412 – 0.00001443
LEGAL NOTICE
The investment information, comments and recommendations contained herein do not constitute investment advice. Investment advisory services are provided individually by authorized institutions taking into account the risk and return preferences of individuals. The comments and recommendations contained herein are of a general nature. These recommendations may not be suitable for your financial situation and risk and return preferences. Therefore, making an investment decision based solely on the information contained herein may not produce results in line with your expectations.
