MARKET SUMMARY
Latest Situation in Crypto Assets
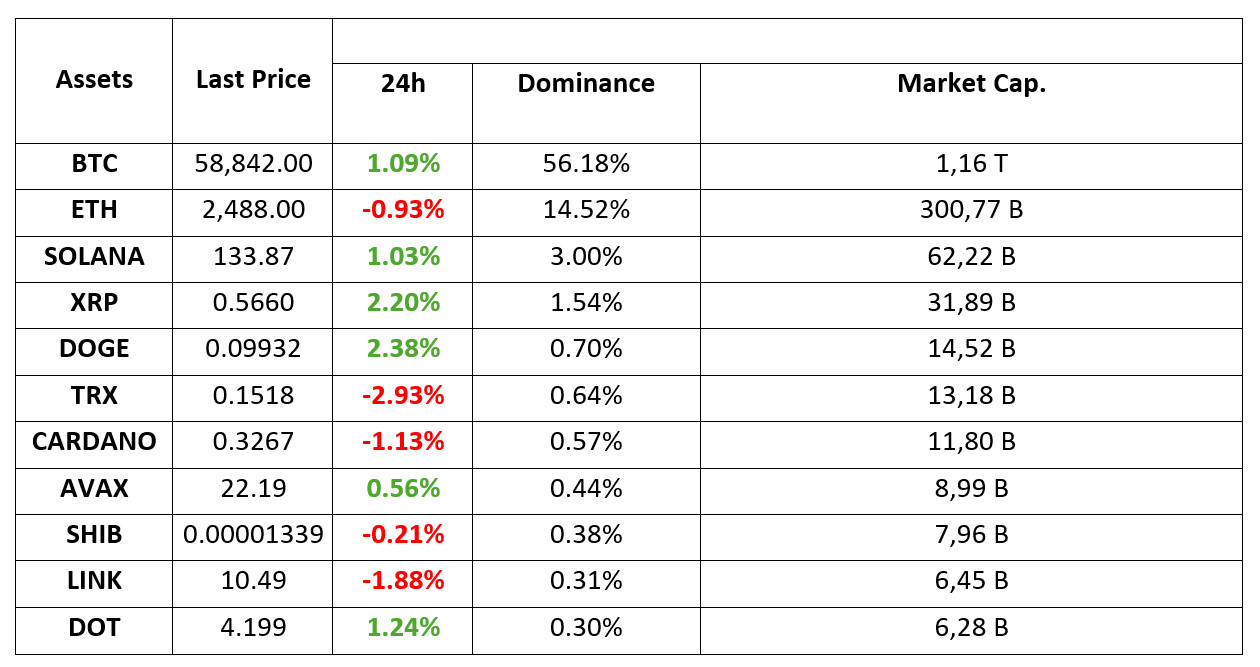
*Prepared on 2.09.2024 at 14:00 (UTC)
WHAT’S LEFT BEHIND
Why doesn’t the prospect of an interest rate cut push BTC higher?
Arthur Hayes, CEO of BitMEX, one of the leading names in the industry, thinks that possible interest rate cuts by the US Federal Reserve will not affect the price of Bitcoin. Hayes cited the 5.3 percent interest payment of reverse repos, which allow securities to be sold with a commitment to repurchase them on predetermined terms at a future date, as the reason for the lack of rises. Hayes emphasized that the rising interest in reverse repos distorted the perception that high-risk assets such as Bitcoin would be positively affected by low interest rates. The general belief that low interest rates will lead to more borrowing and spending, bringing high liquidity to the market, predicts BTC to strengthen against the weakening dollar.
Trump ahead in critical states
While the elections in the US in early November are of great importance for the cryptocurrency world, the wind behind Kamala Harris seems to have calmed down at the moment. The latest polls show that Trump has regained the lead in some states that were neck and neck.
The mysterious whale of recent days bought 2300 Bitcoins in 5 days
A Bitcoin whale is attracting attention with more than 2500 BTC purchases in less than a week. Finally, the whale made a new purchase of 322 units worth 19 million dollars today. With the latest purchases, the number of BTC held by the whale became 8881. The current total value of BTC held by this person or institution is around 523 million dollars.
Attention XRP Community: Ripple Announces New Partnership
After legal problems with the SEC, Ripple, which turned outside the US and started to expand rapidly, announced its new partnership. At this point, Ripple announced a partnership with Futureverse, a leading artificial intelligence and metaverse company.
HIGHLIGHTS OF THE DAY
*No important calendar data for the rest of the day
INFORMATION
*The calendar is based on UTC (Coordinated Universal Time) time zone. The economic calendar content on the relevant page is obtained from reliable news and data providers. The news in the economic calendar content, the date and time of the announcement of the news, possible changes in the previous, expectations and announced figures are made by the data provider institutions. Darkex cannot be held responsible for possible changes that may arise from similar situations.
MARKET COMPASS
On the second working day of the week, European stock markets were on a downward trend, while the US indices, which started the new week today, were no different. Risk appetite remains fragile amid speculation that September is not a characteristically good trading month.
While the markets are focused on the US employment data to be released on Friday, they are eagerly awaiting the PMI data to be released today. Manufacturing PMI came in at 47.9, below forecasts, while ISM Manufacturing PMI came in at 47.2 (Expectation: 47.5), close to forecasts, and despite a decline in the dollar index, gains in digital currencies remained limited and bearish pressure continued to exert itself. Expectations regarding the FED’s monetary policy continue to shape prices, while news on monetary policy changes by other central banks, including Japan, remain influential. Fragility may continue to prevail in this trading period, which is characterized as a critical week in the rest of the day.
TECHNICAL ANALYSIS
BTC/USDT
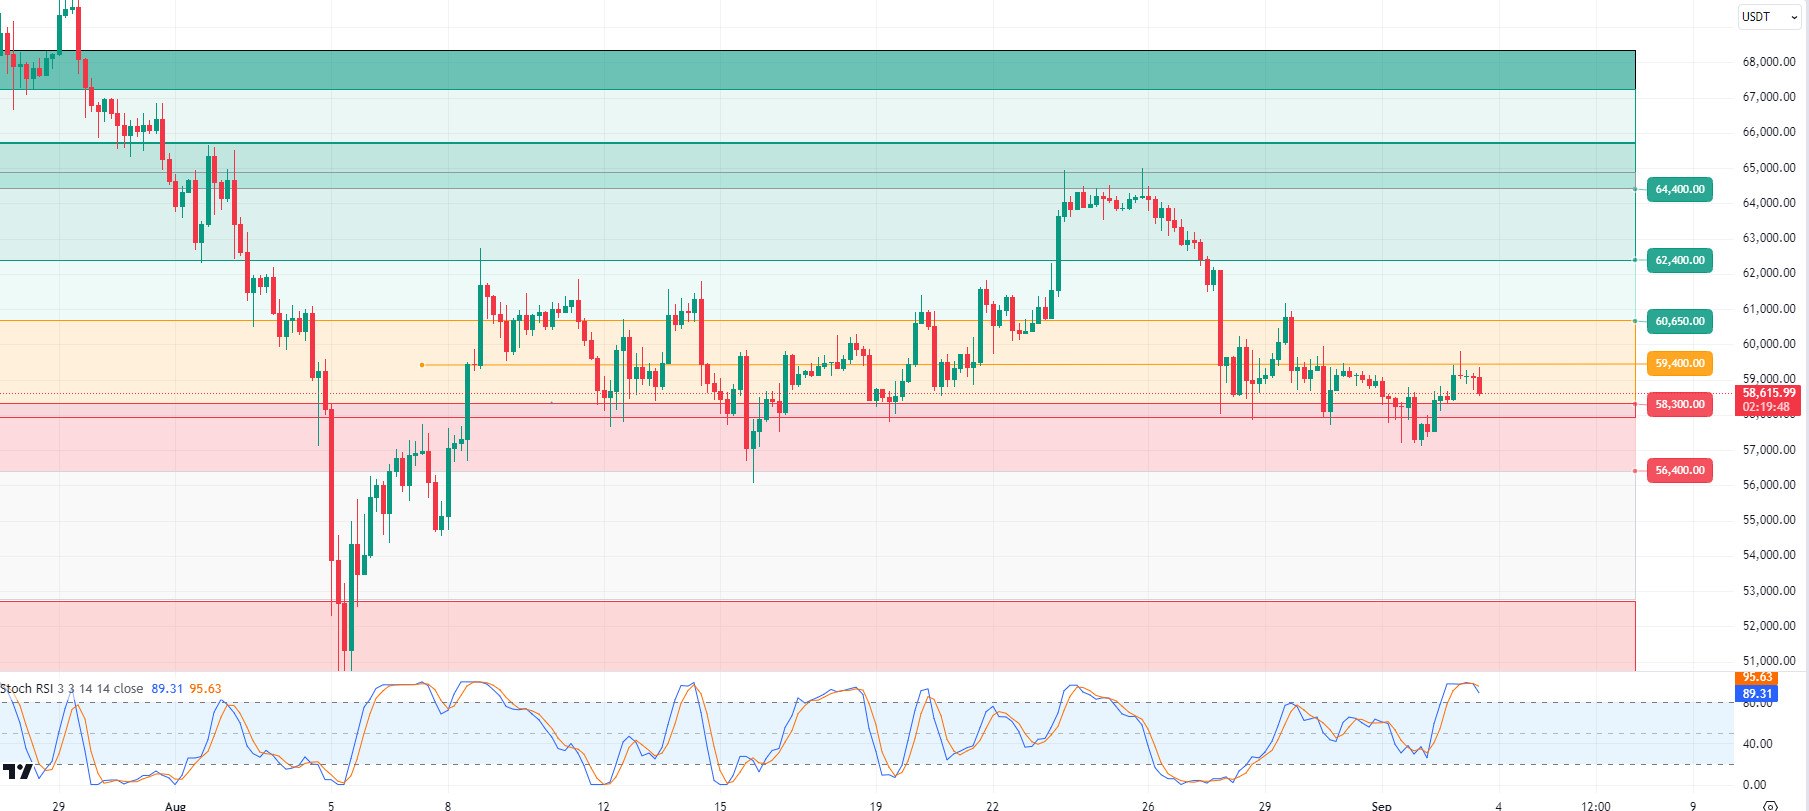
Summer Closing in Bitcoin! We left behind a period of economic, political and political turmoil in the summer months. Mt. Gox, German and US government sales, the assassination attempt against Trump and Biden’s withdrawal from the nomination caused tense and fluctuating market movements on behalf of Bitcoin. Finally, Bitcoin, which closed August with a decline, retreated to 57,100 levels. In September, an intense agenda such as US elections and FED interest rate decisions awaits us. Non-farm employment data and unemployment rates to be announced this week may provide us with a roadmap on the long-term direction of the FED’s interest rate policy. In the 4-hour analysis of BTC, it is seen that the breakout of the 58,300 level caused the price to retreat to 57,100, causing the price to start September with a decline. Bitcoin, which finds buyers at these levels, is currently trading at 58,600. The resistance level of 59,400 is critical and 4-hour closes above this level can be considered positive for the continuation of the rises in the market. In case of a possible pullback with the RSI coming to the overbought zone, the 58,300 level can work as support; If this level is broken, 57,000 levels can be tested again.
Supports 58,300 – 57,200 -56,400
Resistances 59,400 – 60,650 – 61,700
ETH/USDT
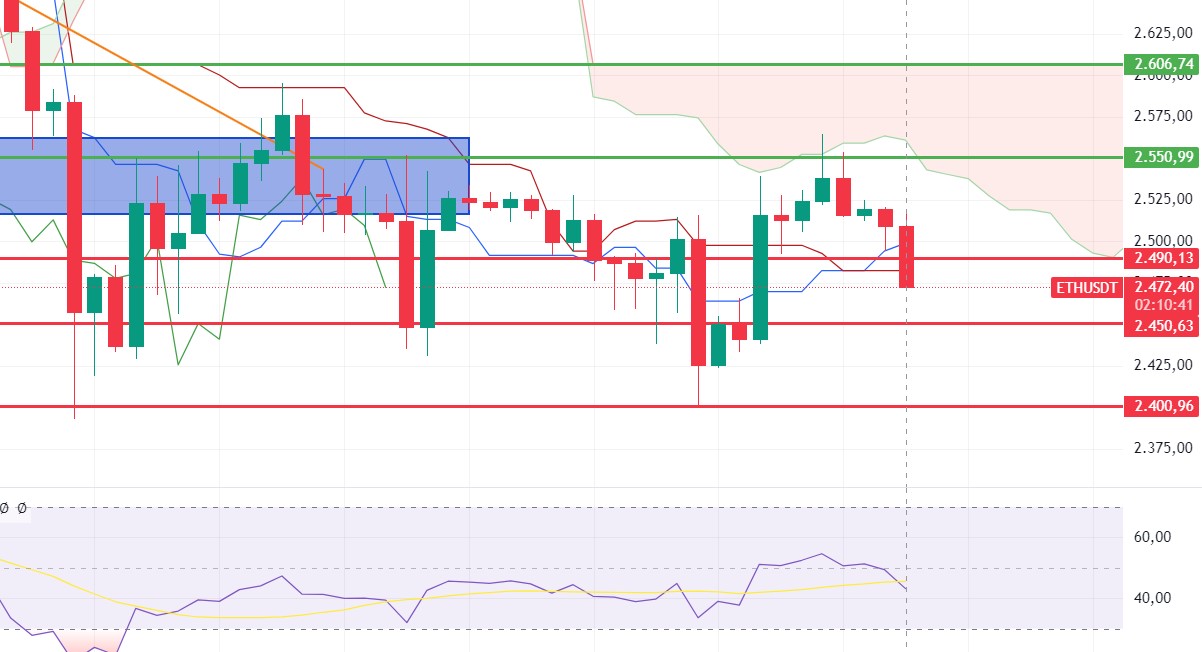
As expected, the negative mismatch in MFI during the day brought a correction to 2490 levels. The negative opening of the US markets brought some declines and continues to be quite volume-less. Looking at CVD data, the lack of appetite on the spot side draws attention. Unable to break the 2,550 level, Ethereum continues to accumulate in the bearish channel. Ethereum, which is currently in a neutral state, seems to be decisive for the breaks at the 2,550 – 2,450 levels.
Supports 2,450 – 2,400 – 2,366
Resistances 2,550 – 2,606 – 2,669
LINK/USDT
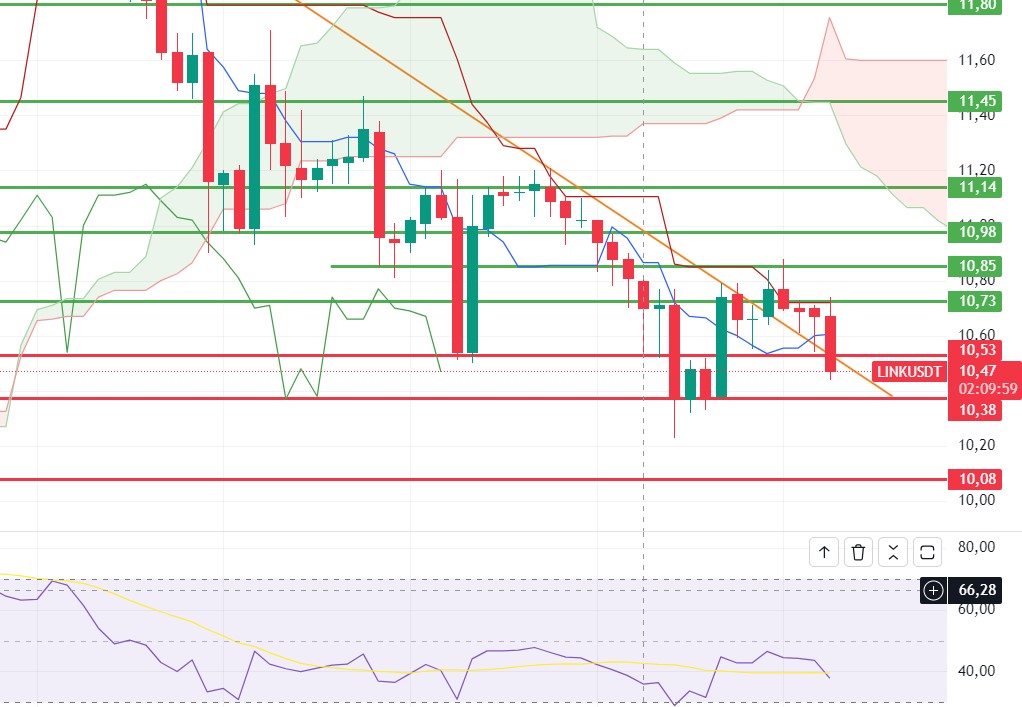
Rejected by the 10.73 tenkan resistance and the 10.85 Bollinger middle band, momentum continues to rise in LINK. In the scenario where Ethereum jumps above 2,550, we can see an increase in LINK to 11.45s by exceeding this resistance zone. The 10.08 level stands out as the main support.
Supports 10.38 – 10.08 – 9.47
Resistances 10.73 – 10.85 – 11.14
SOL/USDT
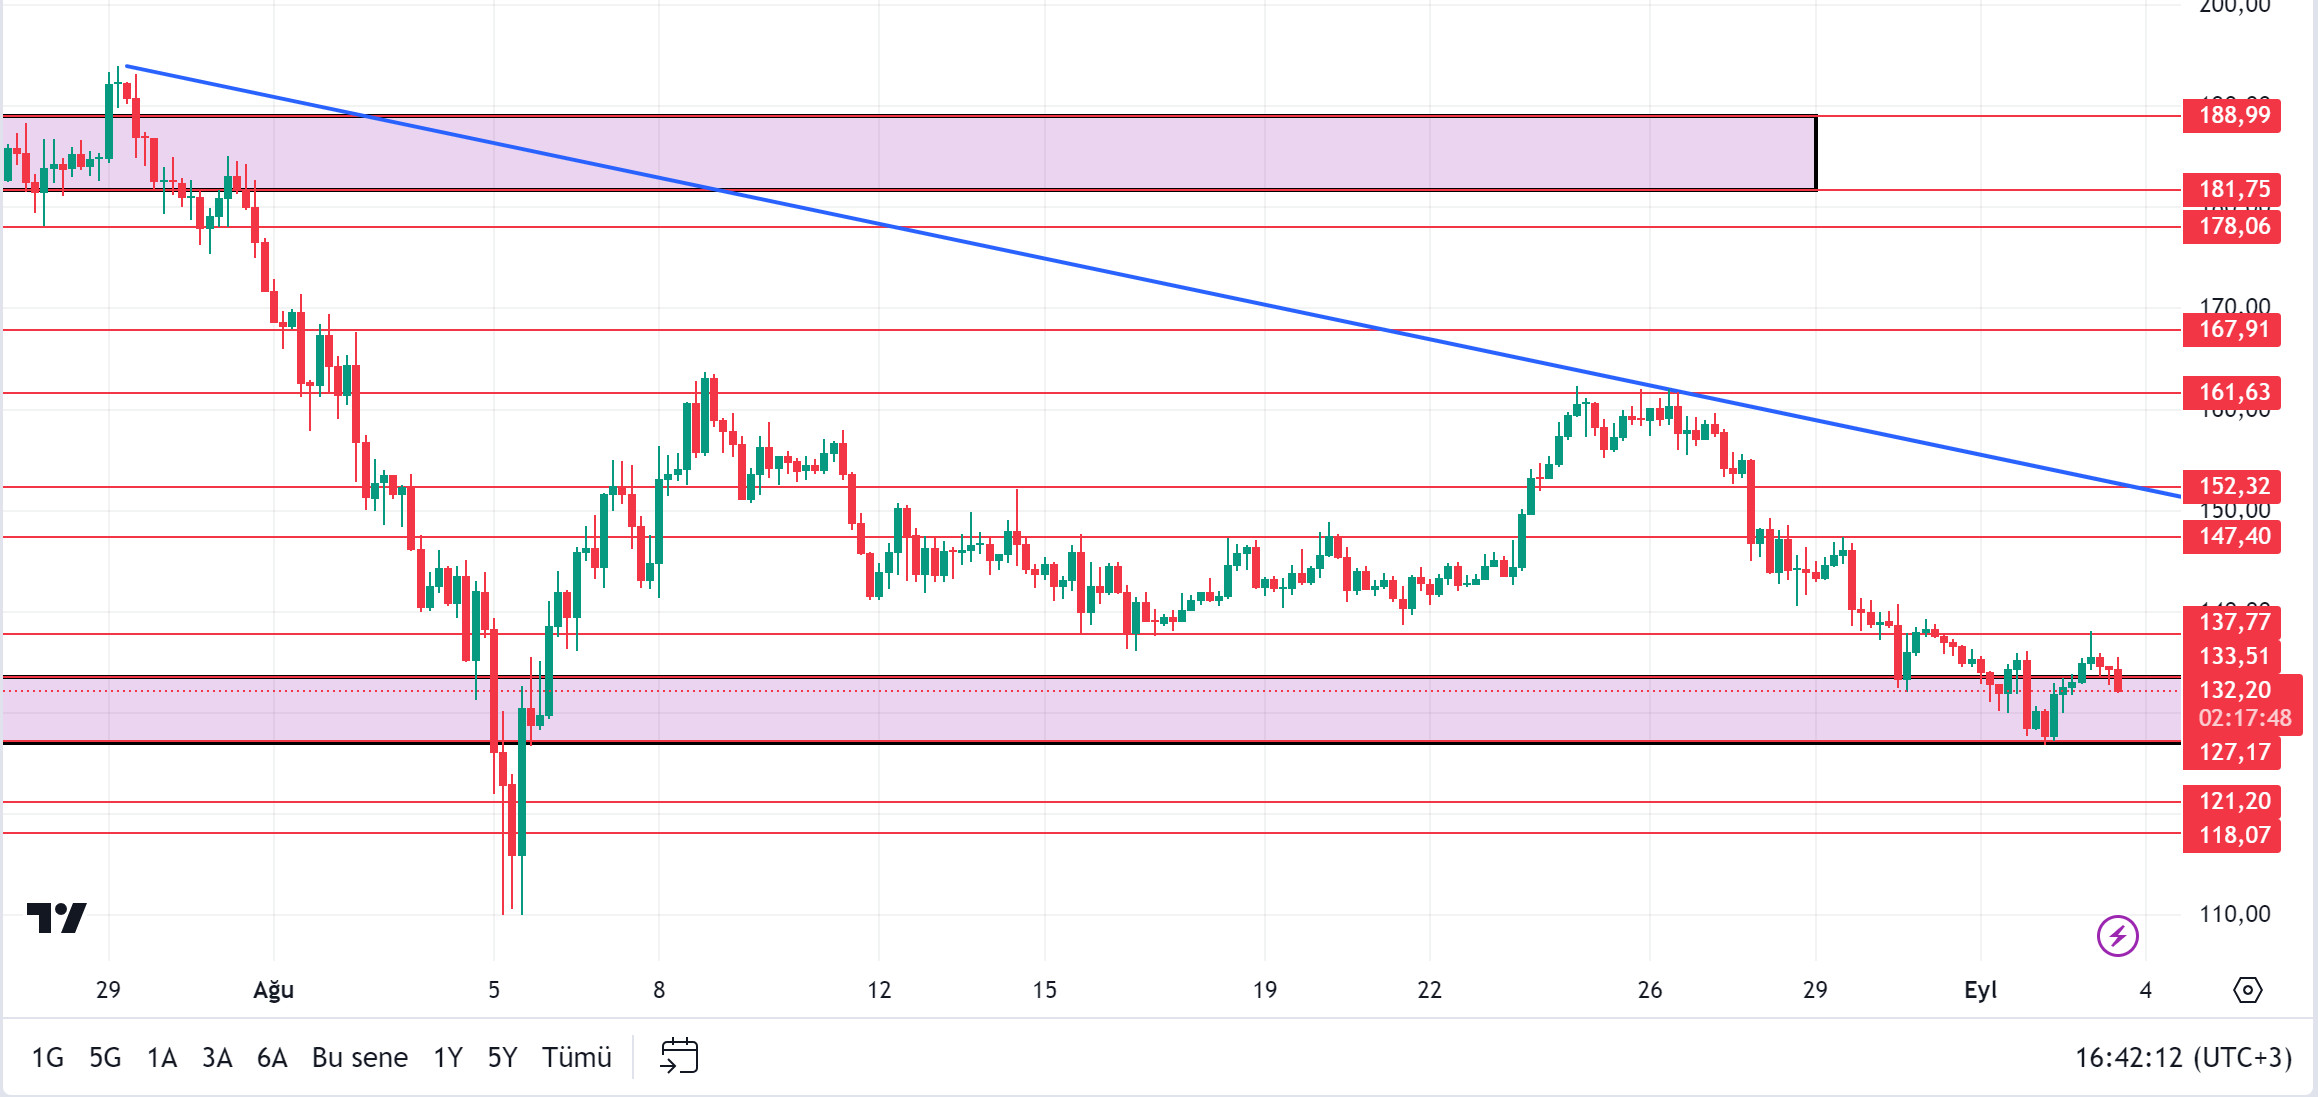
In the Solana ecosystem, Pump.fun became the fastest growing app in terms of revenue in the history of the crypto economy. It generated $100 million in 217 days. On the other hand, the price is struggling to rise as a large whale, or potentially an institutional entity, has been consistently selling large amounts of SOL throughout the year. This year, the total amount sold since January 1 was 695,000 ($99.5 million) SOLs. Maintaining a steady sales routine, the average rate was $19,306 SOL ($2.76 million) per week. Despite these significant sales, the whale/institution still holds a significant position. It currently holds 1.88 million SOL ($255.89 million) worth of shares. This is an amount that investors cannot ignore when making an investment decision. When we look at the chart, the rise may continue as long as SOL does not fall below the $ 133.51 level. SOL, which has been accumulating in a certain band since April, may test the resistance levels of 137.77 – 147.40 if the rises continue. In case of retracements in the market, 127.17 – 121.20 supports should be followed.
Supports 127.17- 121.20 – 118.07
Resistances 137.17 – 147.40 – 152.32
ADA/USDT
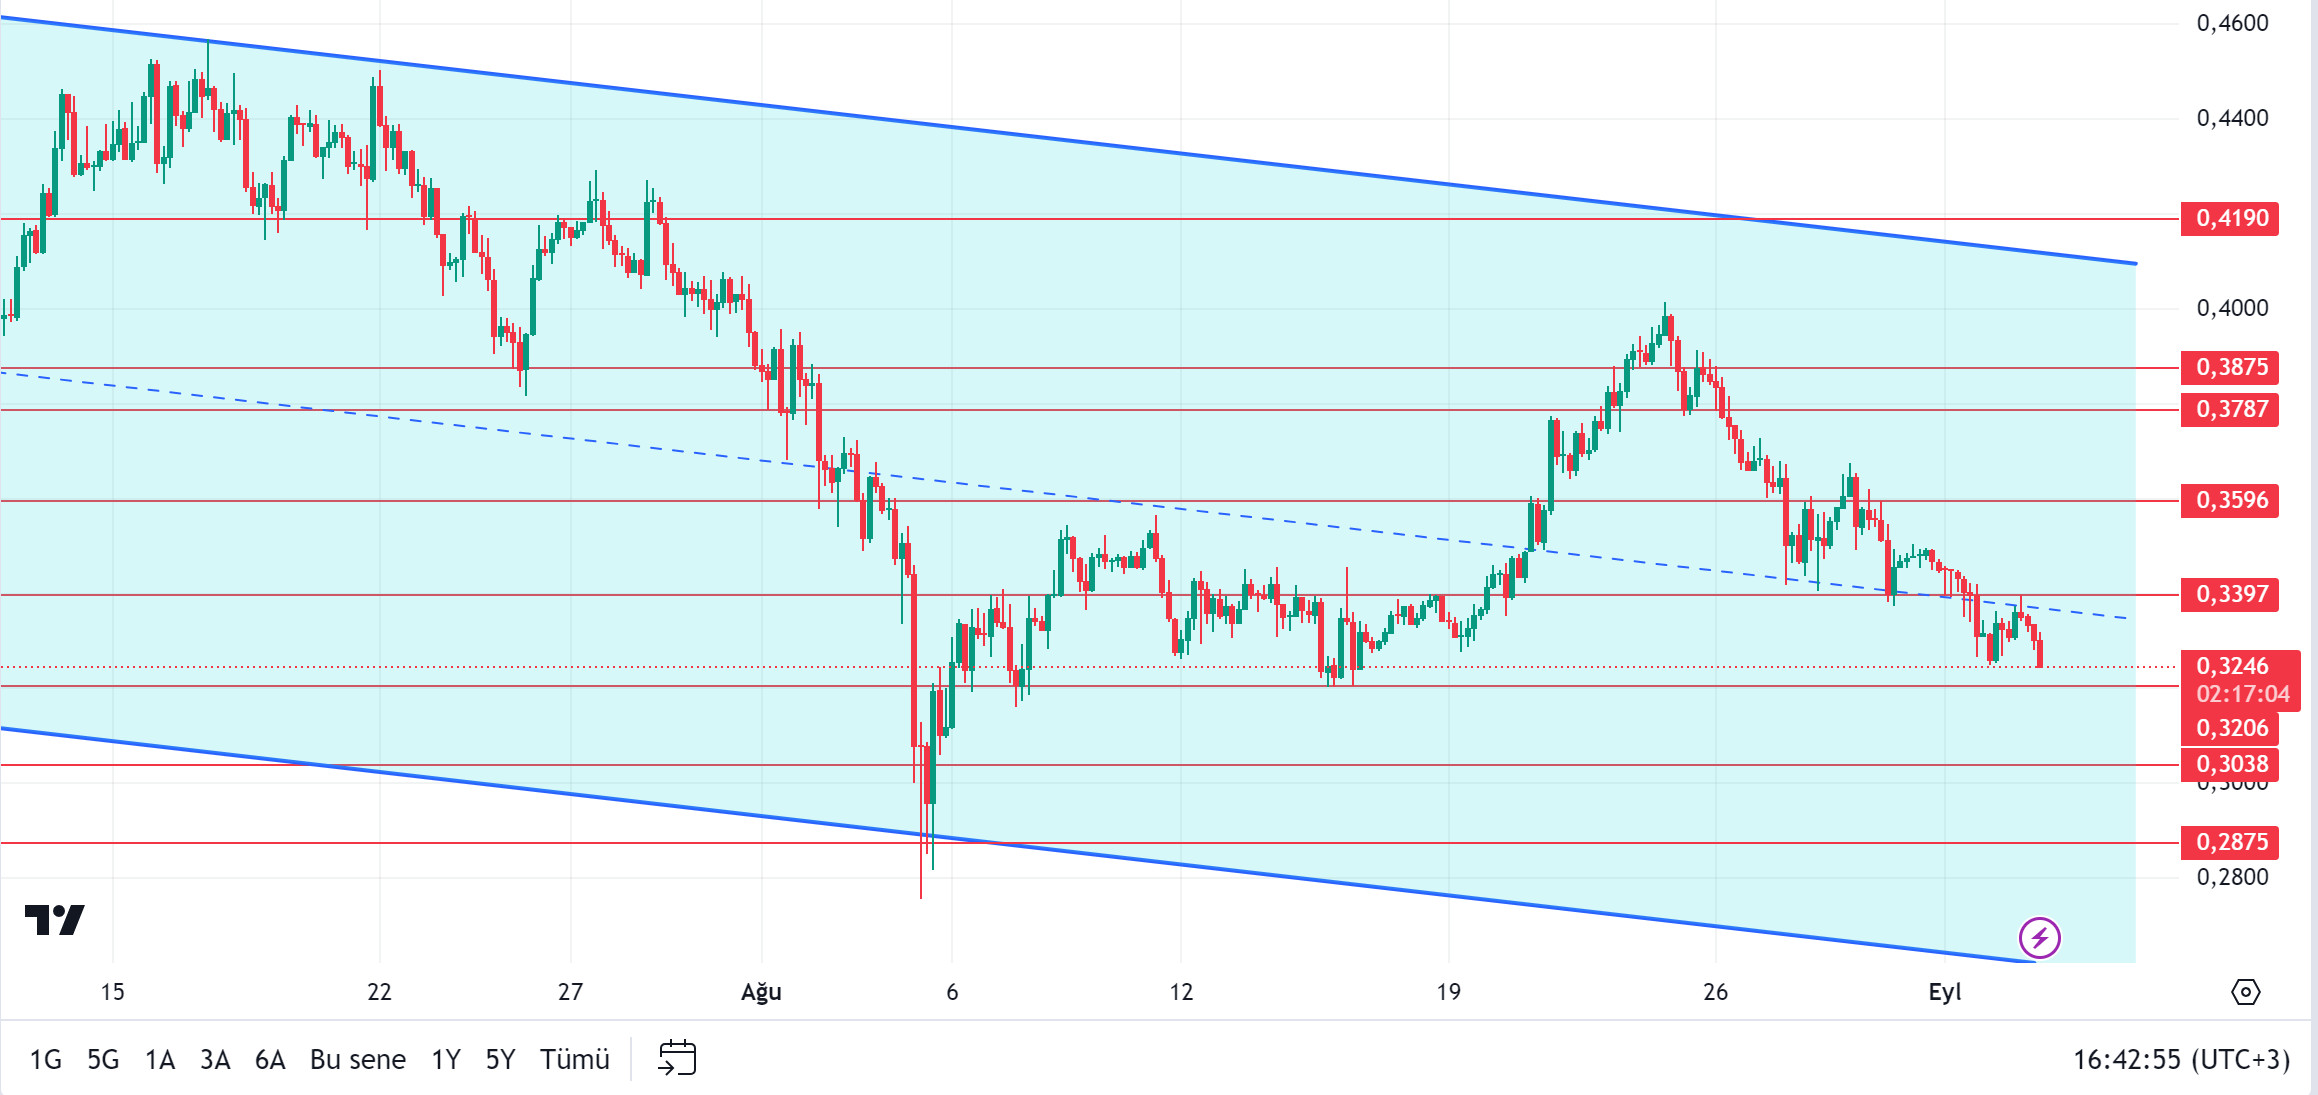
Since our analysis in the morning, the market has been slightly bearish. This may be because Bank of Japan (BOJ) Governor Kazuo Ueda hinted that the central bank may raise interest rates. While the cryptocurrency market was expecting the US to cut interest rates, such news confused the market. On the other hand, Blockstream CEO Adam Back joined the leading Bitcoiners attacking Cardano. Charles Hoskinson claimed that it surpassed Bitcoin in decentralization. When we look at the chart of ADA, it is priced at 0.3246 in the descending channel. With the expectation of the incoming update, profit sales have also started. In order for ADA to continue its rise again, the 0.3397 level must be exceeded. In the scenario where investors expect BTC’s selling pressure to continue and the pessimism of the actors in the market to continue, if it continues to be priced by declining in the descending channel, the 0.3206 – 0.3038 levels can be followed as support.
Supports 0.3206 – 0.3038 – 0.2875
Resistances 0.3397 – 0.3596 – 0.3787
AVAX/USDT
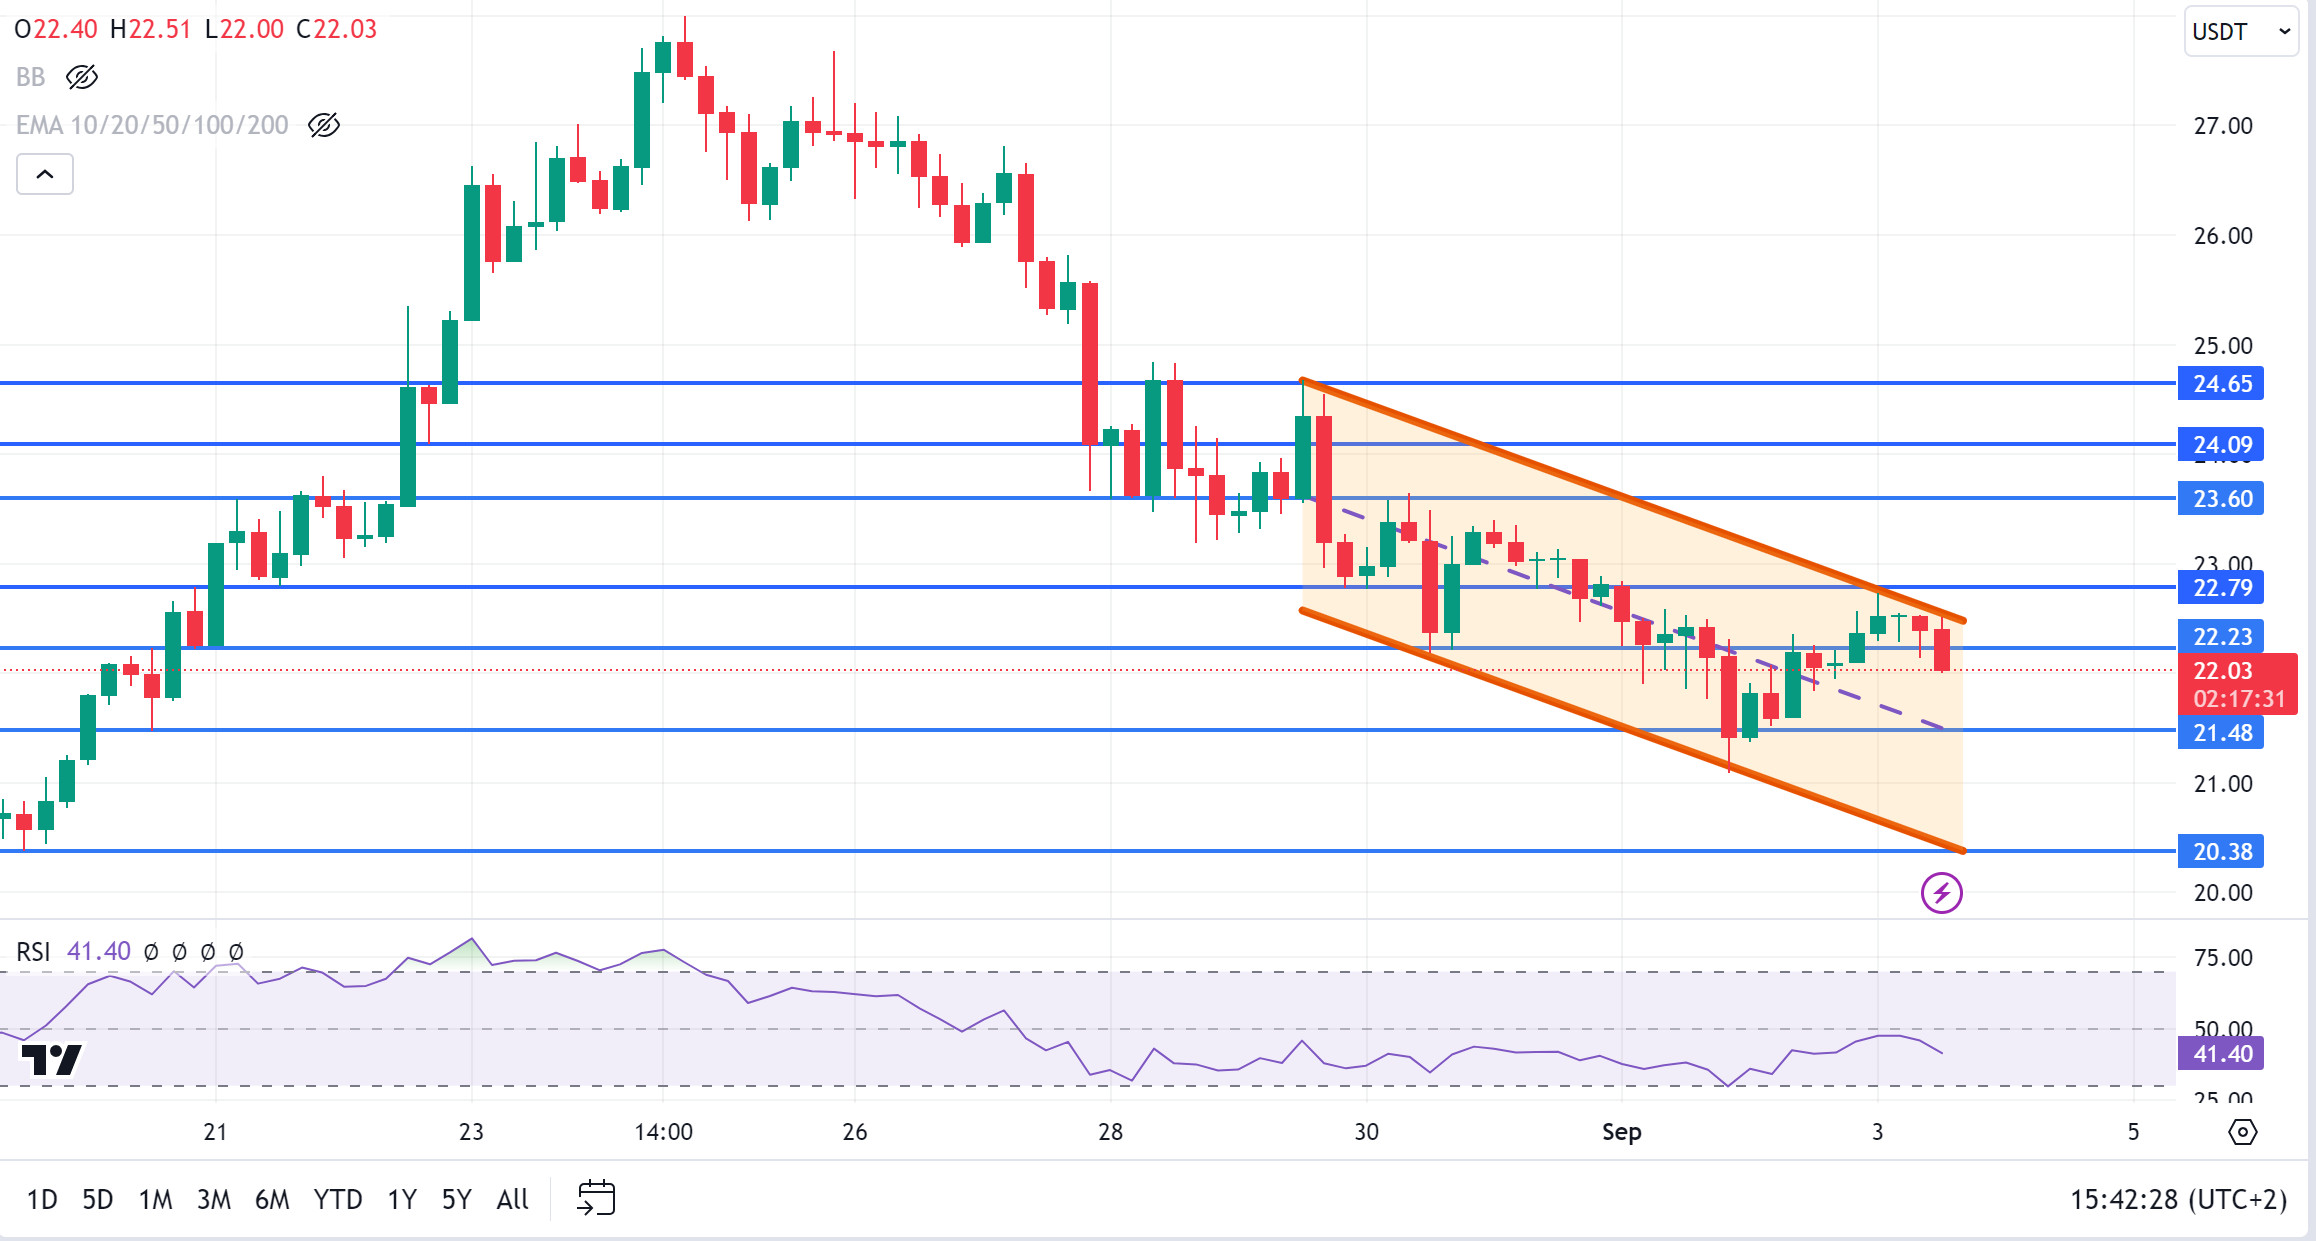
AVAX, which started the day at 22.37, is trading at 22.03, falling slightly with the negative opening of the US stock markets.
It continues to move in a falling channel. On the 4-hour chart, it is trying to break the upper band of the channel and may continue its rise with a candle closing above 22.79 resistance. In such a case, it may test 23.60 and 24.09 resistances. In case of sales from the upper band of the channel, it may test 22.23 and 21.48 supports. As long as it stays above 20.38 support during the day, the upward appetite may continue. With the break of 20.38 support, sales may deepen.
Supports 22.23 – 21.48 – 20.38
Resistances 22.79 – 23.60 – 24.09
TRX/USDT
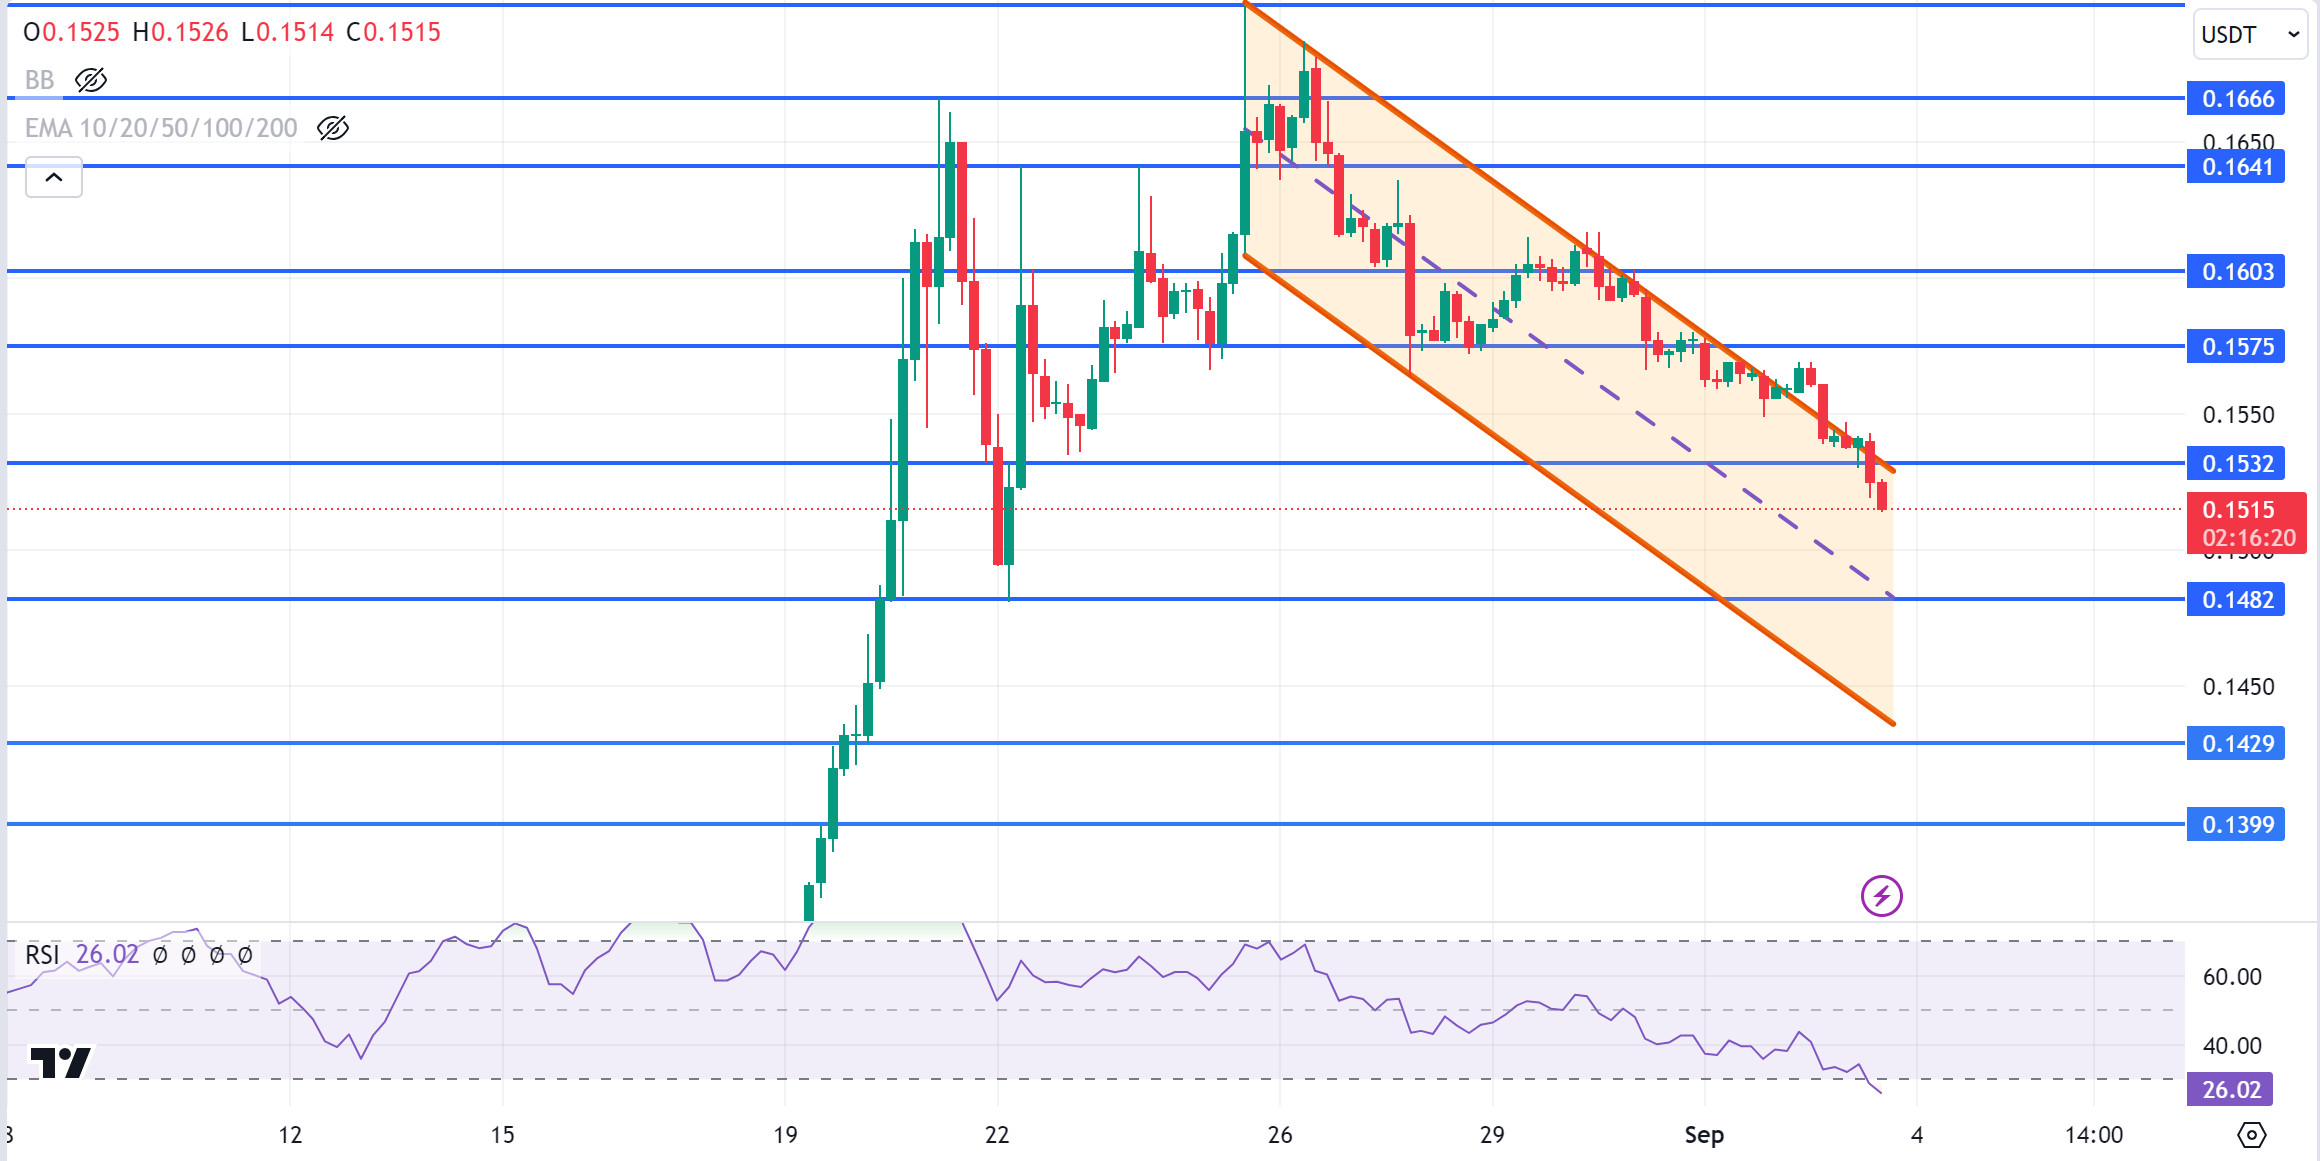
TRX, which opened today at 0.1542, is currently trading at 0.1515, falling slightly with the opening of the US stock markets. On the 4-hour chart, it moves towards the middle band with the sales reaction from the upper band of the falling channel. Breaking the 0.1482 support, it may want to go to the lower band of the channel. If there is no candle closure below the 0.1482 support, it may rise and break the upper band of the channel upwards. In this case, it may test the 0.1532 and 0.1575 resistances. As long as TRX stays above 0.1482 support, it can be expected to continue its upward trend. If it breaks this support downwards, sales may deepen.
Supports 0.1482 – 0.1429 – 0.1399
Resistances 0.1532 – 0.1575 – 0.1603
XRP/USDT
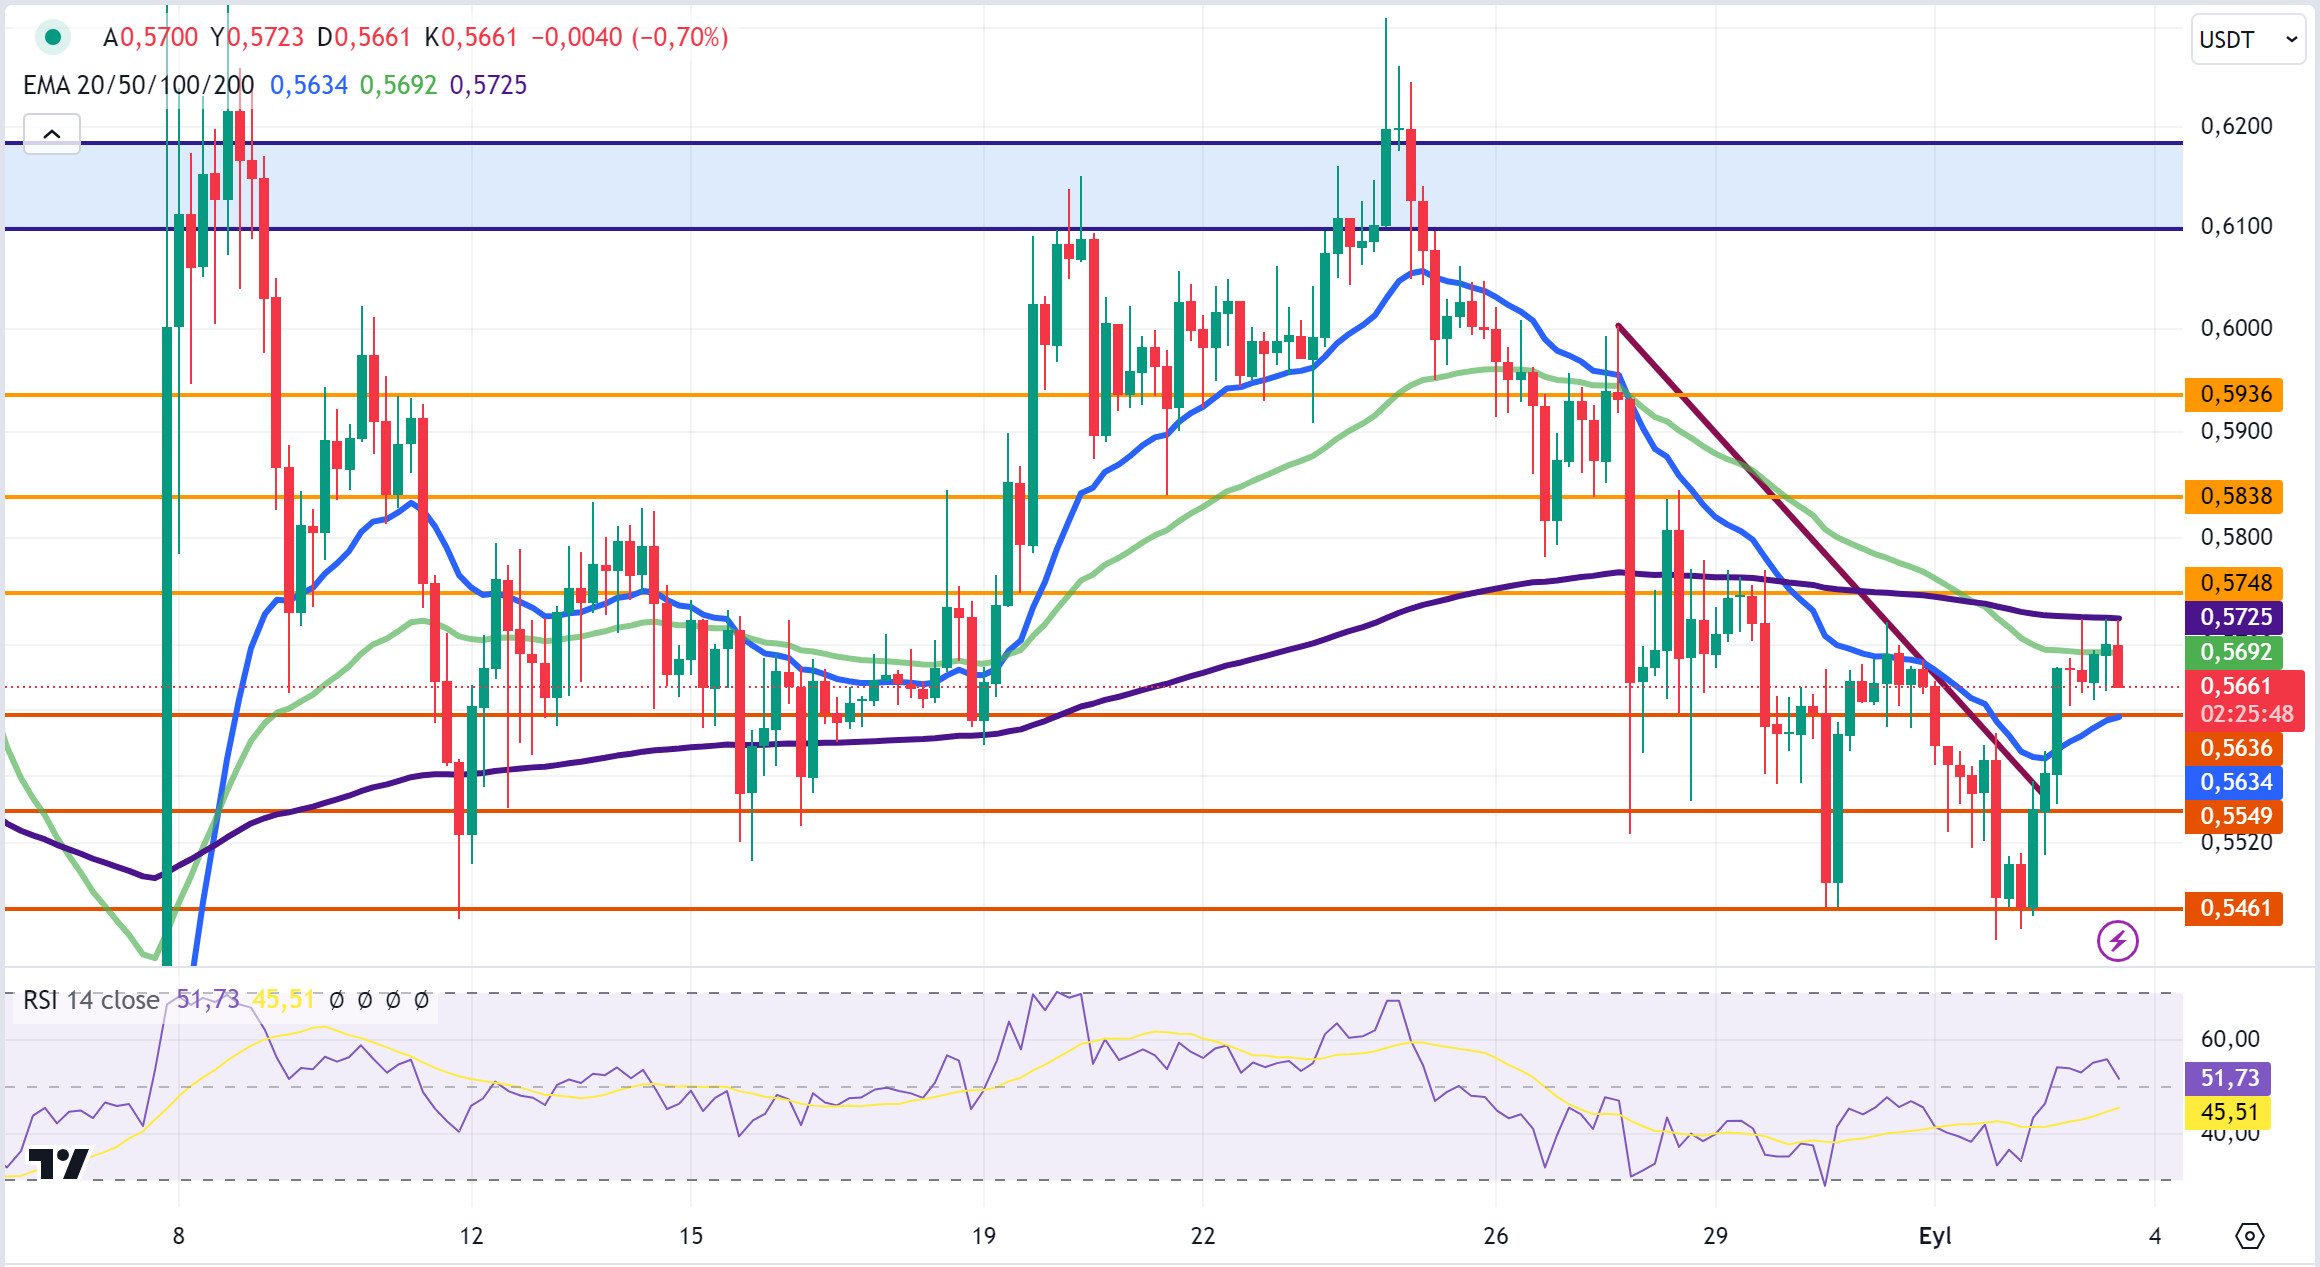
XRP continued its sideways movement after starting today at 0.5677 with a 3.8% increase yesterday. It is currently trading at 0.5661.
After the decline in the crypto market last week, the crypto market started the new week with an uptrend, and this was also seen in XRP. The announcement by Ripple that NFT, AMM and DEX functionality will be developed with the integration of smart contracts on the XRP main network is a positive development for XRP and contributed to the rise.
In the 4-hour analysis, today, during the XRP rise, it failed to break this level with the reaction at the EMA200 (Purple Color) level three times during its rise and fell down. If XRP continues its upward movement by breaking the EMA200 level with the rise again, it may test the resistance levels of 0.5748-0.5838-0.5936. With the continuation of the decline that started with the reaction after the rise, XRP may test the 0.5636 support level and if this support level is broken, it may test the 0.5549-0.5461 support levels with the deepening of the decline.
Supports 0.5636 – 0.5549 – 0.5461
Resistances 0.5748 – 0.5838 – 0.5936
DOGE/USDT
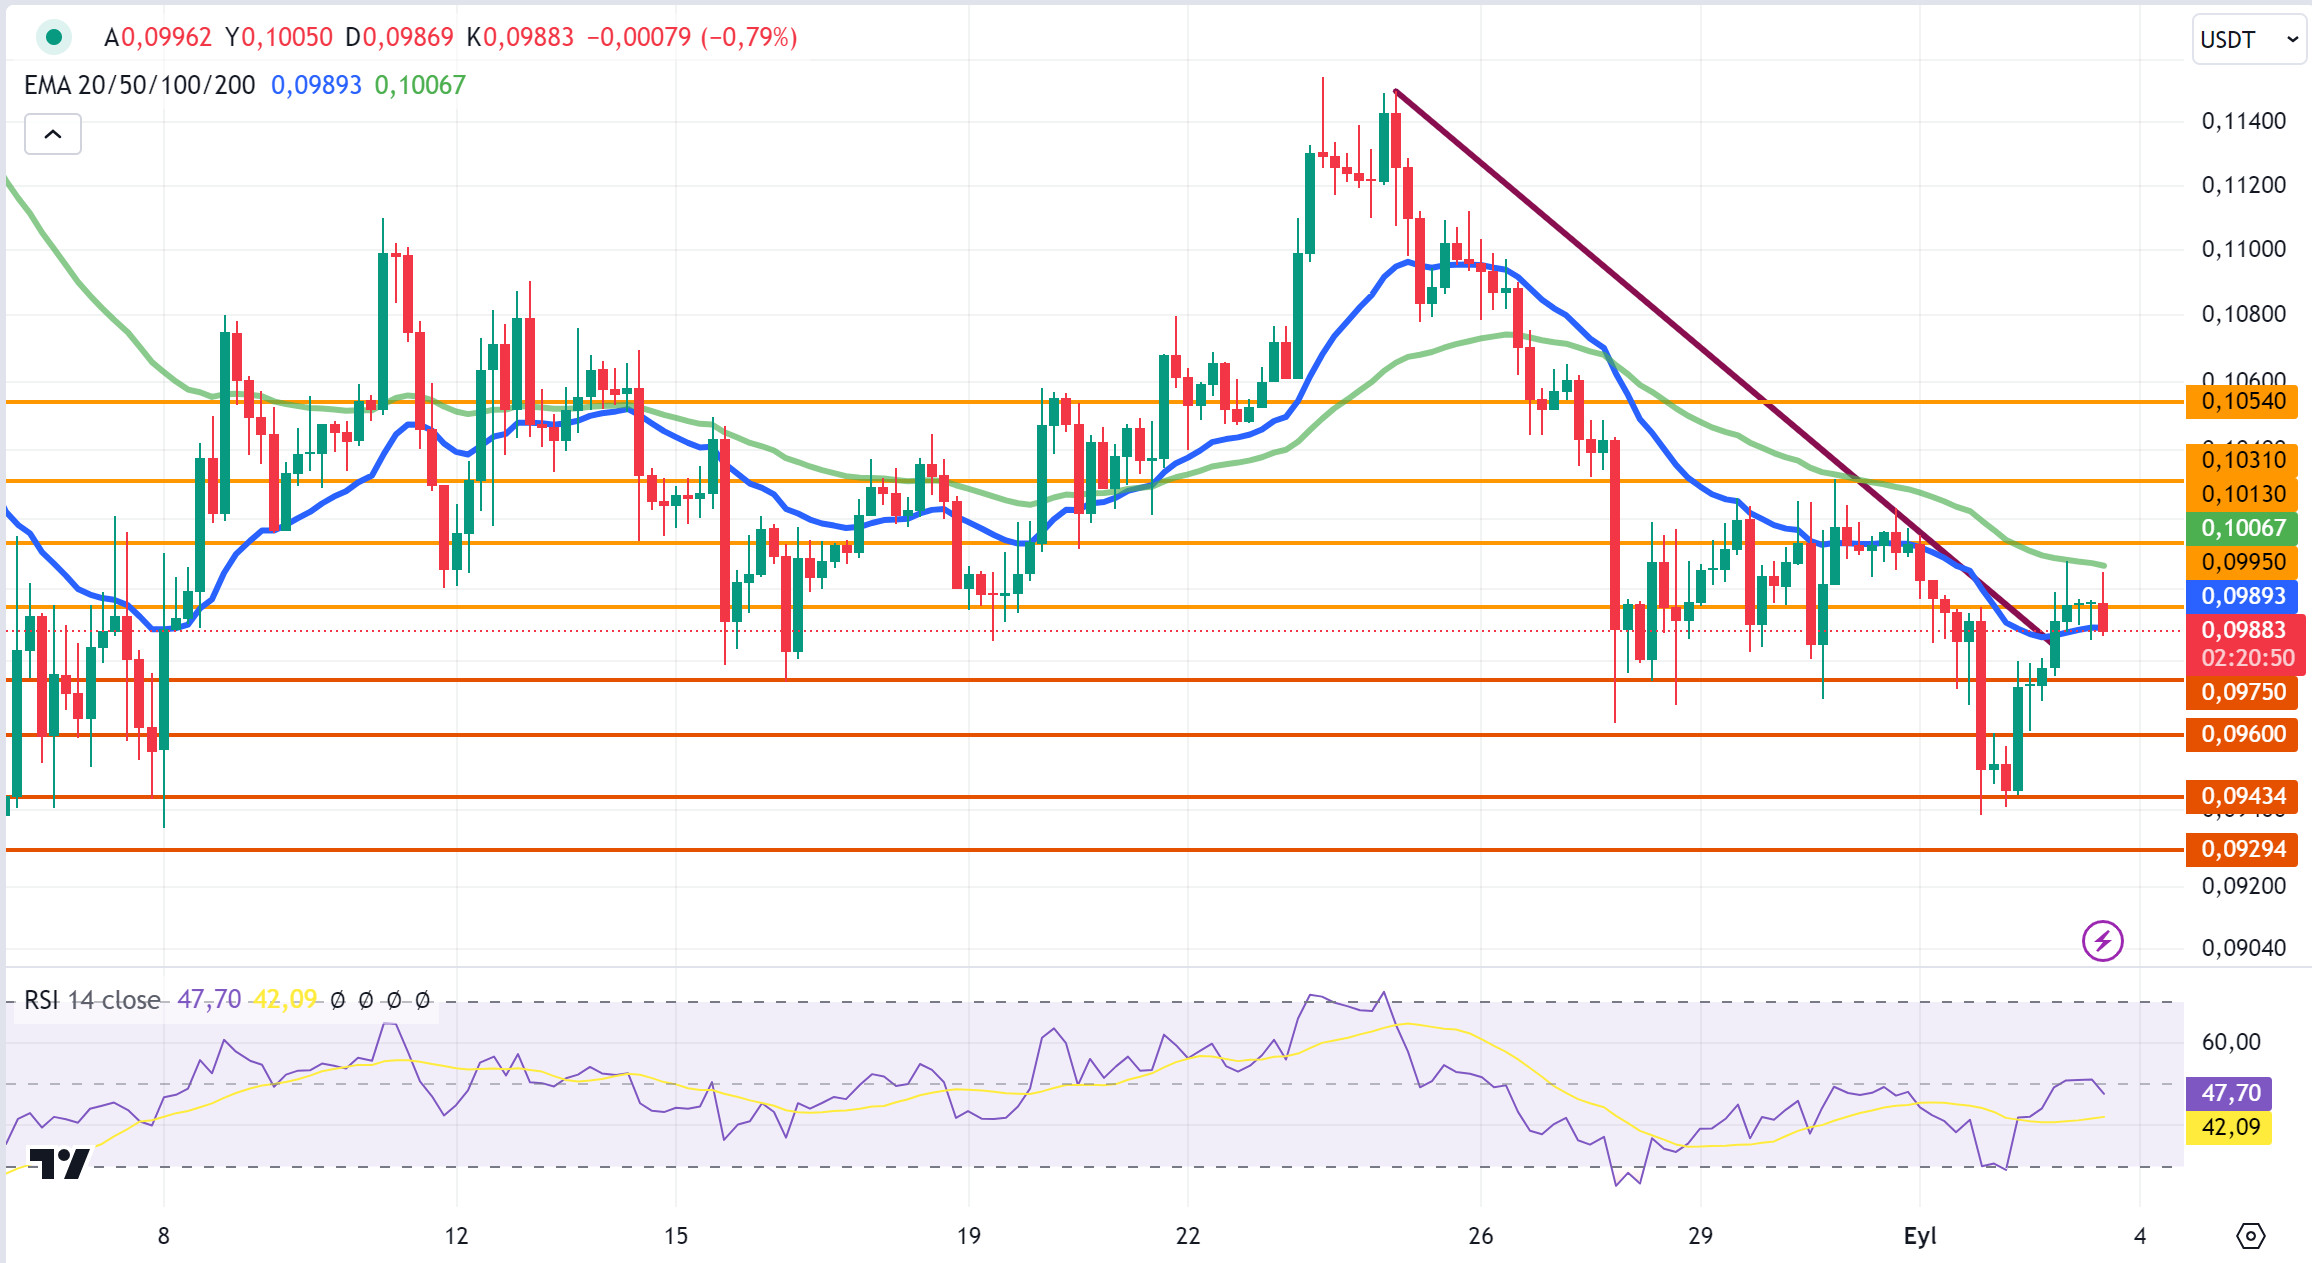
DOGE started today at 0.0990 with a rise of 4.25% yesterday and continued its horizontal movement after the rise in the first candle in the 4-hour analysis, while it fell below the starting level of the day with the decline in the last candle. In the DOGE rise, it declined with the reaction at the EMA50 (Green Color) level in the 4-hour analysis. It is currently trading at 0.0988.
DOGE was also affected by the decline in the crypto market after the US stock markets opened and fell below its starting level today with a deepening decline in the last candle. If the decline continues, DOGE may test support levels of 0.0975-0.0960-0.0943. If it starts to rise again as a result of positive developments that may come about the crypto market, it may test the resistance levels of 0.0995-0.1013-0.1031.
Supports 0.0975 – 0.0960 – 0.0943
Resistances 0.0995 – 0.1013 – 0.1031
DOT/USDT
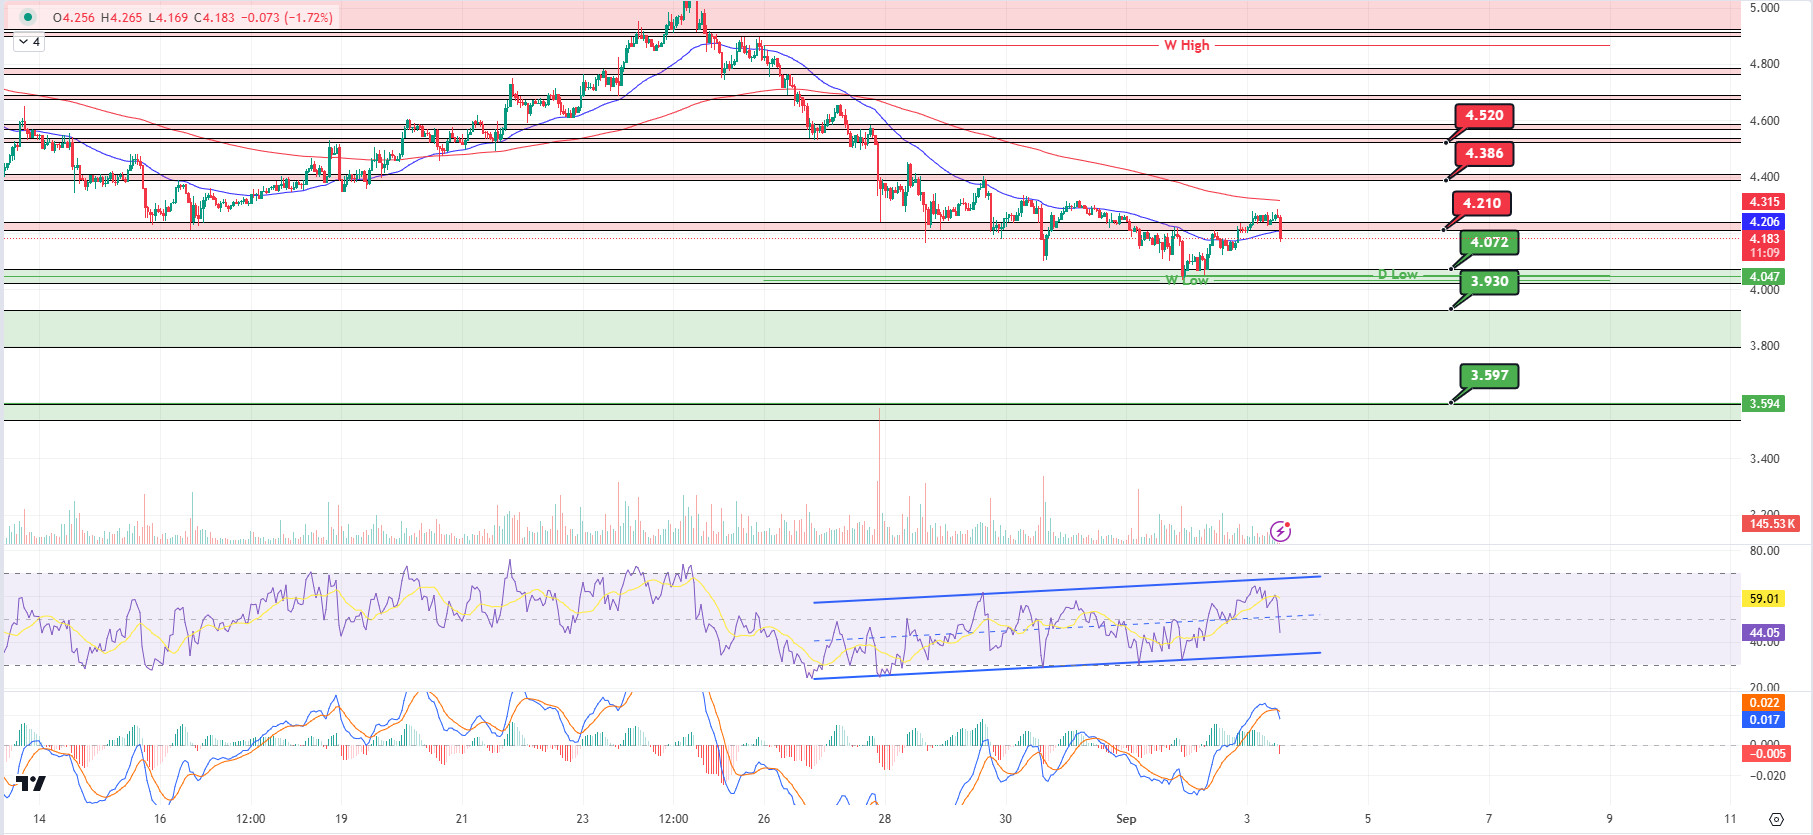
Selling pressure also increased on Polkadot (DOT) as US stock markets opened negatively. If we need to evaluate the negative mismatch on the RSI, there may be a possibility that the price may retreat a little more. If it retreats, the price may fall to the first support level of 4,072. If the price fails to hold here, it may want to test the next support level of 3,930. In the positive scenario, if the price stays above the EMA50, it may move towards the first resistance level of 4,386.
(Blue line: EMA50, Red line: EMA200)
Supports 4,072 – 3,930 – 3,597
Resistances 4.210 – 4.386 – 4.520
SHIB/USDT
Lucie, Shiba Inu’s marketing lead, warned the community against rumors creating fear and suspicion about SHIB and stated that such comments should be ignored. In addition, in the last 24 hours, the SHIB burning rate has increased by 24.71%, with nearly 1.5 million SHIBs removed from circulation. Currently, there is a vote on what to do with the 37.5 ETH donation made by Welly’s fast-food chain to the SHIB team; one of the options is to convert it into SHIB and burn it.
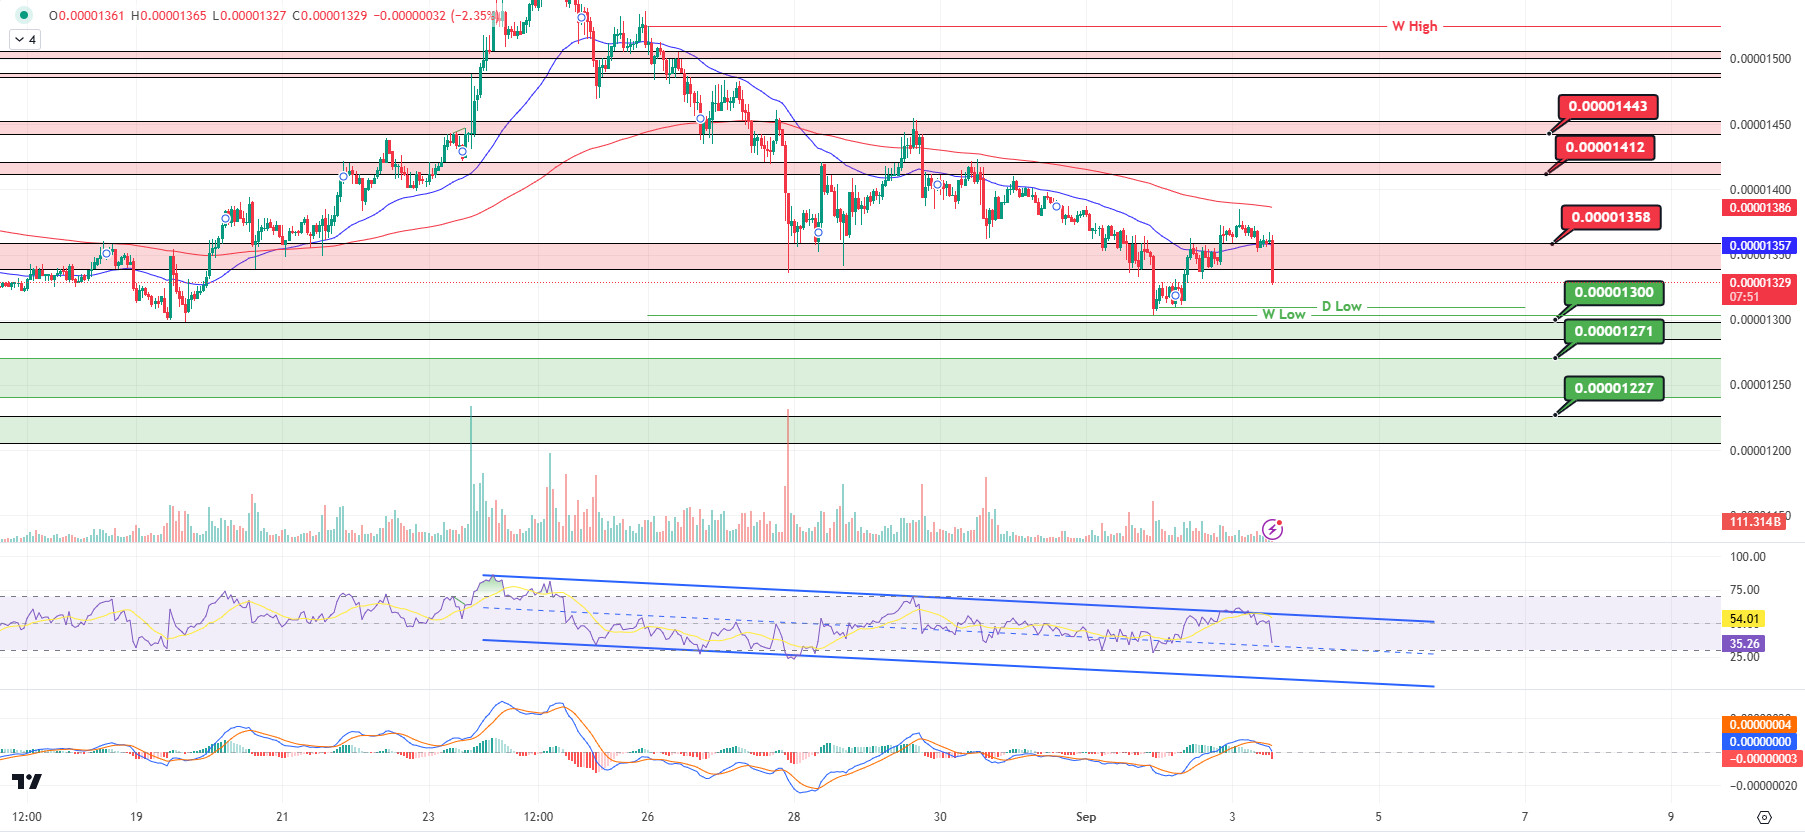
On the SHIB chart, the price continues to retreat. If the selling pressure increases, the price may fall to 0.00001310, the lowest level of the day before. If there is no reaction from here, we can expect a reaction from the 0.00001300 band. In the positive scenario, the price may move towards the EMA50 levels as the selling pressure decreases. If the price stays above the EMA50, the price may want to retest the 0.00001412 band.
(Blue line: EMA50, Red line: EMA200)
Supports 0.00001300 – 0.00001271 – 0.00001227
Resistances 0.00001358 – 0.00001412 – 0.00001443
LEGAL NOTICE
The investment information, comments and recommendations contained herein do not constitute investment advice. Investment advisory services are provided individually by authorized institutions taking into account the risk and return preferences of individuals. The comments and recommendations contained herein are of a general nature. These recommendations may not be suitable for your financial situation and risk and return preferences. Therefore, making an investment decision based solely on the information contained herein may not produce results in line with your expectations.


