MARKET SUMMARY
Latest Situation in Crypto Assets
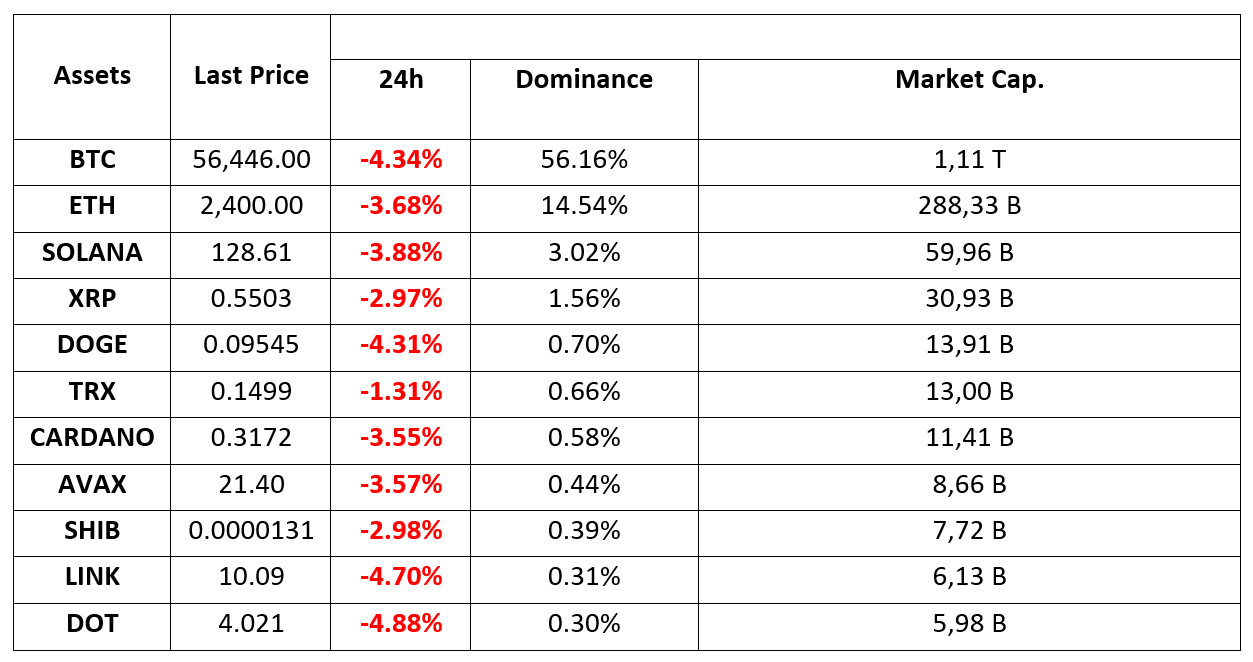
*Prepared on 4.09.2024 at 14:00 (UTC)
WHAT’S LEFT BEHIND
Striking Picture in Bitcoin!
According to Coinglass data, Bitcoin’s price movements around key thresholds could trigger significant liquidations on major centralized exchanges. Accordingly, in a scenario where Bitcoin’s price falls below $55,000, the liquidation bill for long positions on exchanges could be as high as $746 million. On the other hand, if it rises above $58,000, the liquidation bill for short positions could total up to $900 million.
BlackRock Becomes the World’s Largest Institutional Bitcoin Owner with 357 thousand BTC!”-
BlackRock, the world’s largest asset management company, became the world’s largest institutional Bitcoin owner, reaching 357,509 BTC with its spot Bitcoin ETF IBIT. While this development put BlackRock ahead of other major investors, it also showed its power in the cryptocurrency market.
Arthur Hayes “$50K in Bitcoin is Back on the Table”
Former BitMEX CEO Arthur Hayes, who is notable for his analysis of Bitcoin and the cryptocurrency market, predicted the worst-case scenario for Bitcoin in the short term. In his new article, Hayes said that Bitcoin could fall as low as $50,000 in the worst-case scenario due to macroeconomic pressures and rising bond yields, while altcoins could experience even deeper declines.
Giant Bank, One of the Five Most Reliable Banks in the World, Announces that It Will Offer Bitcoin and Ethereum Service to Its Customers!
Zürcher Kantonalbank, named one of the five safest banks in the world by Global Finance magazine, has announced the launch of a cryptocurrency service. With this move, the bank allows its customers to trade and store Bitcoin (BTC) and Ethereum (ETH).
Ripple CEO gave the good news: Coming soon
Brad Garlinghouse, the famous CEO of Ripple, the company behind XRP, spoke at the South Korean Blockchain Week. Garlinghouse said that they will launch the company’s stablecoin in a few weeks. The US executive stated that he is “more optimistic than ever” for cryptocurrencies on the basis of the next 5 years.
HIGHLIGHTS OF THE DAY

INFORMATION
*The calendar is based on UTC (Coordinated Universal Time) time zone. The economic calendar content on the relevant page is obtained from reliable news and data providers. The news in the economic calendar content, the date and time of the announcement of the news, possible changes in the previous, expectations and announced figures are made by the data provider institutions. Darkex cannot be held responsible for possible changes that may arise from similar situations.
MARKET COMPASS
Yesterday’s ISM manufacturing PMI data from the US, which fell short of the forecasts, continues to have an impact on the markets. After this data, which gave the markets an excuse to rekindle recession concerns, we saw a serious deterioration in risk sentiment. This situation actually supported the warning that risk sentiment remains fragile, which we have been talking about in our analysis for some time. In addition, the news that Nvidia has received a subpoena from the US Department of Justice (DoJ) for an antitrust lawsuit brought down the company’s stock prices by 9.5% and brought sales to technology stocks globally. We also saw this being felt on the digital assets front.
Today, European and US stock markets remain in negative territory. The pressure on digital assets does not seem to have lifted. The JOLT data, which was also below the forecasts, seems to have supported the worried expectations regarding economic activity, as we mentioned in our morning analysis. Nevertheless, after the losses since yesterday, we did not see that the data in question caused deep sales. Later in the day, the details between the lines of the Fed’s Beige Book may be important for the markets. Although it is too early to attribute any meaning to the recent declines, it should not be overlooked that the markets may start looking for an excuse for a new upward movement.
TECHNICAL ANALYSIS
BTC/USDT
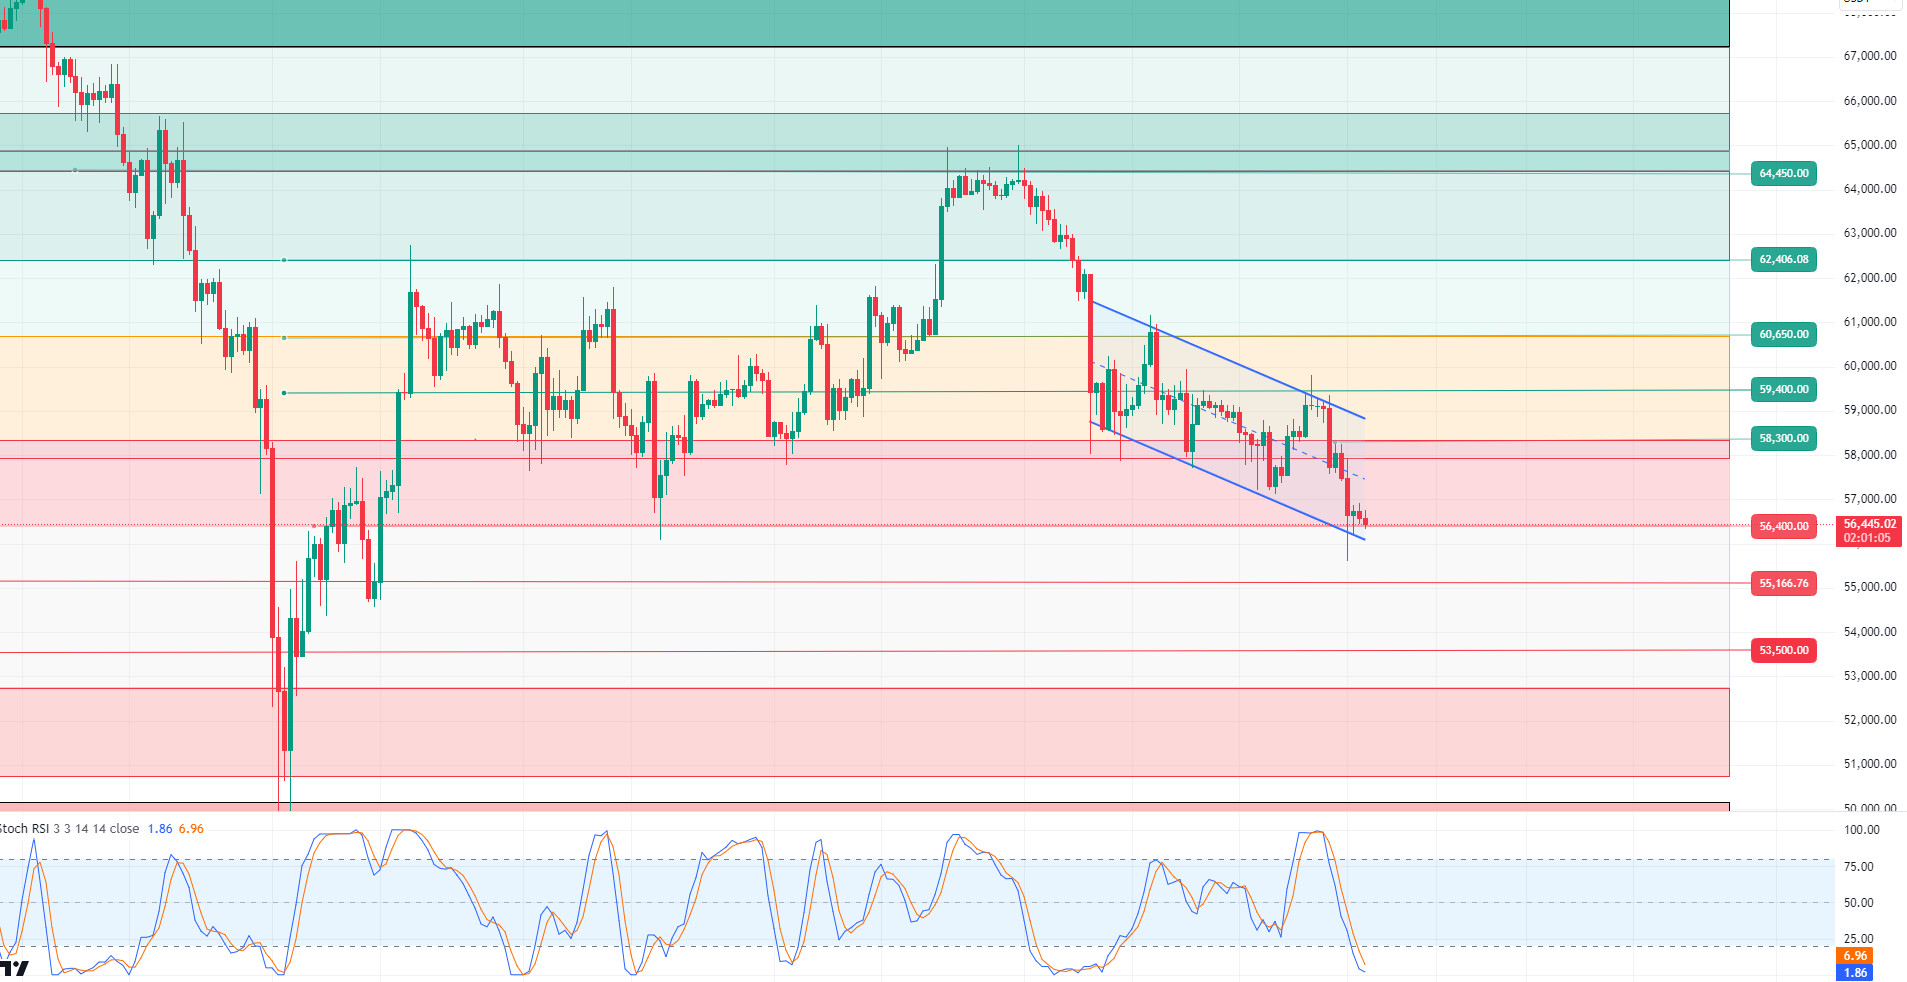
Bitcoin at critical support! Although the activity in the news flow has decreased recently, the decline in Bitcoin has become a very intriguing issue for investors. Despite the FED’s interest rate cut in the macroeconomic agenda and the political environment in the US developing in favor of Bitcoin, the positive impact on the price was short-lived and the downward trend continued. Continued uncertainty in the market could have a significant impact on investor sentiment. This week’s unemployment rates and non-farm payrolls data could increase market volatility. Bitcoin’s 4-hour technical analysis shows that the price is moving within a downtrend structure and is currently trading just above the critical support level of $56,300. A downside break of this zone could cause the price to enter the “gap” area, which are weak support and resistance zones. Our technical indicator, the RSI, is still in oversold territory and in case of an upside move, resistance at $58,300 could be tested.
Supports 56,400 – 55,166 – 53,500
Resistances 57,200 – 58,300 – 59,400
ETH/USDT
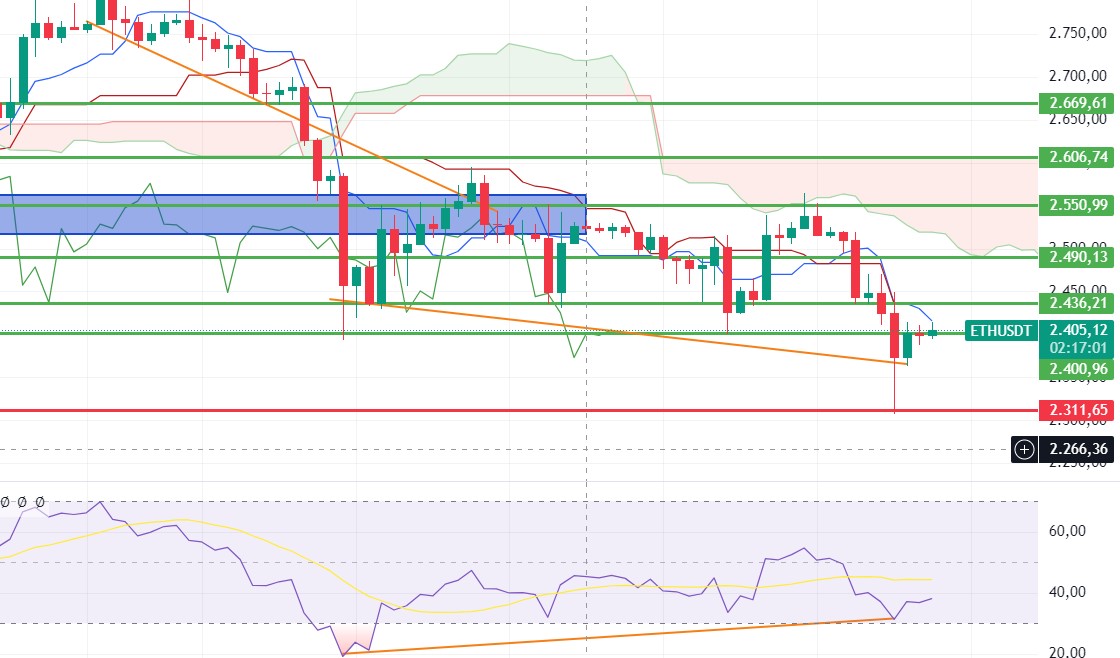
Ethereum, which has risen slightly with the negative mismatch in RSI, can be expected to exceed the 2,400 level and move towards 2,436. Ethereum, which was heavily affected by the declines on the Nasdaq side yesterday, may recover a little more with today’s opening. Especially exceeding the 2,436 level can breathe a sigh of relief within the channel again. Below the 2,300 level, declines to the 2,112 level may occur.
Supports 2,311 – 2,194 – 2,112
Resistances 2,450 – 2,490 – 2,550
LINK/USDT
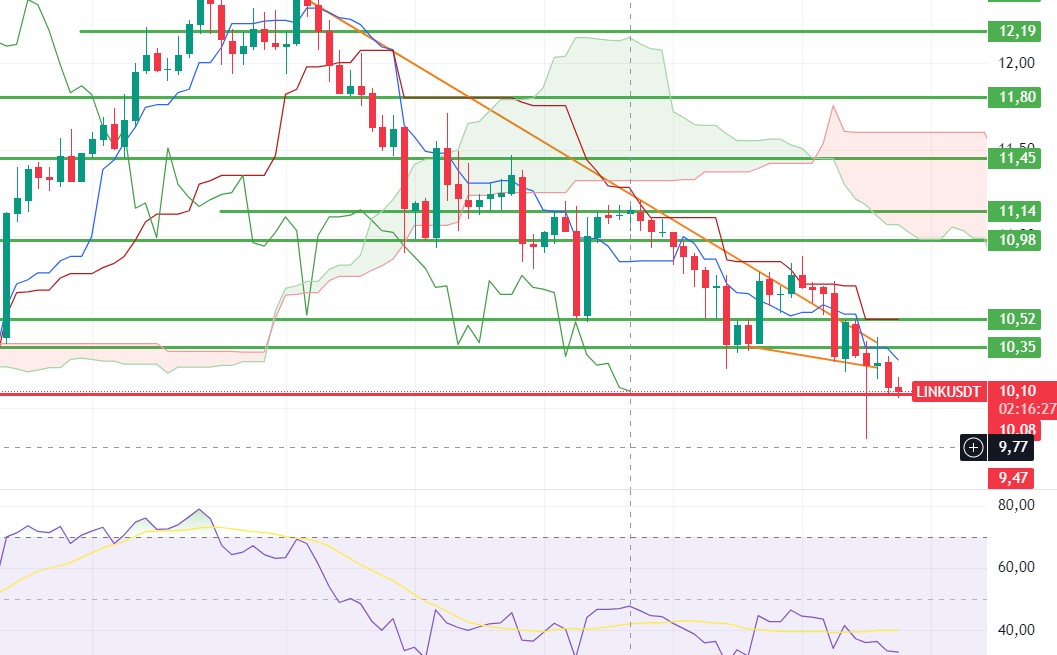
The momentum buy signal on LINK did not work. Seller pressure on the spot side still seems to have subsided. When we look at CVD data, the futures side is selling along with the spot. LINK, which fell to 10.08 support, will draw a clearer outlook for the direction with the reaction it will receive from here. If it can get a reaction from 10.08, it can rise up to 10.35 again. However, closures below it may bring a decline to 9.47 levels.
Supports 10.08- 9.47 – 8.12
Resistances 10.35 – 10.52 – 10.98
SOL/USDT
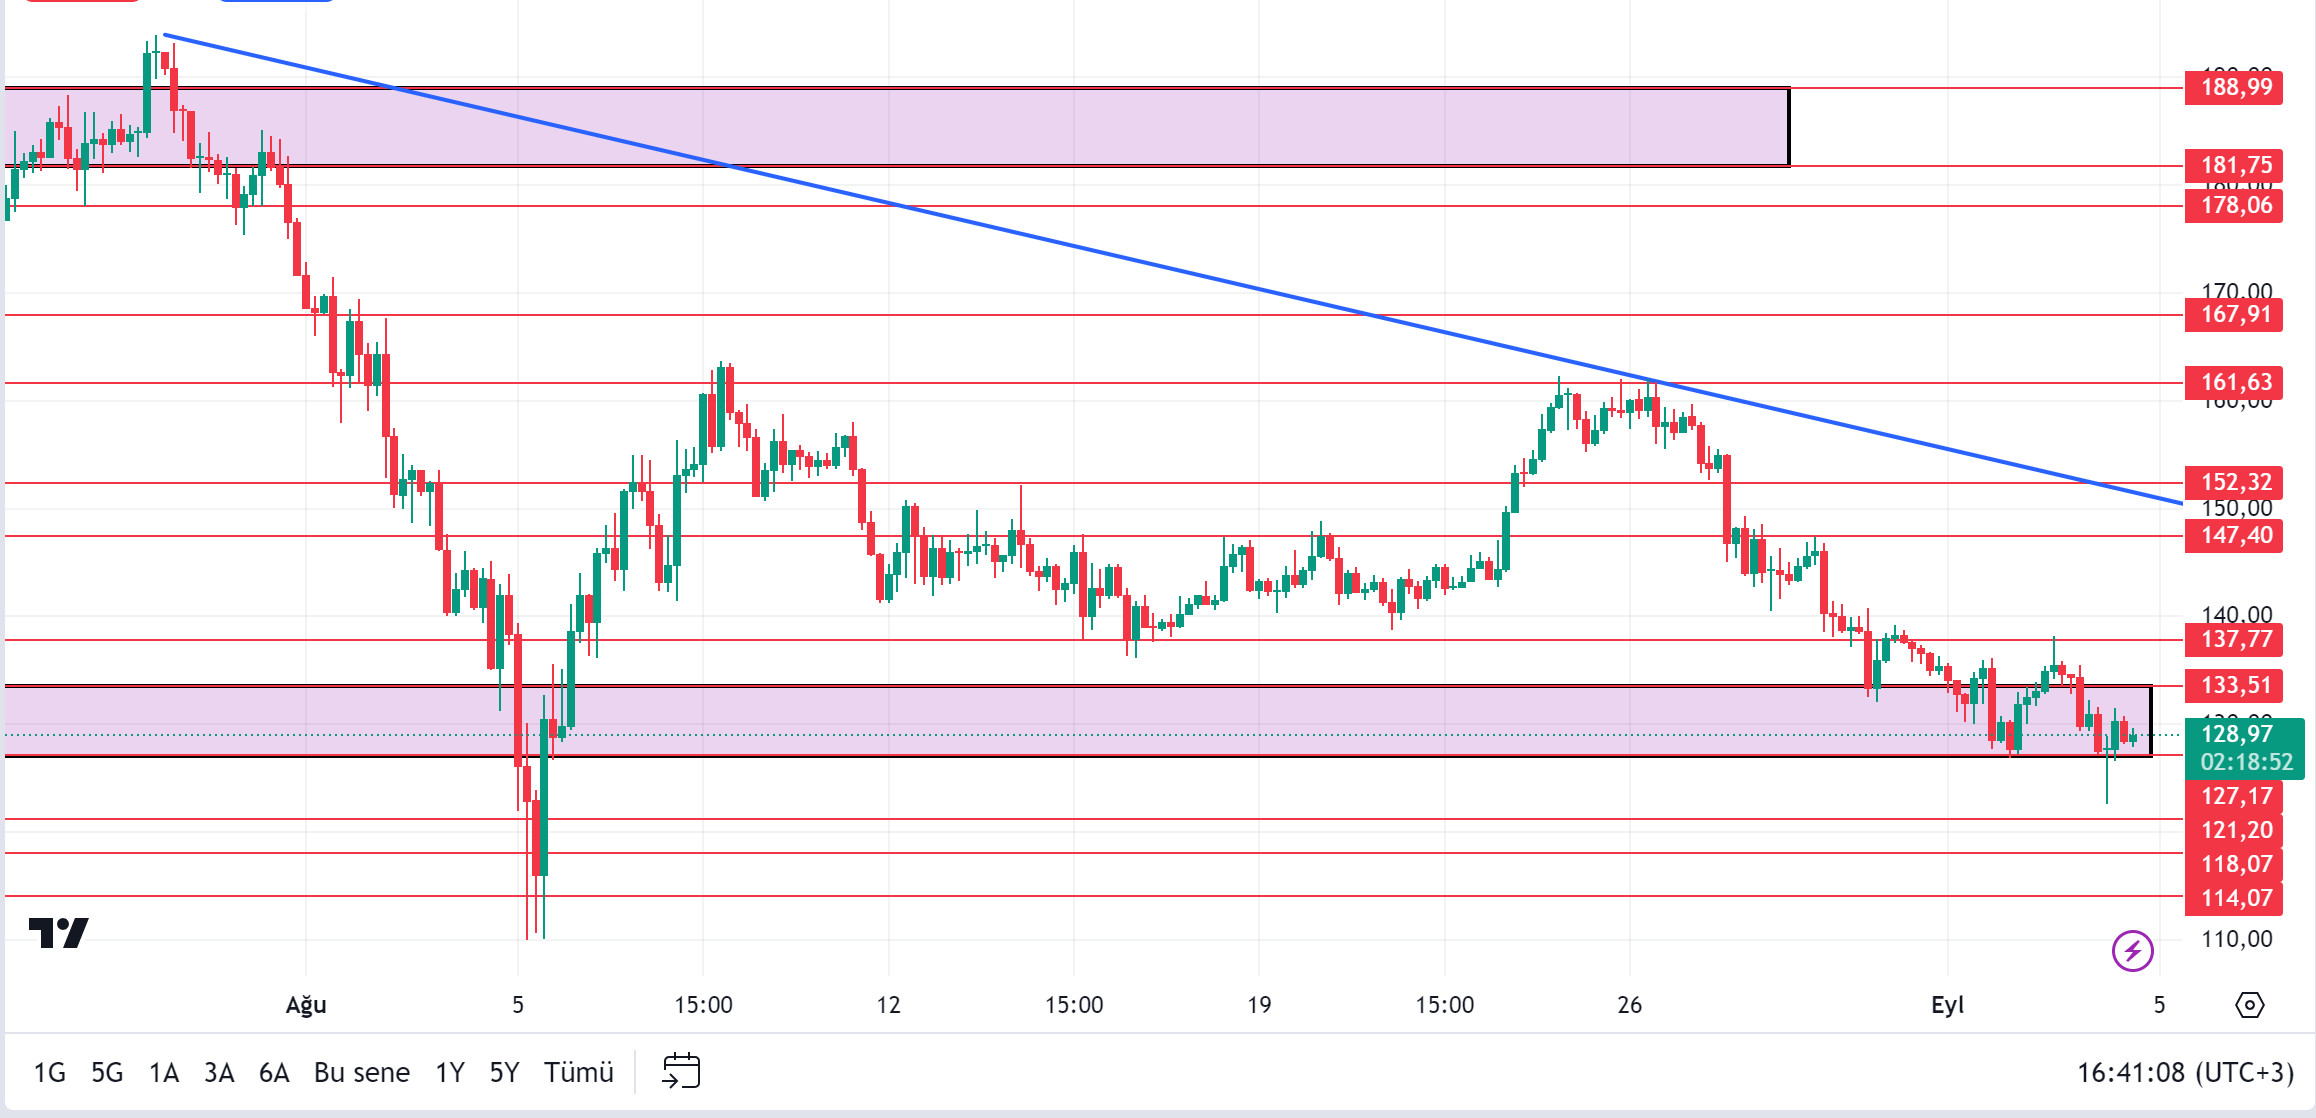
Since our analysis in the morning, the market has been flat. The effects of Japan’s interest rate hike tendency continue. The fear and greed index is 34. Fear dominates the market. In the Solana ecosystem, Volmex Finance introduced the first implicit volatility index for Solana’s SOL token. The crypto derivatives protocol unveiled its new innovation on Tuesday as a way to measure expected price fluctuations in terms of market capitalization. For traders, this new index, called the Solana Volatility Implied Volatility Index (SVIV), will be used to evaluate and interact with the market. Looking at the chart, SOL seems to have received support from the base level of the 133.51 – 127.17 band. If it breaks this band, the declines may deepen. SOL, which has been accumulating in a certain band since April, may test the support levels of 121.20 – 118.07 if the declines continue. If the pessimism in the market decreases, 133.51 – 137.77 resistances should be followed.
Supports 121.20 – 118.07 – 114.07
Resistances 133.51 – 137.77 – 147.40
ADA/USDT
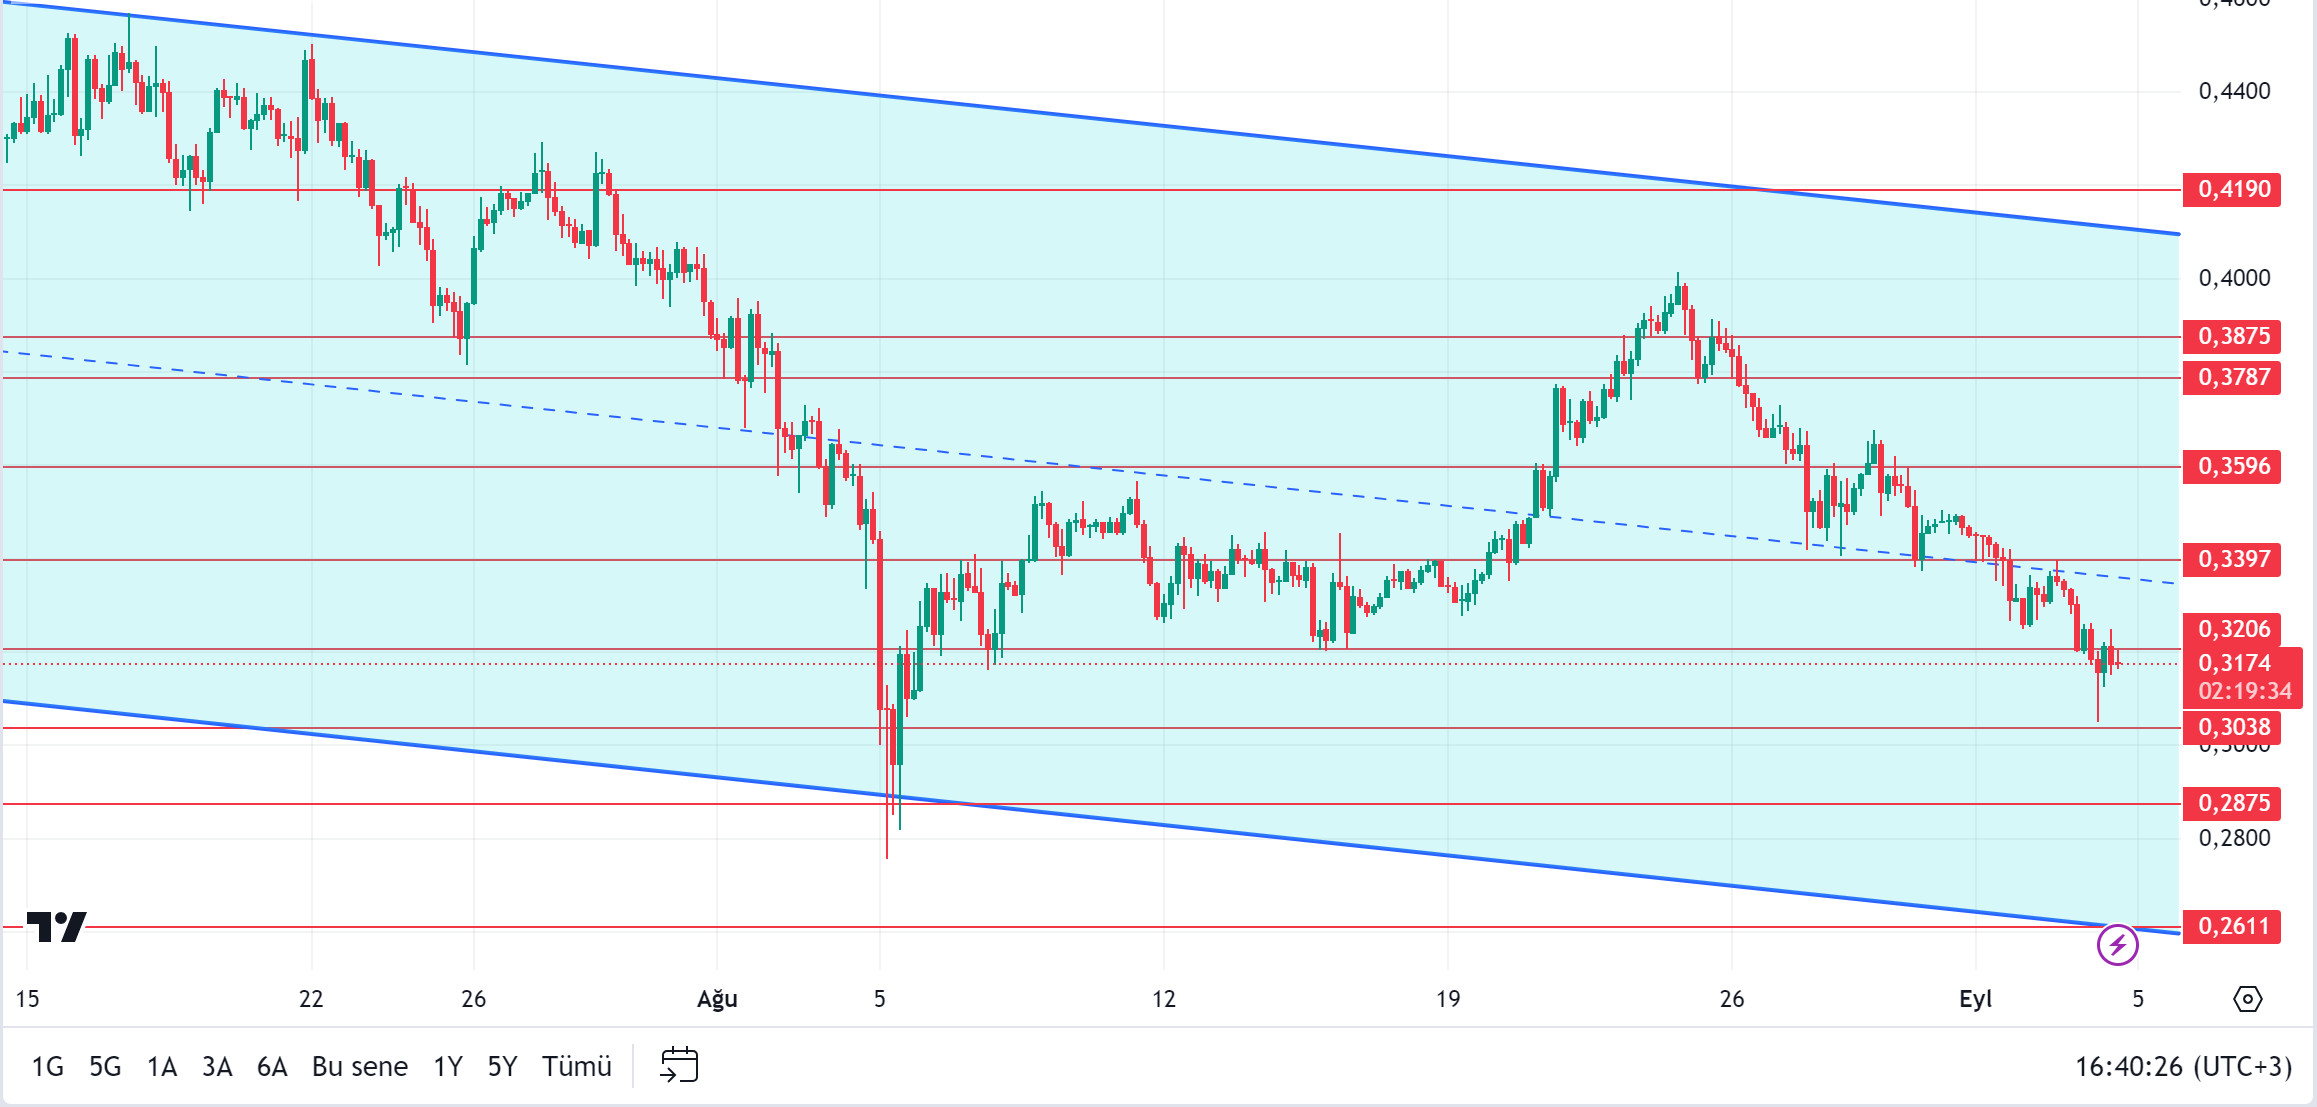
The Japanese stock market started the day with a very serious decline. For this reason, a pessimistic mood dominates the market. In the Cardano ecosystem, BTC developer Adam Back joined BTC fans attacking Cardano, claiming that ADA could fall another 90%. The reactions angered BTC fans after Charles Hoskinson claimed that Bitcoin had lost its way and was more of a religion than an ecosystem. Is attacking BTC a strategy of the Cardano founder? Eyes turned to the statements to be made by the Cardano founder. When we look at the chart of ADA, it is priced at 0.3174 in the descending channel. Despite the expectation of the incoming update, the news from Japan has made it difficult for ADA’s rise to continue. In case of deepening, 0.3038 – 0.2875 levels can be followed as support levels. If investors assume that investors are testing the bottom levels by relying on the innovations brought by the update and start buying, 0.3206 – 0.3038 levels can be followed as support if it continues to be priced by rising in the descending channel.
Supports 0.3038 – 0.2875 – 0.2611
Resistances 0.3206 – 0.3397 – 0.3596
AVAX/USDT
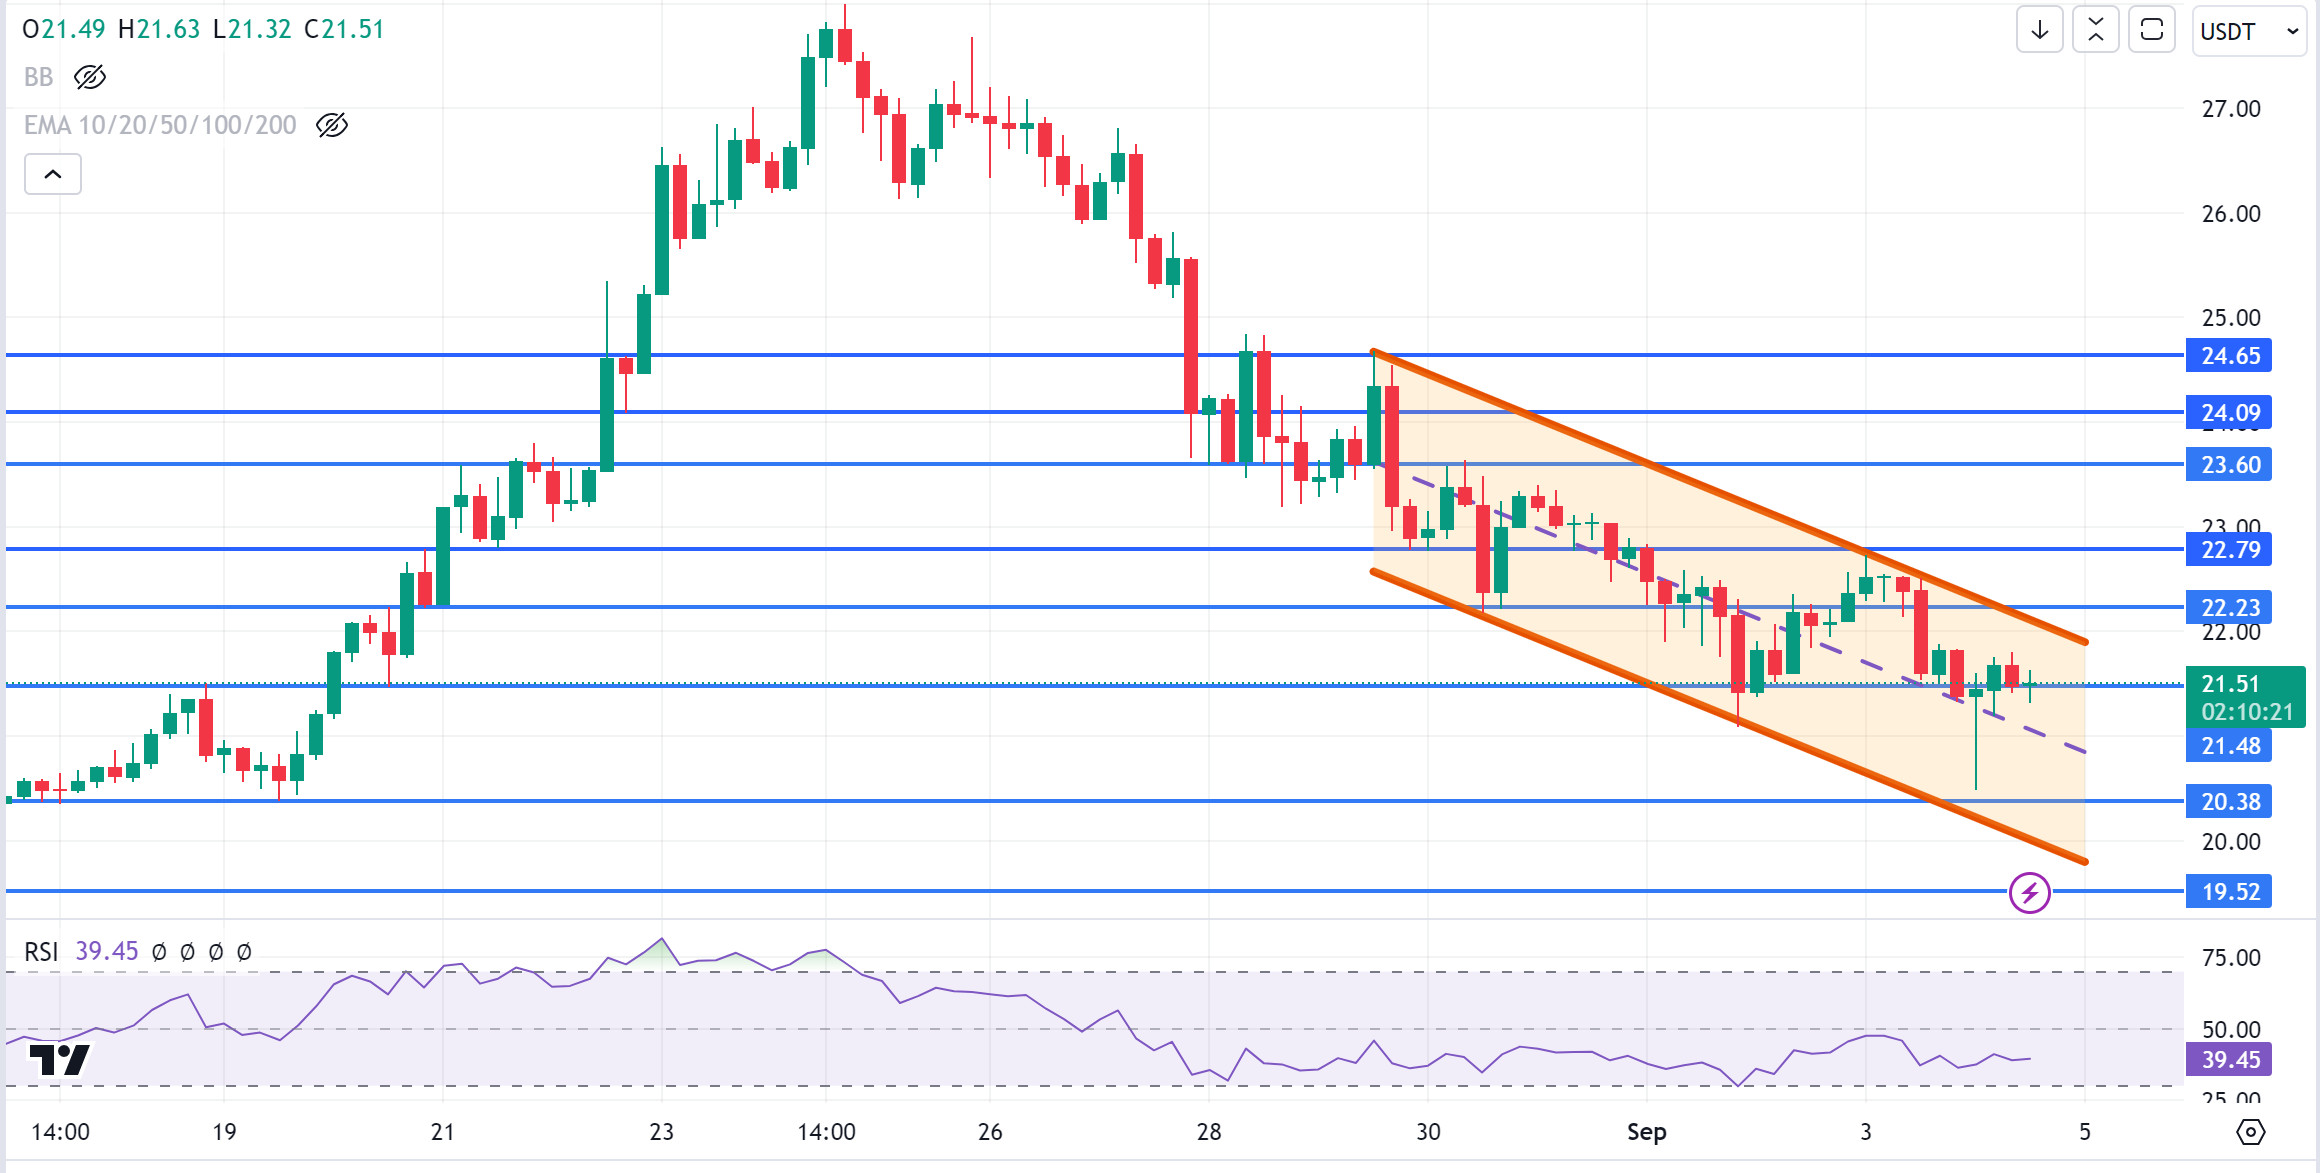
AVAX, which opened today at 21.38, is currently trading at 21.51, although it has experienced a decline parallel to the market during the day with the statement of the head of the central bank of Japan that we may raise interest rates.
It continues to move within the falling channel and is declining towards the middle band of the channel on the 4-hour chart. It is currently trying to break the 21.48 support and if the candle closes below this support, the decline may continue. In such a case, it may test 20.38 support. If it fails to break 21.48 support and there is a buying reaction, it may test 22.23 resistance. As long as it stays above 20.38 support during the day, we can expect it to maintain its desire to rise. With the break of 20.38 support, sales may deepen.
Supports 21.48 – 20.38 – 19.52
Resistances 22.23 – 22.79 – 23.60
TRX/USDT
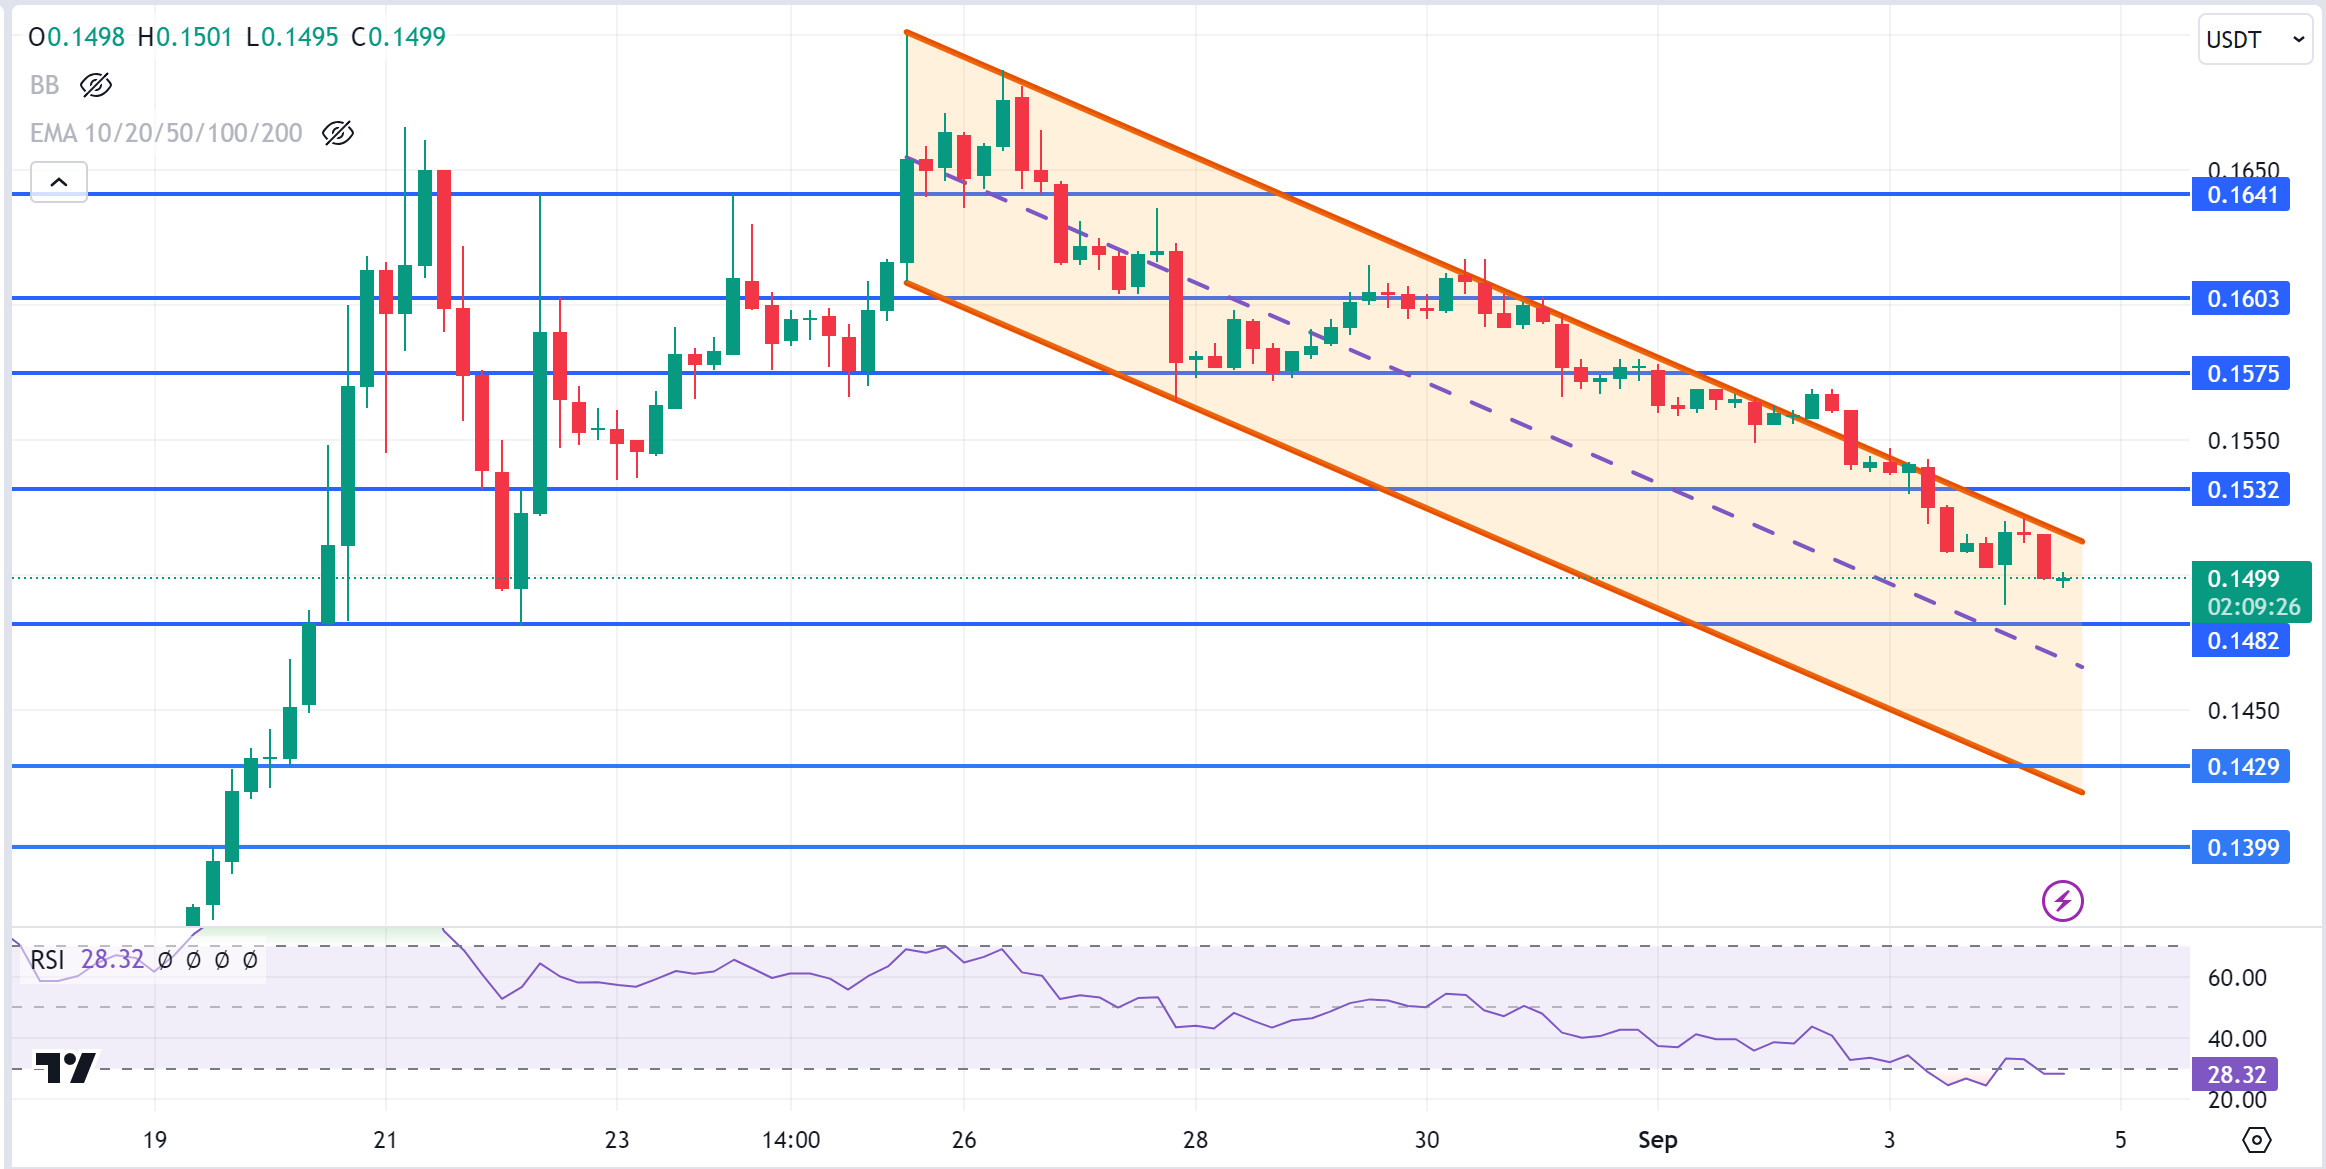
TRX, which started today at 0.1504, fell after the statements of the governor of the central bank of Japan, but is currently trading at 0.1499 with some recovery. It continues its movement towards the middle band with the sales reaction from the upper band of the falling channel. On the 4-hour chart, RSI is in the oversold zone with 28 and a buying reaction can be expected from this zone. In such a case, it may test the 0.1532 resistance. If it breaks the 0.1482 support during the day and moves towards the lower band of the channel, it may test the 0.1429 and 0.1399 supports. As long as TRX stays above 0.1482 support, it can be expected to continue its upward demand. If this support is broken downwards, selling pressure may increase.
Supports 0.1482 – 0.1429 – 0.1399
Resistances 0.1532 – 0.1575 – 0.1603
XRP/USDT
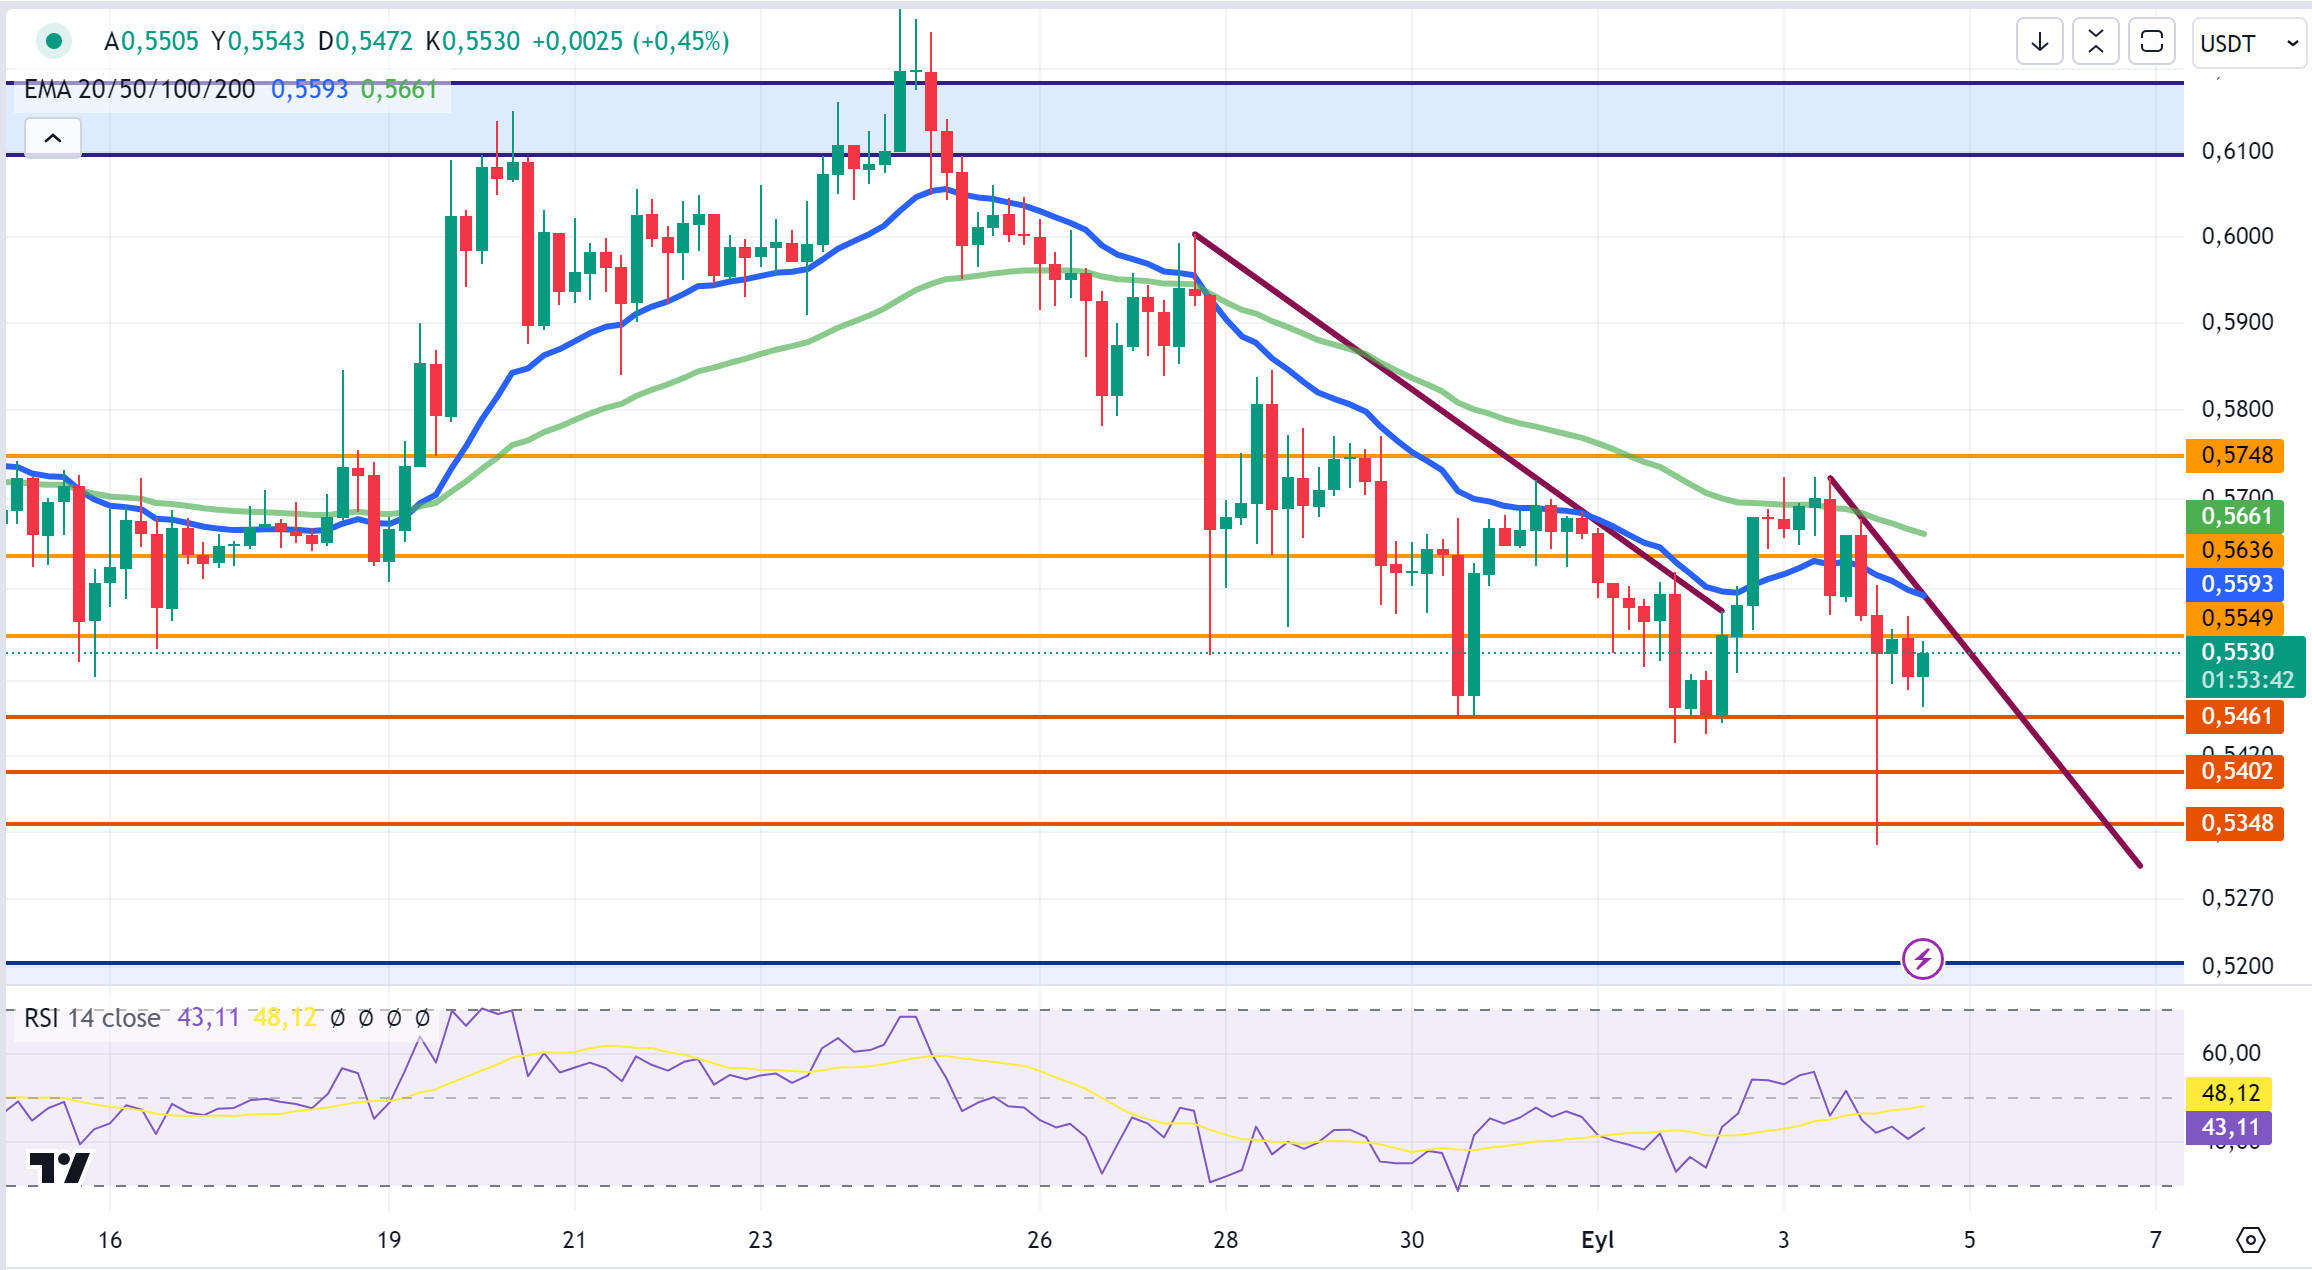
In the 4-hour analysis in the crypto market, XRP rose to 0.55 with a recovery after falling to 0.5326 with a sharp decline in the opening candle today due to the effect of Japanese stock markets. XRP, which fell by failing to break the 0.5549 resistance level after testing the 0.5549 resistance level today, is currently trading at 0.5530.
In the 4-hour analysis, while continuing its horizontal movement between the 0.5461 support level and the 0.5549 resistance level today, in case of a bullish situation, it may test the 0.5636-0.5748 resistance levels in the scenario that it continues to rise if it retests and breaks the 0.5549 resistance level it tested today. Otherwise, as in the crypto market in general, XRP may test the 0.5461-0.5402-0.5348 support levels with the continuation and deepening of the decline in the downtrend.
With the recovery after the sharp decline, XRP rises again to the 0.55-0.58 horizontal band and continues to move within this band, while it may offer long trading opportunities if it rises with the reaction that may come at the 0.55 level, and short trading opportunities if it declines with the reaction that may come at the 0.58 level after its rise.
Supports 0.5461 – 0.5402 – 0.5348
Resistances 0.5549 – 0.5636 – 0.5748
DOGE/USDT
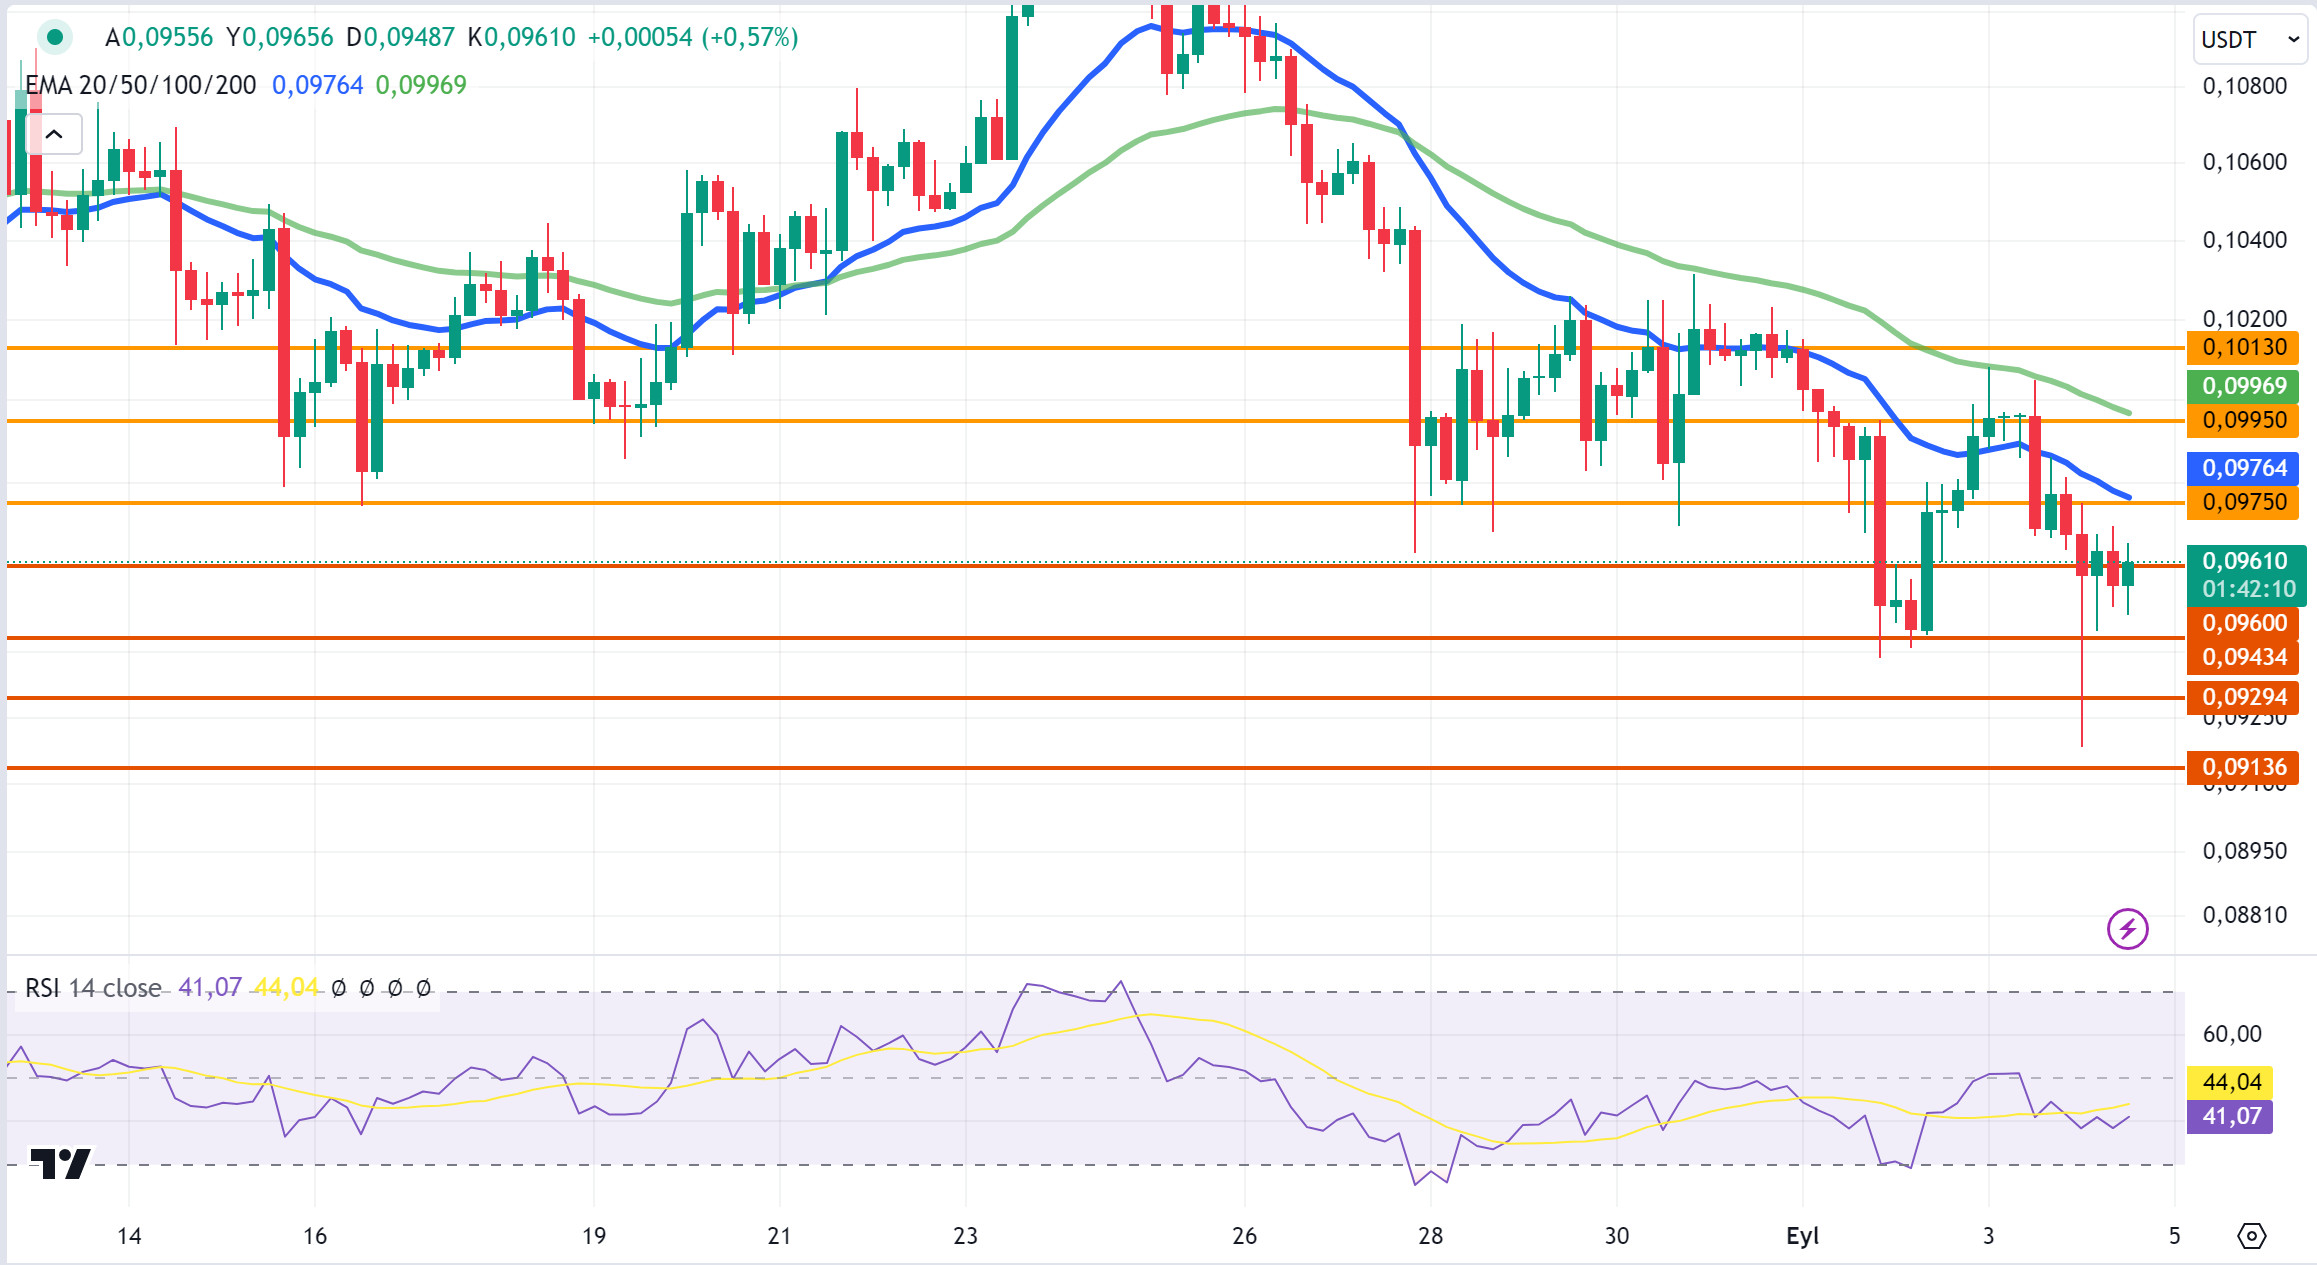
Affected by the sharp decline in the crypto market, DOGE fell as low as 0.0918, then recovered and rose to 0.0950-0.0960. Currently, DOGE continues to trade at 0.0961.
DOGE, which is in a downtrend in the crypto market, where low demand, high volatility and sharp declines and rises are seen, may test support levels of 0.0960-0.0943-0.0929 if the decline continues. If the recovery and uptrend seen after the sharp decline today continues, DOGE may test the resistance levels of 0.0975-0.0995-0.1013.
Supports 0.0960 – 0.0943 – 0.0929
Resistances 0.0975 – 0.0995 – 0.1013
DOT/USDT
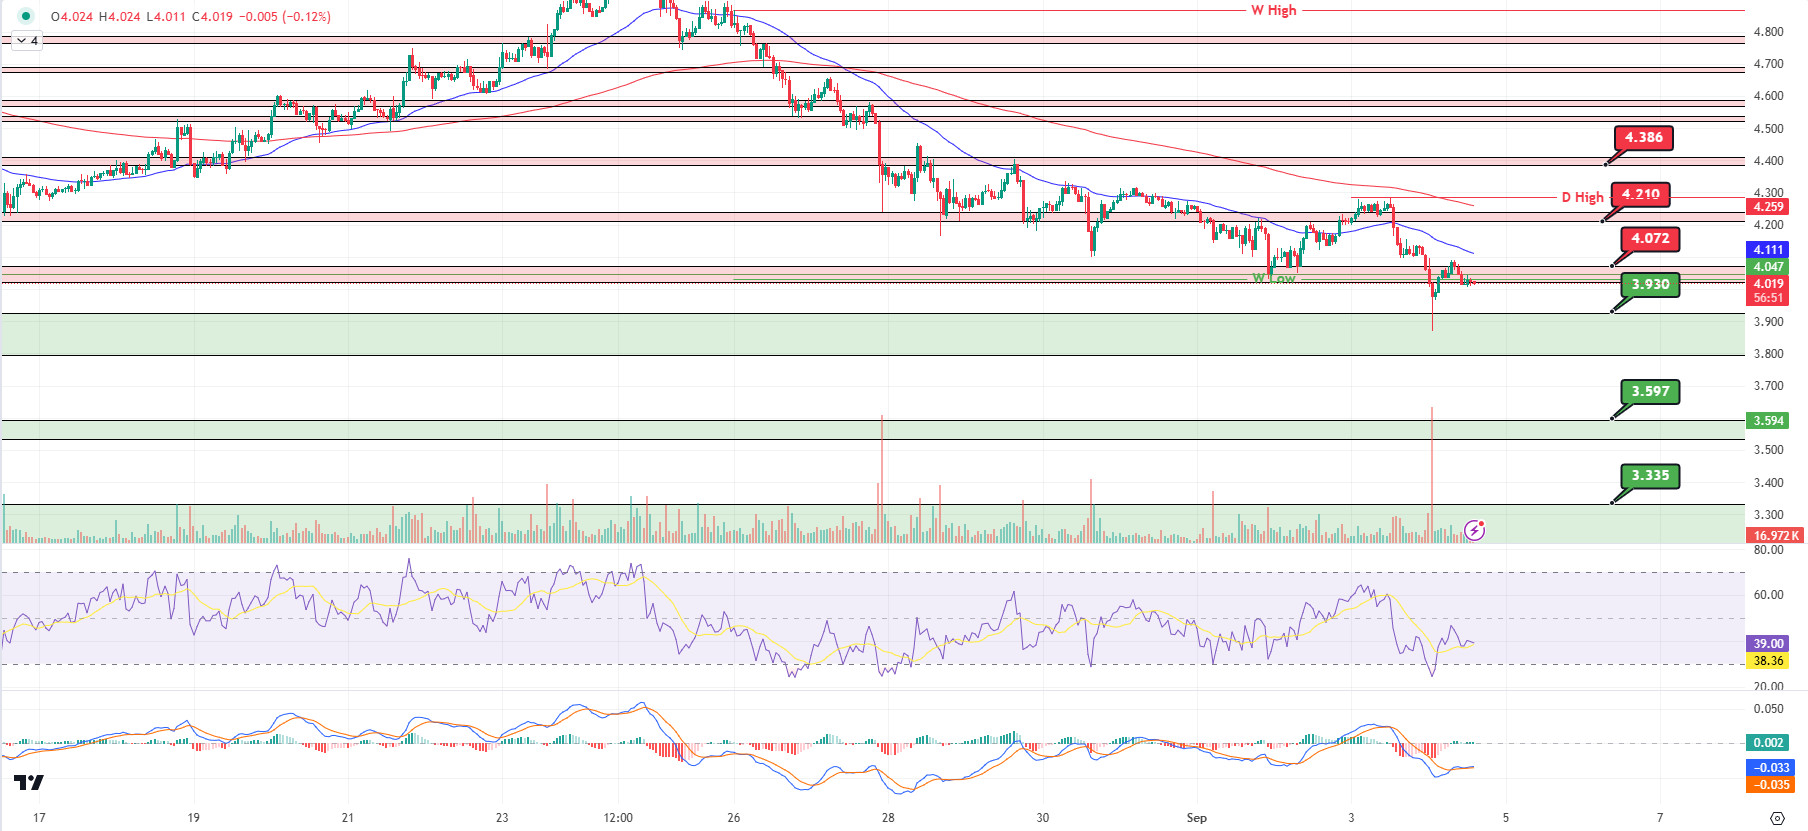
Selling pressure continues on the Polkadot (DOT) chart. The price retreated to the resistance level of 4,072 with increased selling pressure. In the negative scenario, the price may fall to the first support level of 3,930. In the positive scenario, we may see a movement to the next resistance level of 4,210 band if the price provides persistence after breaking the 4,072-resistance upwards.
(Blue line: EMA50, Red line: EMA200)
Supports 3.930 – 3.597 – 3.335
Resistances 4.072 – 4.210 – 4.386
SHIB/USDT
The Shiba Inu community is celebrating the birthday of their leader Shytoshi Kusama. The community is also coming together to increase the visibility of SHIB and BONE tokens, creating a promising collaborative environment for future developments. Kusama’s enigmatic personality and the community’s commitment to him continue to shape the dynamic and innovative future of the SHIB ecosystem.
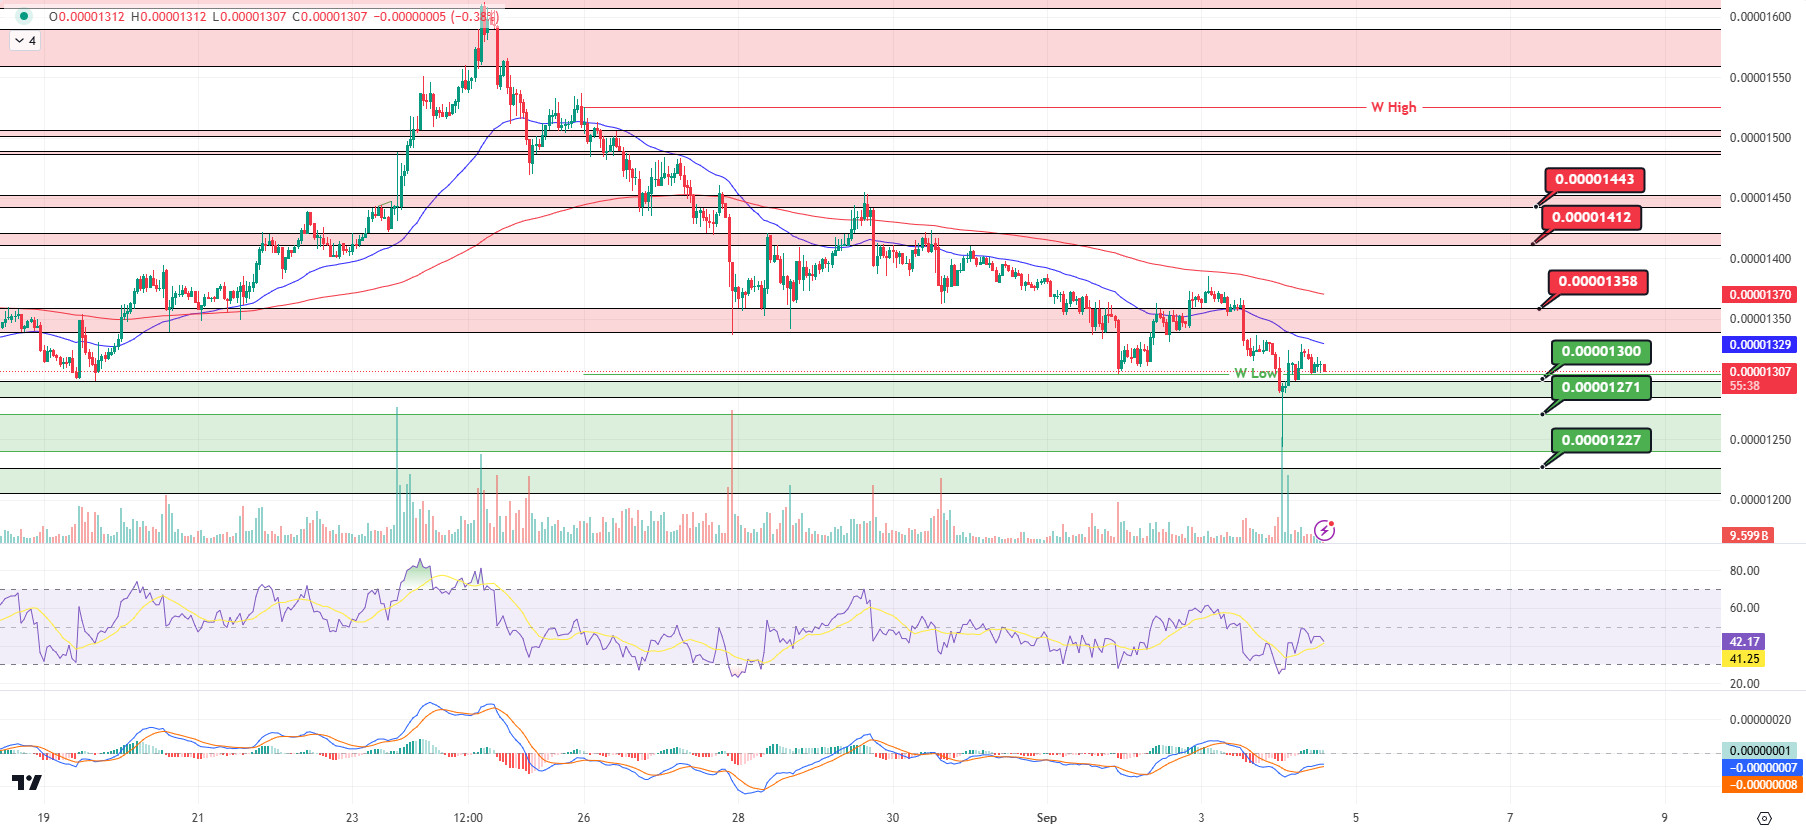
When we examine the Shiba Inu (SHIB) chart, we can say that the price is flat. When we examine the MACD, we can see that the buyer pressure is decreasing. Based on this situation, if the price breaks down the first support level of 0.00001300, we can see a movement towards the second support level of 0.00001271. In the positive scenario, if the price closes the candle above the EMA50 with the reaction from the 0.00001300 level, its next target may be the 0.00001358 resistance.
(Blue line: EMA50, Red line: EMA200)
Supports 0.00001300 – 0.00001271 – 0.00001227
Resistances 0.00001358 – 0.00001412 – 0.00001443
LEGAL NOTICE
The investment information, comments and recommendations contained herein do not constitute investment advice. Investment advisory services are provided by authorized institutions on a personalized basis, taking into account the risk and return preferences of individuals. The comments and recommendations contained herein are of a general nature. These recommendations may not be suitable for your financial situation and risk and return preferences. Therefore, making an investment decision based solely on the information contained herein may not produce results in line with your expectations.


