
MARKET SUMMARY
Latest Situation in Crypto Assets
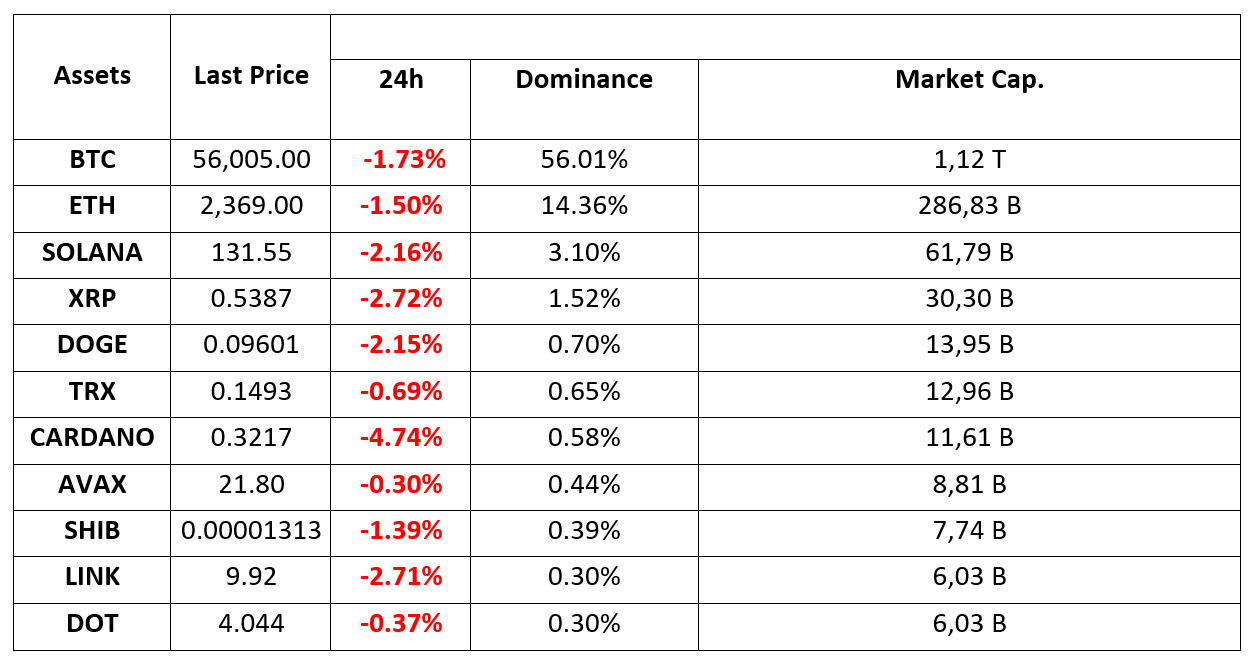
*Prepared on 6.09.2024 at 14:00 (UTC)
WHAT’S LEFT BEHIND
Macroeconomic Data Announced in the US
Although the unemployment rate data in the US was announced in line with expectations, the fact that the Non-Farm Payrolls data came in below expectations positively affected the leading cryptocurrency Bitcoin (BTC).
Non-farm payrolls data: Announced 142k – Expected 164k – Previous 114k
Unemployment data: Announced 4.2% – Expected 4.2% – Previous 4.3
FED Interest Rate Cut May Happen, Bitcoin Rises!
Recent developments may have a positive impact on the Bitcoin market, where investors are focusing their attention. The current FED interest rate is in the range of 525-550. At the meeting on September 18, there is a 53% chance of a 50 basis point (BPS) cut and a 47% chance of a 25 BPS cut. This has increased the attention of investors, while the price of Bitcoin has also risen.
Ethereum Founder Vitalik Buterin
Vitalik Buterin said in a recent X post that he has not sold any Ethereum (ETH) since 2018. Stating that he cannot sell for profit, Buterin said that he only sells to support some projects within the Ethereum ecosystem and donate to charities.
HIGHLIGHTS OF THE DAY

INFORMATION
The calendar is based on UTC (Coordinated Universal Time) time zone. The economic calendar content on the relevant page is obtained from reliable news and data providers. The news in the economic calendar content, the date and time of the announcement of the news, possible changes in the previous, expectations and announced figures are made by the data provider institutions. Darkex cannot be held responsible for possible changes that may arise from similar situations.
MARKET COMPASS
The highly anticipated US labor statistics for August were announced today. Non-farm payrolls change (NFP) was below the forecasts with 142K, compared to the expectation of 164K increase. Average hourly earnings rose faster than expected (Previous: 0.2%, Expected: 0.3%, Announced: 0.4%). Although we saw the dollar depreciate immediately after the figures, the dxy recovered all of its losses. Similarly, the probability of a 50 bps rate cut by the US Federal Reserve (FED) in September increased immediately after the data compared to the probability of a 25 bps rate cut, while the probability of a 25 bps rate cut rose above 50%.
The initial post-data outlook for digital assets was bullish. We can interpret this as a preparation of the markets for a possible increase in risk appetite and a reaction to the continuous depreciation in recent days. However, it would be a mistake to say that the rises signal a complete turnaround. The possibility of a 25 basis point rate cut and the DXY index recovering its losses can be considered as a sign for this.
Pricing during and after the close of the US session may clarify the situation that can be monitored over the weekend. For now, we think that the possibility that the recent rise in cryptocurrencies after the data should be limited should be considered.
TECHNICAL ANALYSIS
BTC/USDT
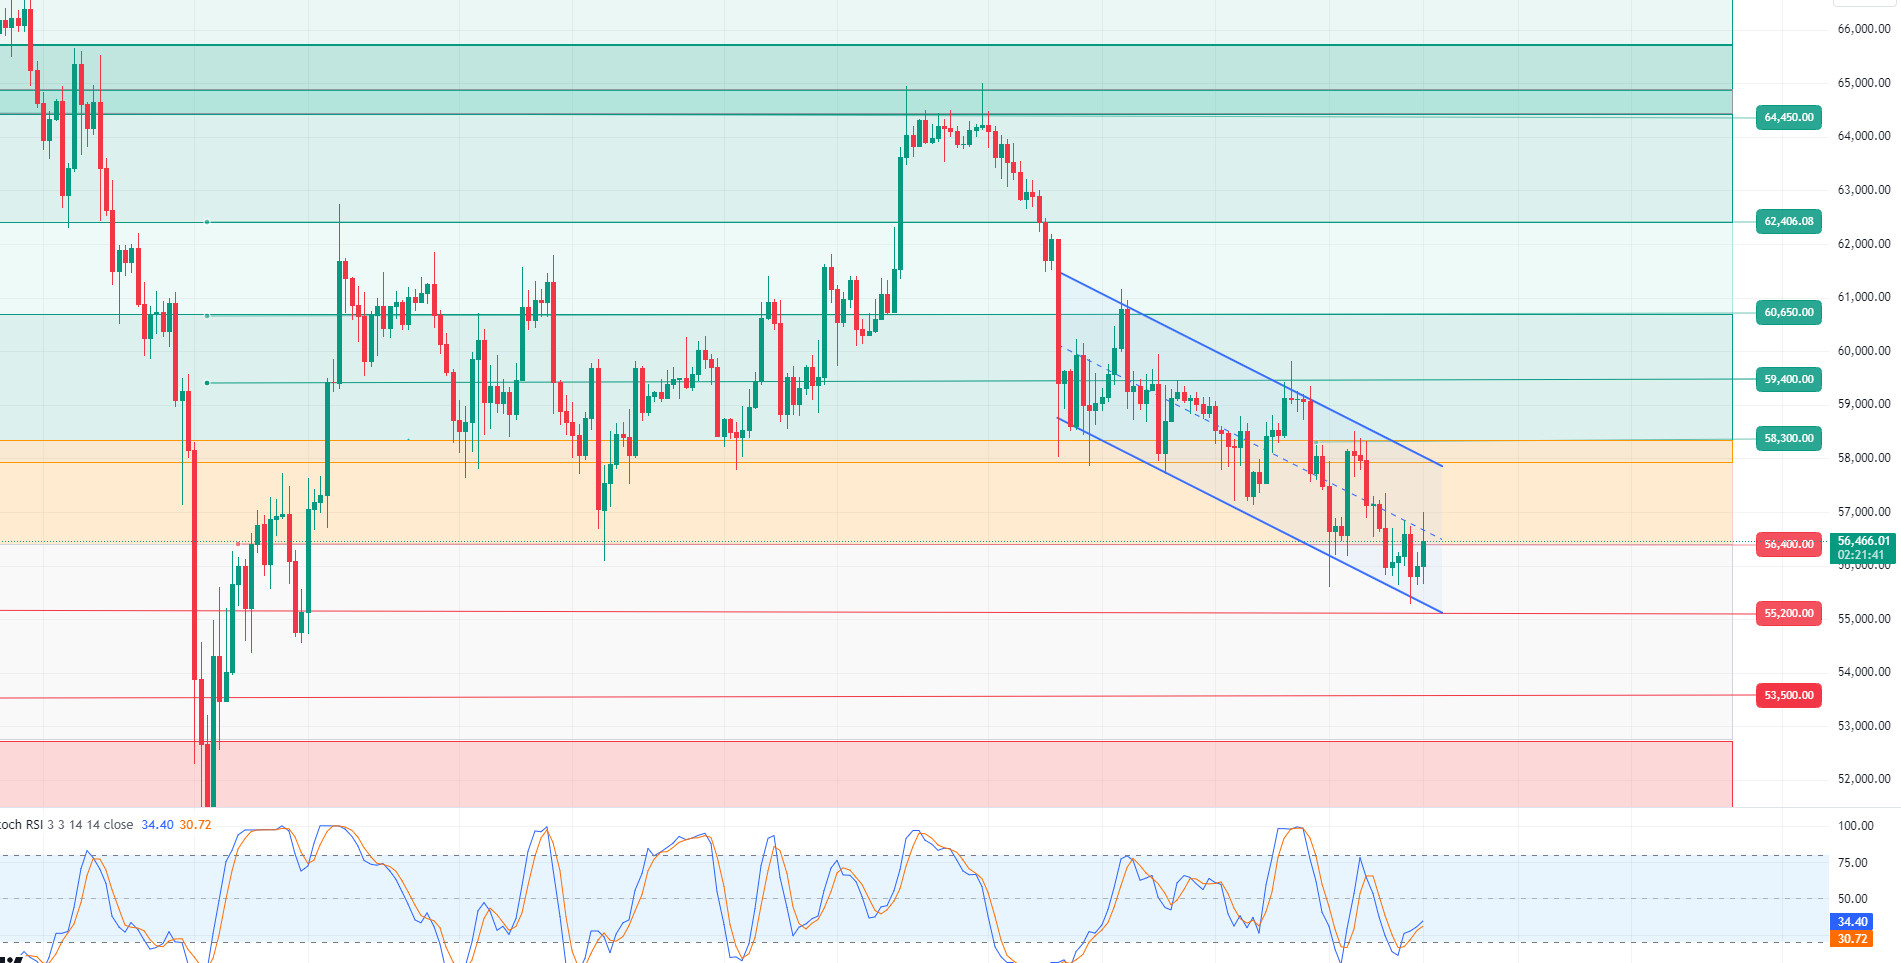
Expectations for a rate cut in Bitcoin are rising! Economic data released in the US was closely followed by the markets. While the unemployment rate was in line with expectations, the Non-Farm Payrolls data remained below expectations. These developments had a positive impact on Bitcoin. Ahead of the US Federal Reserve meeting on September 18, the expectation for an interest rate cut has increased and the probability of a 50 basis point cut is currently estimated at 53%. According to BTC’s 4-hour technical analysis, Bitcoin, which was trading at $55,800 before the news, is on the rise and has now reached $56,500. Persistence at this level may increase with the positive opening of US stock markets and momentum may strengthen upwards. RSI, one of the technical indicators, has turned its direction upwards, leaving the oversold zone. The first resistance level to be encountered in the continuation of the rise is seen as 58,300. On the other hand, in case of a possible pullback as the impact of the news fades, the 56,400 level can be monitored as an important support point.
Supports 56,400 – 55,200 – 53,500
Resistances 57,200 – 58,300 – 59,400
ETH/USDT
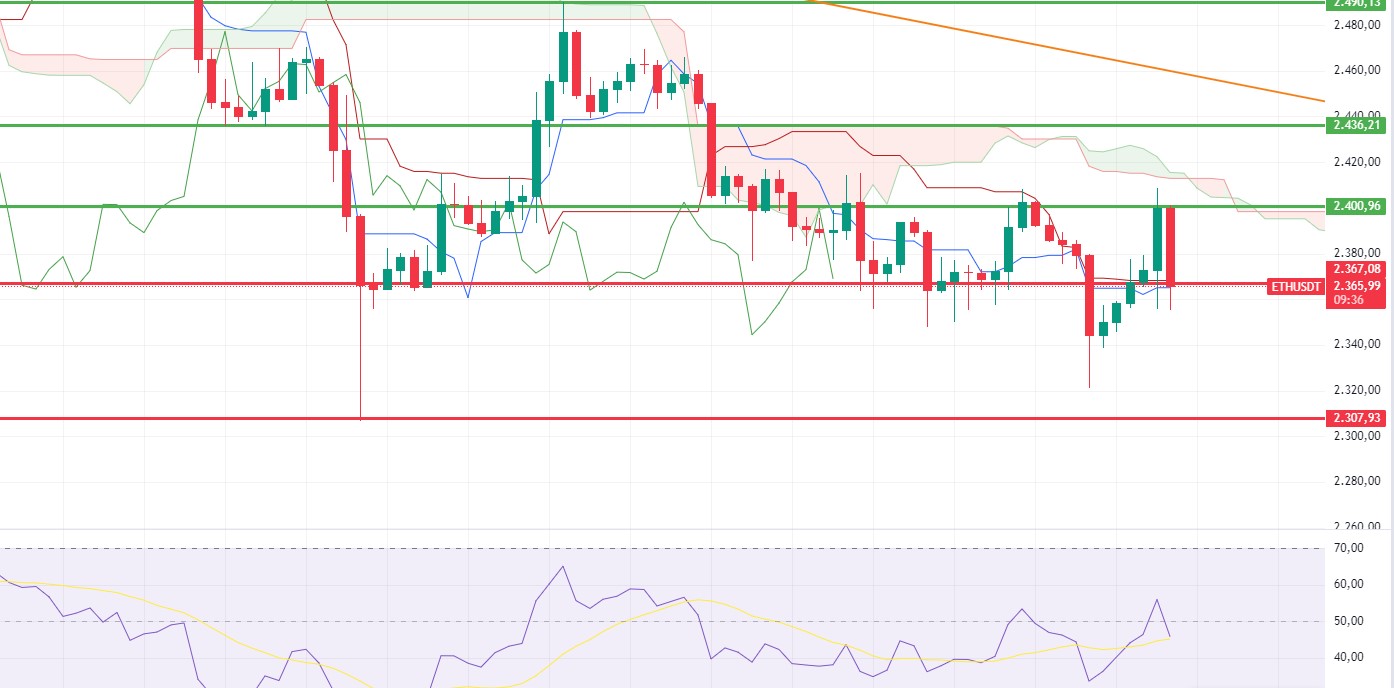
Ethereum, which made another attempt above 2,400, was rejected again and fell into the accumulation zone. Ethereum, which needs closes above 2,400 to break the negative mismatch in RSI, may fall to 2,367 and then 2,311 in closes below this level. Volatility has increased a lot with the non-farm employment data coming worse than expected. For this reason, it is very important to follow the breakdowns in the market before all transactions.
Supports 2,361 – 2,311 – 2,194
Resistances 2,400 – 2,490 – 2,550
LINK/USDT
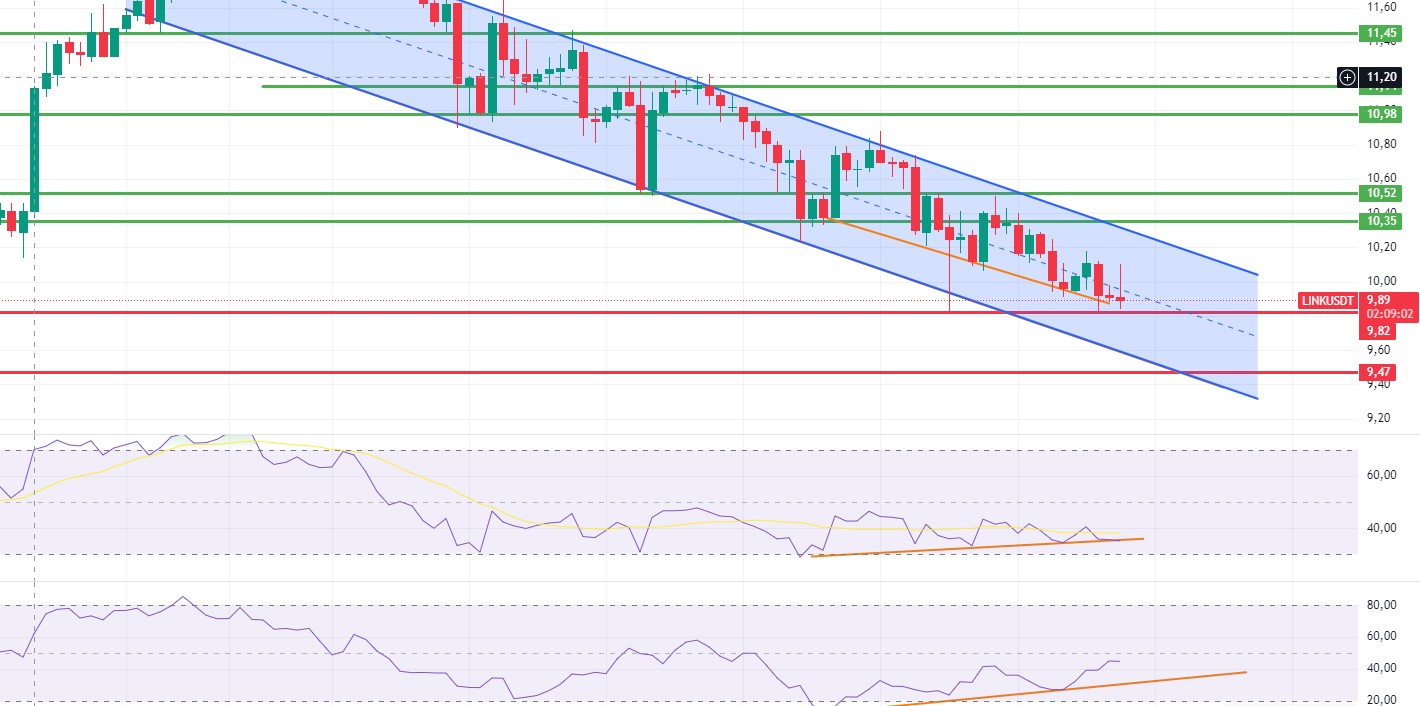
LINK, which continues to move in a falling channel, is struggling to break through the middle band of the channel. However, the beginning of positive structures in both RSI and MFI may indicate that if a possible recovery movement in Ethereum takes place, it will quickly break this downtrend upwards. A break of 9.82 support could deepen the decline.
Supports 9.82 – 9.47 – 8.12
Resistances 10.35 – 10.52 – 10.98
SOL/USDT
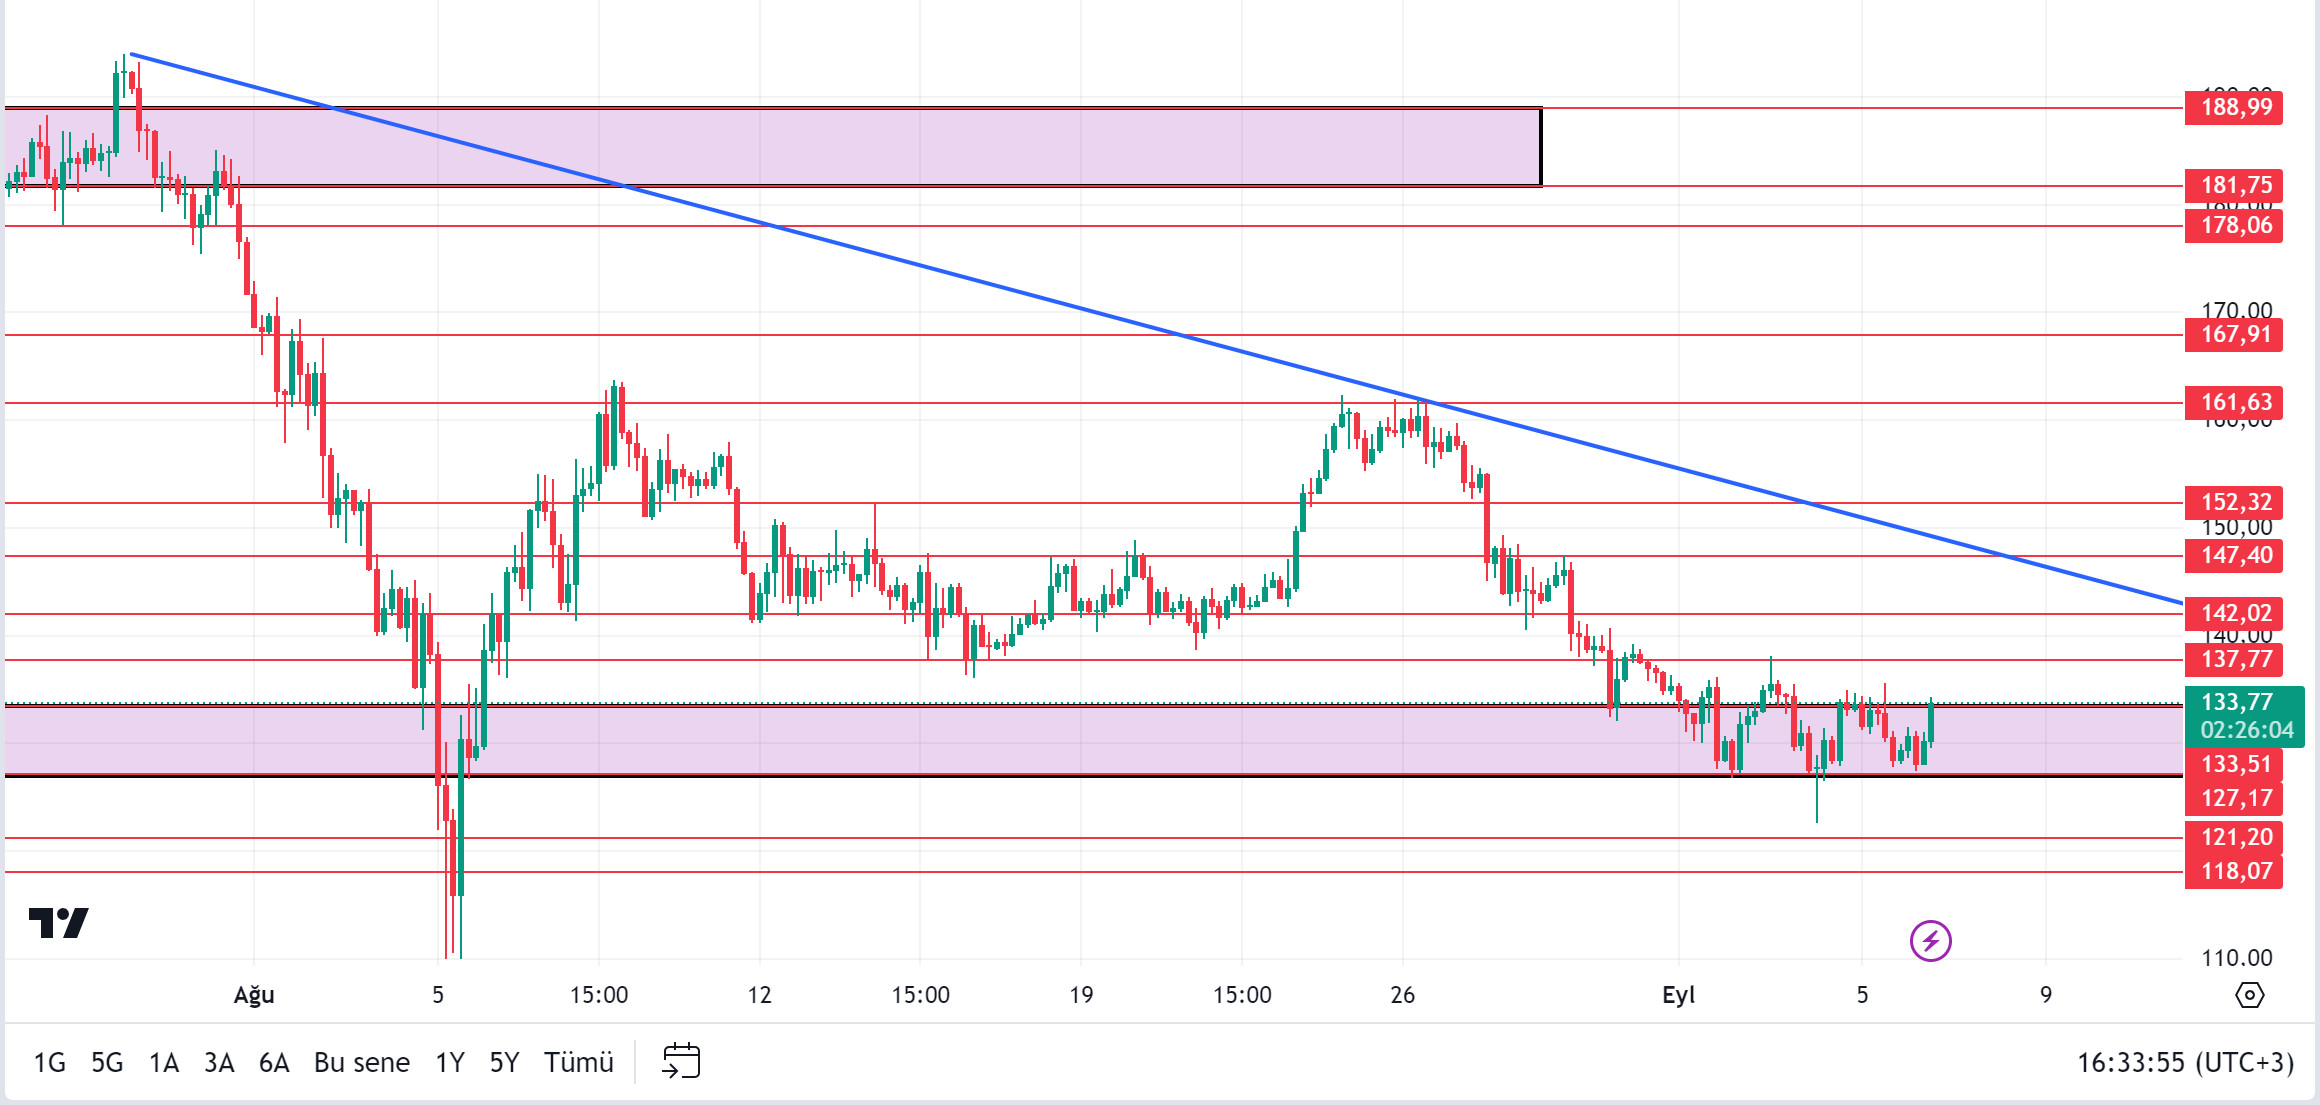
While the unemployment rate from the US came in as expected, the non-farm payrolls data came in below expectations. Thus, the value of the dollar decreased. This has reflected positively on cryptocurrencies. In the time period when the data was announced, the dollar index accelerated downward and fell to 100.5 levels. In the Solana ecosystem, Mercuryo’s spend connects Solana to more than 90 million mastercard users. Mercuryo, a leading Web3 payment provider, has introduced its latest product Spend, a virtual debit card designed to enhance crypto transactions. This virtual debit card will enable Solana wallet users to make payments directly from their digital wallets. This will contribute to increasing the volume in the Solana ecosystem. Technically, SOL has broken the 133.51 – 127.17 band upwards with the news. SOL, which has been accumulating in a certain band since April, may test the resistance levels of 137.77 – 147.40 if the rises continue. In case of profit sales, support levels 133.51 – 127.17 should be followed.
Supports 133.51 – 127.17 – 121.20
Resistances 137.77 – 142.02 – 147.40
ADA/USDT
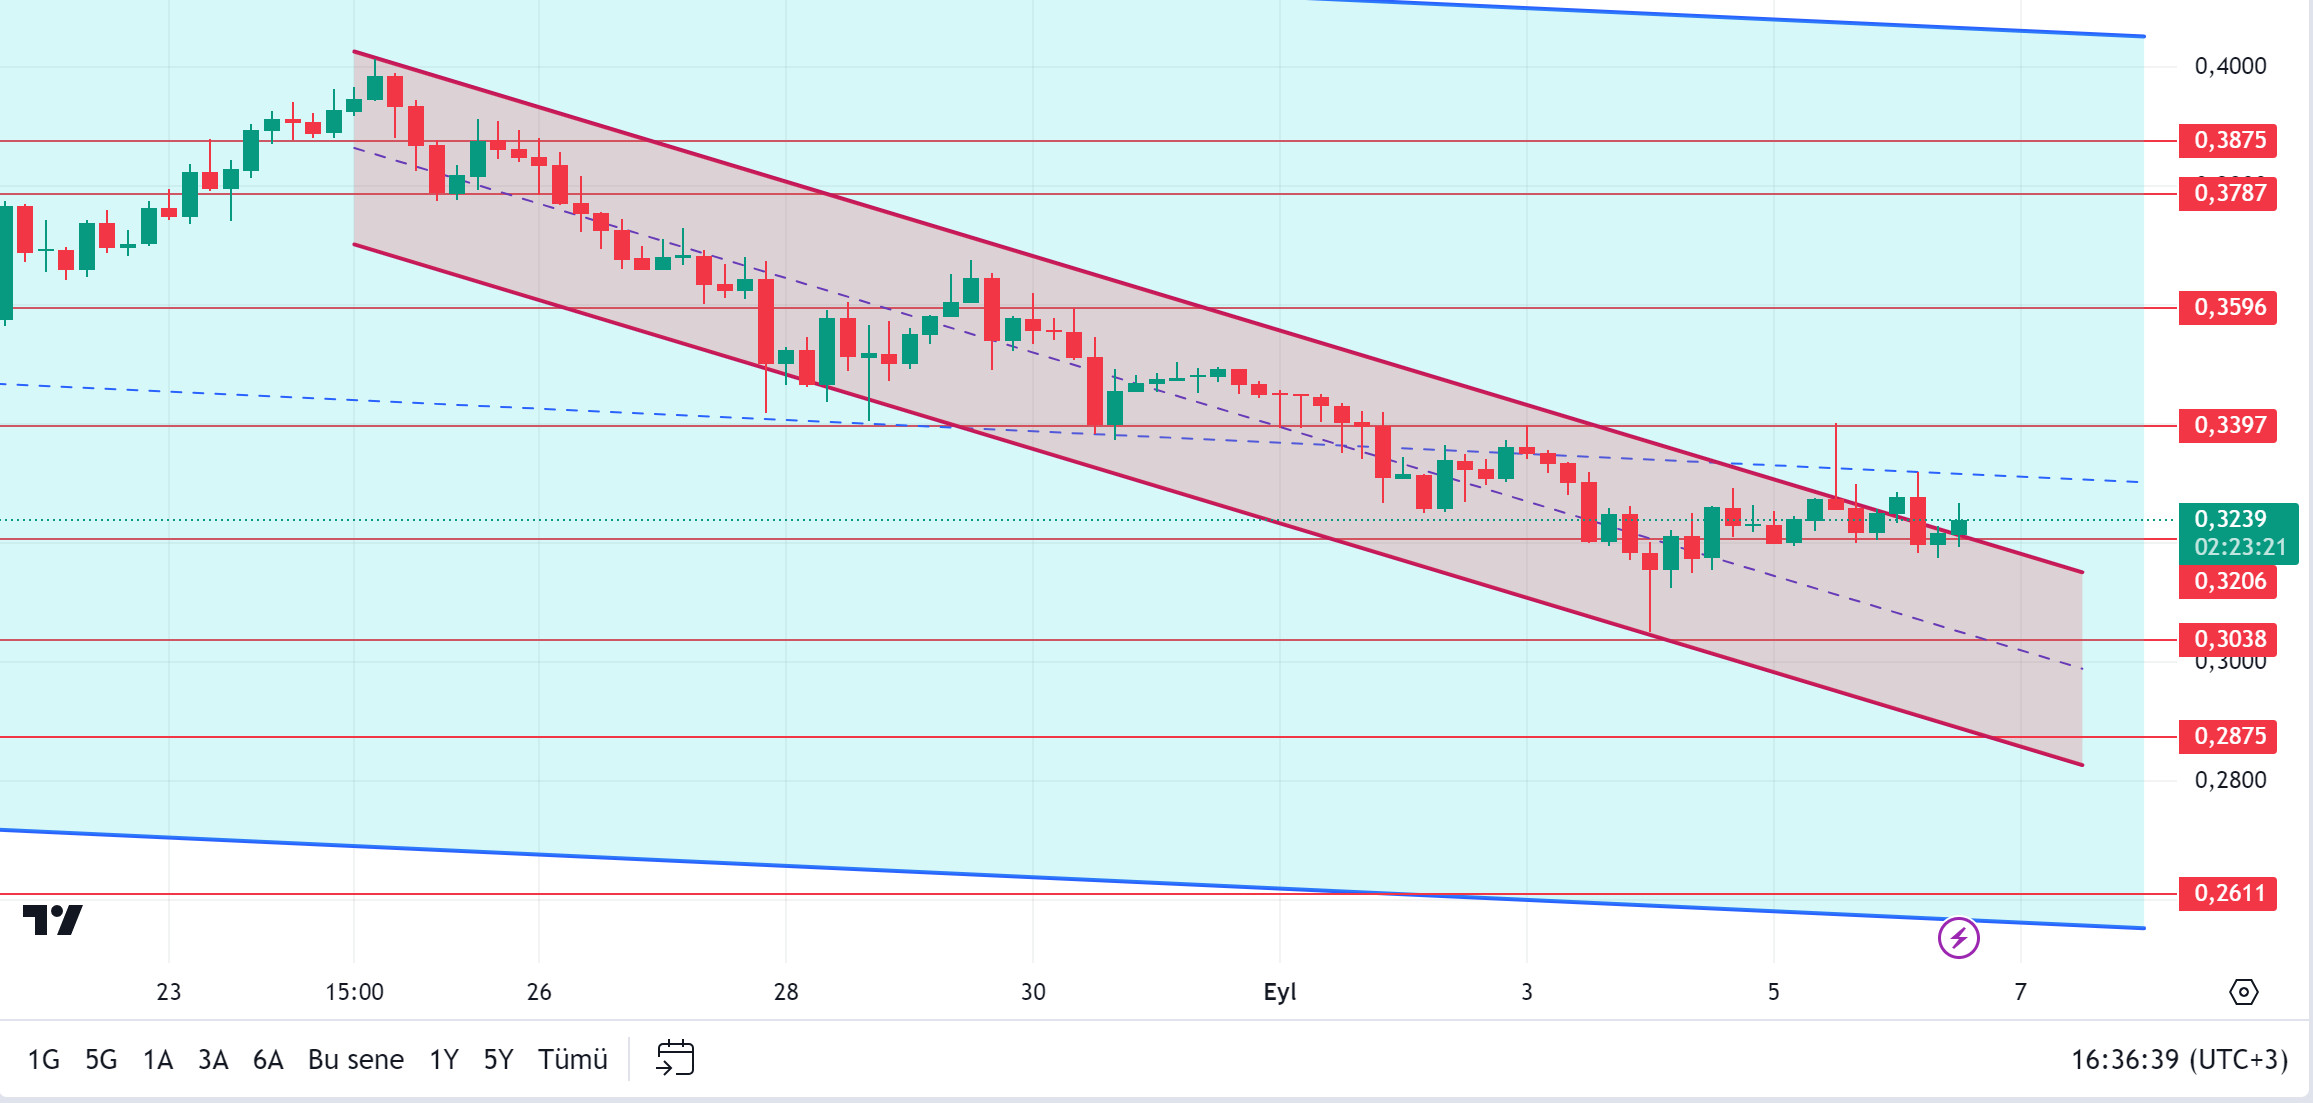
While the unemployment rate from the US came in as expected, the non-farm payrolls data came in below expectations. Thus, the value of the dollar decreased. In the time period when the data was announced, the dollar index accelerated downward and fell to 100.5 levels. However, Fed member Williams’ statement that we are ready for the start of the interest rate cut process caused the crypto coins to rise in general. When we look at the chart of ADA, it has broken the downtrend that started on August 24 upwards. The effects of the incoming update seem to have gradually manifested themselves. ADA, currently priced at 0.3239, may test 0.3397 resistance. If investors continue to price by experiencing a rise due to the innovations brought by the update and the positive data from the US, it will bring the price to 0.3397 – 0.3596 levels. The support place to look for due to retracements can be followed at 0.3206 – 0.3038 levels.
Supports 0.3206 – 0.3038 – 0.2875
Resistances 0.3397 – 0.3596 – 0.3787
AVAX/USDT
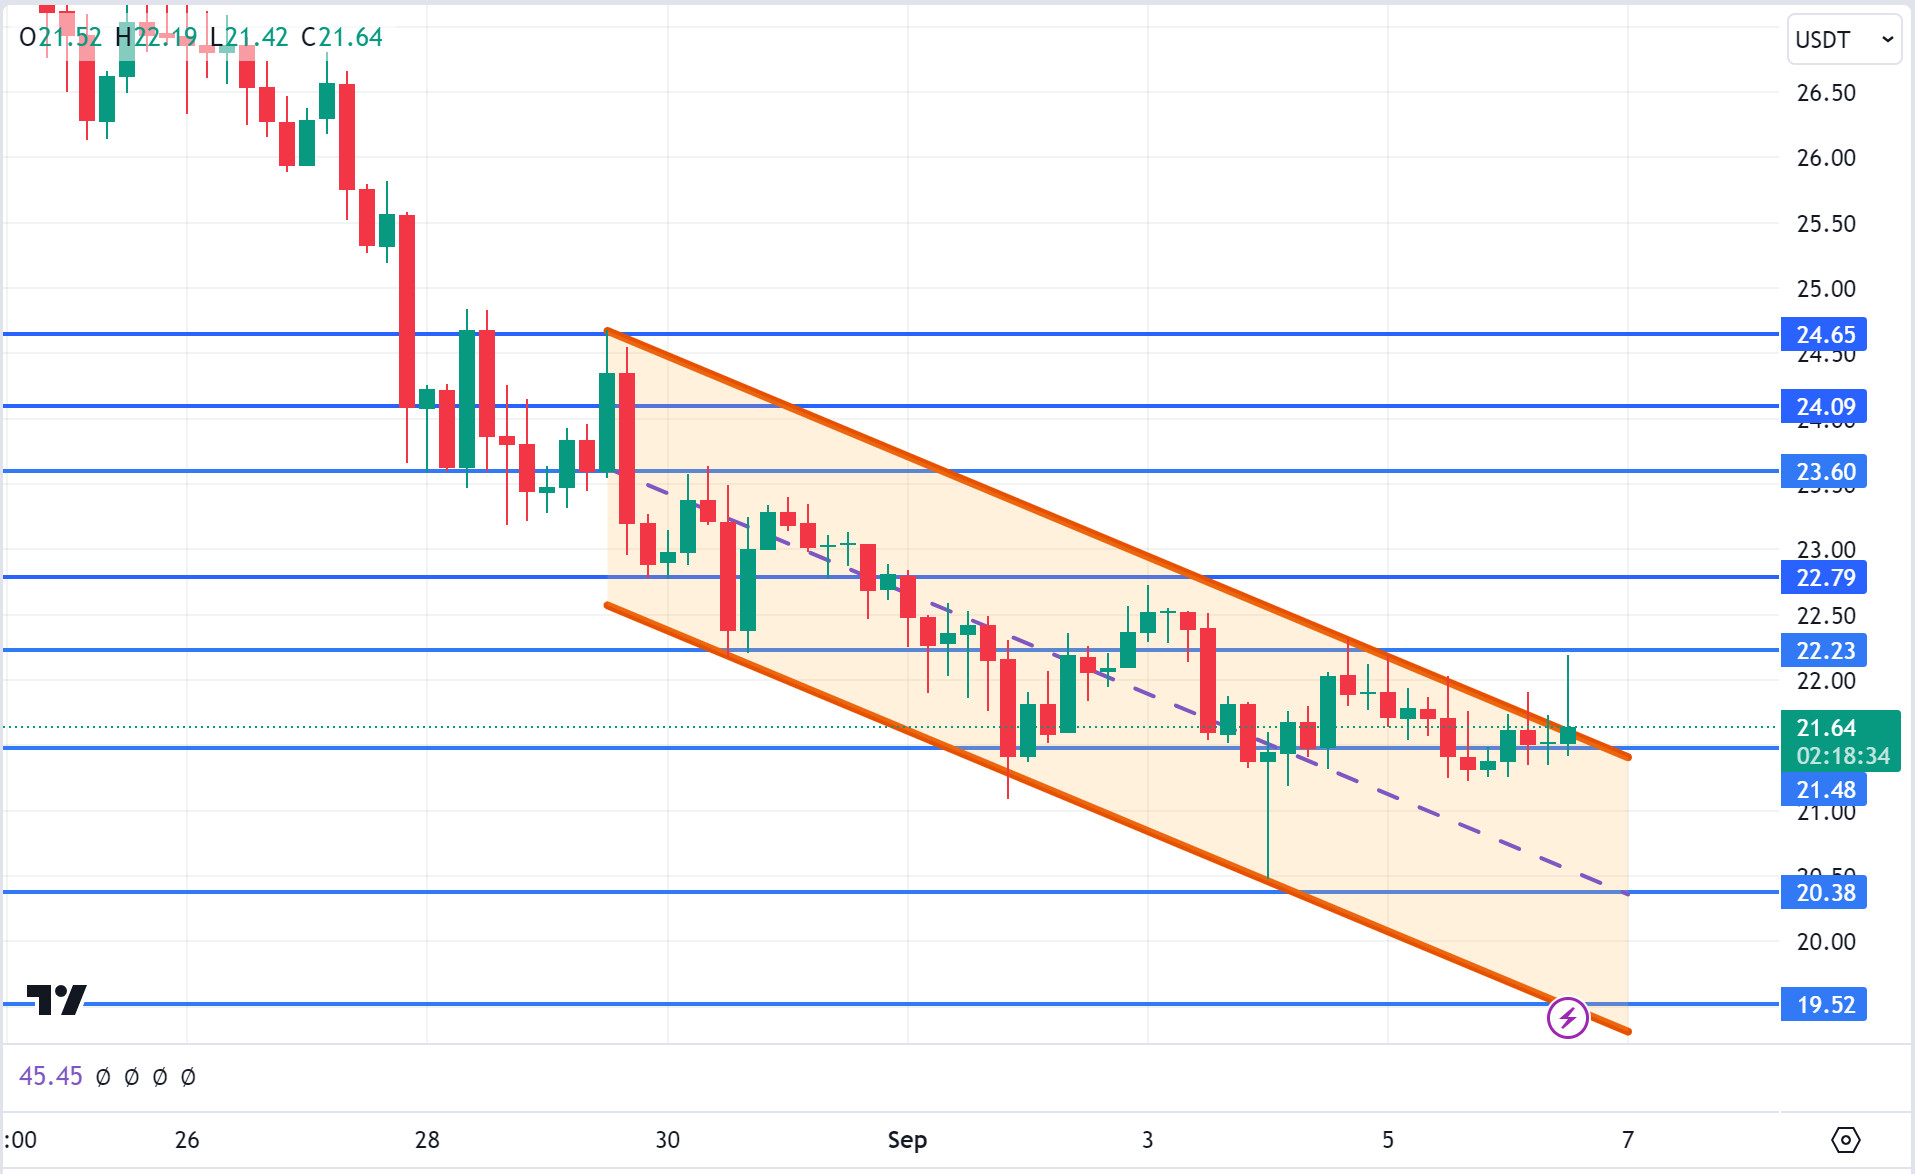
AVAX, which opened today at 21.38, is trading at 21.64 after the data from the US.
Non-farm payrolls and unemployment rate data were released by the US today. The market seems to have priced the data positively at the first stage. AVAX, on the other hand, continues its movement within the falling channel. On the 4-hour chart, it is trying to break the upper band of the channel. If it closes the candle above the 22.23 resistance, it may break the channel upwards and test the 22.79 and 23.60 resistances. If it fails to break 22.23 resistance and a sales reaction comes, it may test 21.48 support. As long as it stays above 20.38 support during the day, we can expect it to maintain its upward demand. With the break of 20.38 support, sales may deepen.
Supports 21.48 – 20.38 – 19.52
Resistances 22.23 – 22.79 – 23.60
TRX/USDT
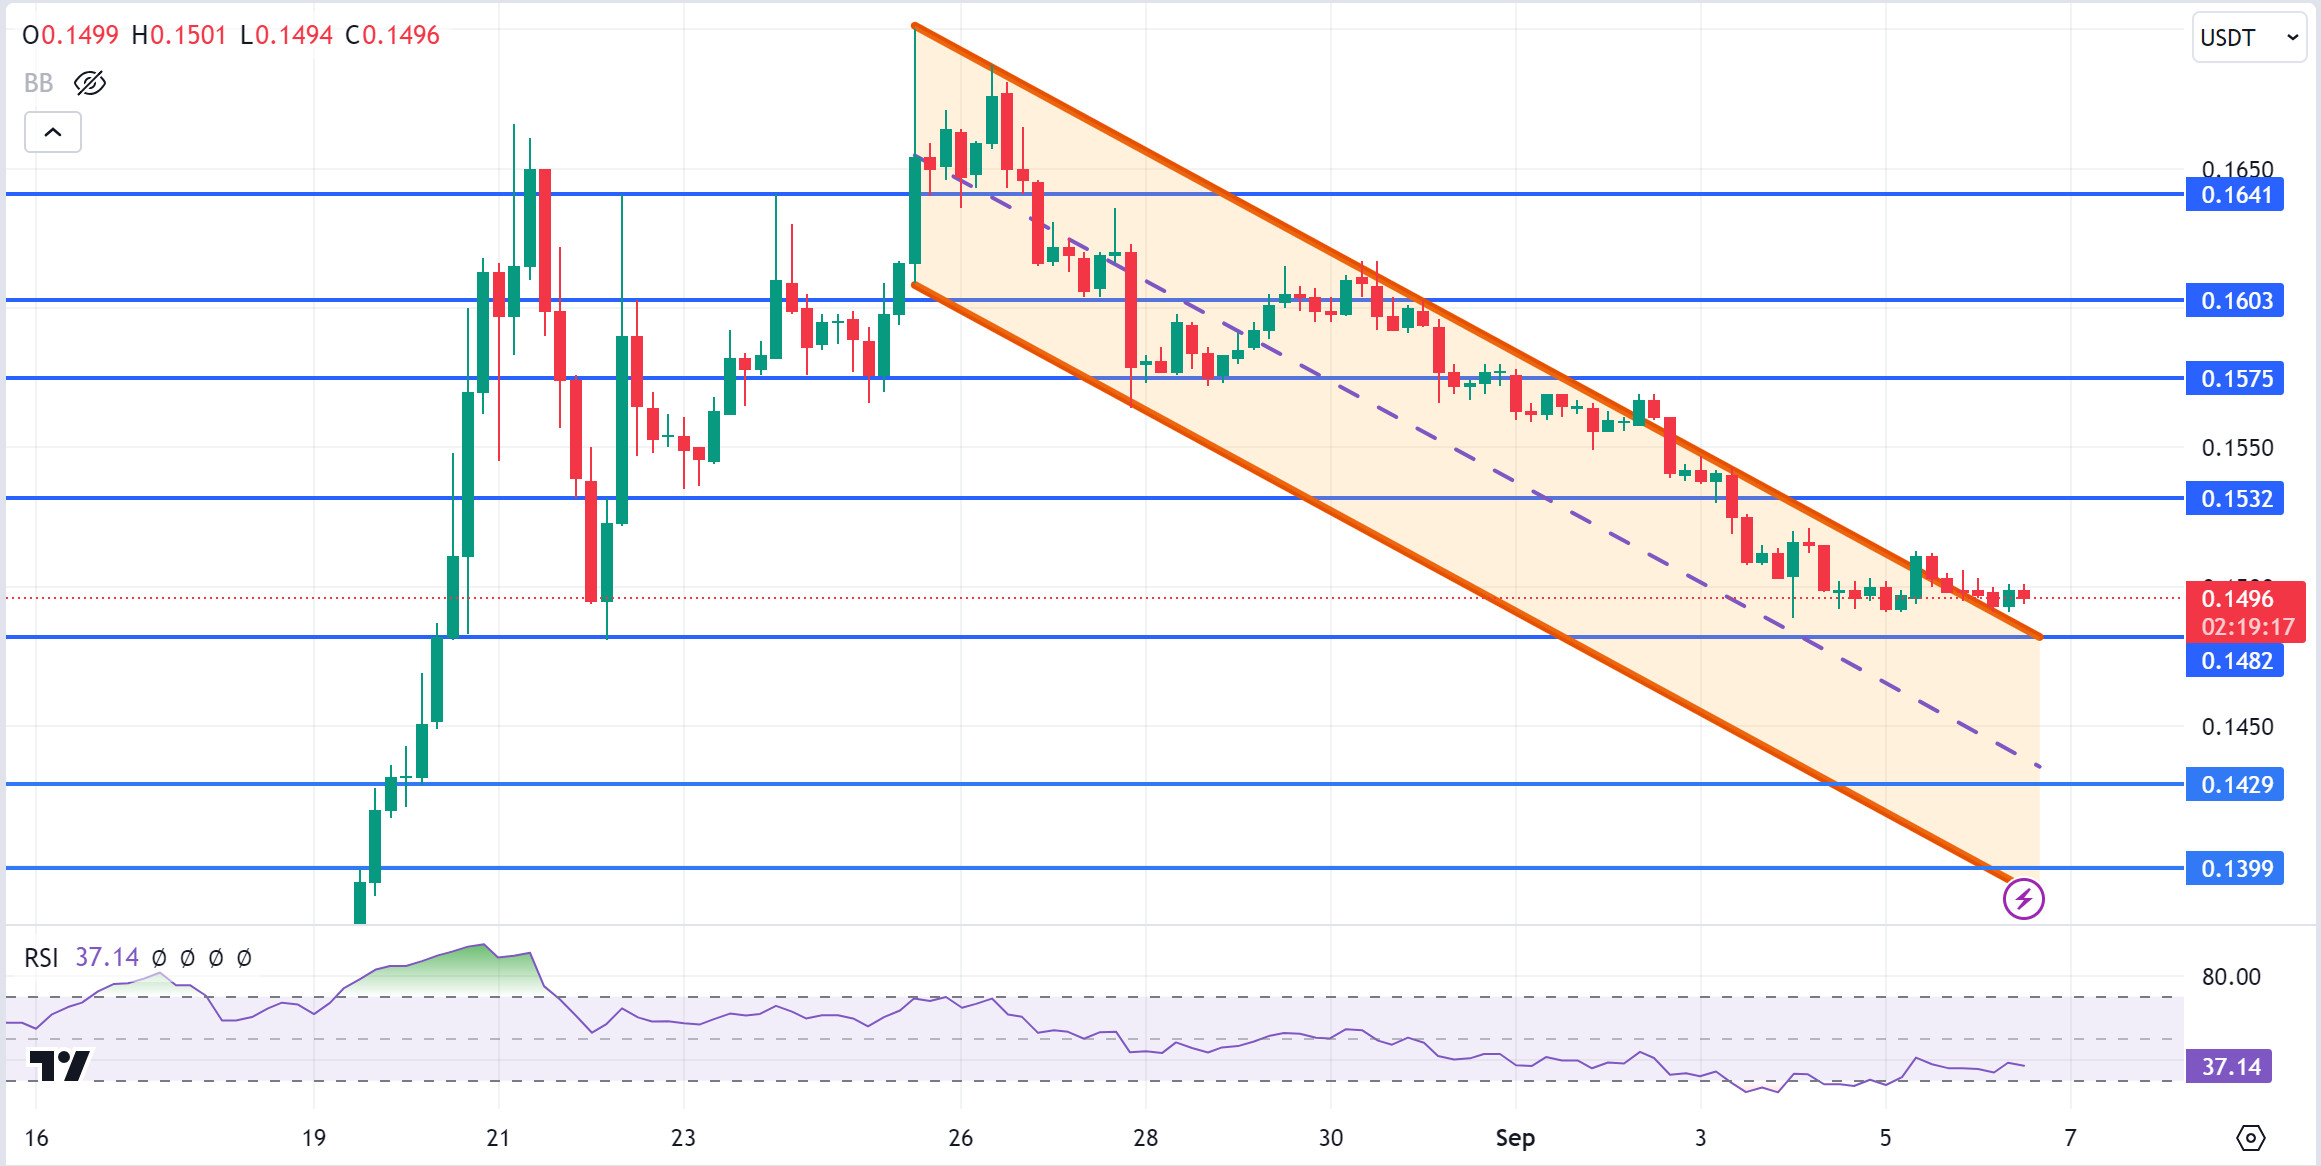
TRX, which started today at 0.1499, is trading at 0.1496 after the non-farm employment and unemployment rate data from the US. It is trying to break the falling channel upwards and for confirmation, we need to see that it closes the candle above 0.1532 resistance. On the 4-hour chart, the RSI is approaching the oversold zone with a value of 36 and a buying reaction can be expected from this zone. In such a case, it may test the 0.1532 resistance. If it cannot break this resistance and a selling reaction comes, it may break the support of 0.1482 and move towards the lower band of the channel. In such a case, it may test 0.1429 and 0.1399 supports. As long as TRX stays above 0.1482 support, it can be expected to continue its upward demand. If this support is broken downwards, selling pressure may increase.
Supports 0.1482 – 0.1429 – 0.1399
Resistances 0.1532 – 0.1575 – 0.1603
XRP/USDT
XRP continued to decline today, falling as low as 0.5322, before rising ahead of the economic data to be released by the US. XRP, which was trading at 0.5381 before the US economic data was released, continued to rise after the data was released, rising to 0.5440, the starting level of the day.
In the 4-hour analysis, XRP, which rose with the reaction after testing the 0.5348 support level 2 times with the decline it experienced during the day, continued to rise after the US data was announced. With the continuation of the XRP rise, if it tests the 0.5461 resistance level and breaks the resistance level in question, it may continue its rise and test the 0.5549-0.5636 resistance levels. Otherwise, it may test the 0.5402-0.5348-0.5253 support levels if it switches to a downtrend with the reaction that may come.
Supports 0.5402 – 0.5348 – 0.5253
Resistances 0.5461 – 0.5549 – 0.5636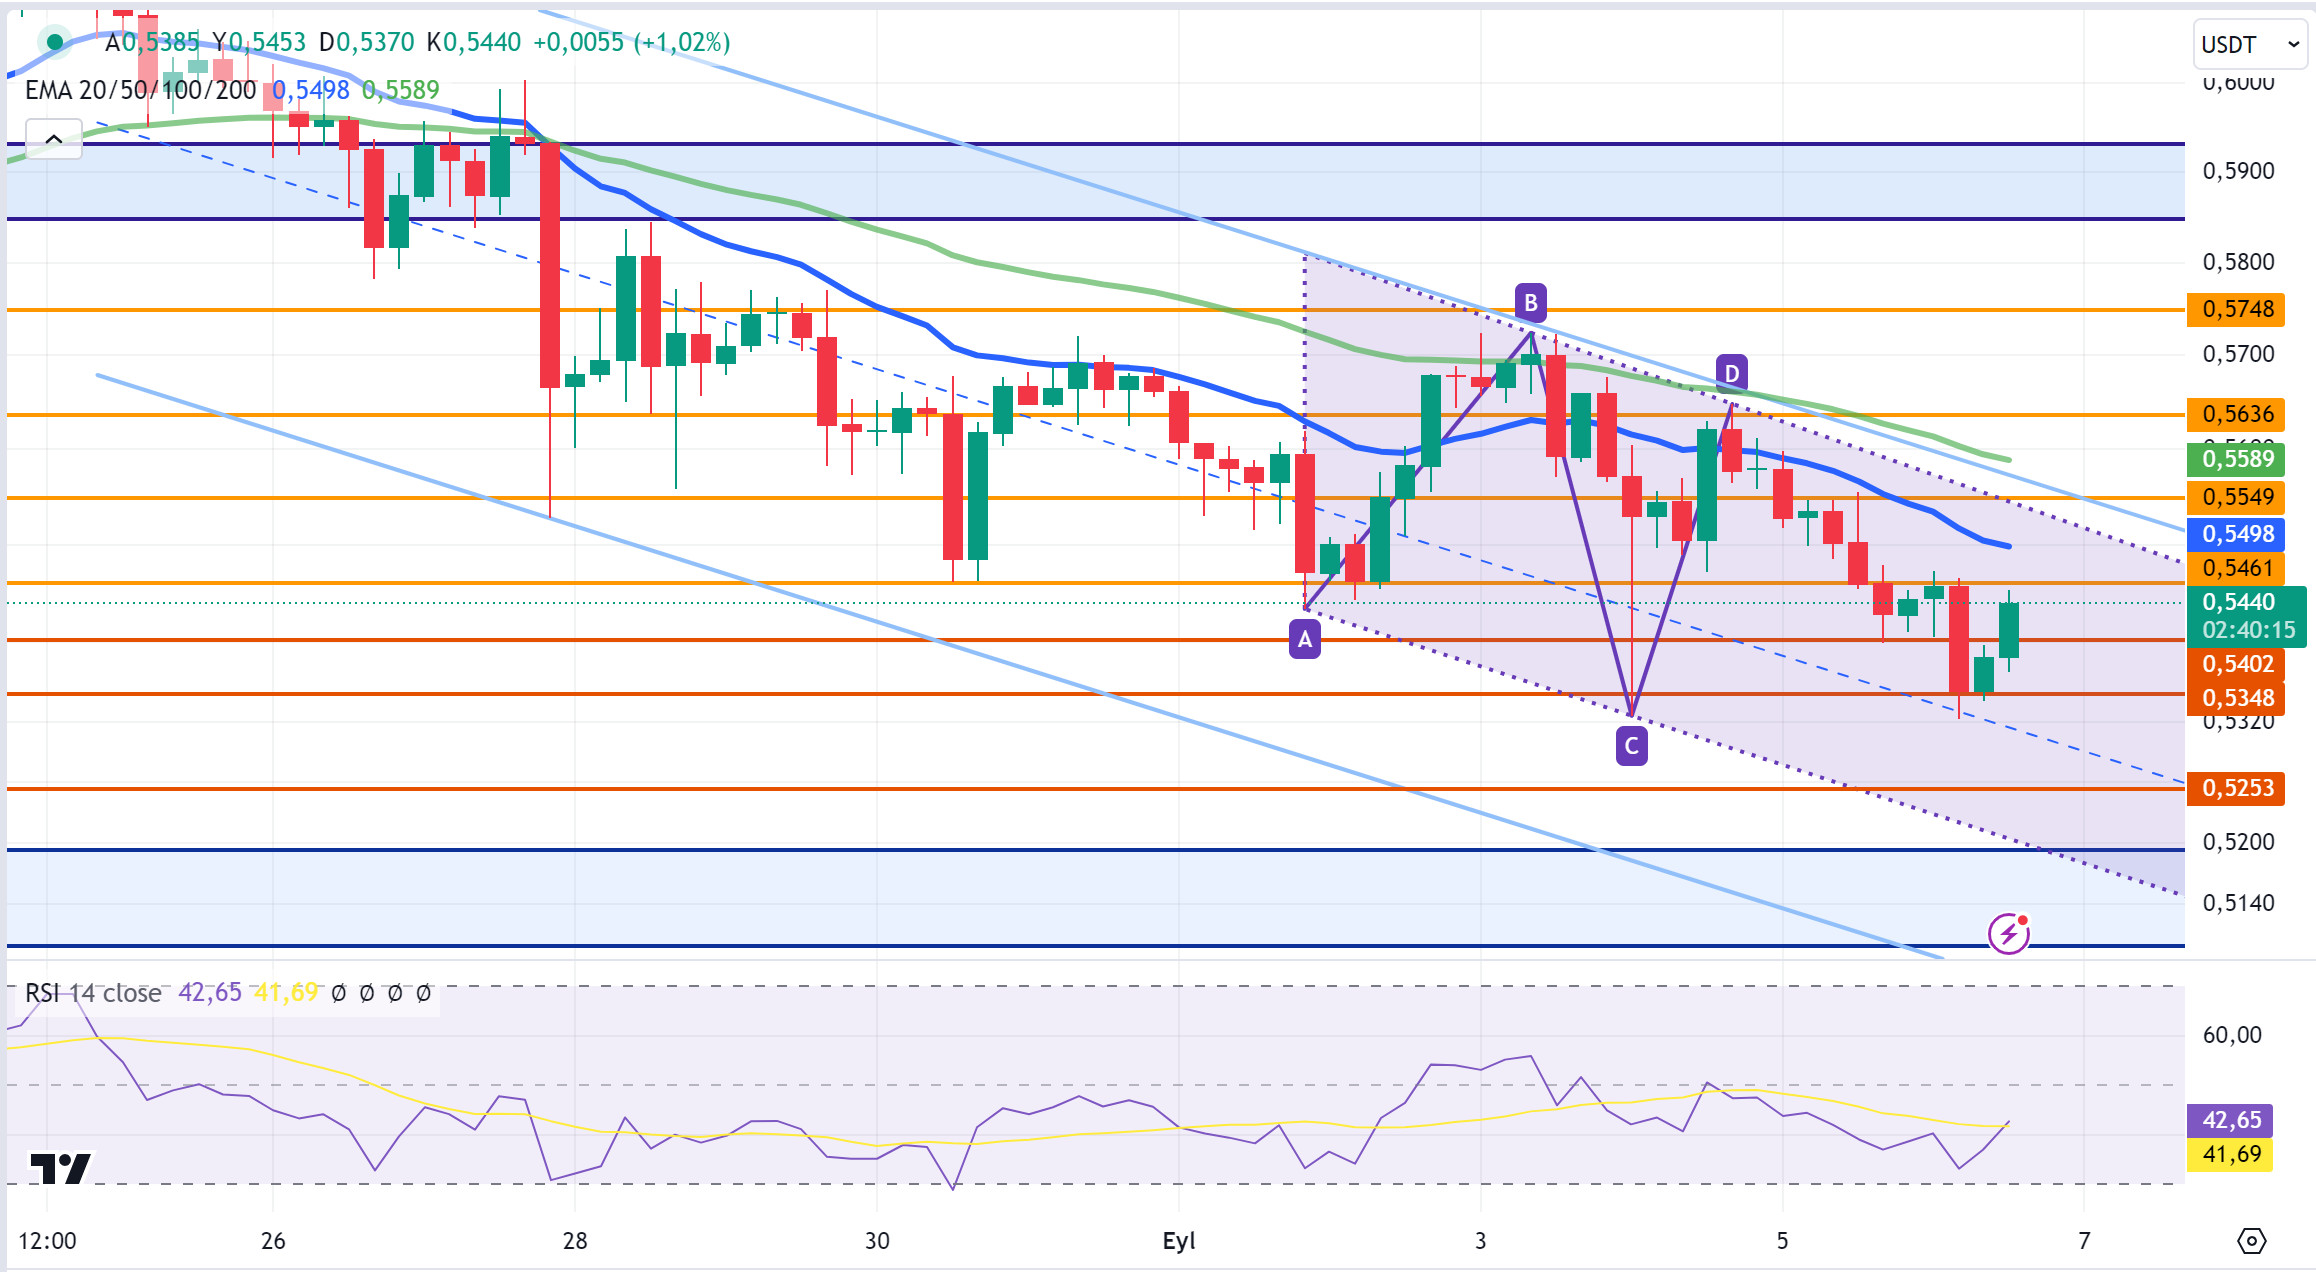
DOGE/USDT
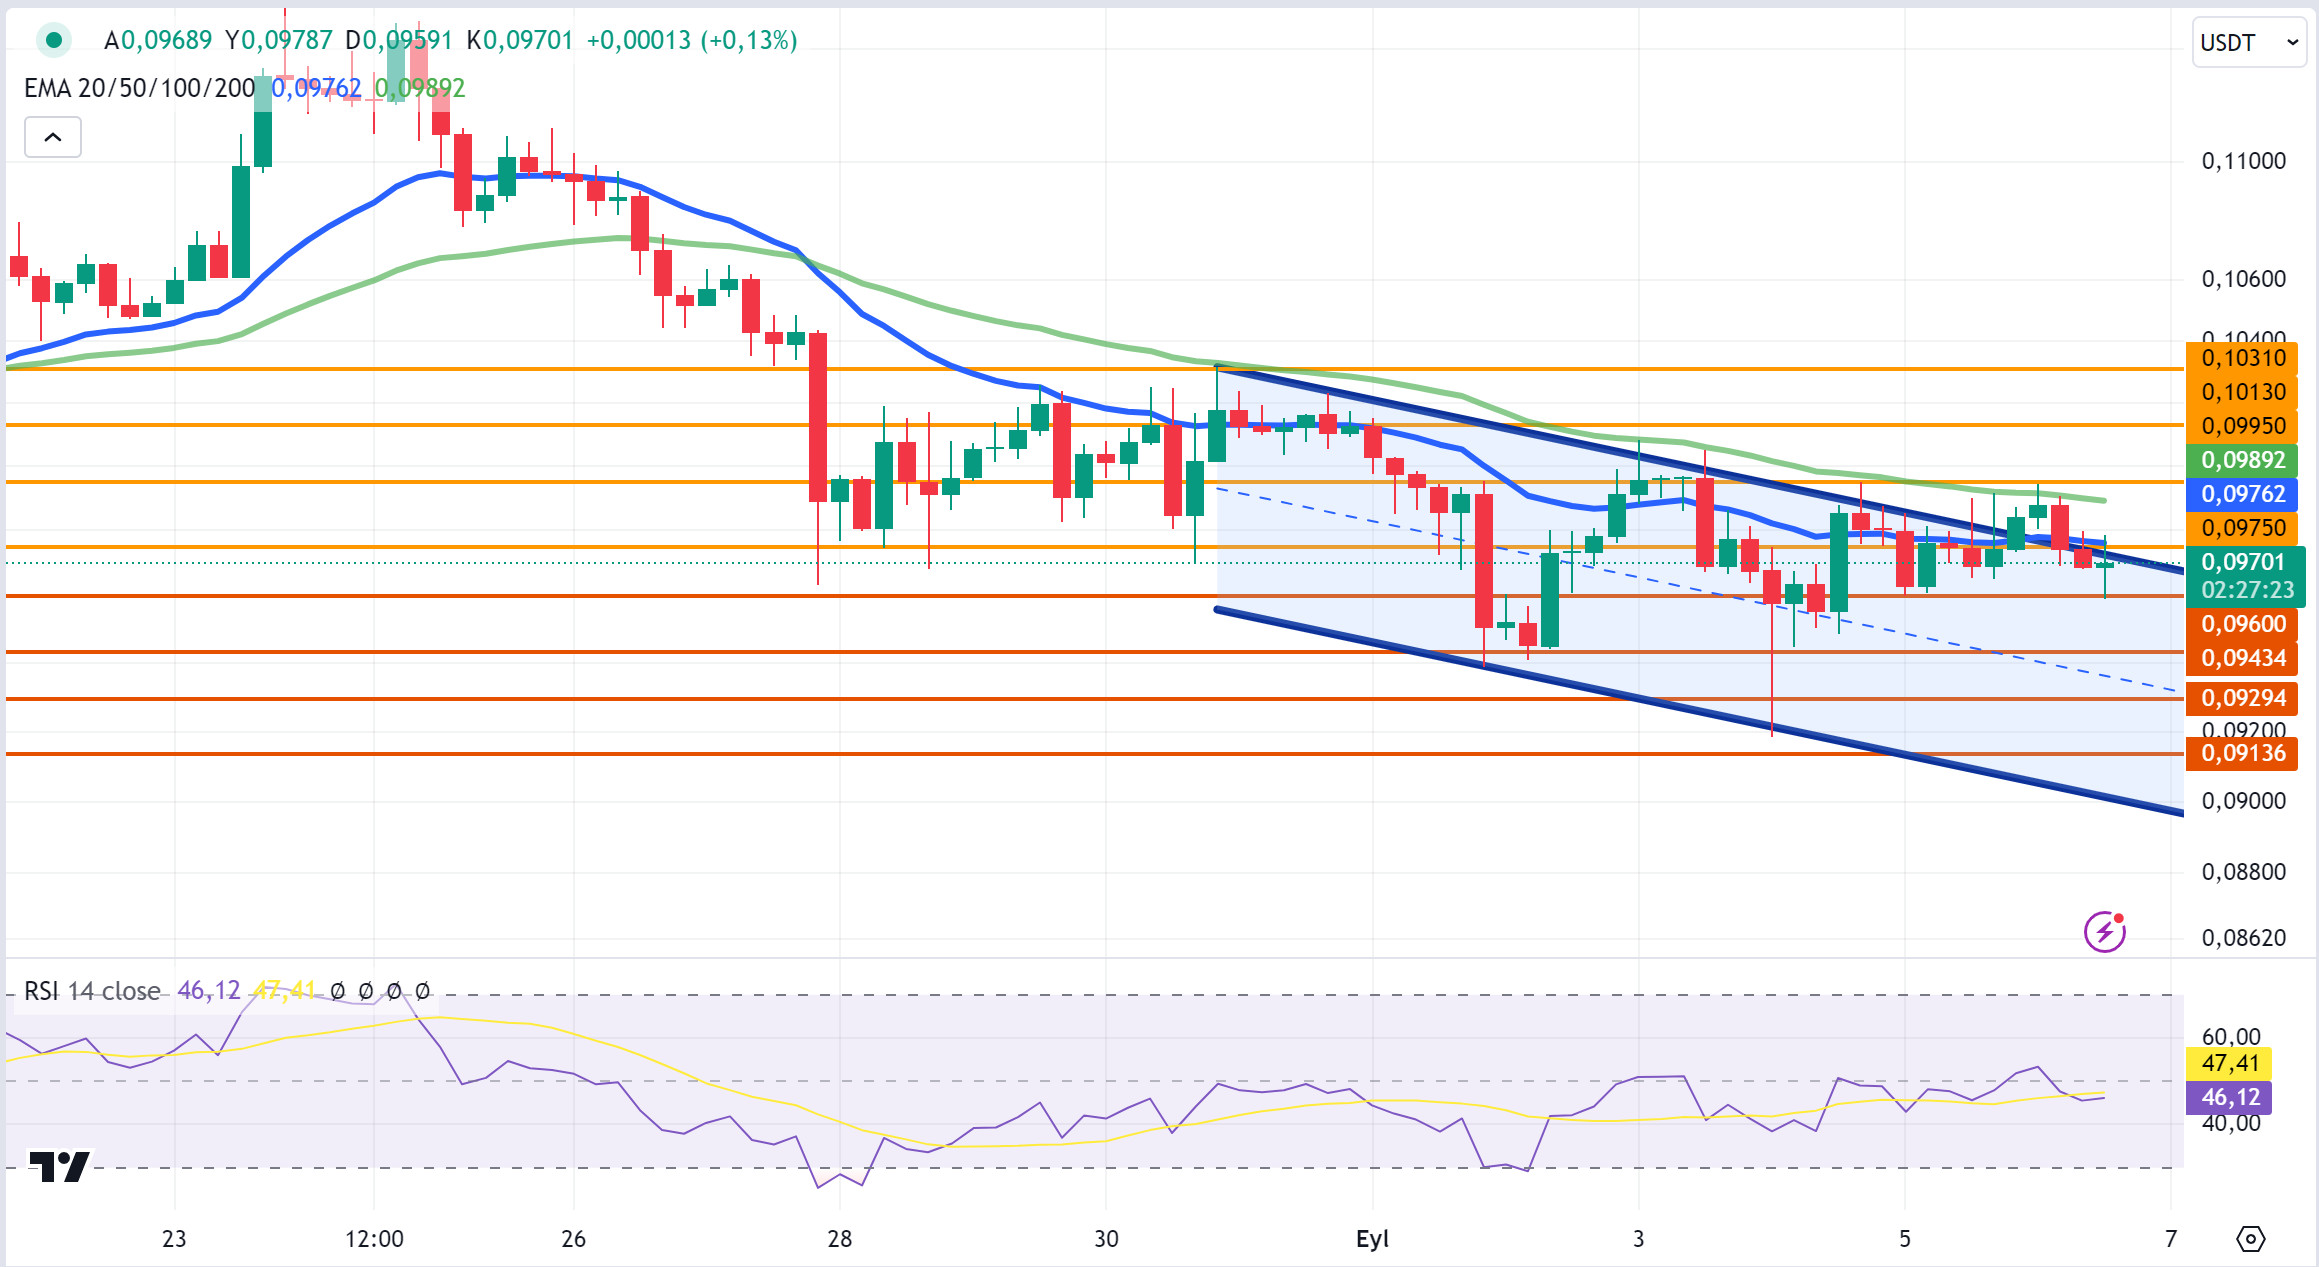
DOGE continued its downtrend today, falling as low as 0.09582, then rose with the economic data released by the US and is currently trading at 0.0970. On a daily basis, DOGE lost 1.5% of its value.
When we examine the 4-hour analysis, DOGE, which is in a downtrend, has recovered after the economic data, but is still trading in the downtrend zone. If it continues its uptrend and continues its upward movement out of the downtrend, DOGE may test the resistance levels of 0.0975-0.0995-0.1013. In case it continues to rise, DOGE may test the support levels of 0.0960-0.0943-0.0929 if it declines with the reaction that may come at the EMA20 (Blue Color) level and the downtrend continues.
Supports 0.0960 – 0.0943 – 0.0929
Resistances 0.0975 – 0.0995 – 0.1013
DOT/USDT
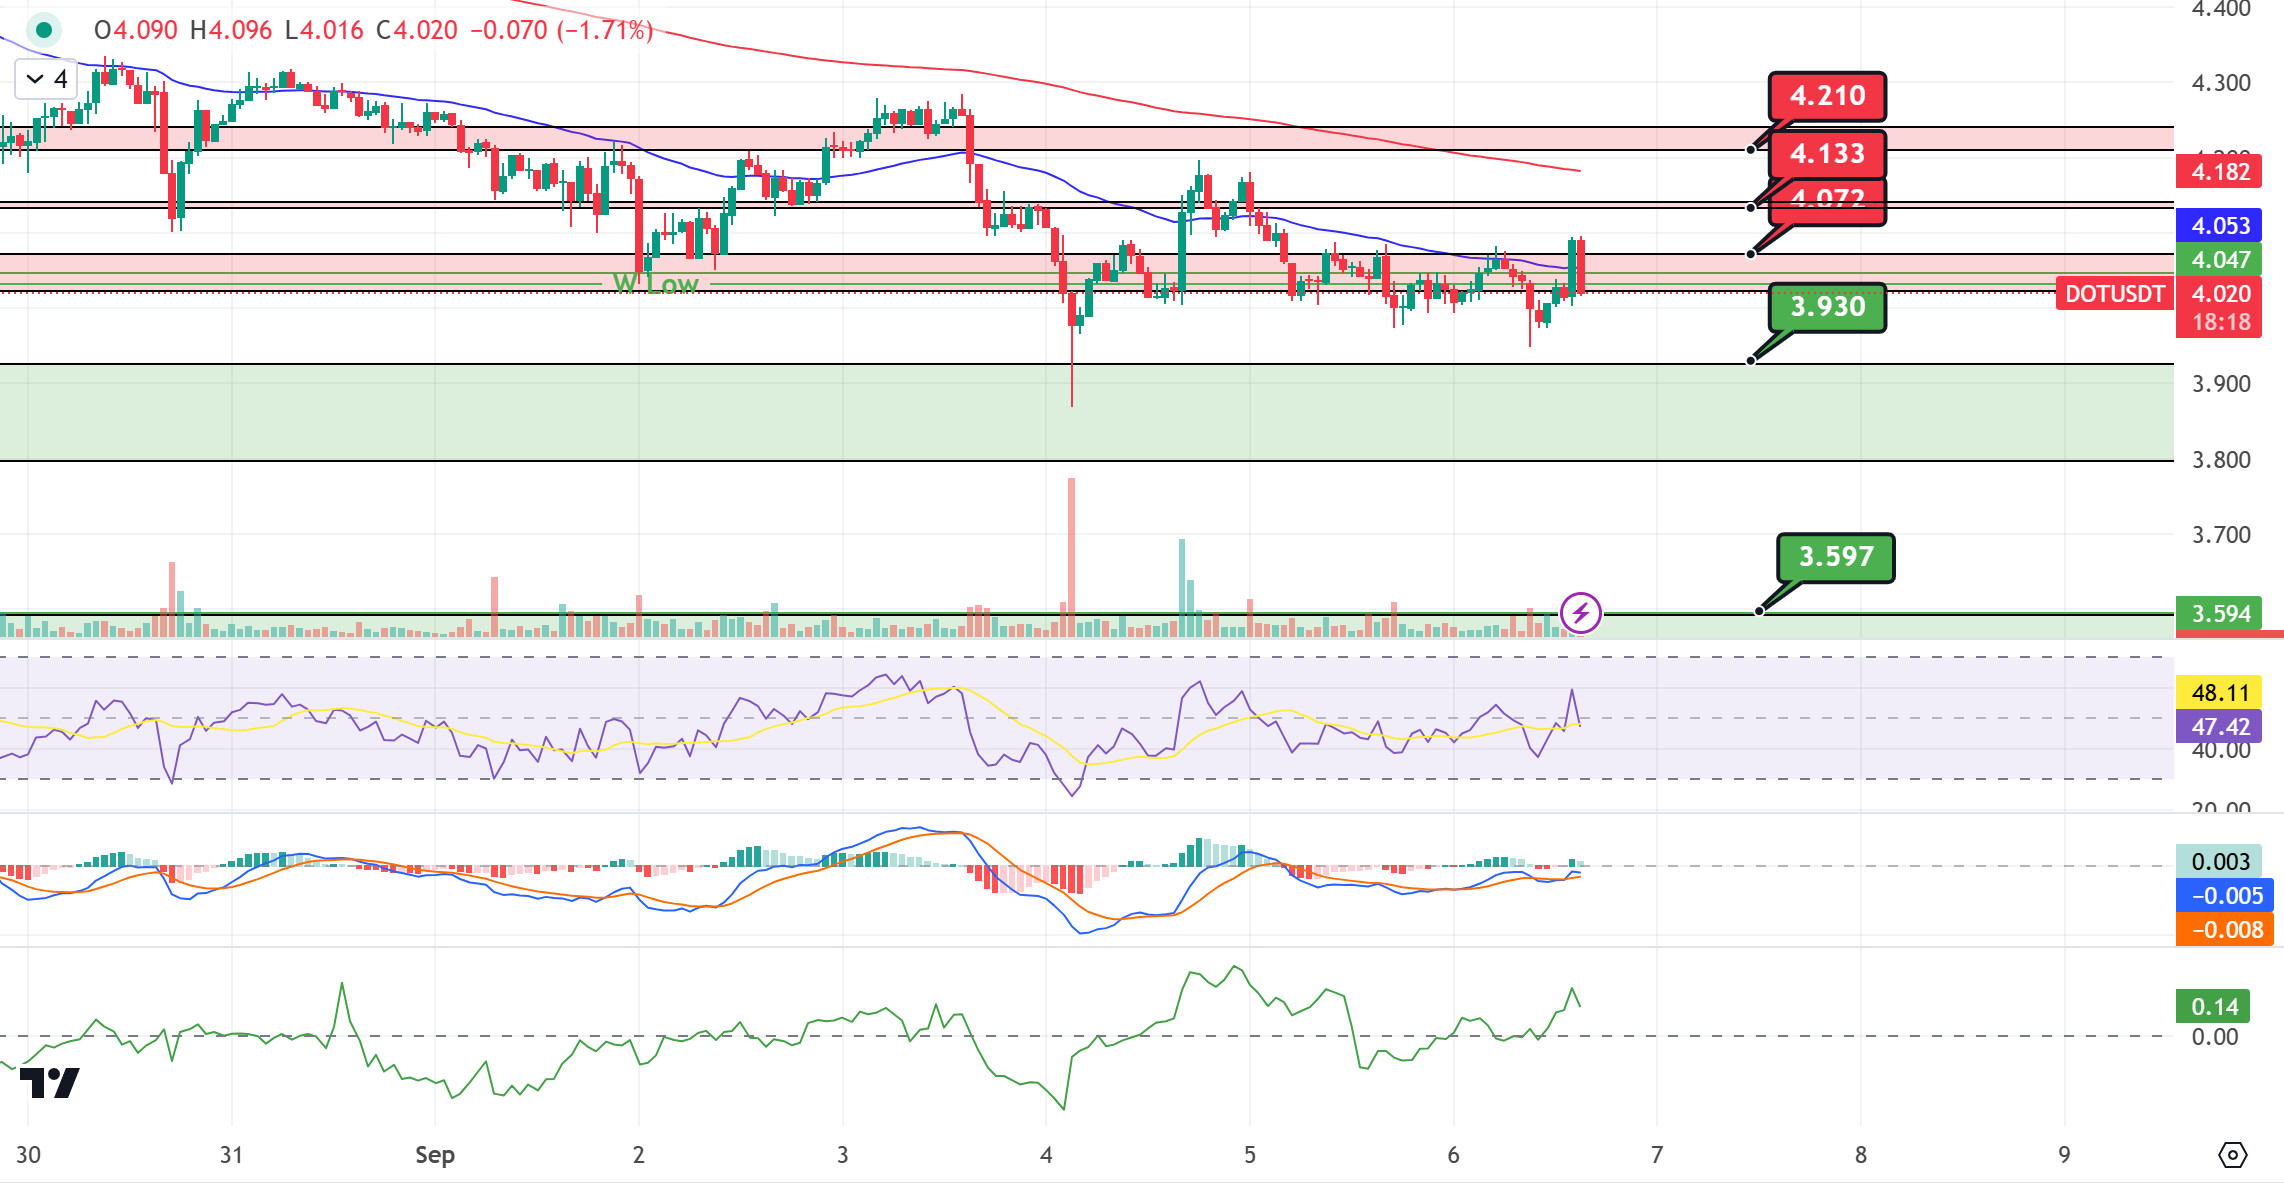
Jay Clayton noted on The Scoop podcast that token funding and ICOs from projects like Polkadot are replacing traditional investment methods. However, he emphasized that such funding brings regulatory challenges and market volatility. Clayton emphasized the importance of regulatory clarity and transparency for these projects to succeed. When we examine the DOT chart, we see that the 4.072 resistance was broken. MACD and CMF (Chaikin Money Flow) oscillators show increased buyer pressure. If the price stays above the EMA50, its next target may be the 4.133 level. On the other hand, if the buyer pressure decreases, the price may make a correction towards 3.930 levels.
(Blue line: EMA50, Red line: EMA200)
Supports 3.930 – 3.597 – 3.335
Resistances 4.072 – 4.133 – 4.210
SHIB/USDT
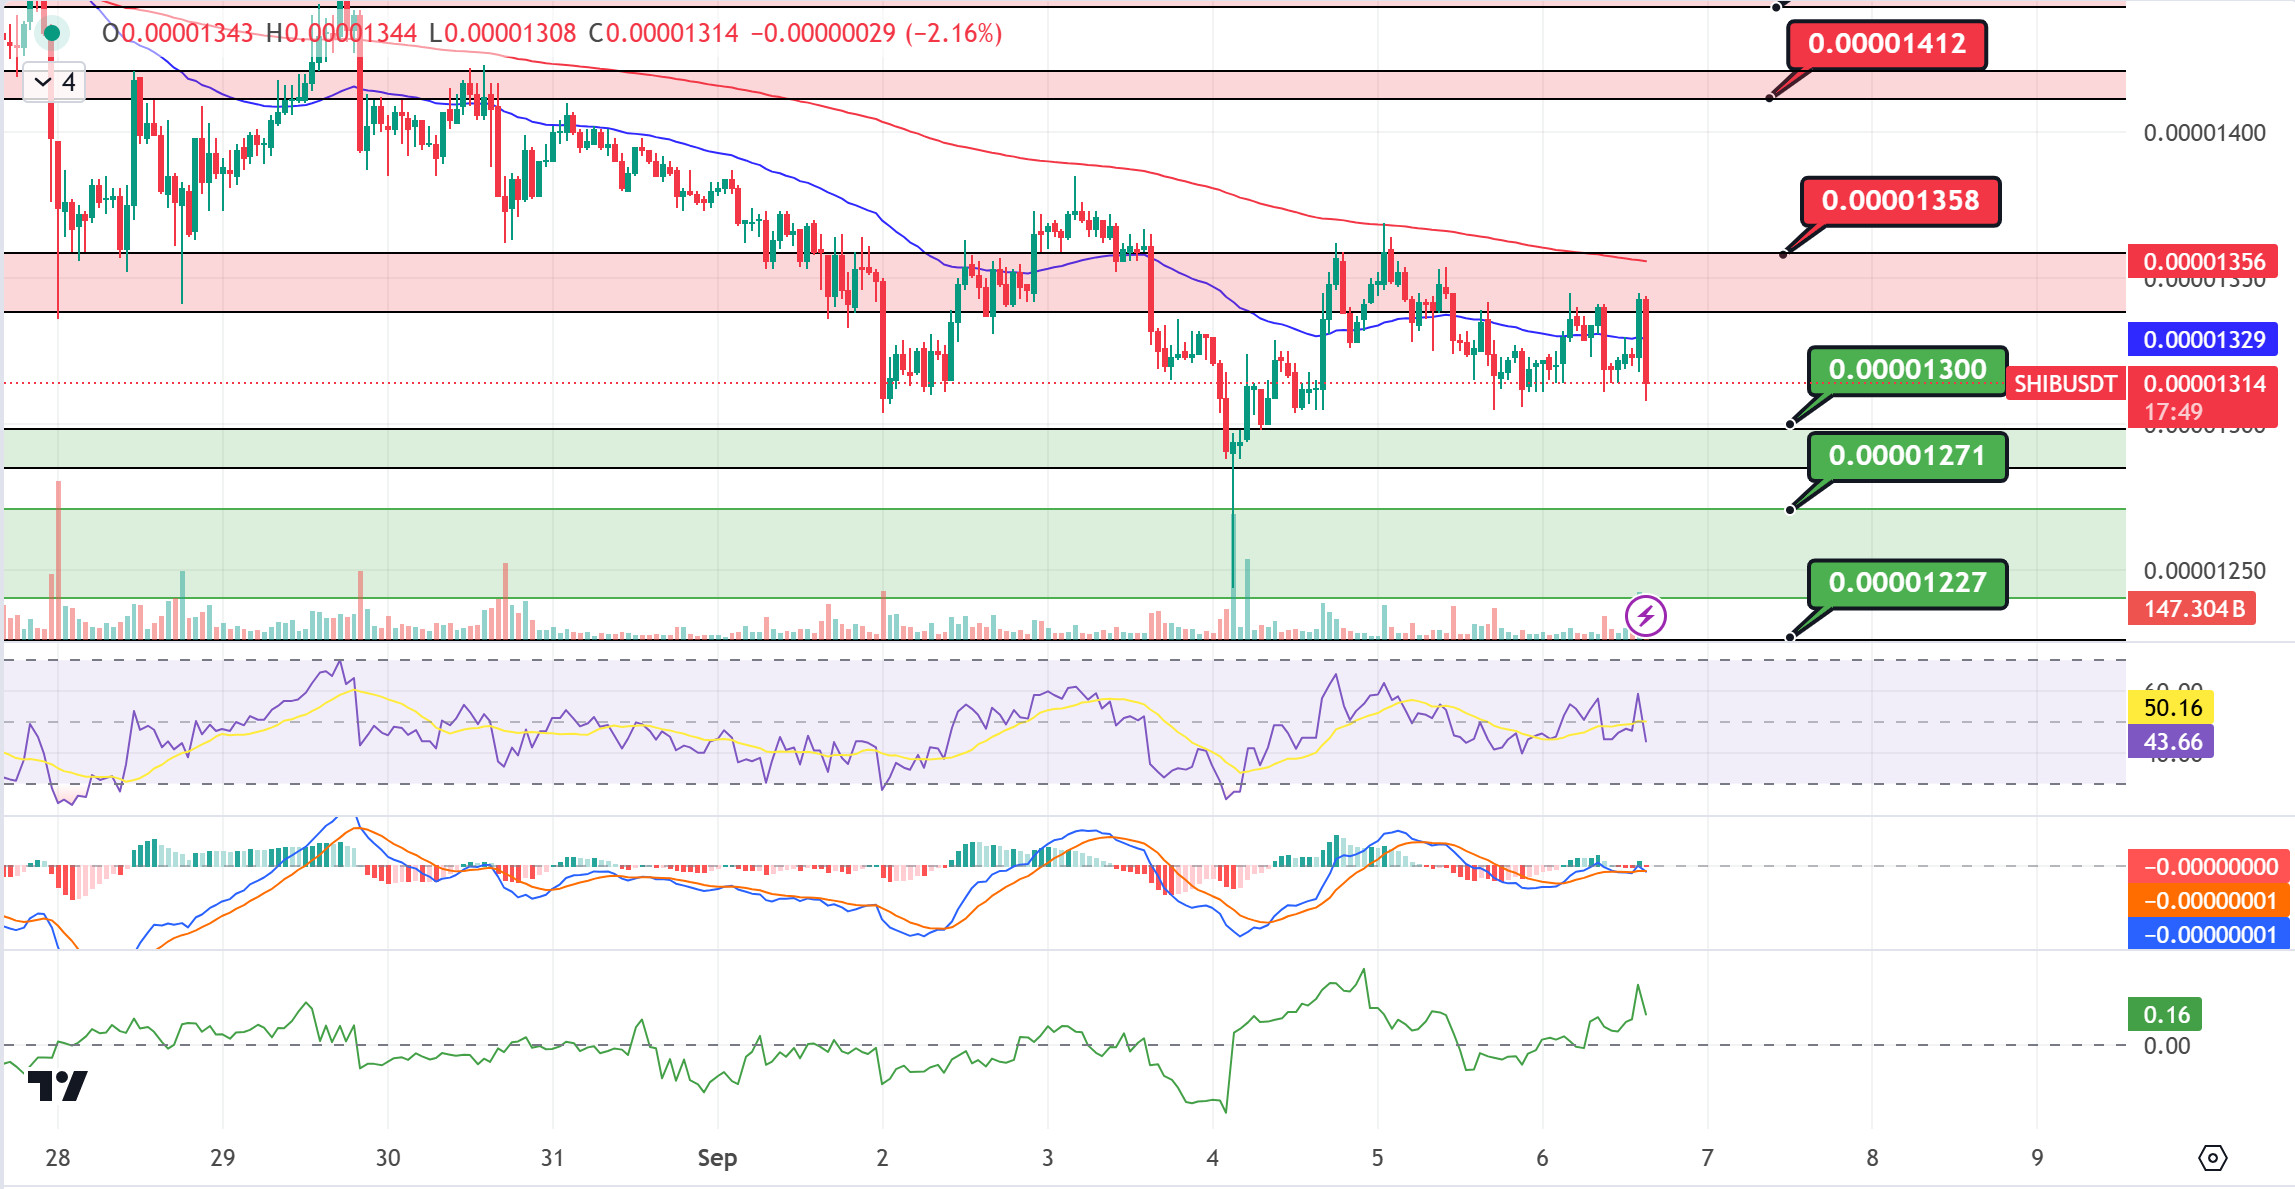
Shiba Inu’s (SHIB) market capitalization fell below $8 billion, losing an important level of support. This reflects a loss of confidence among Shiba Inu investors. Without new capital inflows, short-term difficulties can be expected to continue. When we examine the SHIB chart, we can say that the price is rejected from the 0.00001358 resistance band. If the selling pressure at 0.00001358 is not broken, the price can be expected to retreat to 0.00001300 levels. On the other hand, when we examine the CMF (Chaikin Money Flow) oscillator, we see that the buyer pressure is increasing. In a positive scenario, a movement towards 0.00001412 levels can be expected as the price breaks the 0.00001358 resistance band upwards.
(Blue line: EMA50, Red line: EMA200)
Supports 0.00001300 – 0.00001271 – 0.00001227
Resistances 0.00001358 – 0.00001412 – 0.00001443
LEGAL NOTICE
The investment information, comments and recommendations contained herein do not constitute investment advice. Investment advisory services are provided individually by authorized institutions taking into account the risk and return preferences of individuals. The comments and recommendations contained herein are of a general nature. These recommendations may not be suitable for your financial situation and risk and return preferences. Therefore, making an investment decision based solely on the information contained herein may not produce results in line with your expectations.
