
MARKET SUMMARY
Latest Situation in Crypto Assets
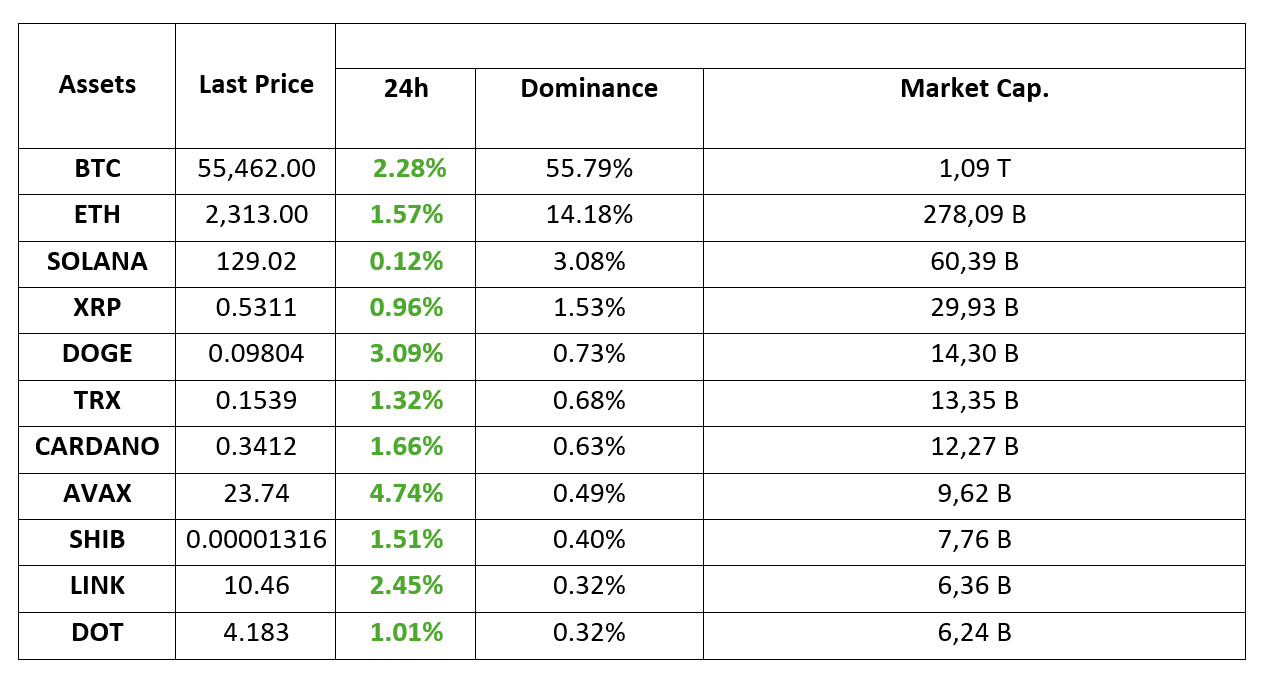
*Table prepared on 9.09.2024 at 14:00 (UTC)
WHAT’S LEFT BEHIND
Russia made hundreds of millions of dollars from Bitcoin mining: It’s official
Russia, which has been in a difficult situation due to Western sanctions that started due to the Ukrainian war, has earned 556 million dollars in tax revenue from Bitcoin mining. According to the official statement, 54 thousand Bitcoins were produced in Russia in 2023.
Bitcoin’s fate depends on Trump: Bernstein analysts
As the US elections draw closer, as do the Fed rate cuts, analysts at Bernstein, which manages $750 billion, emphasized the importance of Trump’s election win for Bitcoin’s trajectory. They predicted that Bitcoin (BTC) could reach record highs this year if Trump wins the US elections. In the research, it was stated that if Trump is elected, the leading cryptocurrency could reach 90 thousand dollars in the fourth quarter.
The prediction market in crypto has also grown sharply: Will the company issue tokens?
Polymarket, which is seen as the largest platform of the prediction markets, which has recently seen serious growth in the crypto world, is also allegedly preparing to issue a token. Although there is no statement on the subject, it is noteworthy that some users have increased their transactions in this direction.
HIGHLIGHTS OF THE DAY
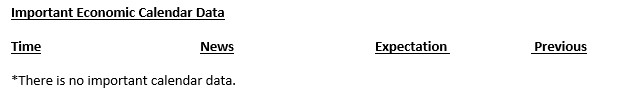
INFORMATION
*The calendar is based on UTC (Coordinated Universal Time) time zone. The economic calendar content on the relevant page is obtained from reliable news and data providers. The news in the economic calendar content, the date and time of the announcement of the news, possible changes in the previous, expectations and announced figures are made by the data provider institutions. Darkex cannot be held responsible for possible changes that may arise from similar situations.
MARKET COMPASS
The “not so good” mood of Friday’s US and this morning’s Asian session was not taken over by European trading. Stock markets are green on the old continent and the US is no different. As we predicted in our morning analysis, the pricing after last week’s US employment data has given way to some relief. Markets do not seem willing to price in more “bad economics” and recession for the time being.
We have seen the reflections of the situation we have summarized above in digital assets. Cryptocurrencies, which have been bleeding suffocatingly, have found a breathing space. Whether these conditions will continue may become more evident with Wednesday’s US inflation data. However, it is worth noting that it would be wrong to say that the upward trend will continue until this data time.
TECHNICAL ANALYSIS
BTC/USDT
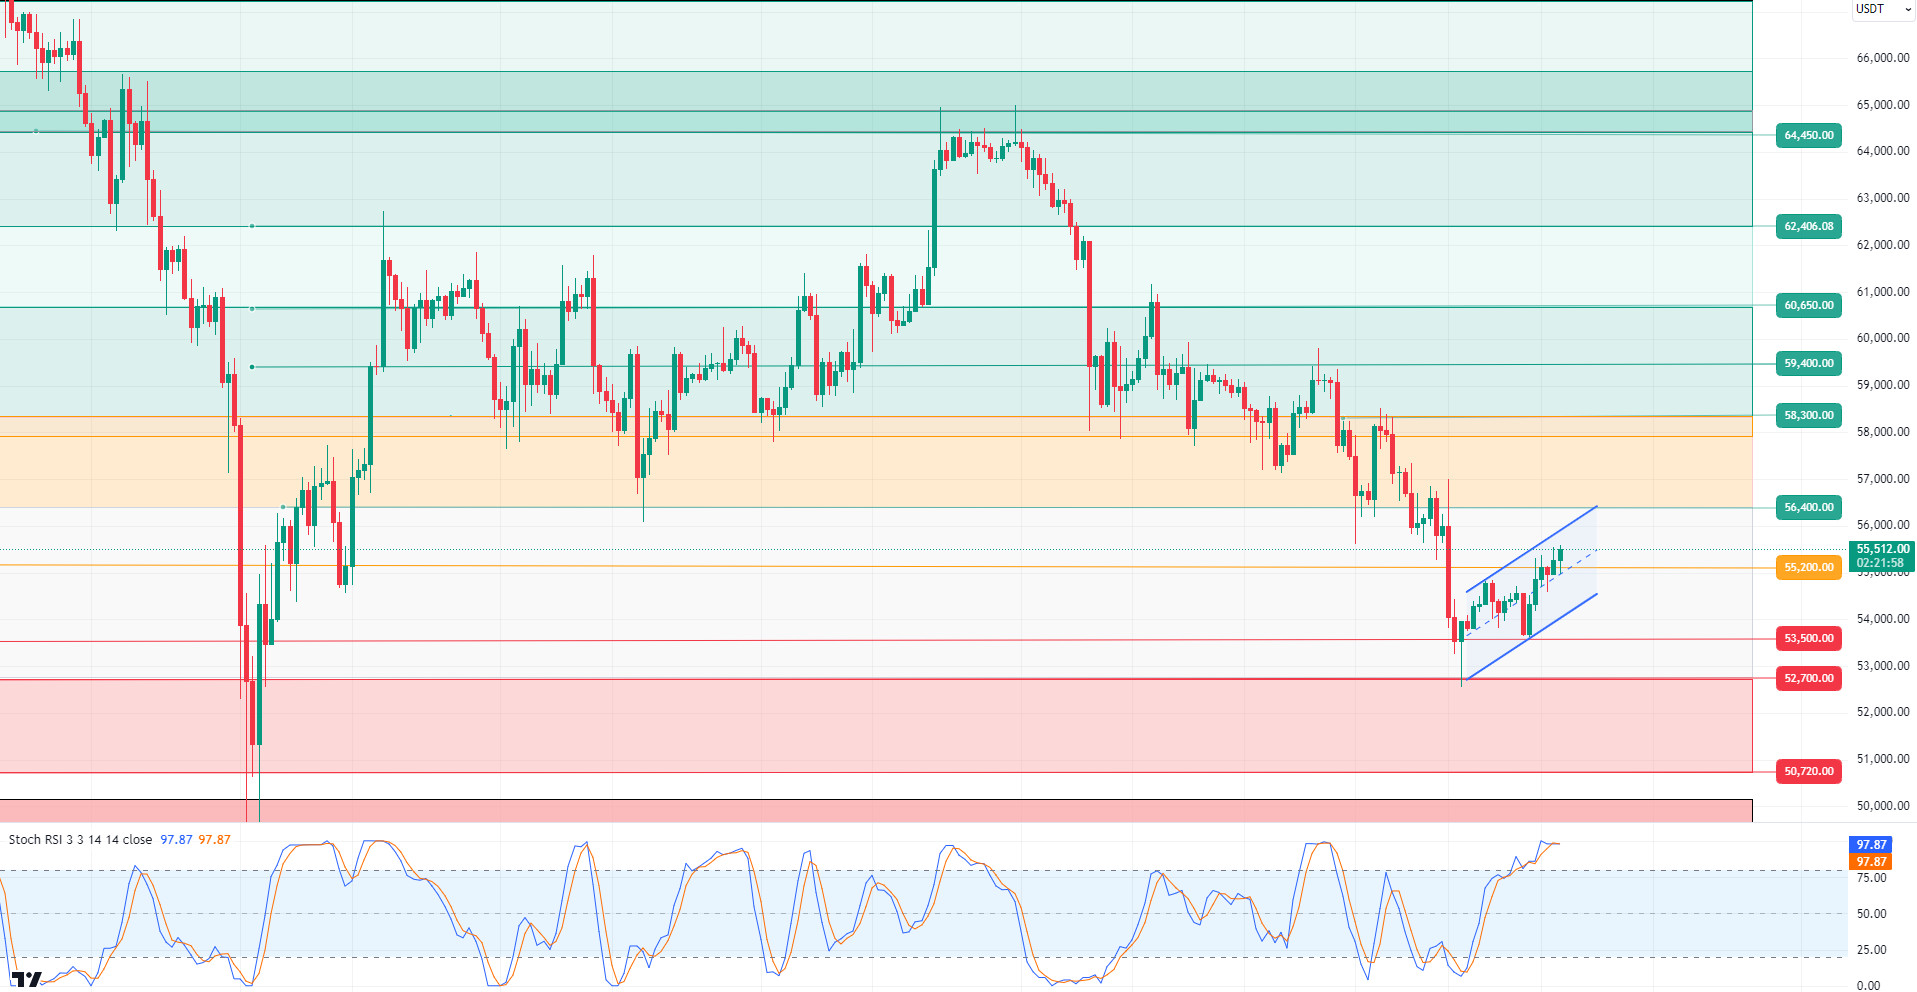
This week in Bitcoin, eyes will be on the macroeconomic data to be announced in the US. The PPI and CPI, which are critical macroeconomic data regarding the FED interest rate policy, will determine the direction in Bitcoin. The market’s expectation of a 25 basis point interest rate cut in the FED’s interest rate policy may bring a potential fund flow to Bitcoin in the long term. In the 4-hour technical analysis of BTC, we see that an uptrend channel has formed within the falling trend structure. We can say that closes above the critical resistance level of 55,200 are currently positive. With the opening of the US market, the direction of Bitcoin may be determined and if the market opens positive, there may be a movement towards the resistance level of 56,400. In case the market opens negatively, the support level of 55,200 is critical. If our technical indicator RSI turns down in the overbought zone, the price is likely to pull back.
Supports 53,500 – 52,700 – 50,720
Resistances 55,200 – 56,400 – 57,200
ETH/USDT
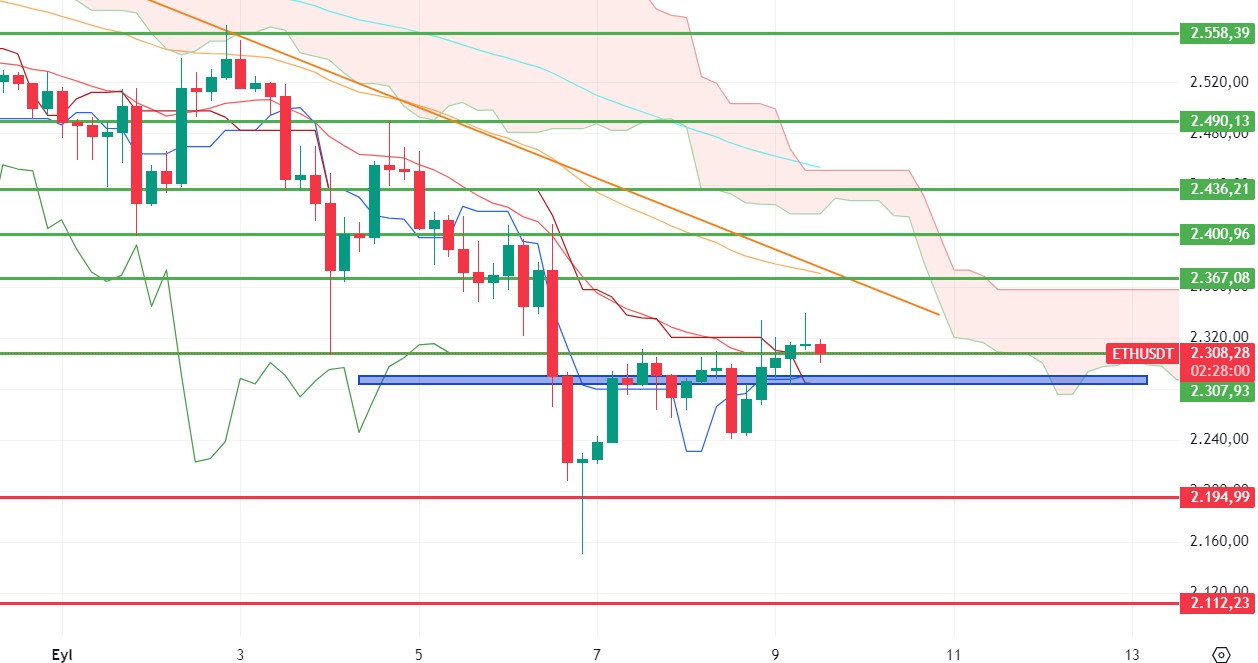
Ethereum, which experienced some correction in the morning rise with the negativities in stoch, momentum, OBV and MFI in the hourly timeframe, is trying to hold at 2,310 levels. It can be said that the image has shifted to positive with the exceeding of MA50 and the buy signal in ichimoku. We can see rises up to 2,400 levels. However, it should be noted that the narrow band between 2,289 – 2,284, which appears as a blue box on the chart, is an important support level and its loss will be negative.
Supports 2,289 – 2,194 – 2,112
Resistances 2,367 – 2,400 – 2,436
LINK/USDT
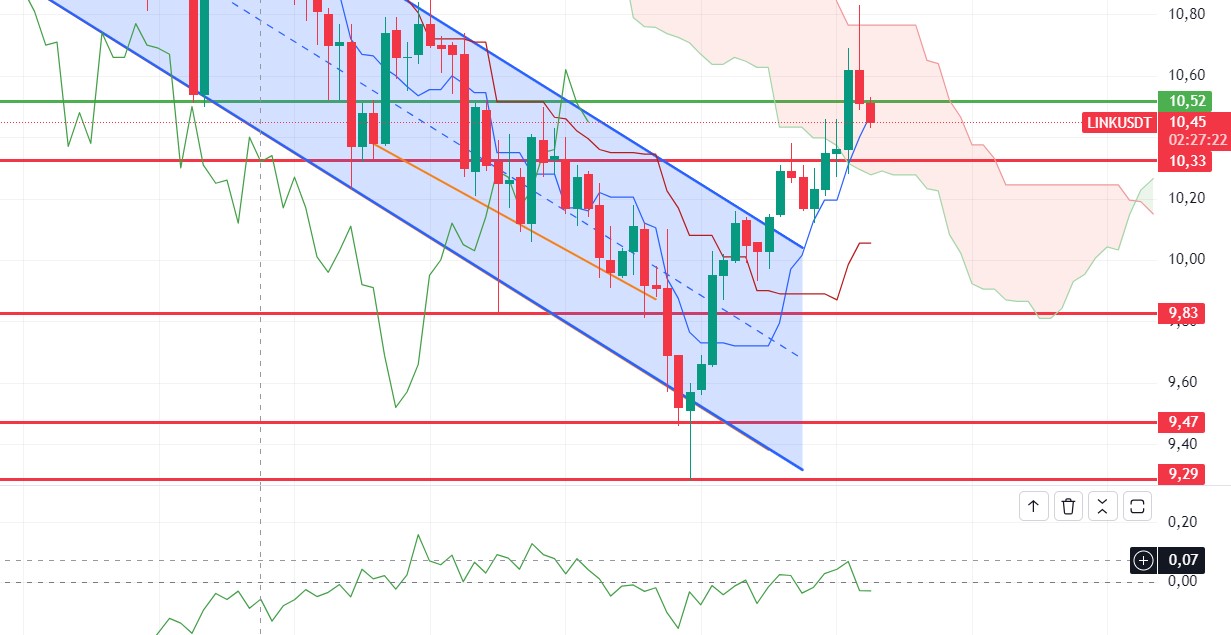
LINK, which looks very positive with breaking the falling channel and rising up to the kumo cloud, was rejected from the cloud resistance, even though it made its up-volume movement as expected. After correcting to 10.33 levels, it seems quite likely that it will attack up again. It shows that the rise in CMF is organic. Also, looking at CVD, it is seen that spot-weighted purchases are coming. As long as there are no sharp movements on the Bitcoin side, positive movements may continue.
Supports 9.82 – 9.47 – 8.12
Resistances 10.52 – 10.98 – 11.45
SOL/USDT
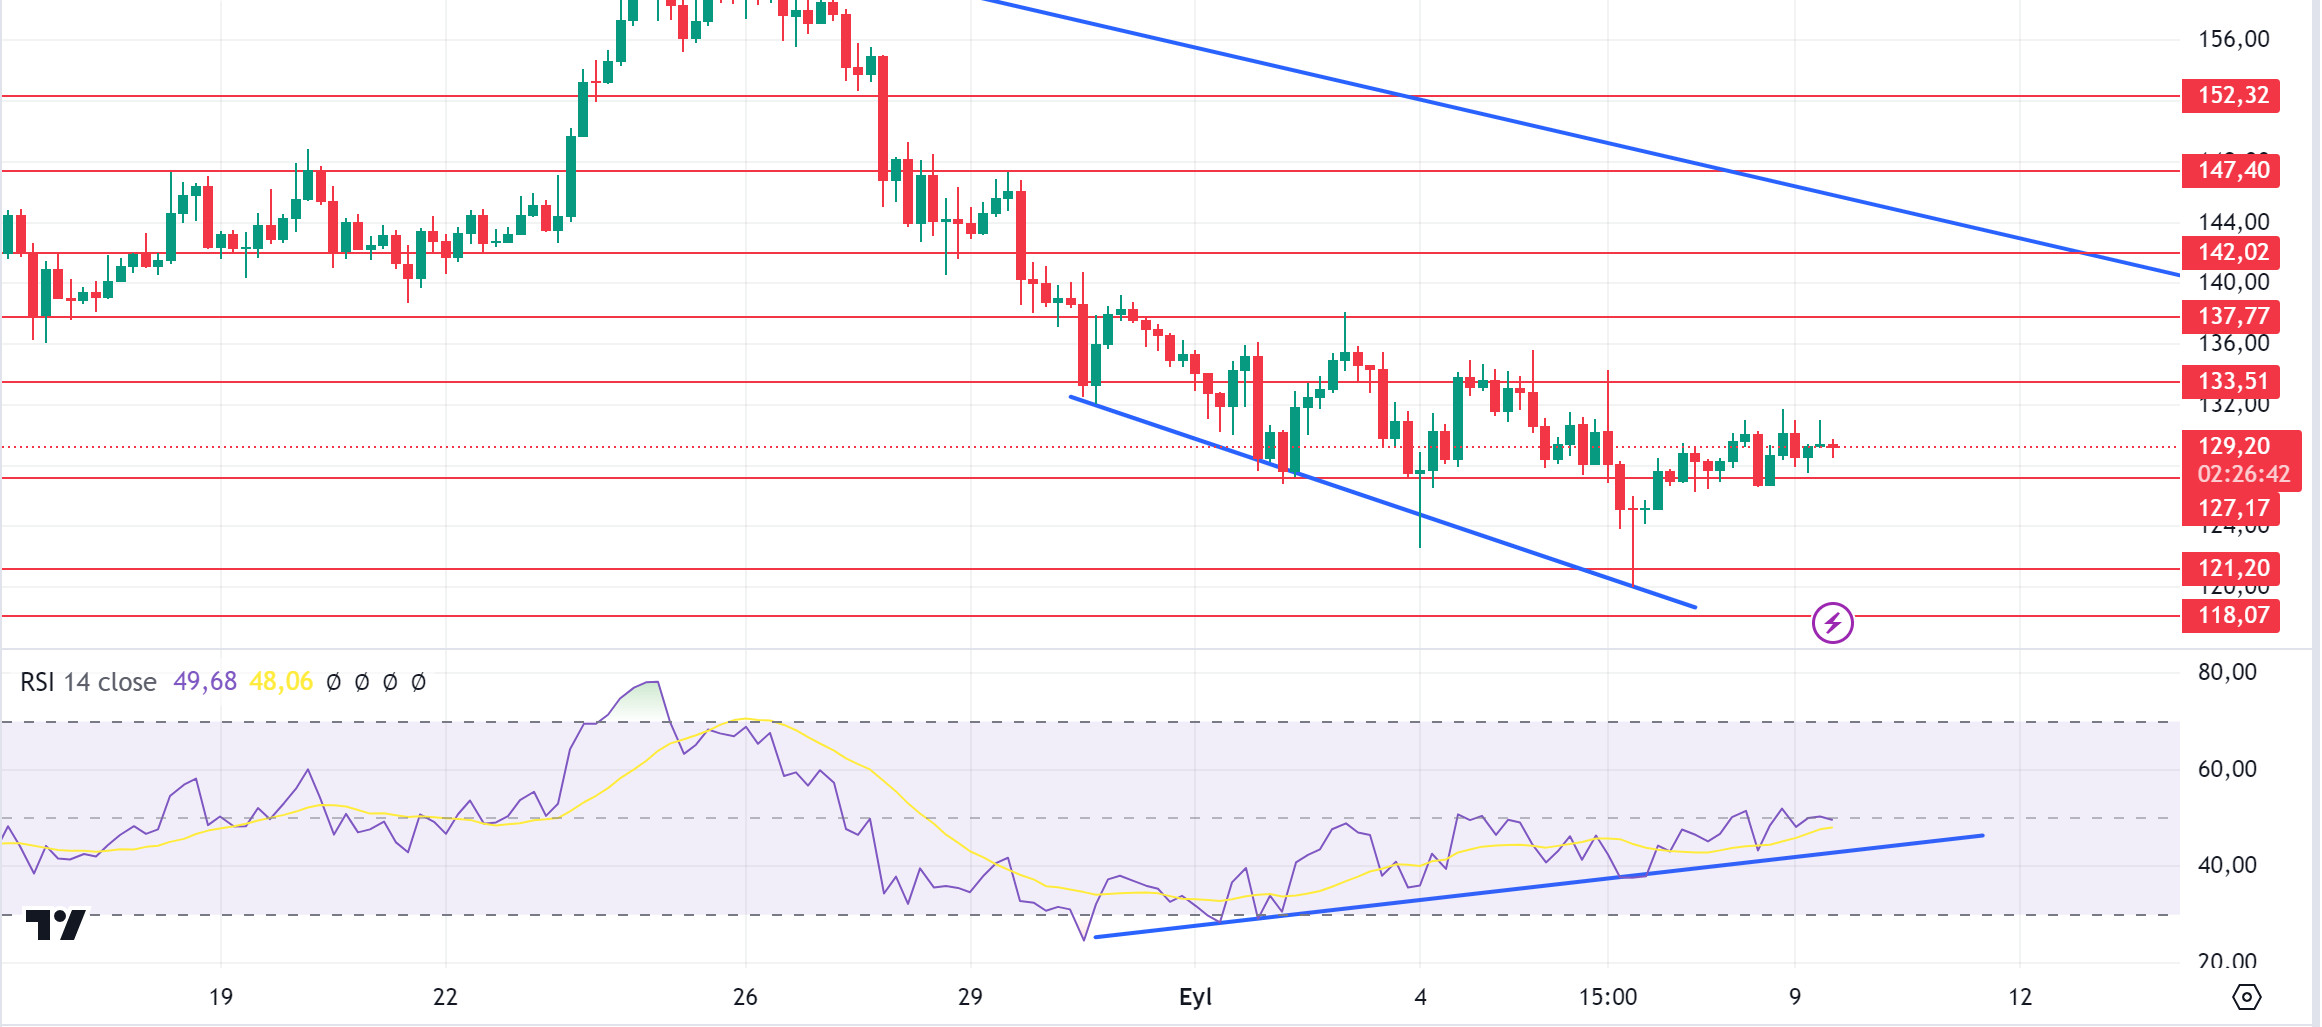
Bernstein, a private asset management fund managing $725 billion, predicts that Bitcoin could reach $80-90,000 if Trump wins in 2024. In a note to their clients, they said that BTC could drop to $30-40k if Harris wins. This is important information in the Solana ecosystem. Technically, when we compare the RSI and the price, we see that there is a bullish mismatch. SOL, which has been accumulating in a certain band since April, may test the resistance levels of 133.51 – 137.77 if the rises continue due to the increase in volumes. In the scenario where the uncertainty and lack of volume in the market continues, support levels of 127.17 – 121.20 should be followed.
Supports 127.17 – 121.20 – 118.07
Resistances 133.51 – 137.77 – 142.02
ADA/USDT
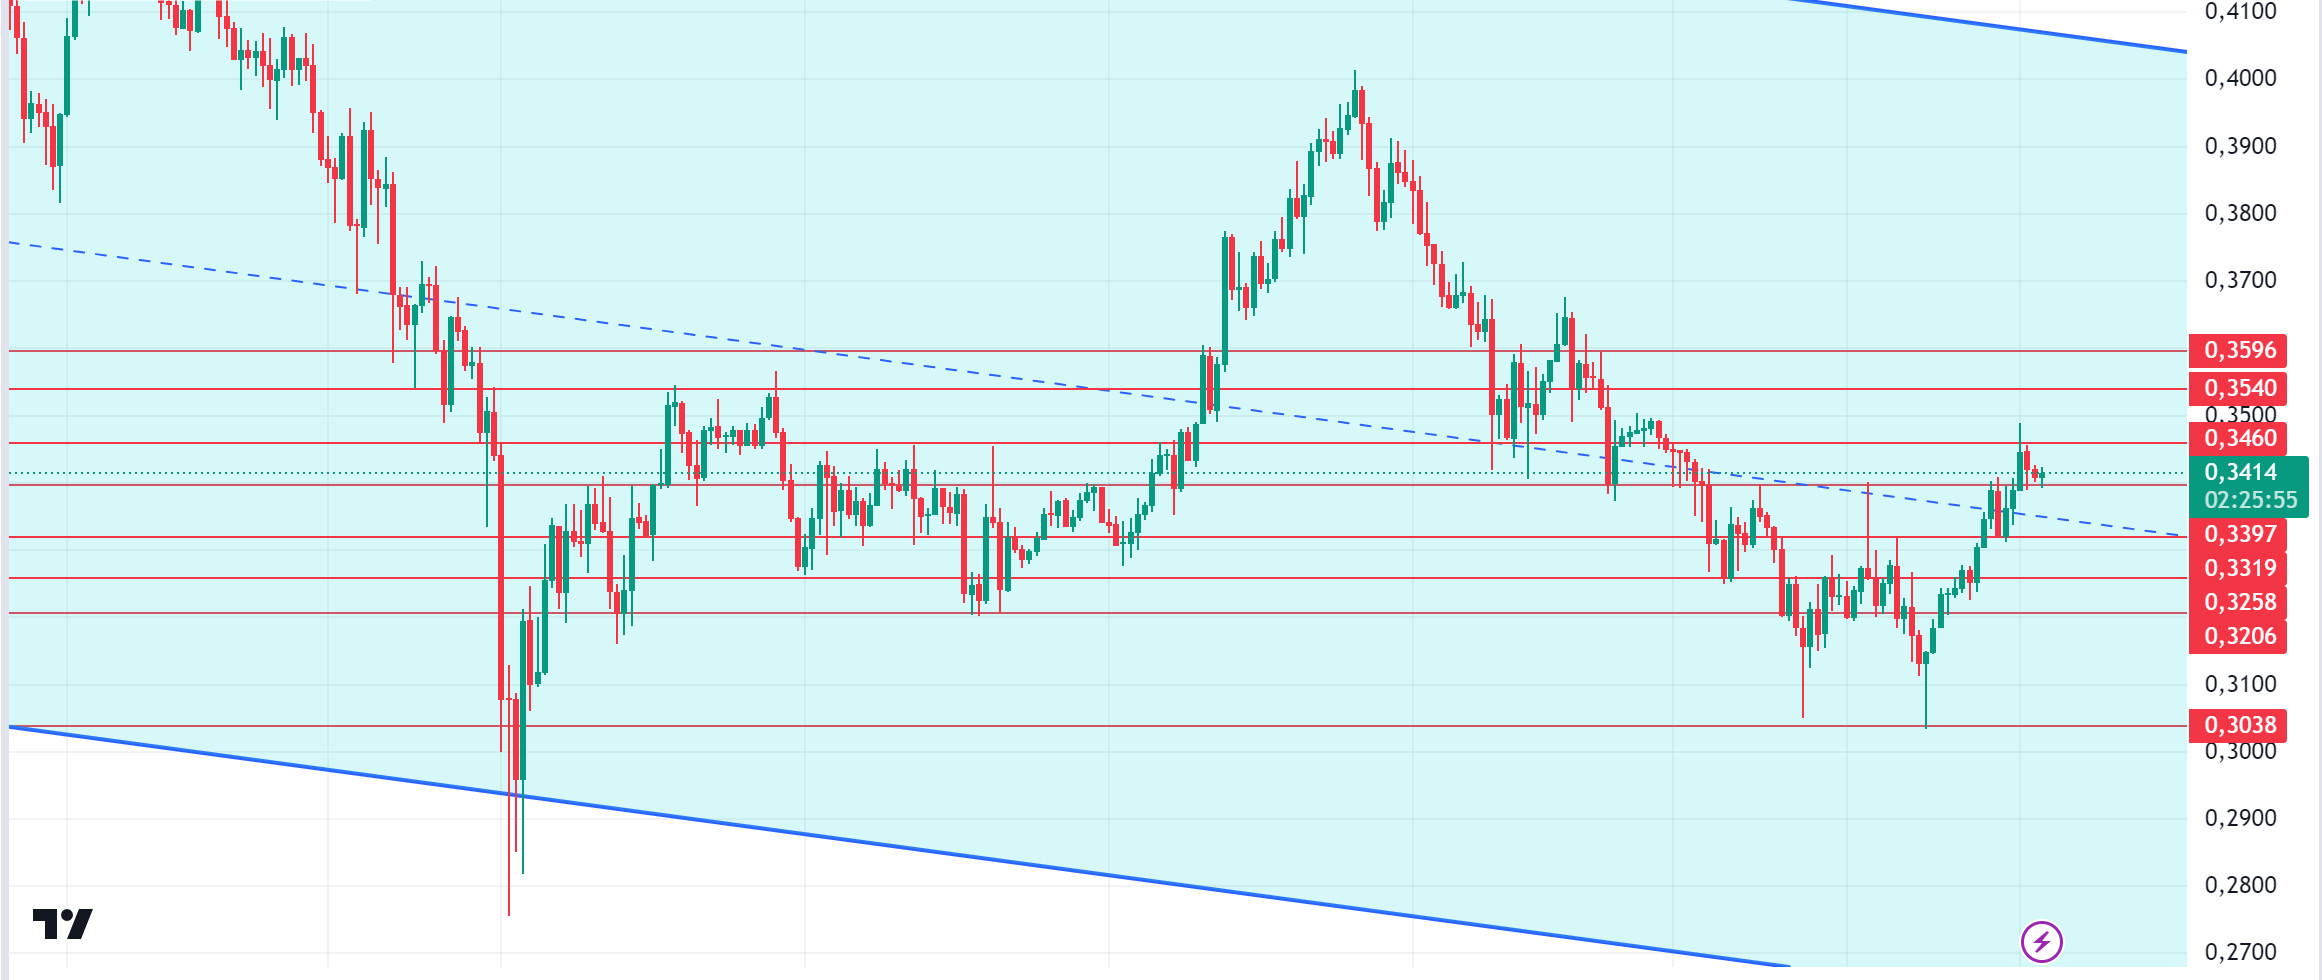
The market has been moving horizontally since our analysis in the morning. When we look at the chart of ADA, it is priced at the middle levels of the falling channel. ADA, which made a double bottom at 0.3038, continues to be priced with purchases by experiencing a rise due to the innovations brought by the update, may bring the price to 0.3540 – 0.3596 levels. Due to the retracements, the support place to look at is 0.3397 – 0.3319 levels can be followed.
Supports 0.3397 – 0.3319 – 0.3258
Resistances 0.3460 – 0.3540 – 0.3596
AVAX/USDT
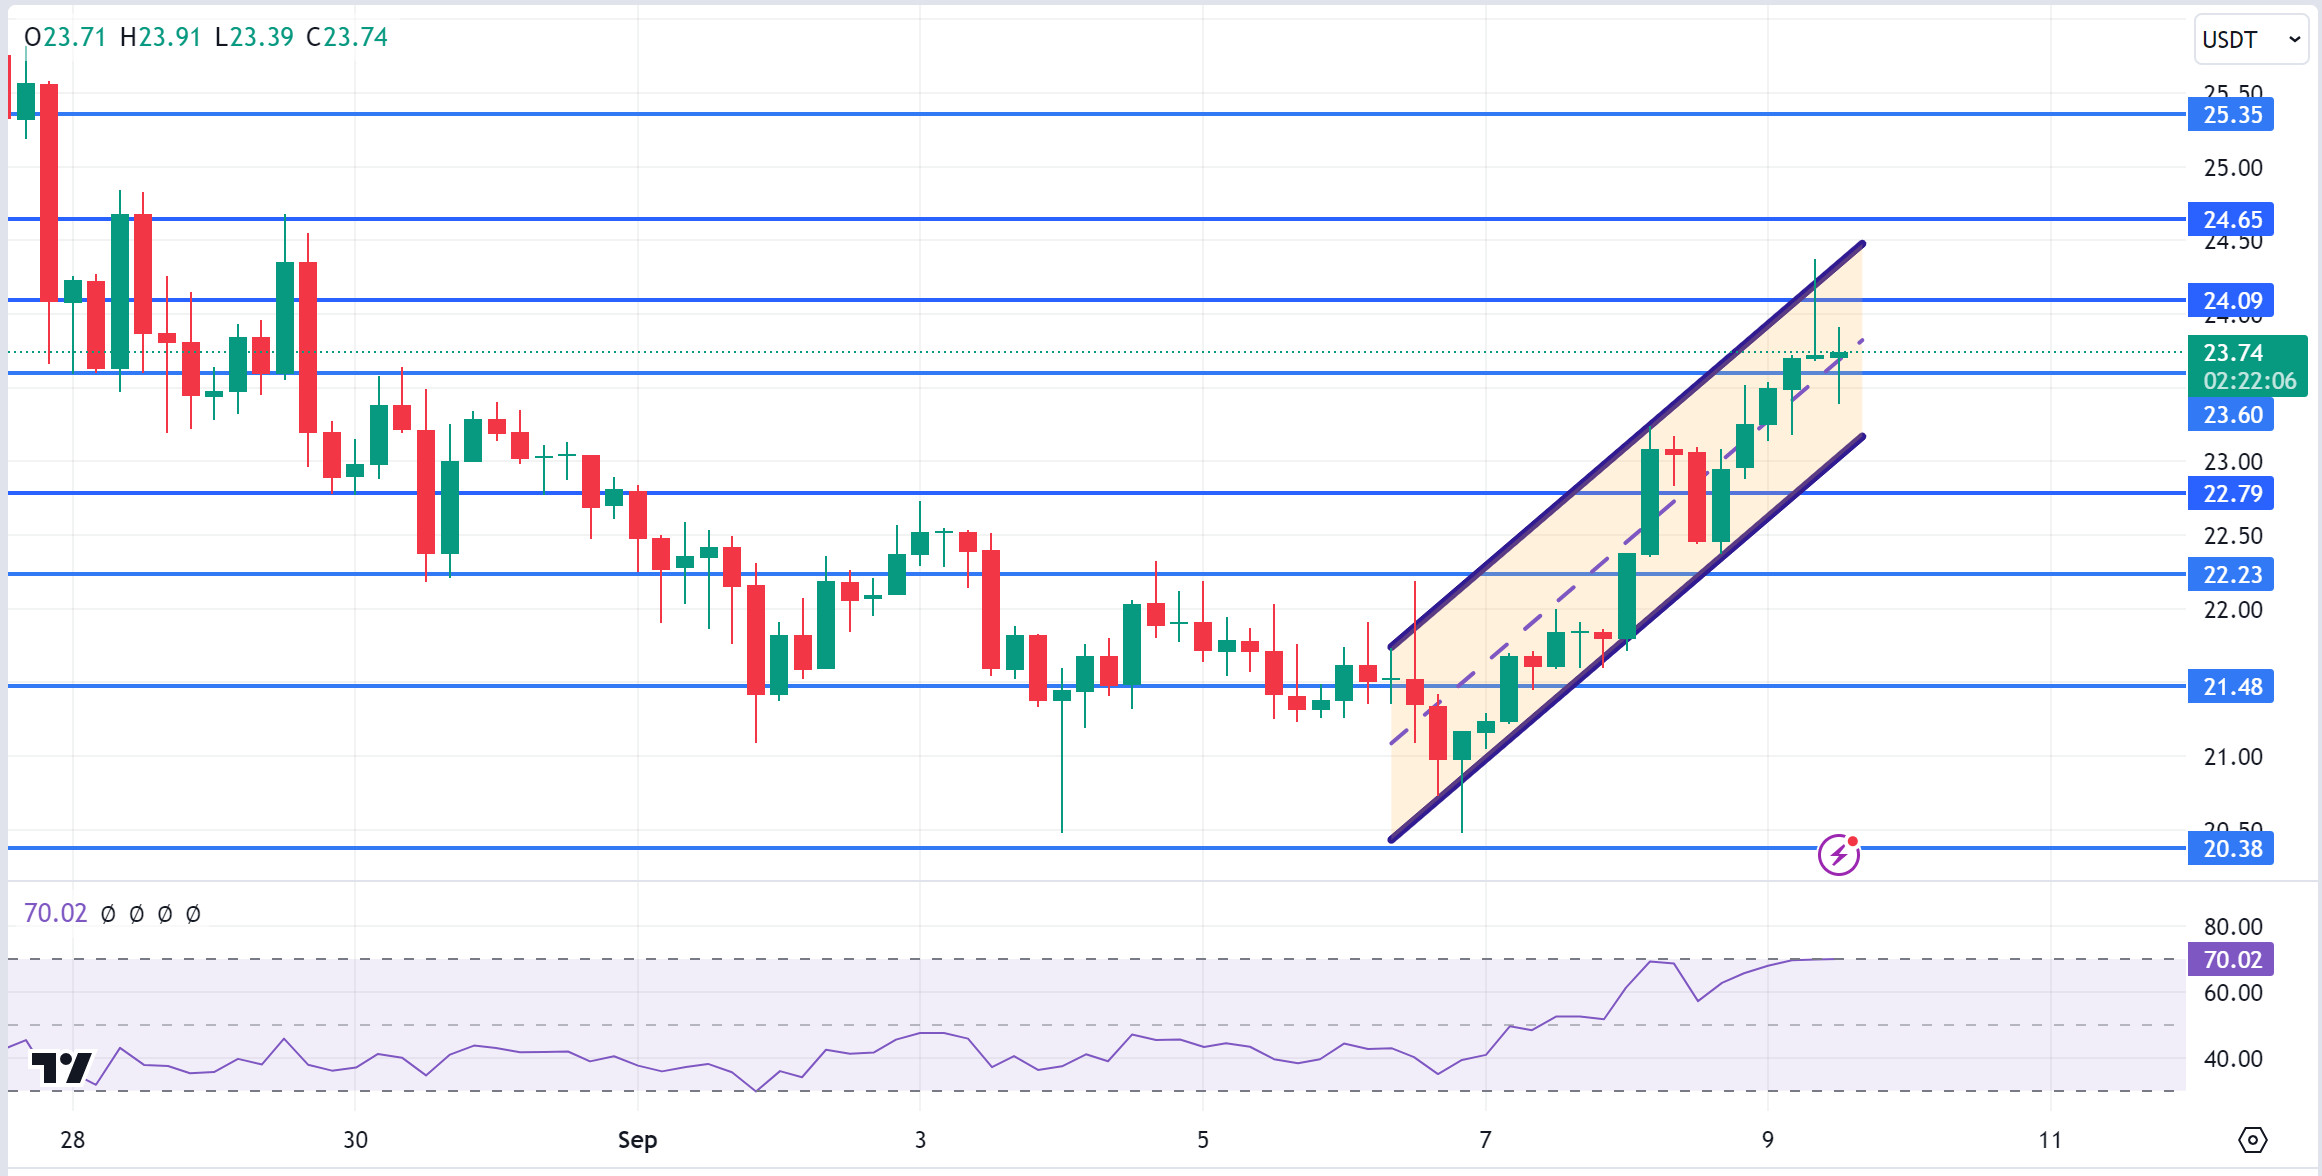
AVAX, which opened today at 23.25, is trading at 23.74, up about 2% during the day.
Since there is no important data flow planned today, we may encounter low volumes. AVAX is currently moving within the rising channel on the 4-hour chart. It is moving from the middle band to the lower band of the channel and testing the support of 23.60. If it closes the candle under this support, it may test the 22.79 and 22.23 supports. If it rises with the reaction from 23.60 support, it may move towards the upper band of the channel. In such a case, it may test 24.09 resistance. As long as it stays above 20.38 support during the day, we can expect it to maintain its upward demand. With the break of 20.38 support, sales may deepen.
Supports 23.60 – 22.79 – 22.23
Resistances 24.09 – 24.65 – 25.35
TRX/USDT
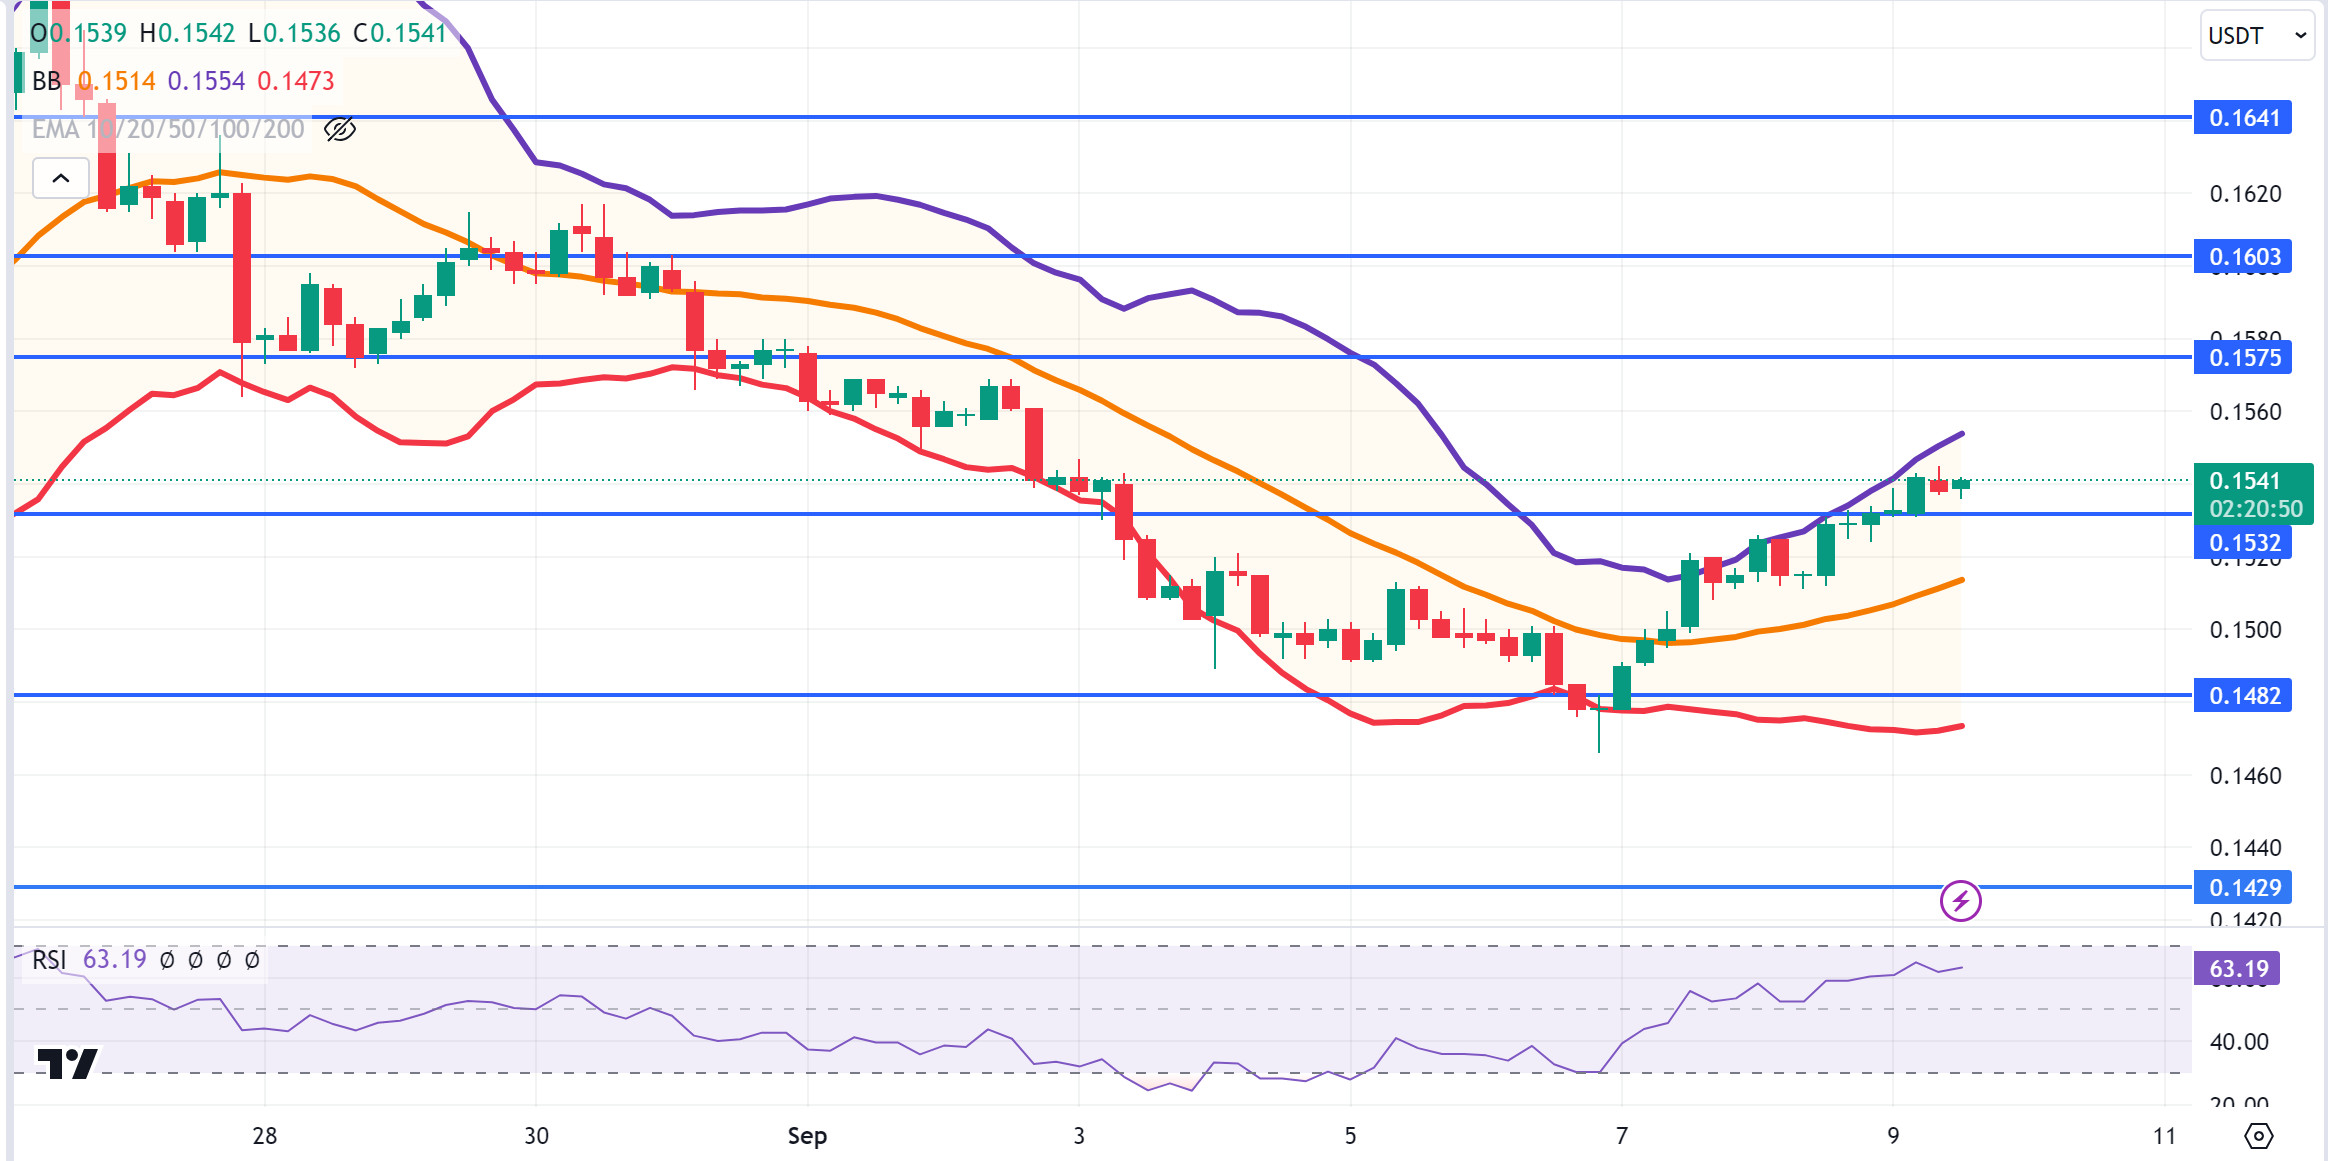
TRX, which started today at 0.1532, is trading at 0.1541 after the positive opening of the US stock markets. Today, we see limited movements as it is a quiet day in terms of planned data. On the 4-hour chart, Bollinger is in the upper band and the RSI value is near the overbought zone with 63. Some further rise can be expected from this zone. In such a case, 0.1575 resistance can be tested. However, if there is a sales reaction from the upper Bollinger band, it may move towards the middle and lower band. In such a case, it may want to test the 0.1482 resistance. As long as TRX stays above 0.1482 support, it can be expected to continue its upward demand. If this support breaks down, selling pressure may increase.
Supports 0.1532 – 0.1482 – 0.1429
Resistances 0.1575 – 0.1603 – 0.1641
XRP/USDT
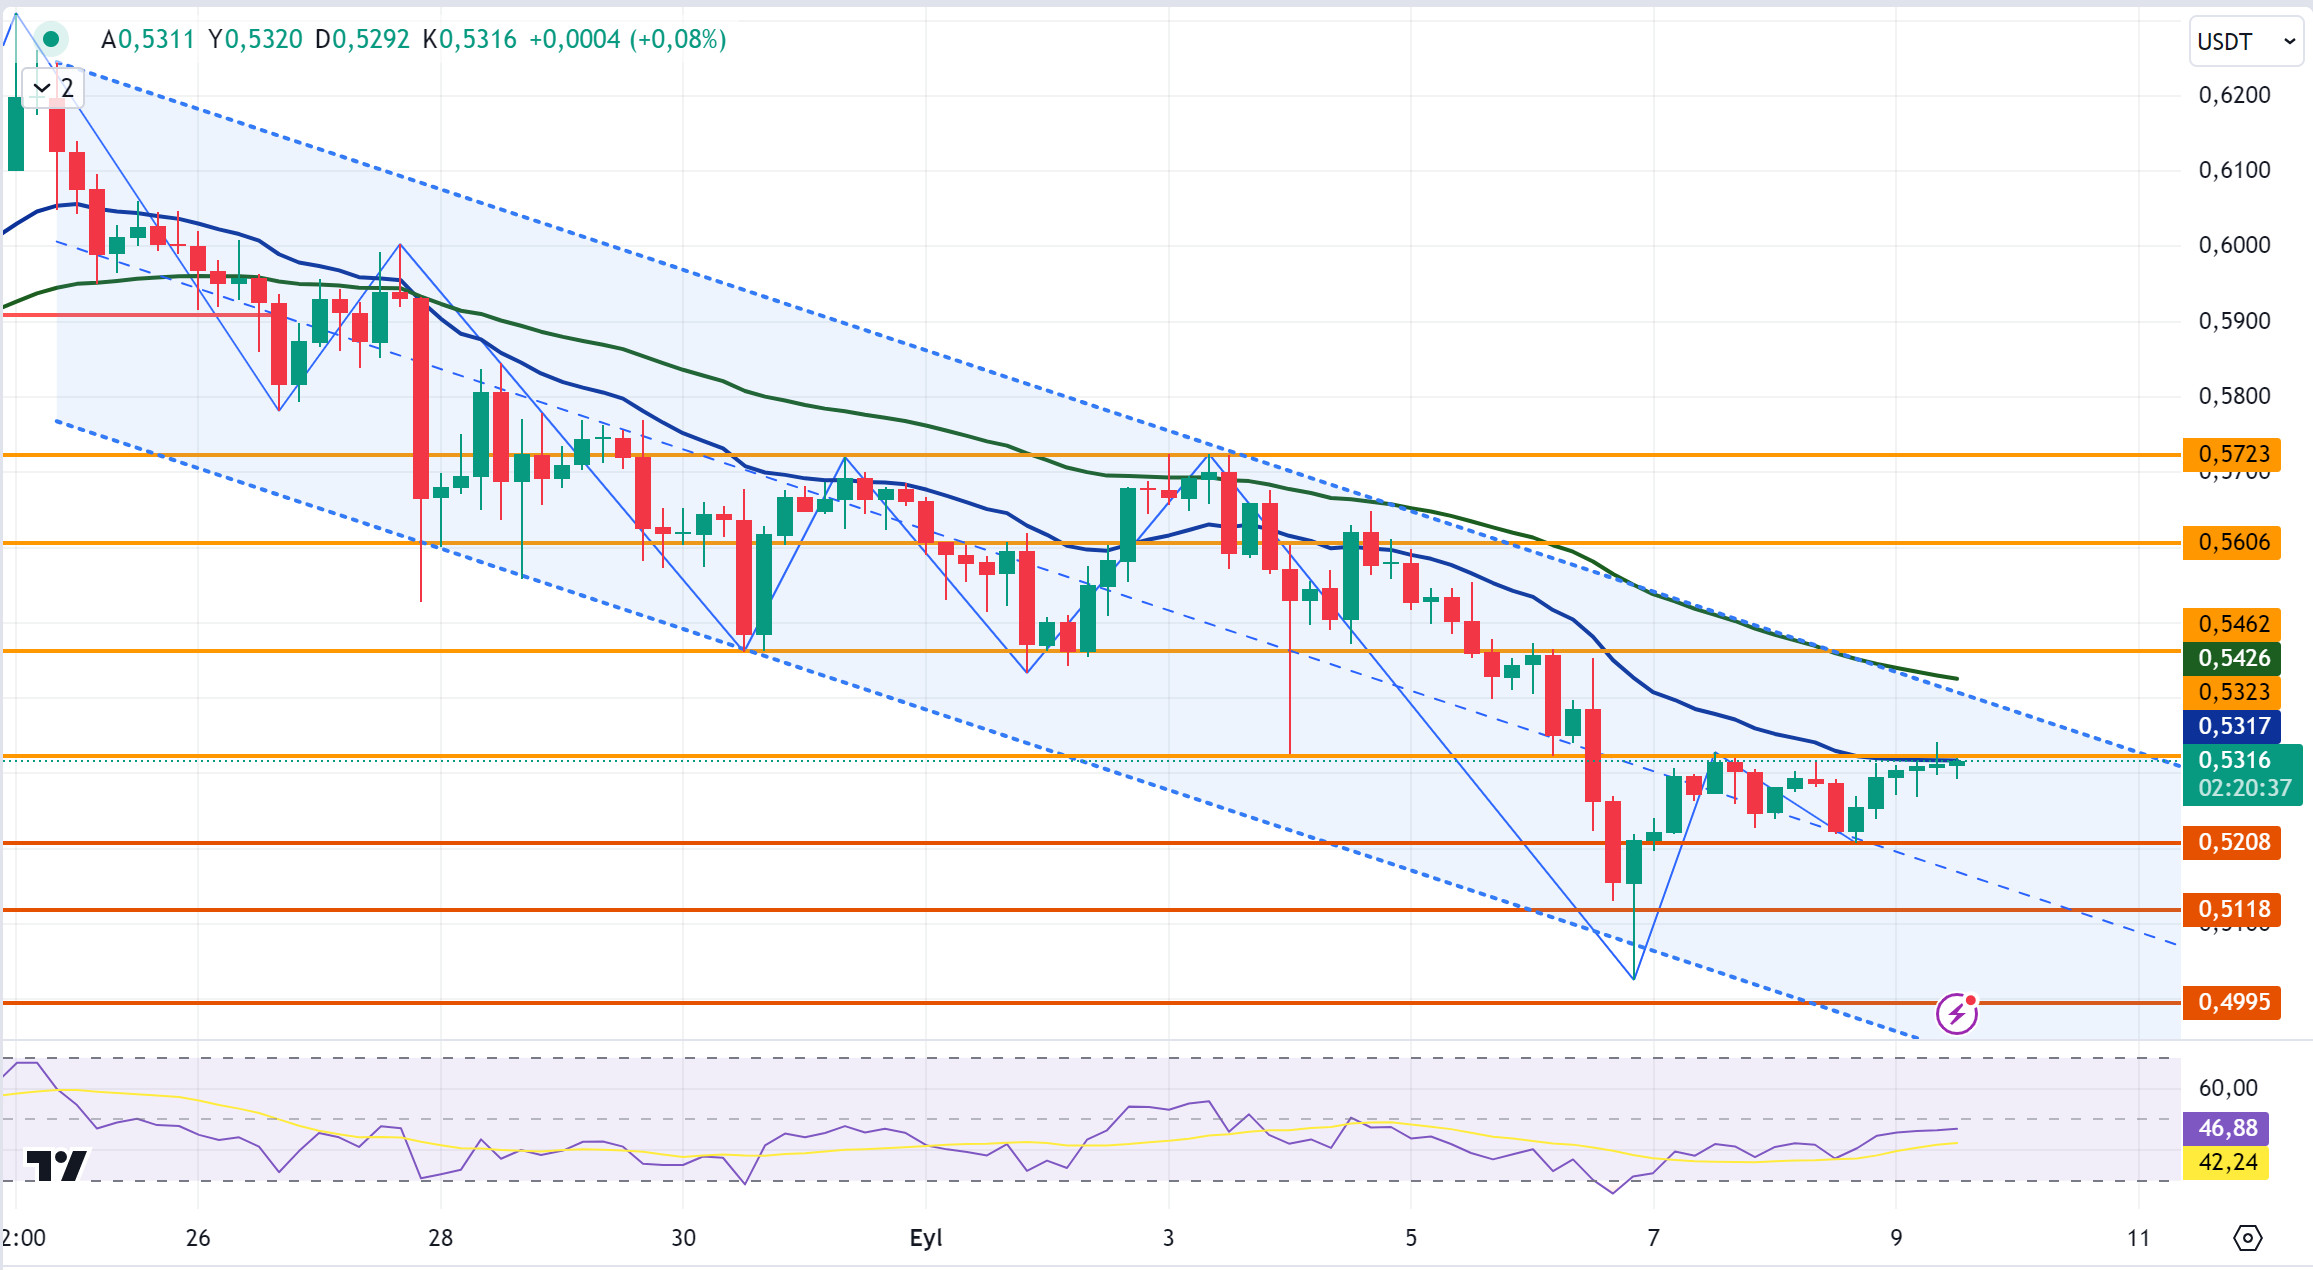
XRP continues to move in a horizontal band in the 4-hour analysis. XRP, which started today at 0.5292, is currently trading at 0.5316.
When we examine the 4-hour analysis, XRP is in an upward trend and its rise has paused at this level due to the reaction at the EMA20 (Blue Color) level during its rise. XRP, which has tested the EMA20 level more than once today, may test the resistance levels of 0.5323-0.5462-0.5606 if it breaks the level in question. Otherwise, with the increase in possible reactions, the upward trend may reverse and decline and test the support levels of 0.5208-0.5118-0.4995.
In the scenario that there is no XRP-specific development ahead of the economic data to be released by the US on Wednesday, XRP may move within the horizontal band it forms. In this process, reaction purchases that may come on declines towards the 0.5118 support level may offer a long trading opportunity. Similarly, reaction sales that may come on rises towards the 0.5462 level may offer a short trading opportunity.
Supports 0.5208 – 0.5118 – 0. 4995
Resistances 0.5323 – 0.5462 – 0.5606
DOGE/USDT
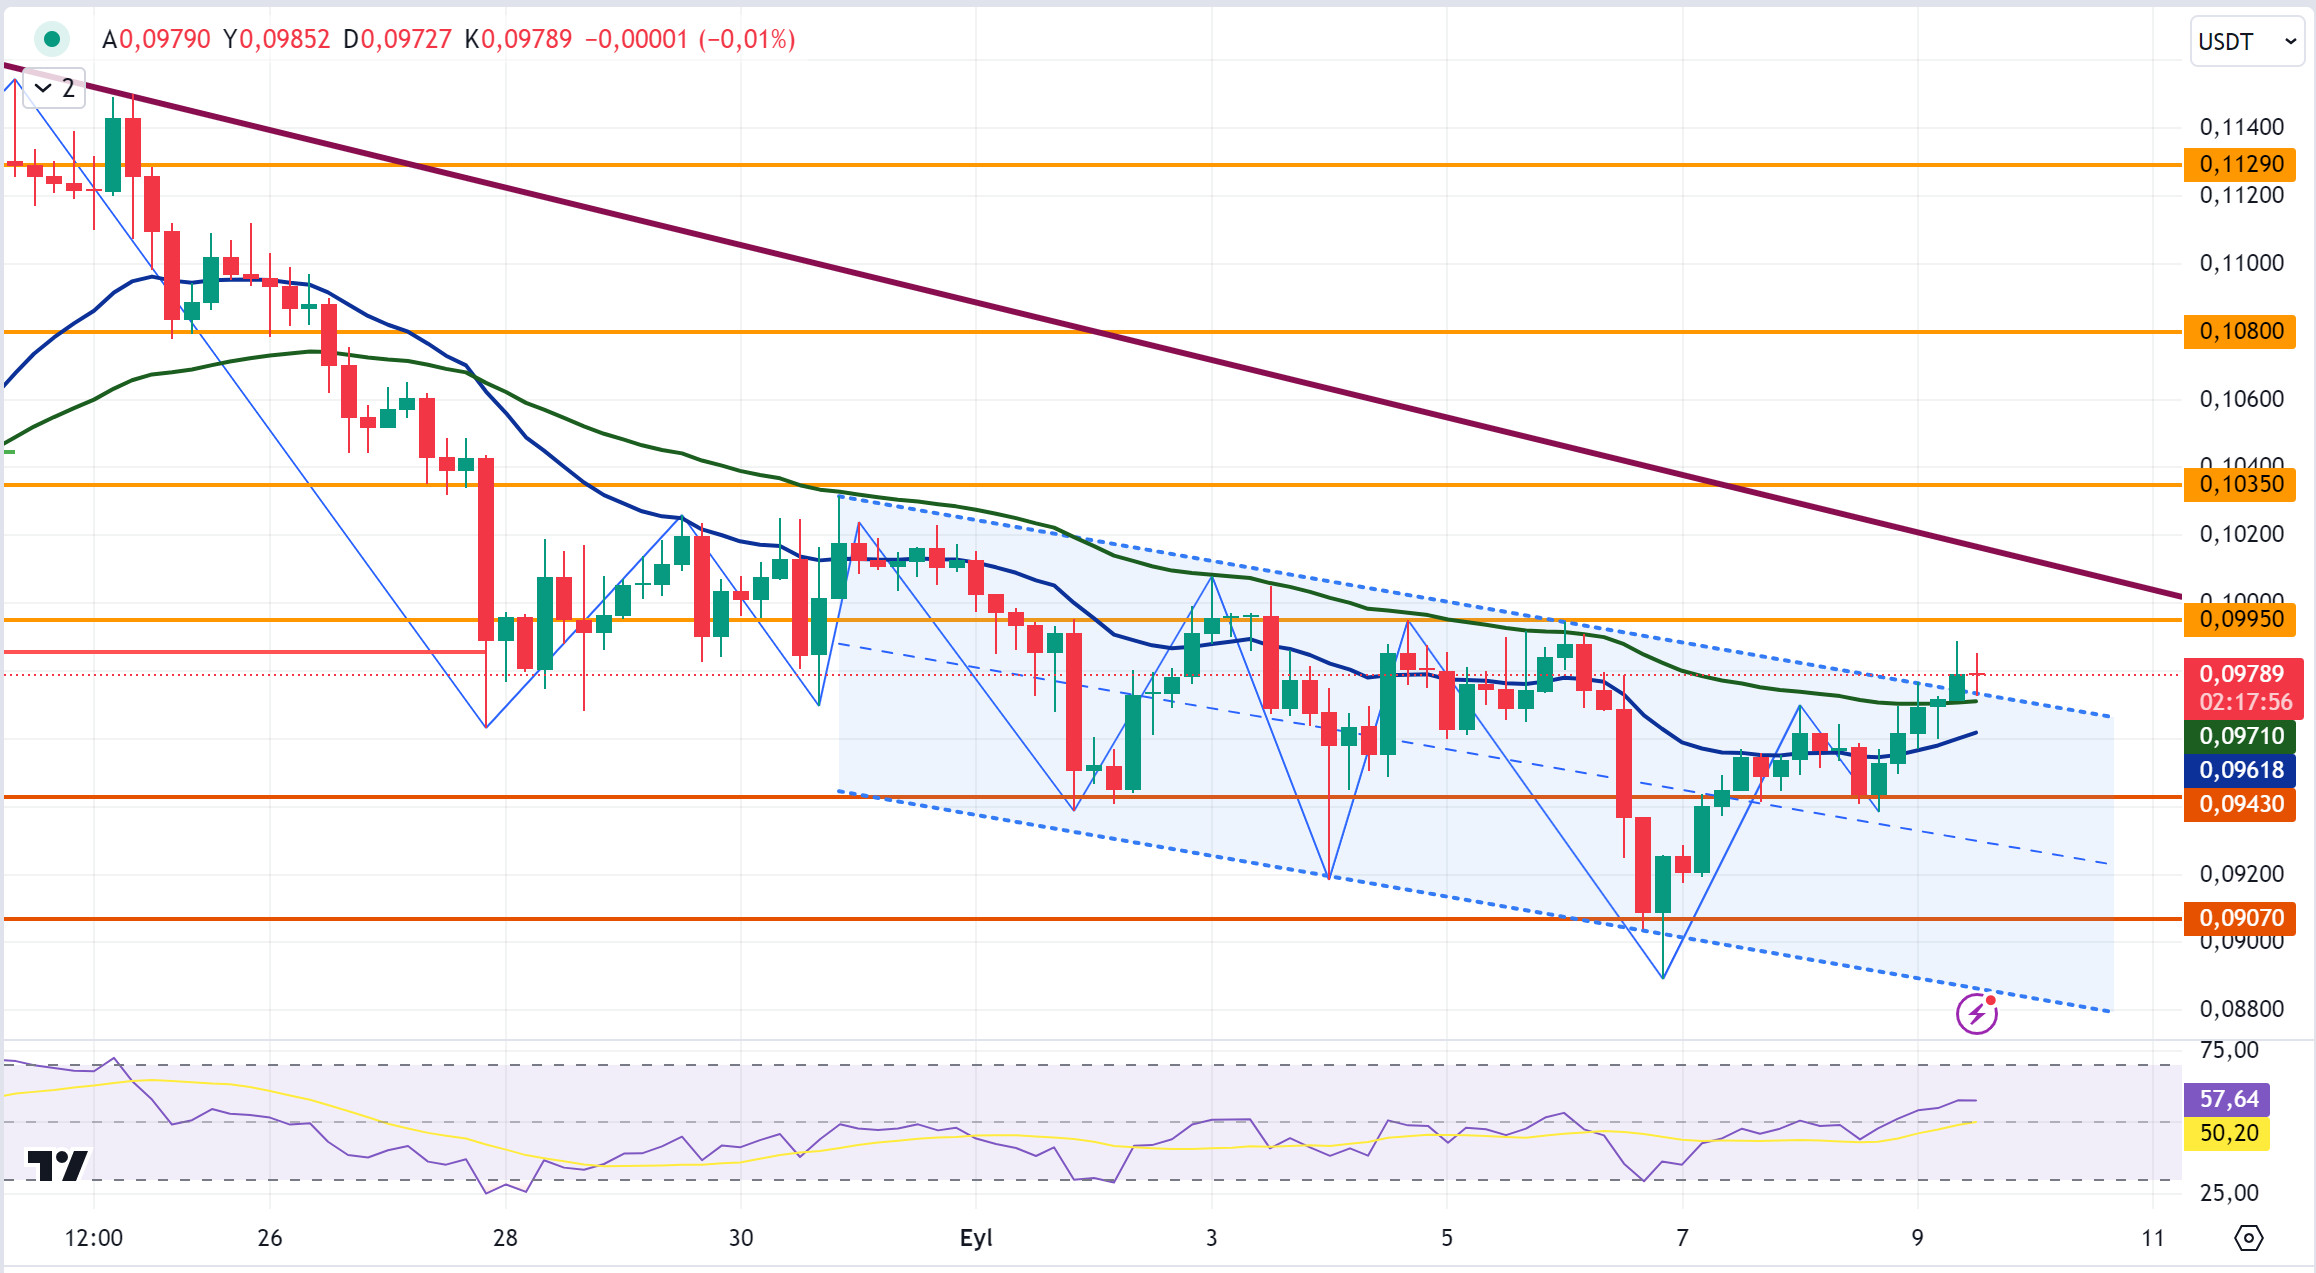
DOGE, which started today at 0.0960, saw a 1.8% increase in value with the rise and currently DOGE continues to trade at 0.0971.
When we examine the 4-hour analysis, we can see that when DOGE, which is in a downtrend, has been in an upward trend, the EMA50 (Green Color) level has come to the fore as resistance in recent weeks, and with the reaction sales at this level, the rise reversed and declined. In the 4-hour analysis, DOGE, which tested the EMA50 level on yesterday’s closing and today’s opening candle, broke the resistance level and is currently trading above the EMA50 level. If the rise in DOGE continues after breaking this level, which seems critical, it may test the resistance levels of 0.0995-0.1035-0.1080. In the event that it declines with the selling pressure that may come after negative developments and news and the upward trend ends, DOGE may fall below the EMA50 level again and test the support levels of 0.0943-0.0907-0.0855 if the decline continues.
Supports 0.0943 – 0.0907 – 0.0855
Resistances 0.0995 – 0.1035 – 0.1080
DOT/USDT
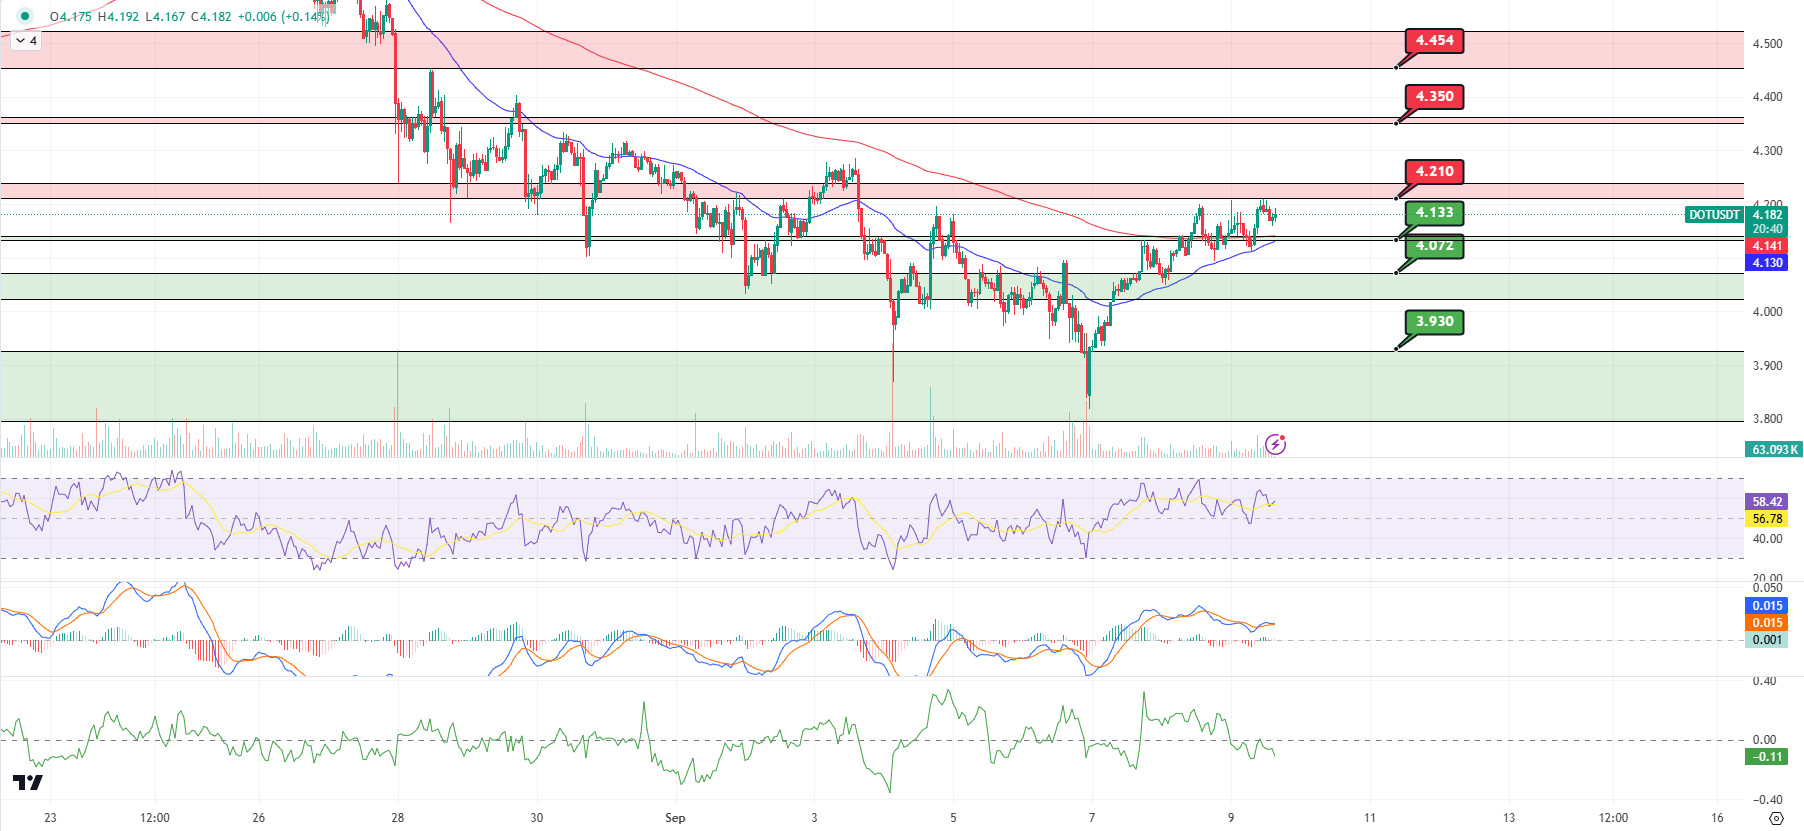
Polkadot (DOT) retested the 4.210 levels again after maintaining above the 4.133 level we mentioned in our previous analysis. When we analyze the MACD, we can say that the buyer pressure has decreased compared to the previous hour. The CMF (Chaikin Money Flow) oscillator is negative. If the seller pressure continues, the first support range of the price may be 4.133 levels. In the positive scenario, if the price breaks the selling pressure in the 4,210 band, the price may rise to the resistance level of 4,350.
(Blue line: EMA50, Red line: EMA200)
Supports 4,133 – 4,072 – 3,930
Resistances 4.210 – 4.350 – 4.454
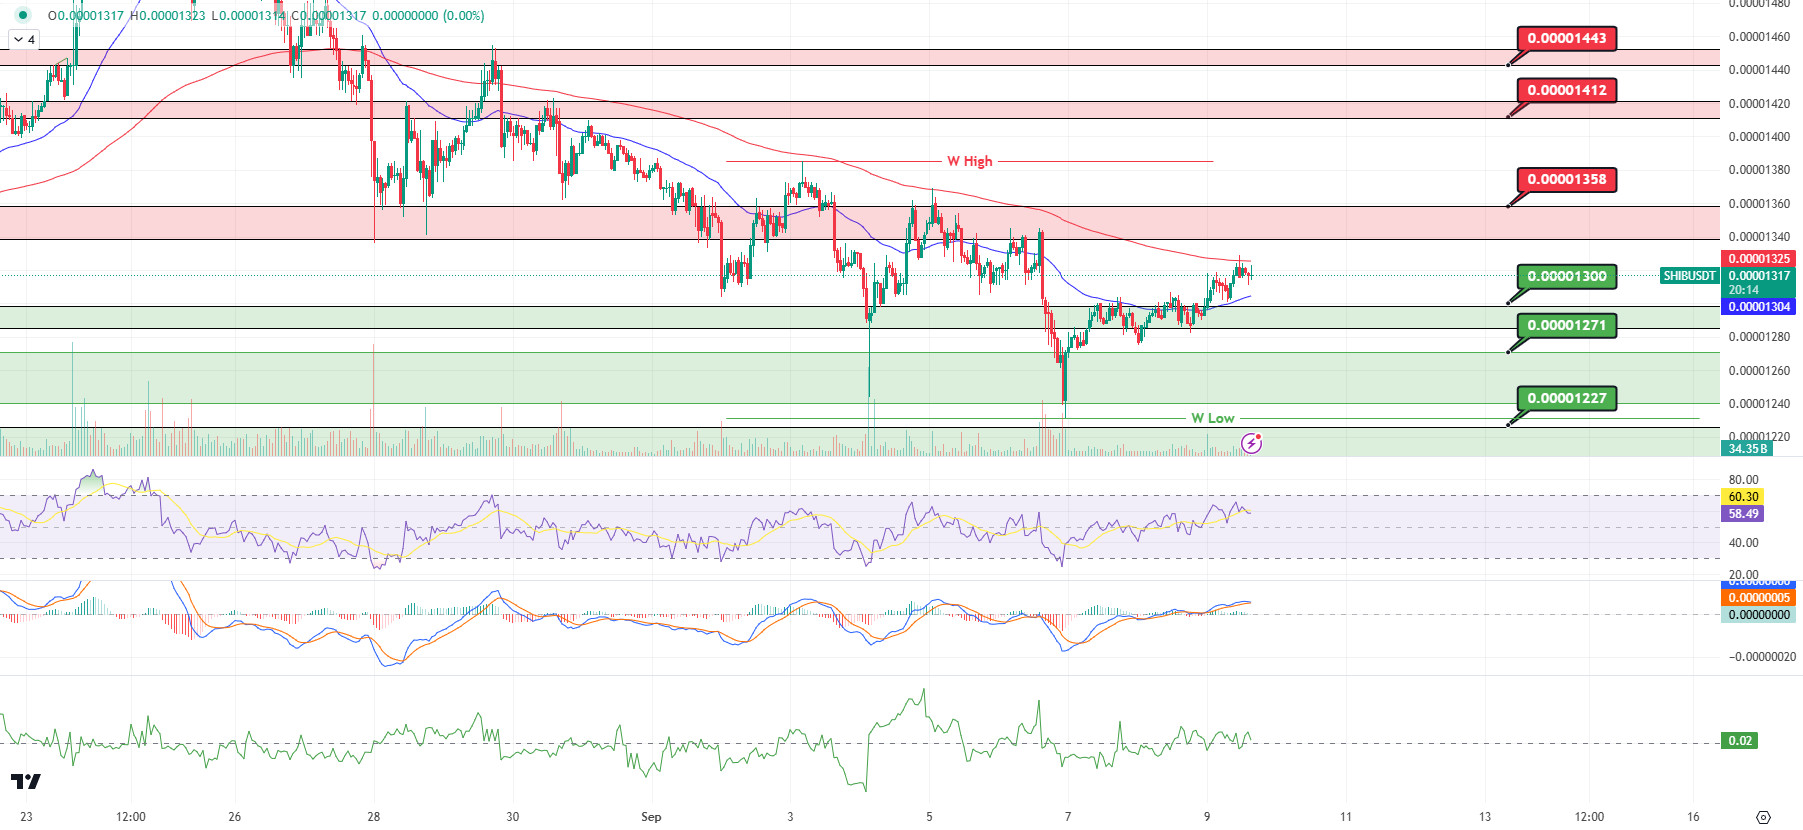
SHIB/USDT
When we examine the chart of Shiba Inu (SHIB), it seems that the price rose up to the EMA200 level and was rejected from this level. On the MACD, we can see that the buyer pressure is decreasing. In a negative scenario, the price may retreat to the first support level of 0.00001300. When we examine the CMF (Chaikin Money Flow) indicator, we see that the buyer pressure continues. In the positive scenario, if the price maintains above the EMA200, the price may move towards the first resistance level of 0.00001358.
(Blue line: EMA50, Red line: EMA200)
Supports 0.00001300 – 0.00001271 – 0.00001227
Resistances 0.00001358 – 0.00001412 – 0.00001443
LEGAL NOTICE
The investment information, comments and recommendations contained herein do not constitute investment advice. Investment advisory services are provided individually by authorized institutions taking into account the risk and return preferences of individuals. The comments and recommendations contained herein are of a general nature. These recommendations may not be suitable for your financial situation and risk and return preferences. Therefore, making an investment decision based solely on the information contained herein may not produce results in line with your expectations.
