MARKET SUMMARY
Latest Situation in Crypto Assets

*Prepared on 28.08.2024 at 07:00 (UTC)
WHAT’S LEFT BEHIND
Bitcoin Price Drops Below 58 thousand Dollars
Bitcoin hit 58 thousand dollars with a sharp decline in the night hours. Altcoins suffered deeper losses. Bloomberg ETF analyst James Seyffart wrote that he likened the last six months of price action in Bitcoin to the period between mid-2019 and early 2020. Market analysts say a number of factors have contributed to the decline, including technical indicators and seasonal influences. Some believe that the decline may have been driven by the fall in US stocks on August 27.
Vitalik Buterin Reveals How Much of His Fortune He Keeps in Ethereum
In a recent discussion, Ethereum co-founder ‘Vitalik Buterin’ revealed that 90% of his personal wealth is held in Ethereum (ETH). This statement came in response to growing speculation that the Ethereum Foundation (EF) is continuously selling ETH, as well as discussions within the Ethereum community regarding ETH’s role as a store of value (SOV).
A New Era Begins for Ethereum on the Brazilian Stock Exchange
BlackRock is taking important steps to integrate cryptocurrencies into traditional finance. As the company prepares to trade its Ethereum ETF on Brazil’s B3 exchange, this step offers new opportunities to global investors. While Brazil is a fast-growing market, BlackRock’s move is seen as an important milestone for investors in the region.

INFORMATION
The calendar is based on UTC (Coordinated Universal Time) time zone. The economic calendar content on the relevant page is obtained from reliable news and data providers. The news in the economic calendar content, the date and time of the announcement of the news, possible changes in the previous, expectations and announced figures are made by the data provider institutions. Darkex cannot be held responsible for possible changes that may arise from similar situations.
MARKET COMPASS
After Powell’s speech at Jackson Hole, the rises in global markets, supported by the increase in risk appetite, had slowed down in recent days. Yesterday, the three major US indices ended the day in the green by very small margins and this morning Asian indices are positive. European stock markets are also expected to start the day on a bullish note.
In traditional markets, a summary like the one above might suggest that the overall mood is positive. But it is not, and the situation in digital assets in particular is worse with the recent price action. Crypto assets suffered losses last night and have fallen back to almost the same price levels as before Powell’s speech. It would not be correct to say that there is a clear reason or news flow for this sharp decline. However, there have been hints that the fragility in risk appetite has started to return. Today, Nvdia’s balance sheet will be announced, and investors are a bit concerned that the best-case scenario has been priced in. In line with this, they may have thought it would be reasonable to reduce the money on the table a little bit.
According to the Bloomberg survey, Nvidia, whose sales level, especially related to artificial intelligence technology, is curious, is expected to announce a profit of $0.65 per share and record a revenue growth of more than 70%. It is estimated that we will see sales revenue realized at 31.85 billion dollars. We can say that volatility will increase in the market as soon as the balance sheet is announced.
TECHNICAL ANALYSIS
BTC/USDT
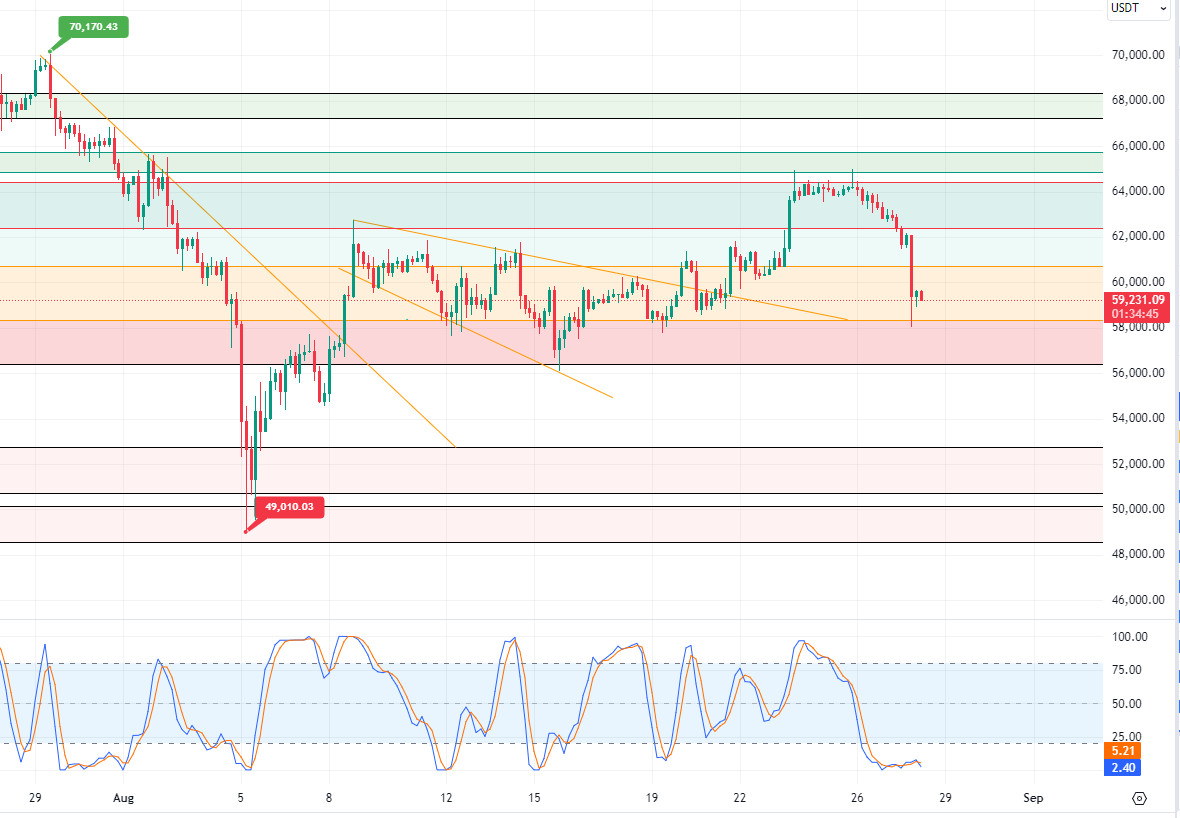
Liquidation time in Bitcoin! Bitcoin, which rose more than 10% last week to 65,000, erased all its gains and fell sharply to below 58,000. The lack of any news in the macroeconomic agenda is the point that makes investors think about the reason for the decline and causes them to have a question mark in their minds. If we look at the reasons behind the decline, according to some authorities, the seasonal cycle is said to be the effect of the stock declines in the US market, according to some. However, although the reason for the decline is not known exactly, it would not be wrong to call it a “long liquidation decline” with the liquidity of 160 million dollars of long positions. It may be possible to say that the large transfers to the exchanges we mentioned yesterday also triggered the selling pressure. In the BTC 4-hour technical analysis, first the break of the 62,400-support level, then the rapid crossing of the 61,700 level brought the price momentarily below 58,000. Bitcoin, which then found buyers at these levels, rose towards the 59,400-support level. In the next scenario, our bandwidth in Bitcoin has returned to the levels before the Powell speech and continues to be traded below the psychological resistance zone of 60,000 levels. In order to talk about an upward movement again, we may need to see above these levels, otherwise it should not be forgotten that selling pressure may continue.
Supports 59,400 – 58,300 – 56,400
Resistances 60,650 – 61,700 – 62,400
ETH/USDT
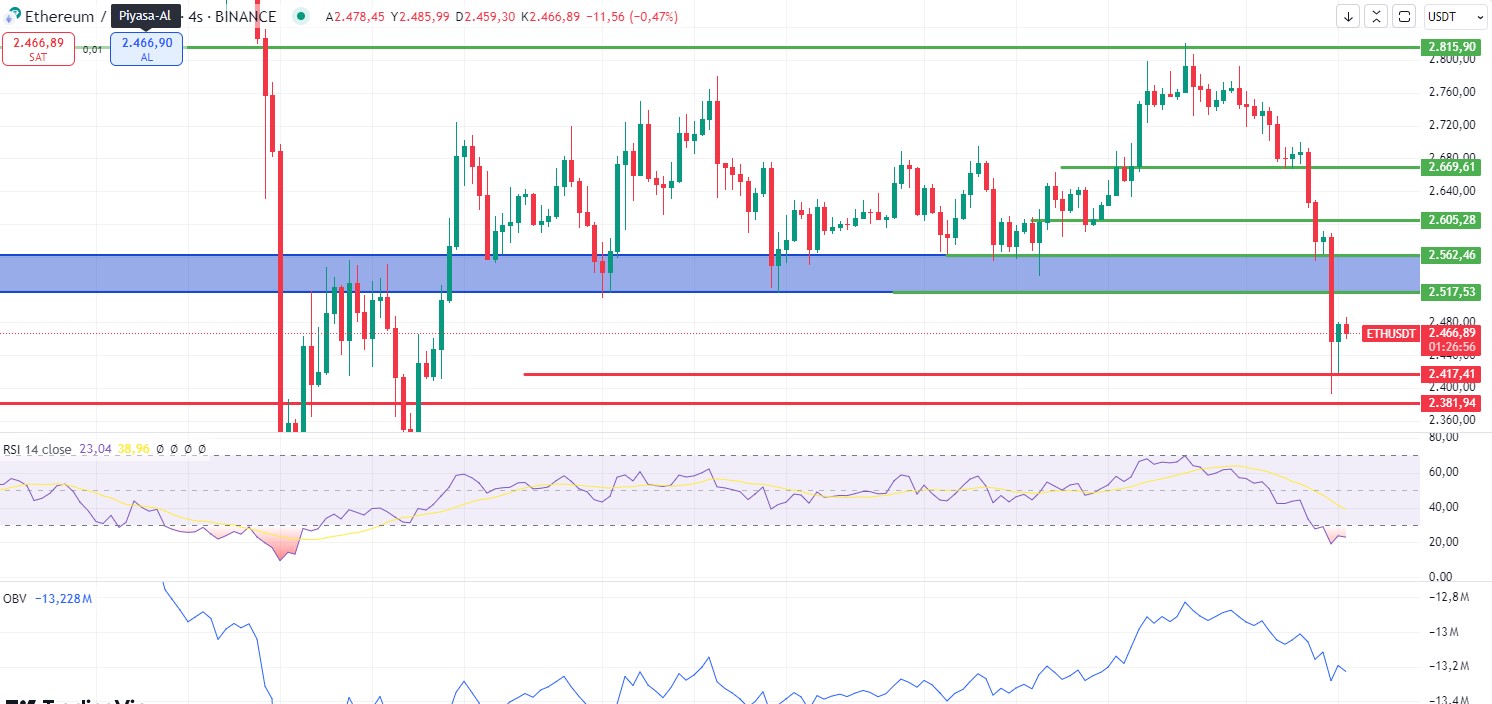
Ethereum’s throne is starting to be shaken. On Ethereum, due to the recent hype around the Tron and Solana networks, the ultimate goal of which is smart contract functionality and onchain side transactions have almost ground to a halt. Major investment firms are selling ETH in their portfolios. Again on the ETF side, Grayscale and Invesco continue to sell. Uniswap liquidity pools are experiencing historic lows. The premarket prices of the Eigen token are constantly falling, and for this reason, locked stakes and restaked ETHs are unstaked and sold on the platform. This has created serious selling pressure. All these reasons combined with the correction in Bitcoin and the main support point of 2,605 was broken, resulting in a major decline. Although the RSI is in oversold territory, technical mismatches are emerging. Considering the net positive mismatches in OBV and MFI and looking at the CVD data, we can expect an accumulation process in the short range (2,418 – 2517) from here.
Supports 2,417 – 2,381 – 2,277
Resistances 2,517 – 2,562 – 2,605
LINK/USDT
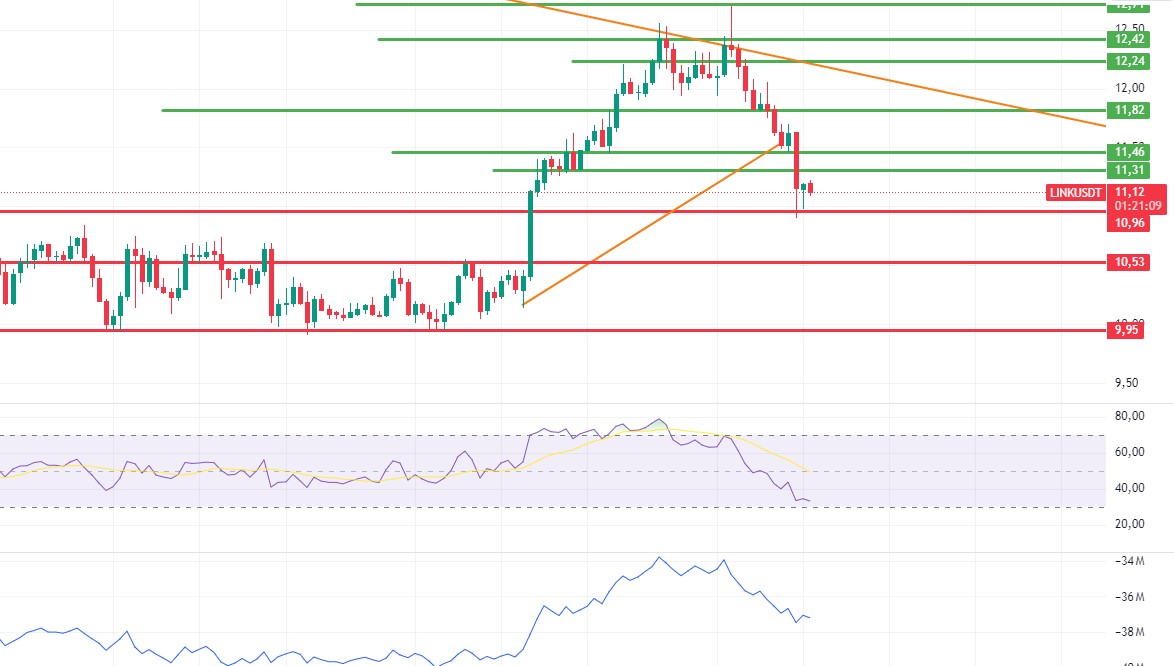
Similar to Ethereum, Link, which experienced a deep decline after losing 11.46 support, has found support at 10.96. With the break of this level, another decline up to 10.53 may come. Gaining 11.31 could start a new uptrend up to 11.82. The positive mismatch in RSI continues. Unless there is a sudden drop in Ethereum, the 10.96 level can be taken as strong support.
Supports 10.96 – 10.53 – 9.95
Resistances 11.31 – 11.46 – 11.82
SOL/USDT
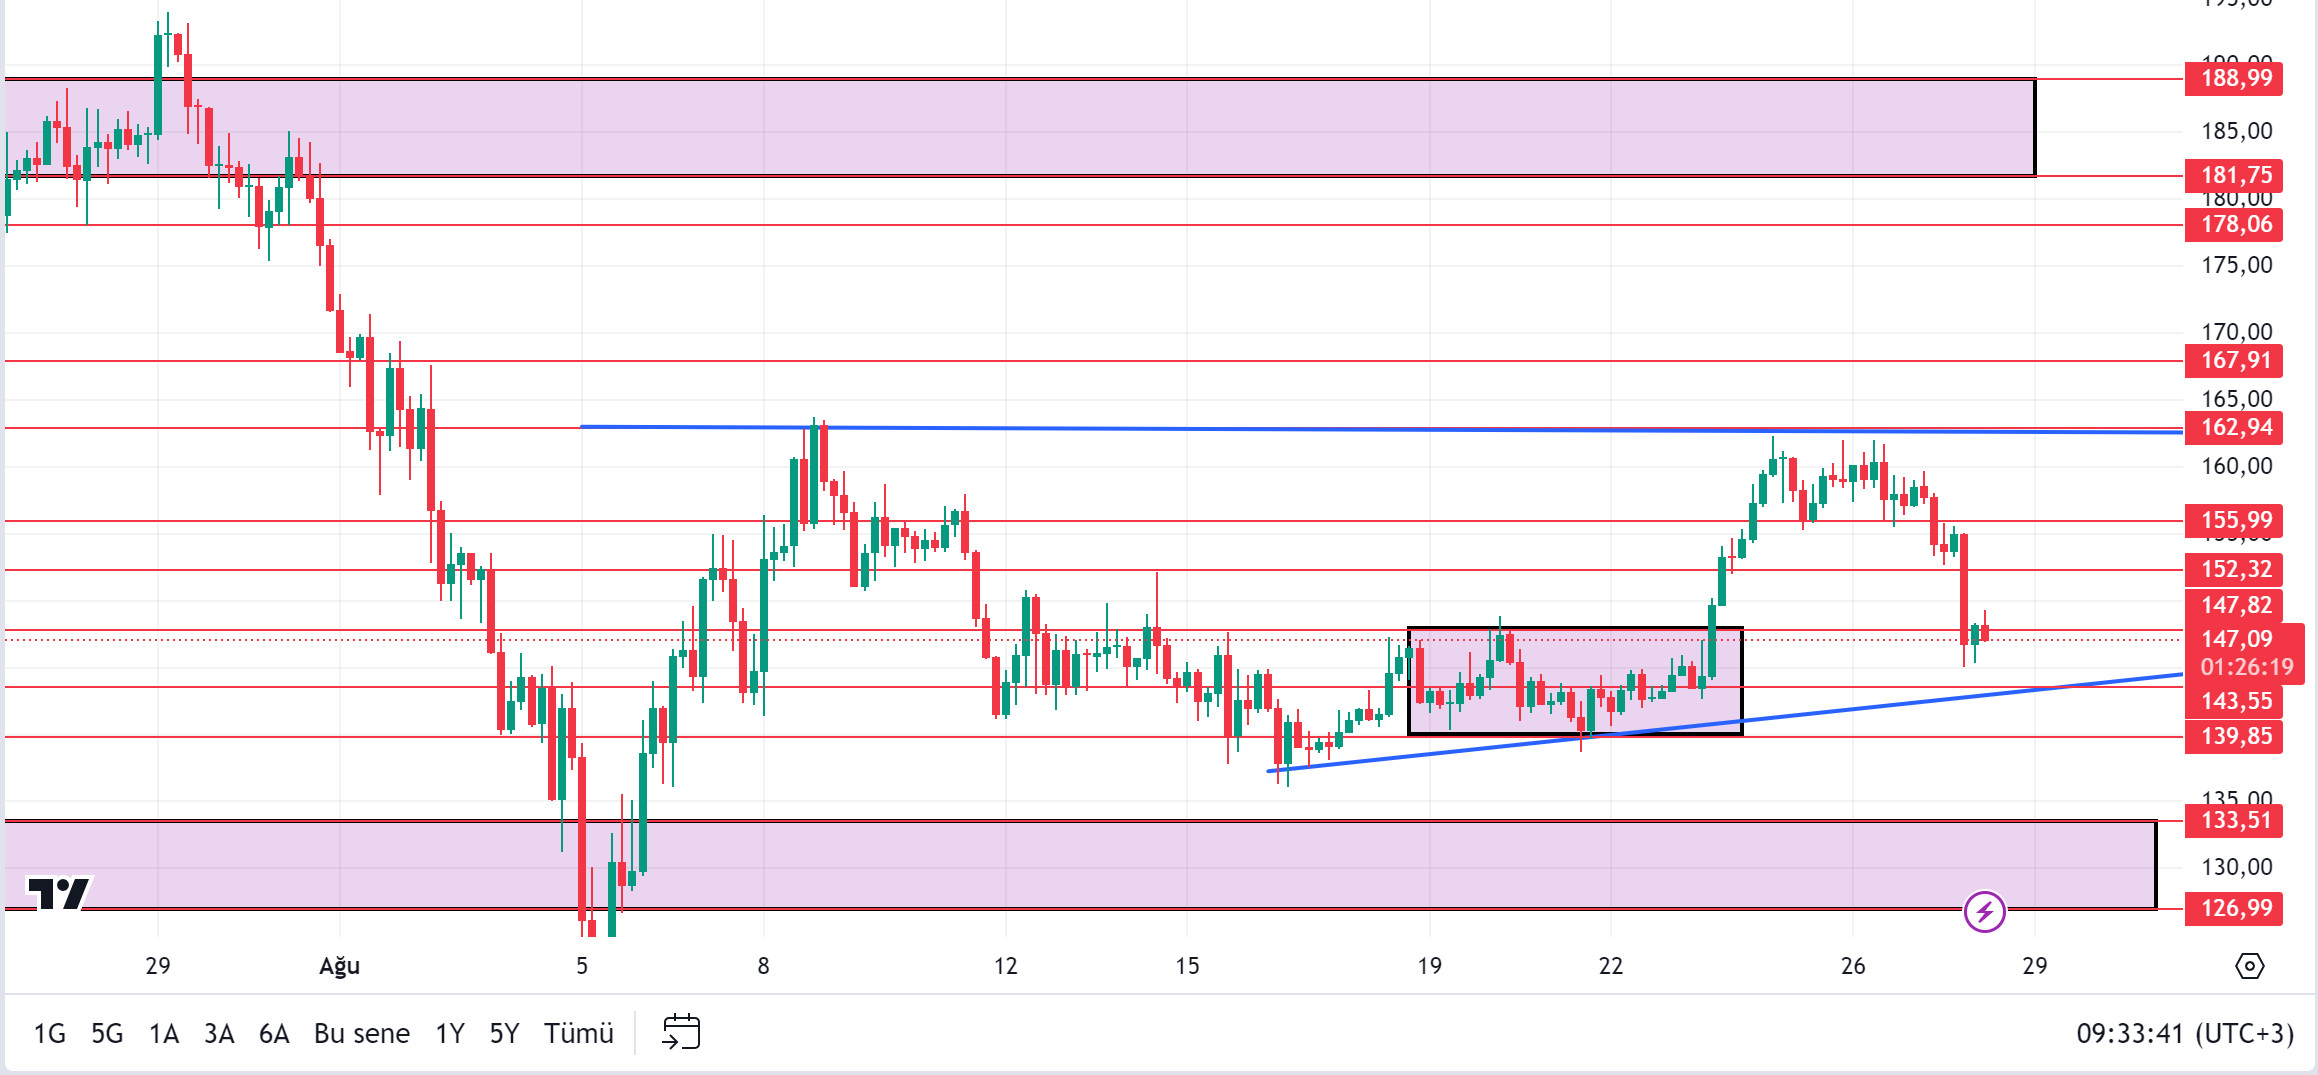
According to data reported by Lookonchain, 240,247 MSOLs worth about $42.5 million were sent to a centralized exchange from a cryptocurrency wallet related to a bankrupt central exchange. This move was characterized as pre-sale preparation. The volume-weighted funding rate decreased from 0.0073% to – 0.0020% when we look at the 8-hour period. On the other hand, in order to evaluate cryptocurrency offers, Robinhood officially included the Solana integration into its wallet services. When we look at the chart, it has declined by 6.91% since yesterday, affected by the decline of BTC. If the BTC-induced decline continues in the market, 143.55 – 139.85 supports should be followed. If the market moves in the opposite direction, it may test the resistance levels 147.82 – 152.32.
Supports 143.55 – 139.85 – 133.51
Resistances 147.82 – 152.32 – 155.99
ADA/USDT
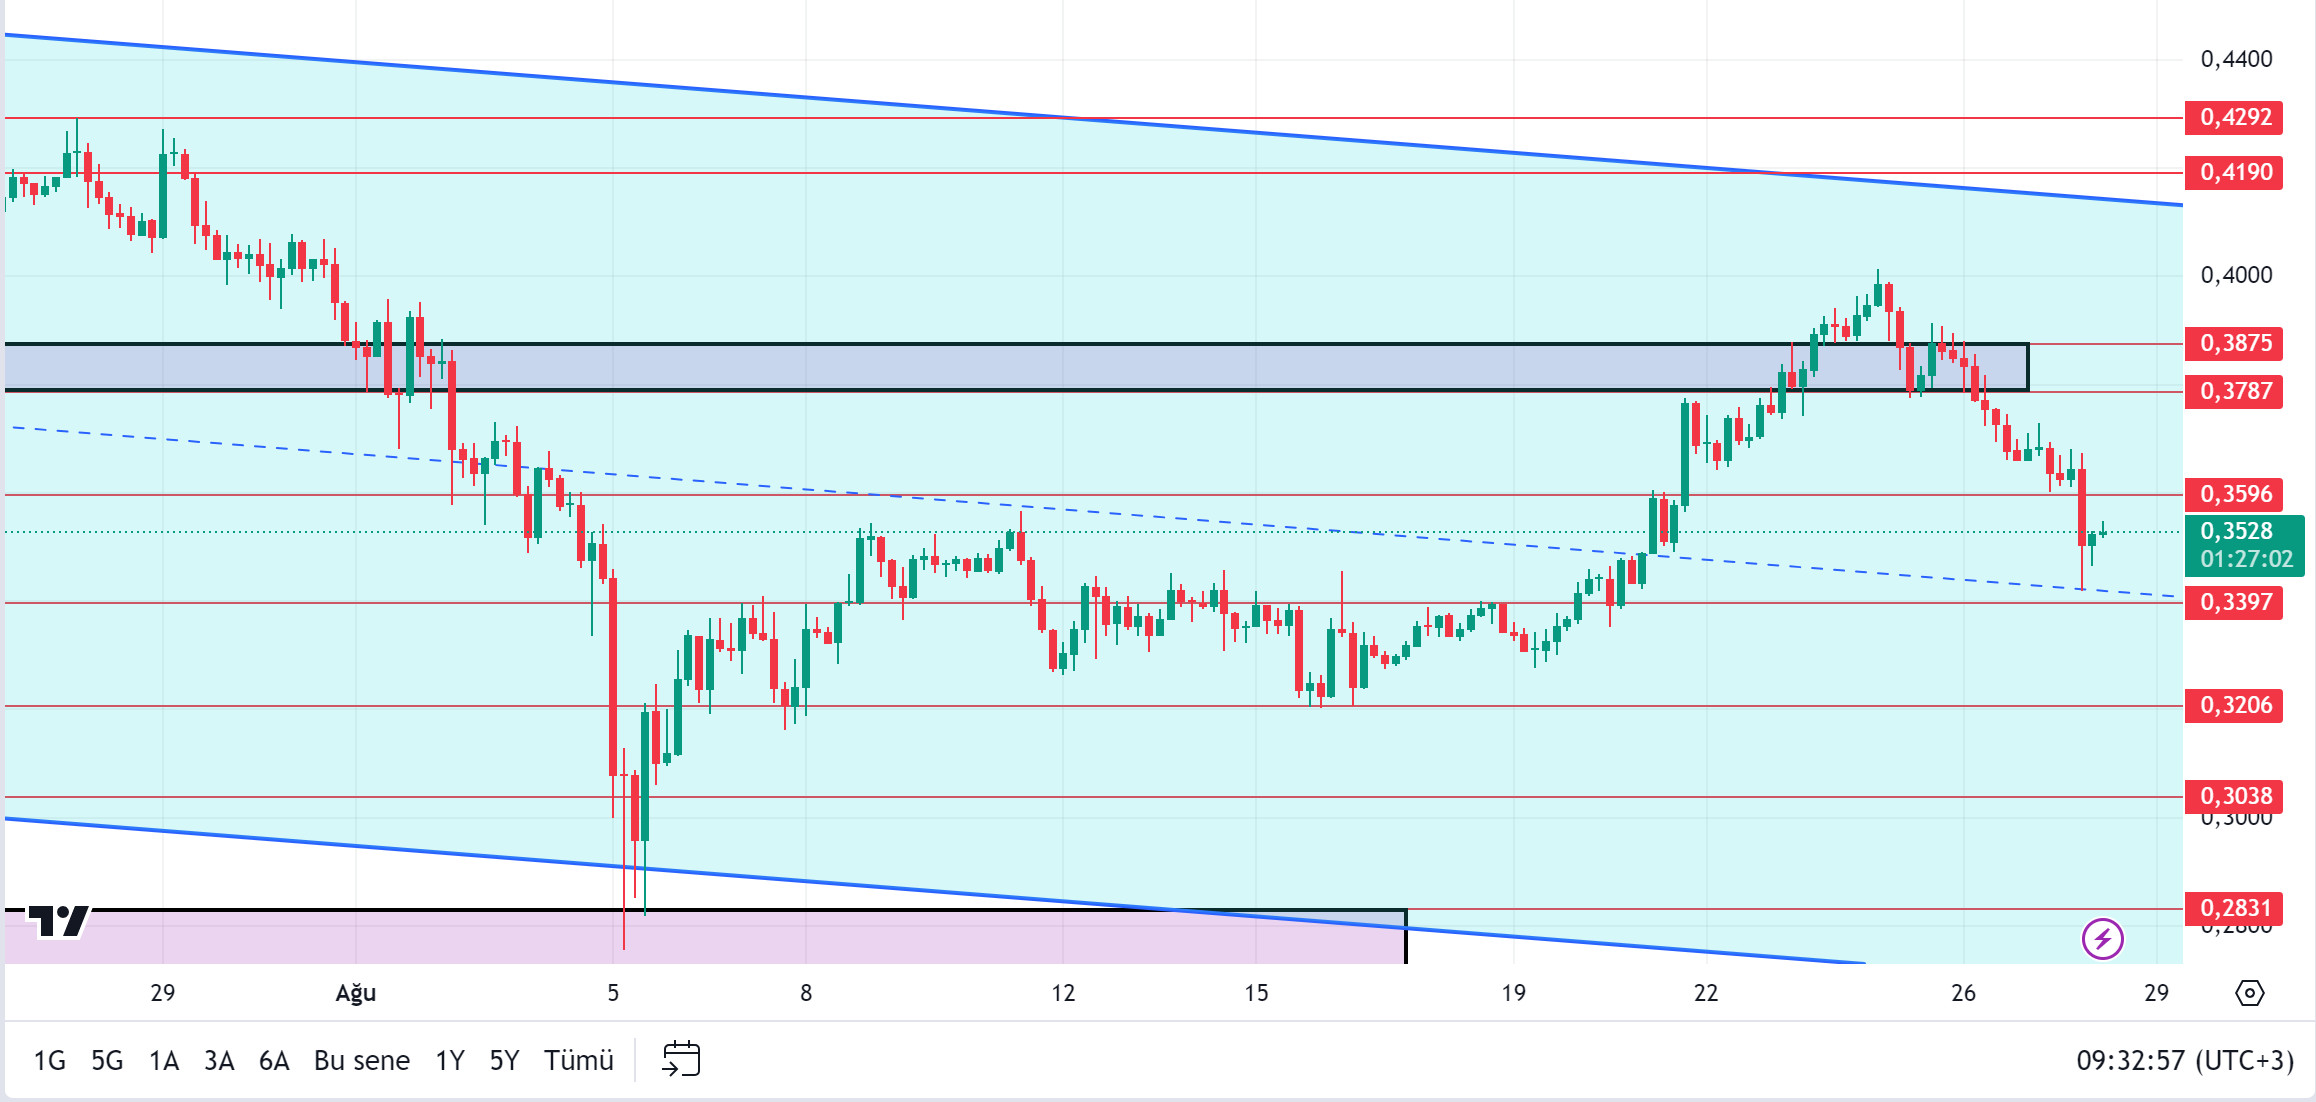
Cardono price is at an important resistance level. Despite this, whale activity and daily active addresses increased, indicating potential accumulation. Cardano saw an increase in the number of whale transactions on August 27. According to data from Santiment , the number of active addresses is steadily increasing. Cardano founder Charles Hoskinson stated on the X platform that he fears the death of the American cryptocurrency industry if Kamala Harris is elected. ADA is currently trading at 0.3528. Assuming that the update is close, 0.3596 – 0.3787 levels can be followed as resistance levels in case of related rises. If investors decide to sell due to the fluctuation of BTC, 0.3397 – 0.3206 levels can be followed as support.
Supports 0.3397 – 0.3206 – 0.3038
Resistances 0.3596 – 0.3787 – 0.3875
AVAX/USDT
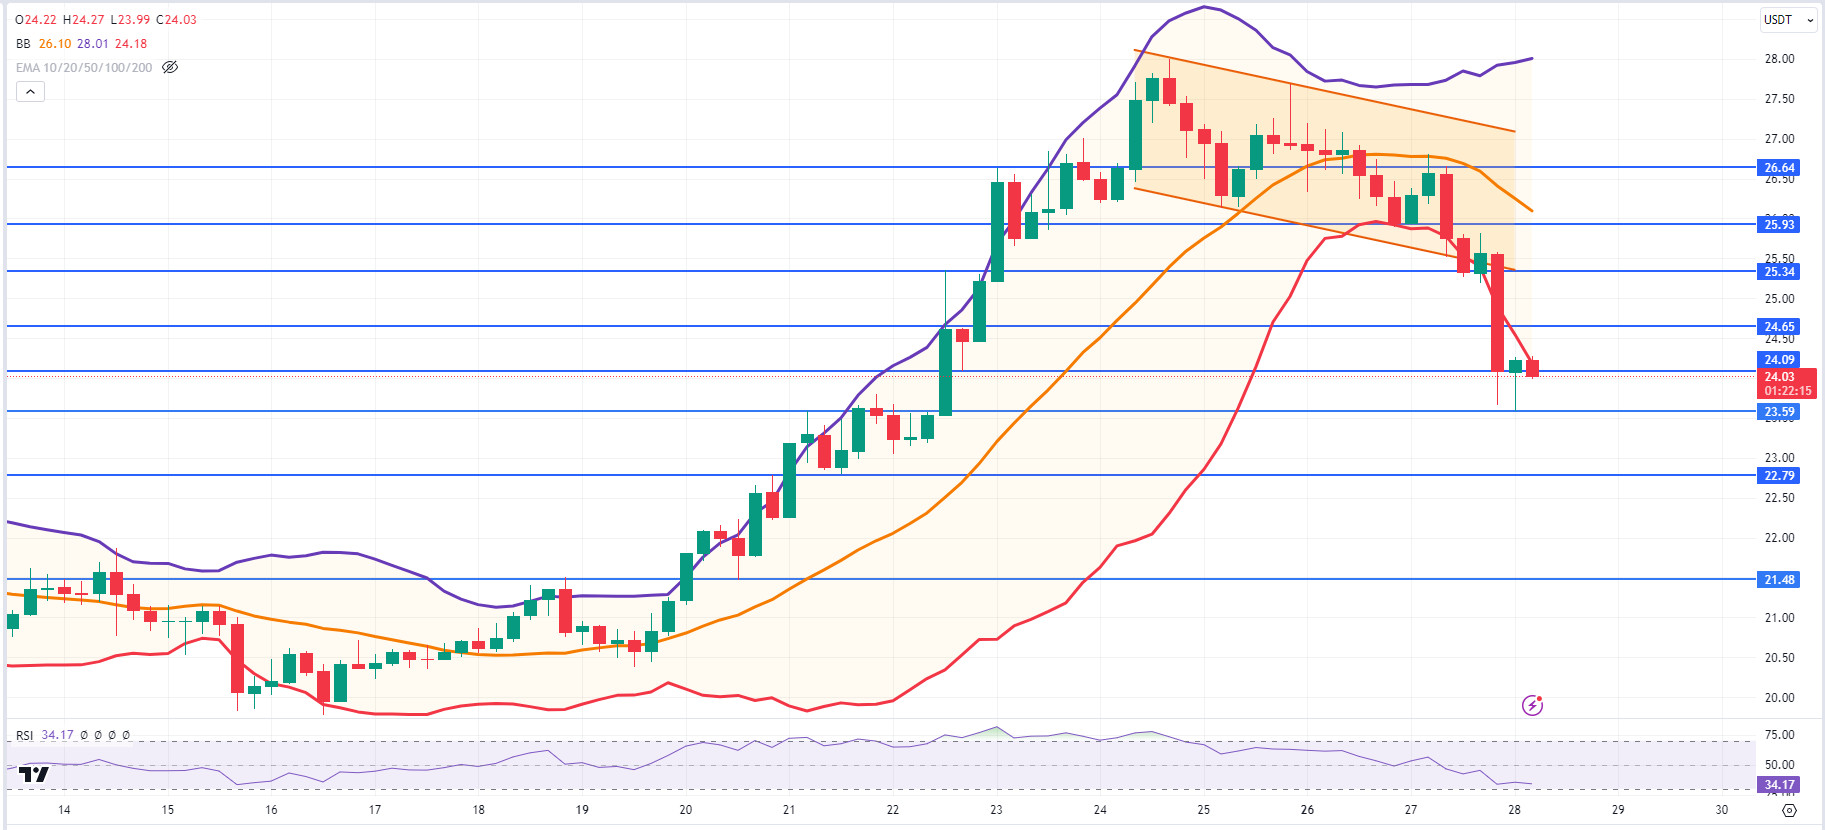
AVAX, which opened yesterday at 25.94, closed at 24.09 with a decline of about 7% with the selling pressure coming in the night hours. It tried to break the support of 24.09 by breaking the lower band of the falling channel downwards but could not break it with the reaction from here. AVAX, currently trading at 24.03, moves in the Bollinger lower band on the 4-hour chart. The RSI has approached the oversold zone with a value of 34, and if the RSI goes below 30 and continues to be in the Bollinger lower band, we can expect a buying reaction. If such a buy comes, it may test the 24.65 and 25.34 resistances. If there is no buying and the decline continues, it may test the 23.59 and 22.79 supports.
Supports 24.09 – 23.59 – 22.79
Resistances 24.65 – 25.34 – 25.93
TRX/USDT
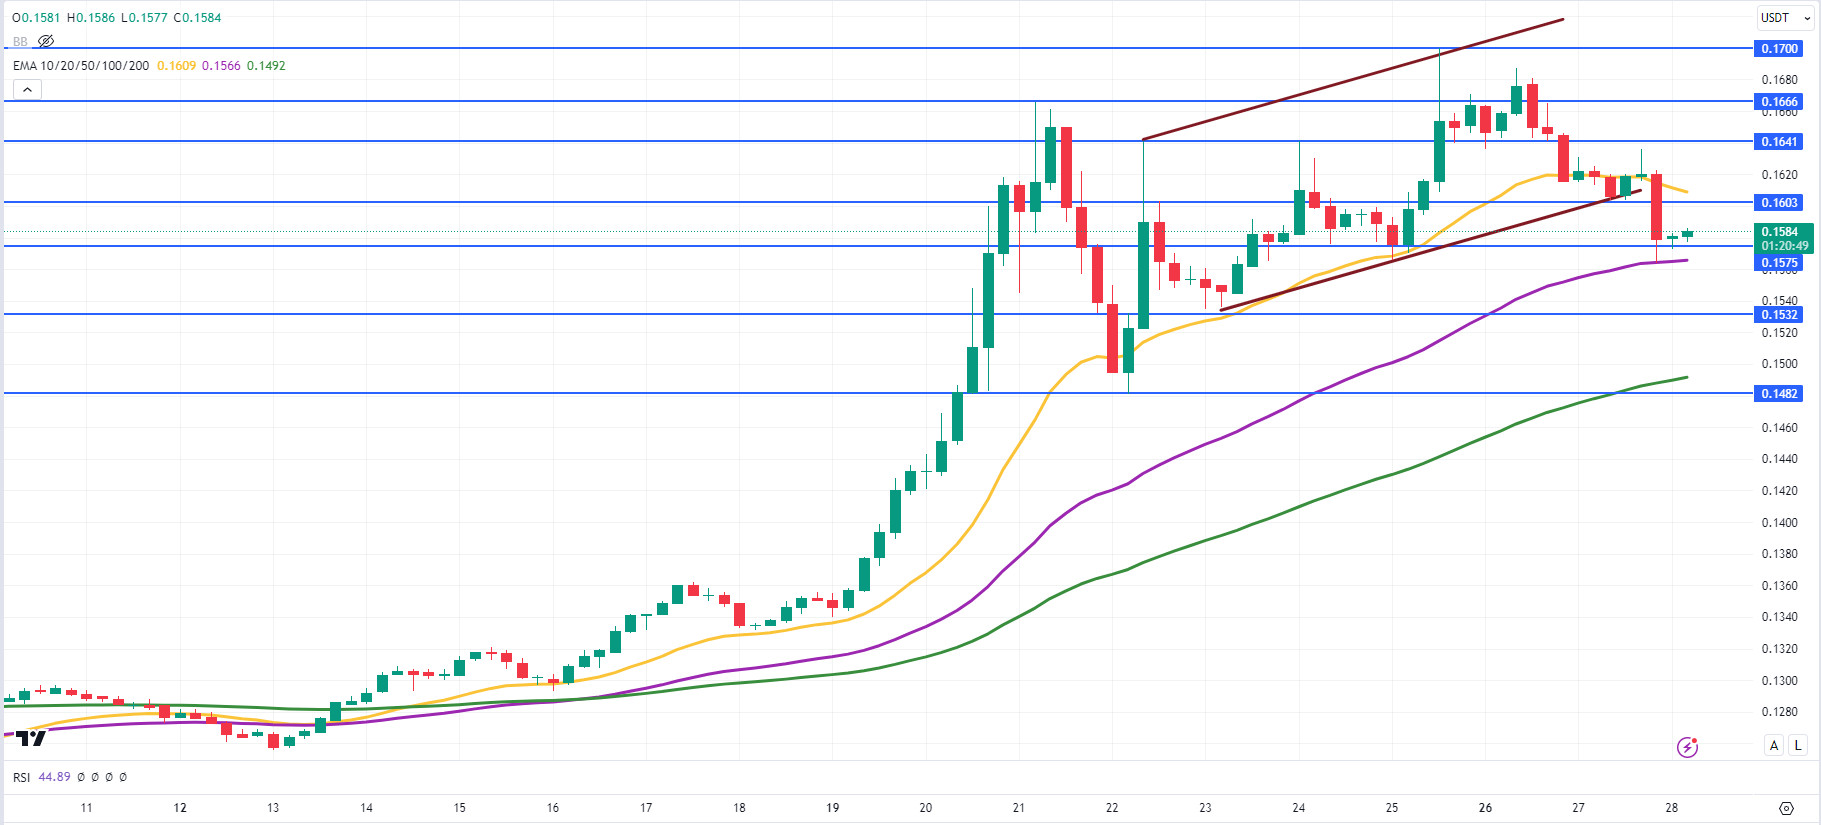
TRX, which started yesterday at 0.1617, broke the rising channel downwards during the night hours and closed the day at 0.1579 with the reaction from the EMA50. TRX, which is currently trading at 0.1584, may want to break the EMA20 upwards as long as it stays above the EMA50. In such a case, it may test the 0.1603 and 0.1641 resistances. Otherwise, if it breaks the EMA50 downwards, it may decline to the EMA100 level and a reaction from the EMA100 can be expected.
(Yellow Line: EMA20, Purple Line: EMA50, Green Line: EMA100)
Supports 0.1603 – 0.1575 – 0.1532
Resistances 0.1641 – 0.1666 – 0.1700
XRP/USDT
With the large volume sell-off in the crypto market and selling pressure on BTC and ETH in particular, major coins fell sharply ahead of the new day.
In the 4-hour analysis, XRP, which fell 7% to 0.5517 after testing the EMA20 (Blue Line) and EMA50 (Green Line) levels upwards in the last candle before the close, closed yesterday at 0.5662 with a recovery.
In today’s 4-hour analysis, XRP, which rose in the first 2 candles, tested the 0.5748 resistance level and then fell to 0.5698. If the downtrend this week continues, XRP may test the support levels of 0.5636-0.5549-0.5461. If the downtrend ends with positive developments and XRP starts to rise, it may test the resistance levels of 0.5748-0.5838-0.5936.
Supports 0.5636 – 0.5549 – 0.5461
Resistances 0.5748 – 0.5838 – 0.5936
DOGE/USDT
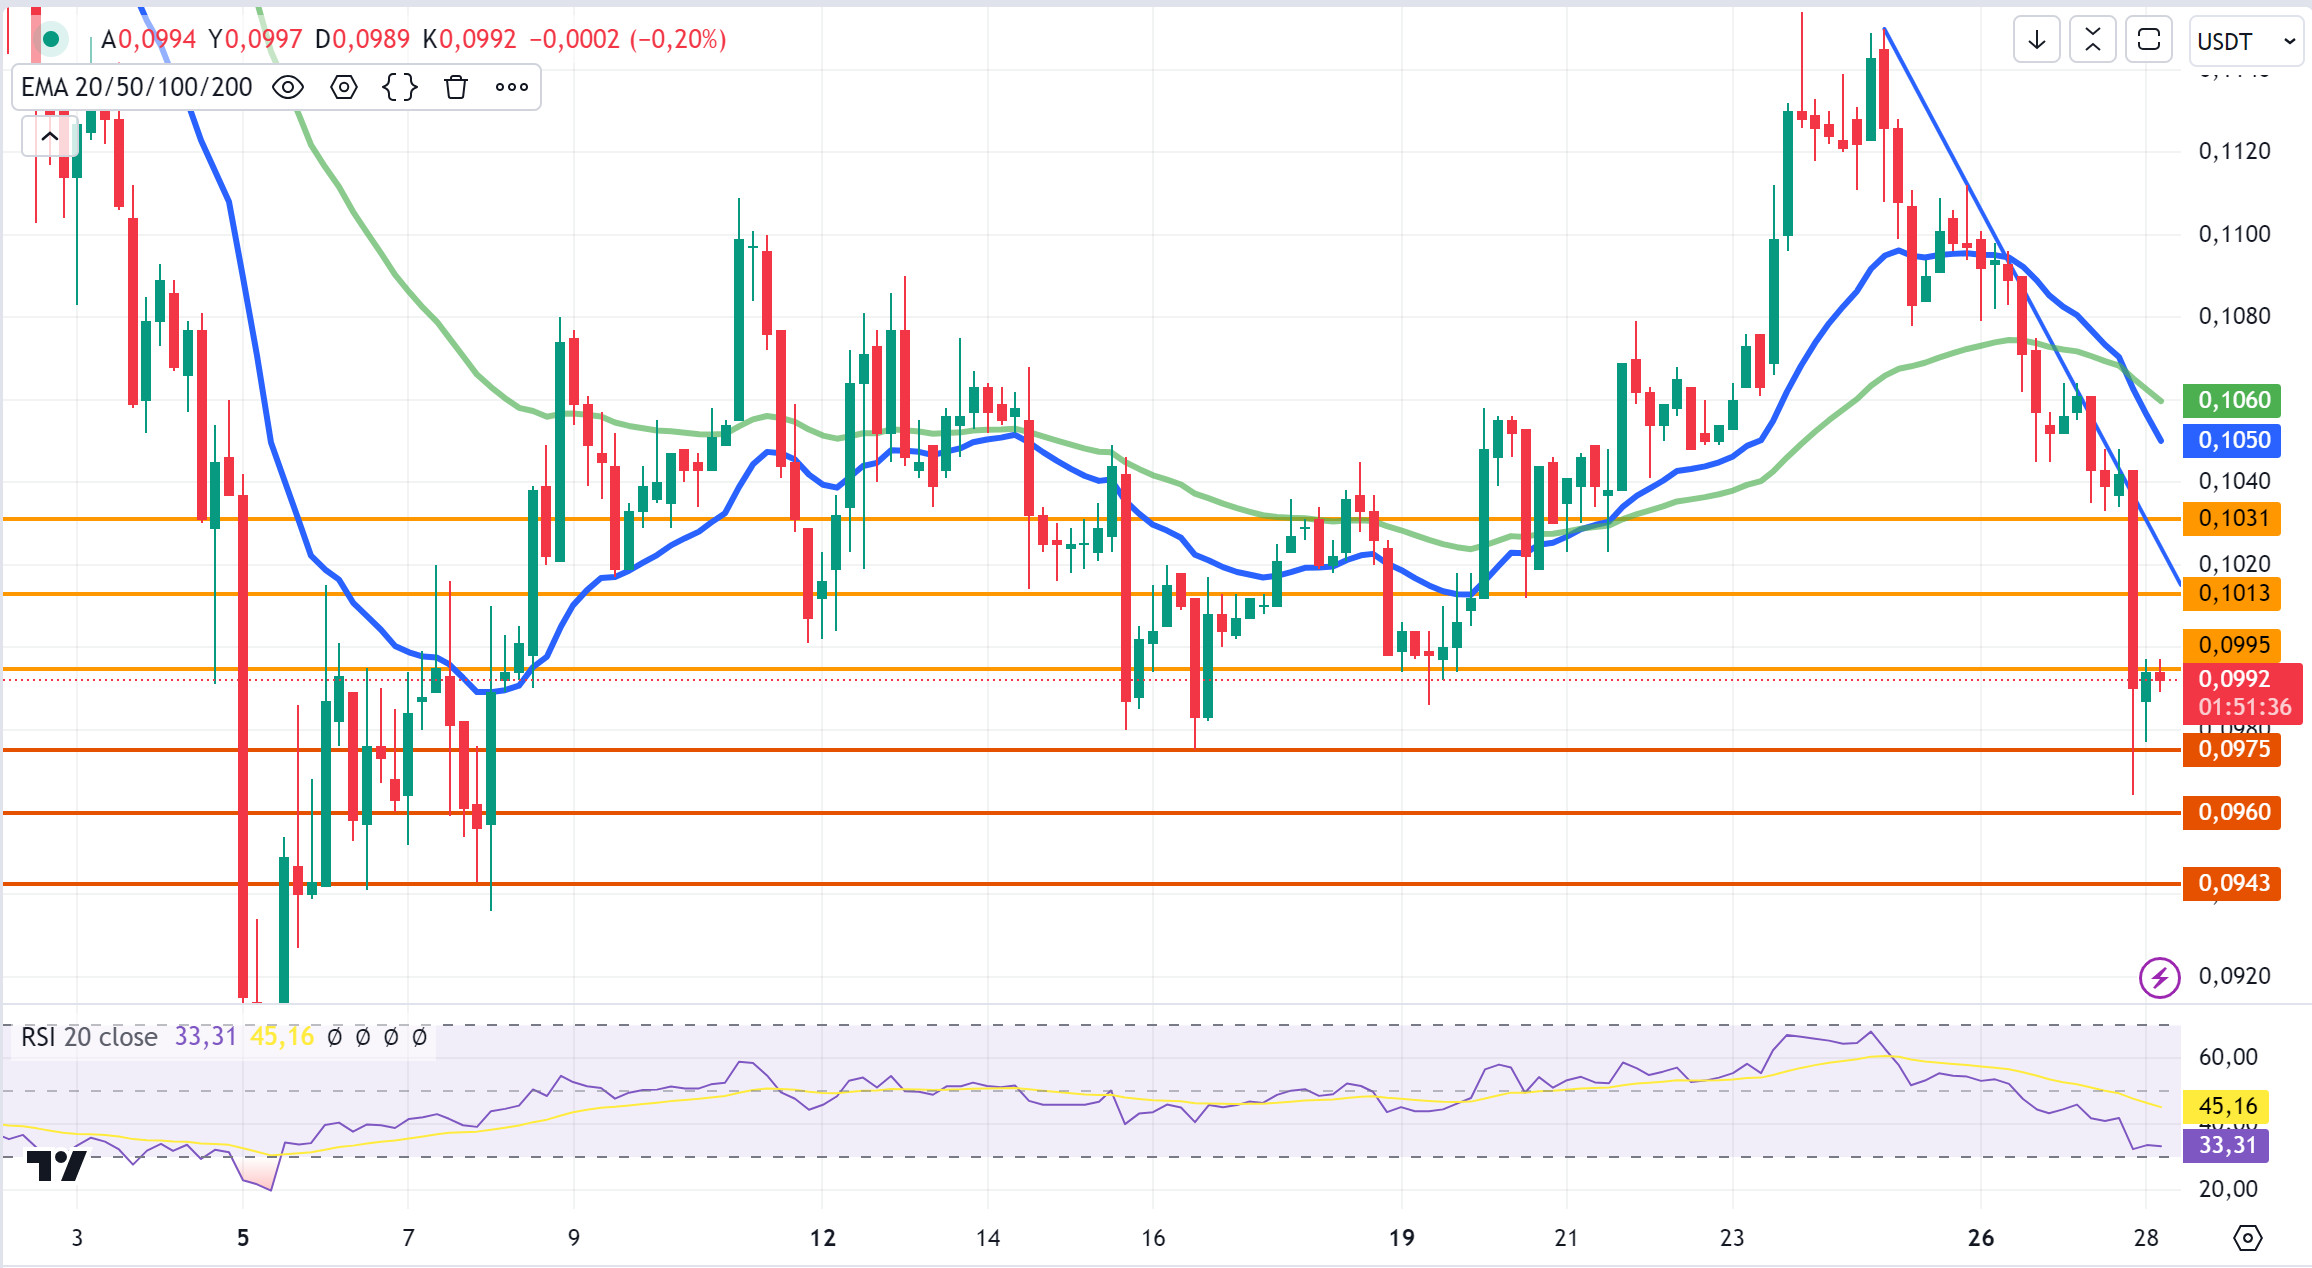
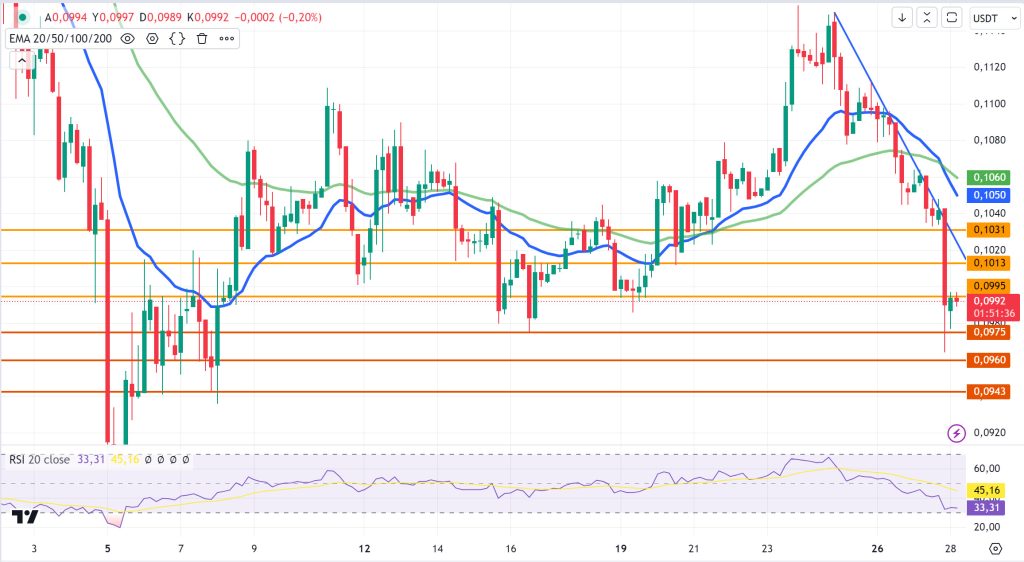
DOGE, which generally moves in parallel with the crypto market, closed the day at 0.0988 with a 6% loss in value, especially with the sharp decline before the closing yesterday. In the 4-hour analysis, DOGE, which started the new day with a rise, could not break the 0.0995 resistance level after testing the 0.0995 resistance level and is currently trading at 0.0992.
Selling pressure took effect across the crypto market. Especially BTC and ETH have seen sharp declines with high volume sales. If the selling pressure continues and DOGE, which is in a downtrend in this context, continues to lose value, it may test the support levels of 0.0975-0.0960-0.0943. In case the market recovers and starts to rise, DOGE may test the resistance levels of 0.0995-0.1013-0.1031.
Supports 0.0975 – 0.0960 – 0.0943
Resistances 0.0995 – 0.1013 – 0.1031
DOT/USDT
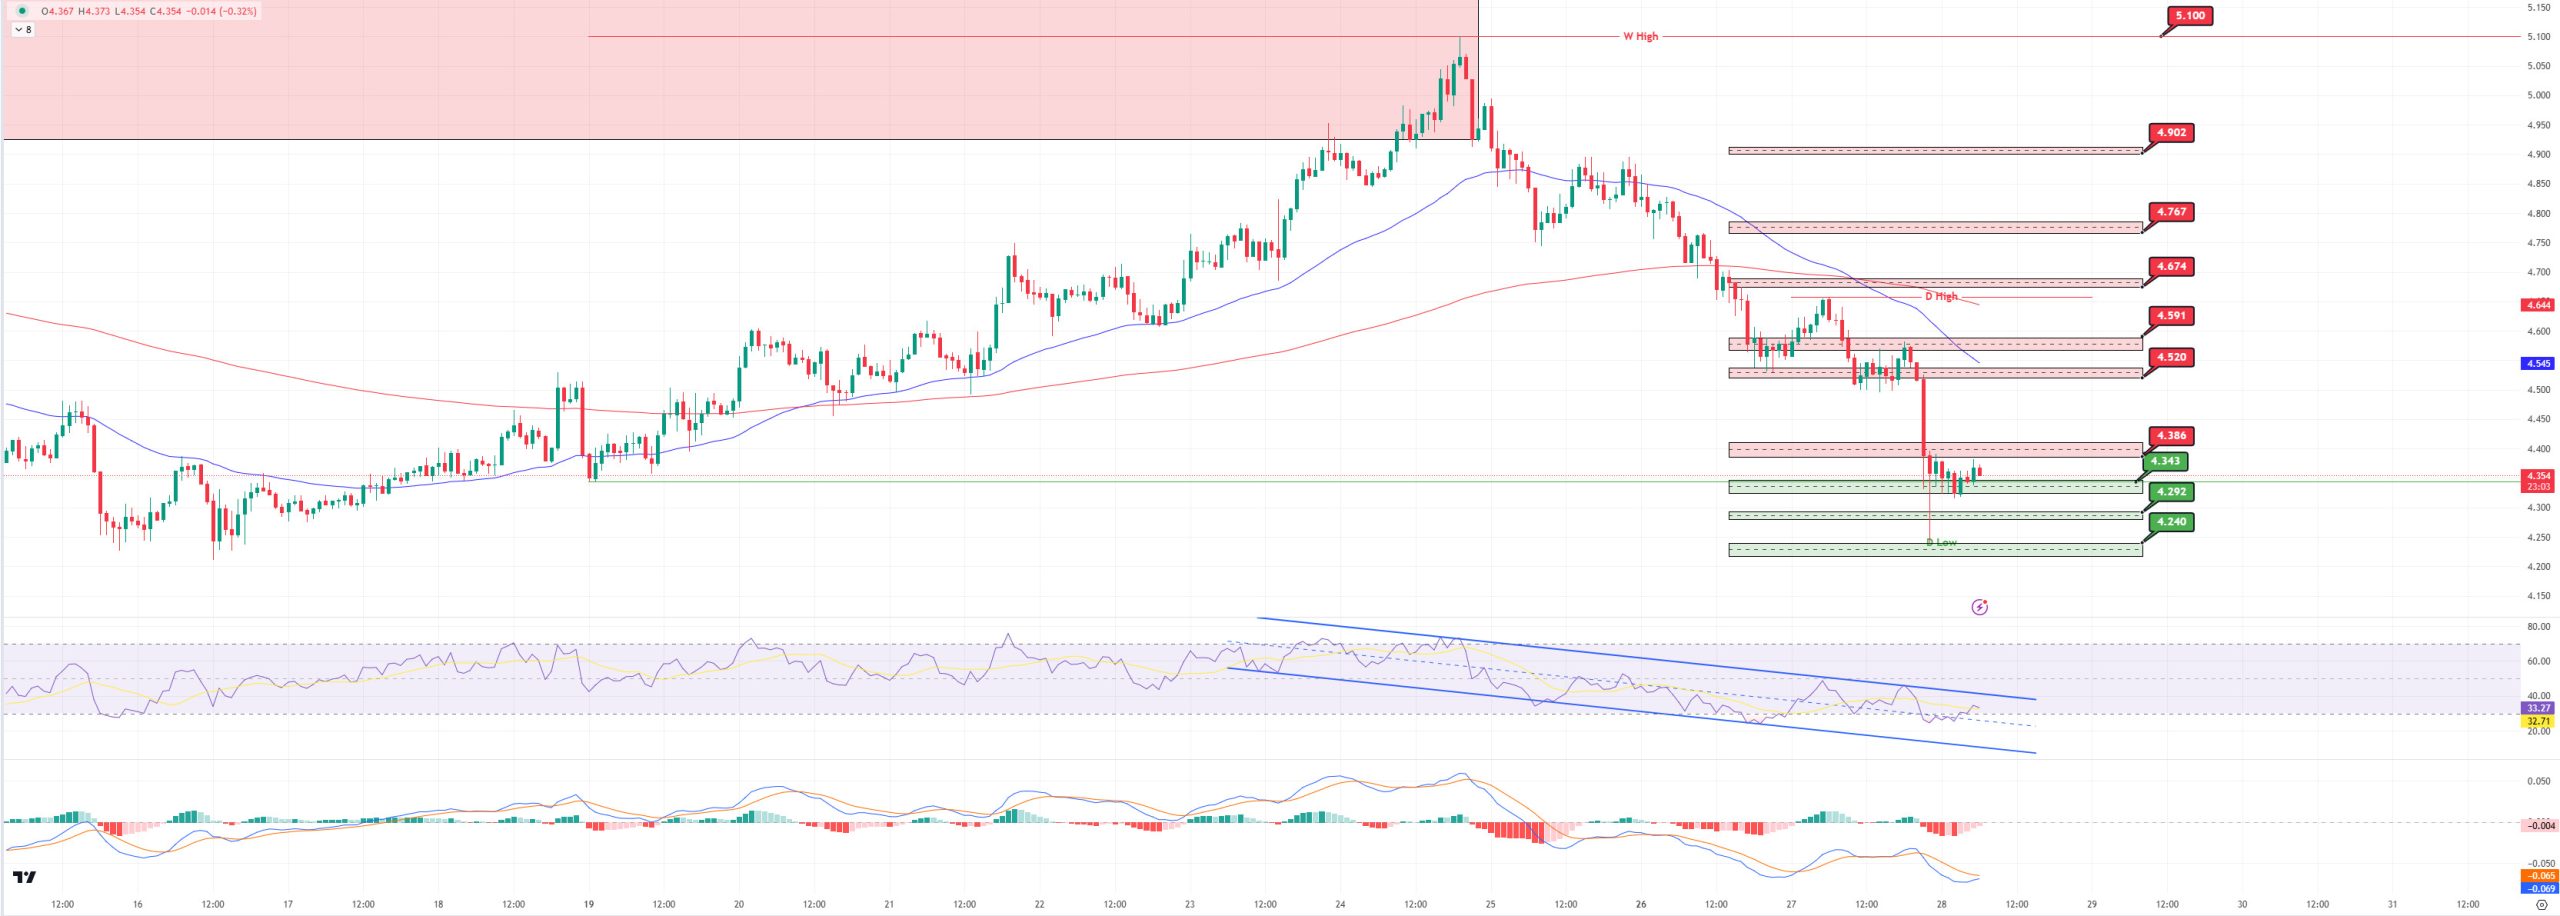
In Polkadot (DOT), selling pressure increased after the EMA50 broke down the EMA200 (Death Cross) and retreated to 4.343 support. After this sell-off, we can say that RSI is in a falling channel. If DOT, which has reduced selling pressure on MACD compared to the previous hours, breaks the first resistance level of 4.386 band upwards in a positive scenario, it may move towards 4.520s. On the other hand, if the selling pressure increases again, the price may test the 4,343 and 4,292 levels respectively.
(Blue line: EMA50, Red line: EMA200)
Supports 4.343 – 4.292 – 4.240
Resistances 4.520 – 4.386 – 4.591 – 4.674 – 4.767 – 4.902 – 5.100
SHIB/USDT
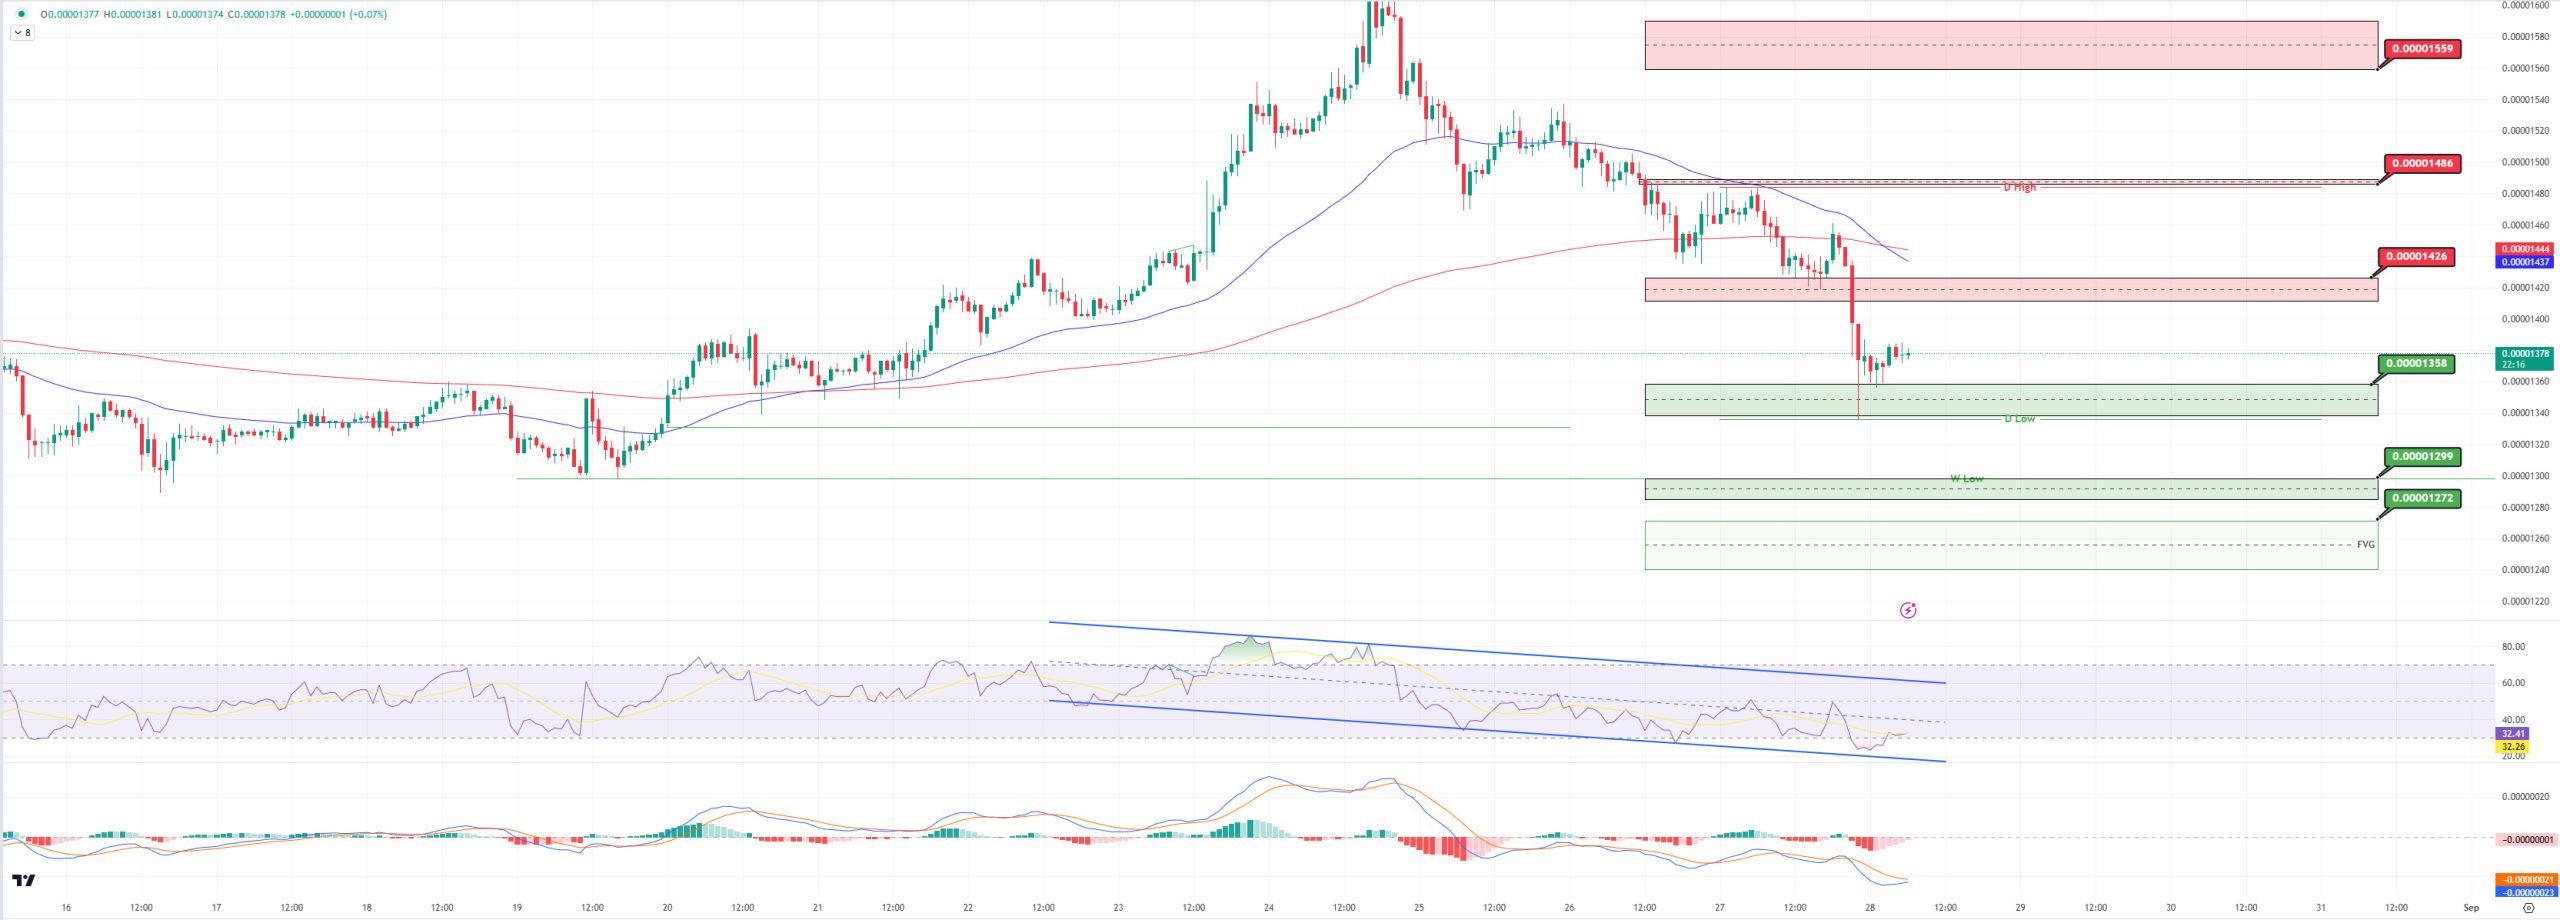
“We can say that Shiba Inu (SHIB) experienced a sharp decline with the EMA50 breaking down the EMA200 (Death Cross) as a result of increasing selling pressure. The price reacted from the 0.00001358 level and moved sideways. The RSI is in a falling channel and on the MACD, we can say that the selling pressure has decreased compared to the previous hours. In a positive scenario, if the price moves up from here, the first resistance level will be 0.00001426. If the price can break the selling pressure at these levels, a rise up to 0.00001486 levels can be observed. On the other hand, if the selling pressure increases again, we can say that the first support level is 0.00001358. If the price cannot hold in the 0.00001358 band, the levels where it can get the next reaction may be 0.00001299 and 0.00001272 respectively.
(Blue line: EMA50, Red line: EMA200)
Supports 0.00001358 – 0.00001299 – 0.00001272
Resistances 0.00001486 – 0.00001559 – 0.00001606 – 0.001678
LEGAL NOTICE
The investment information, comments and recommendations contained herein do not constitute investment advice. Investment advisory services are provided by authorized institutions on a personalized basis, taking into account the risk and return preferences of individuals. The comments and recommendations contained herein are of a general nature. These recommendations may not be suitable for your financial situation and risk and return preferences. Therefore, making an investment decision based solely on the information contained herein may not produce results in line with your expectations.


