MARKET SUMMARY
Latest Situation in Crypto Assets
| Assets | Last Price | 24h Change | Dominance | Market Cap. |
|---|---|---|---|---|
| BTC | 94,984.03 | 1.40% | 57.19% | 1,88 T |
| ETH | 3,181.79 | -0.26% | 11.65% | 383,19 B |
| XRP | 2.534 | 3.08% | 4.43% | 145,52 B |
| SOLANA | 186.02 | 2.26% | 2.74% | 90,18 B |
| DOGE | 0.3443 | 5.33% | 1.54% | 50,79 B |
| CARDANO | 0.9589 | 2.66% | 1.02% | 33,69 B |
| TRX | 0.2235 | -1.48% | 0.59% | 19,26 B |
| AVAX | 35.47 | 1.95% | 0.44% | 14,58 B |
| SHIB | 0.00002138 | 2.86% | 0.38% | 12,59 B |
| LINK | 19.60 | 2.98% | 0.38% | 12,50 B |
| DOT | 6.442 | 1.45% | 0.30% | 9,91 B |
*Prepared on 1.14.2025 at 07:00 (UTC)
WHAT’S LEFT BEHIND
Tether Obtains License in El Salvador and Nears Completion of Relocation Process
Tether has successfully obtained its Digital Asset Service Provider (DASP) license in El Salvador. The company is about to complete all procedures to move to El Salvador as a stablecoin issuer. Tether sees El Salvador as a hub that embraces innovation and supports their long-term vision and plans to establish the headquarters of the entire group here.
$45 Million Fine for Robinhood from SEC
The US Securities and Exchange Commission (SEC) fined Robinhood Securities LLC and Robinhood Financial LLC a total of $45 million for multiple securities law violations. The companies agreed to pay the fine imposed by the SEC.
FTX/Alameda Transfers 4.44 Million SOL
According to a report by blockchain analytics company Ember, FTX/Alameda transferred 4.44 million SOL (approximately $516.88 million). In the most recent transaction, 182,421 SOL (about $32.35 million) were redeemed from the pledge and distributed to 20 addresses. The average price of the transfers was recorded at $116.2.
Trump Team Makes Final Preparations for Crypto Council
Donald Trump, who will take office as US president, is making final preparations to form the Crypto Council. Trump, together with David Sacks, who he has chosen as “crypto and artificial intelligence officer”, will appoint 24 CEOs and executives to the council. With Trump in office, the crypto world’s influence on politics could take on a new dimension.
HIGHLIGHTS OF THE DAY
Important Economic Calender Data
| Time | News | Expectation | Previous |
|---|---|---|---|
| Pundi X (PUNDIX): | Q4 Progress Report AMA | ||
| MANTRA: | Community Connect | ||
| GameFi.org: | RIVAL IDO | ||
| SKALE (SKL): | AMA Event on Discord | ||
| 13:30 | US Core PPI (MoM) (Dec) | 0.2% | 0.2% |
| 13:30 | US PPI (MoM) (Dec) | 0.4% | 0.4% |
| 20:05 | US FOMC Member Williams Speaks |
INFORMATION
*The calendar is based on UTC (Coordinated Universal Time) time zone.
The economic calendar content on the relevant page is obtained from reliable news and data providers. The news in the economic calendar content, the date and time of the announcement of the news, possible changes in the previous, expectations and announced figures are made by the data provider institutions. Darkex cannot be held responsible for possible changes that may arise from similar situations.
MARKET COMPASS
In global markets, the agenda regarding the US economy continues to be a determining factor in asset prices. Having started the week by refraining from taking risks due to the expectations that the Federal Reserve (FED) would slow down or even stop interest rate cuts, the markets found the opportunity to recover with the news that Trump might raise tariffs gradually after taking office.
According to sources close to the matter, Trump’s team is working on a plan for gradual tariff increases to avoid triggering inflation, although they have not yet presented it to the President-elect. Following this news, there was some easing in the dollar index and stabilization in bond yields. Towards the end of the session, Wall Street indices rebounded, while Asian markets were up. Futures contracts indicate that European and US indices will start the new day with a rise. Digital assets also turned their recent losses into gains with the effect of the change in perception. It seems that macro indicators will have to allow for the continuation of the recent rise in digital assets.
The US Producer Price Index (PPI) data to be released today will be under the scrutiny of investors ahead of tomorrow’s Consumer Price Index (CPI). Higher-than-expected data may put pressure on digital assets and lower figures may support the upside. Click here to review our weekly report on CPI data.
From the short term to the big picture.
The victory of former President Trump on November 5, which was one of the main pillars of our bullish expectation for the long-term outlook in digital assets, produced a result in line with our predictions. Afterwards, the appointments made by the president-elect and the increasing regulatory expectations for the crypto ecosystem in the US and the emergence of BTC as a reserve continued to take place in our equation as positive variables. Although it is expected to continue at a slower pace, the preservation of expectations that the FED will continue its interest rate cut cycle and the volume in crypto asset-based ETFs indicating an increase in institutional investor interest support our upward forecast for the big picture for now. In the short term, given the nature of the market and pricing behavior, we think it would not be surprising to see occasional pauses or pullbacks in digital assets. However, at this point, it is worth emphasizing again that we think the fundamental dynamics continue to be bullish.
TECHNICAL ANALYSIS
BTC/USDT
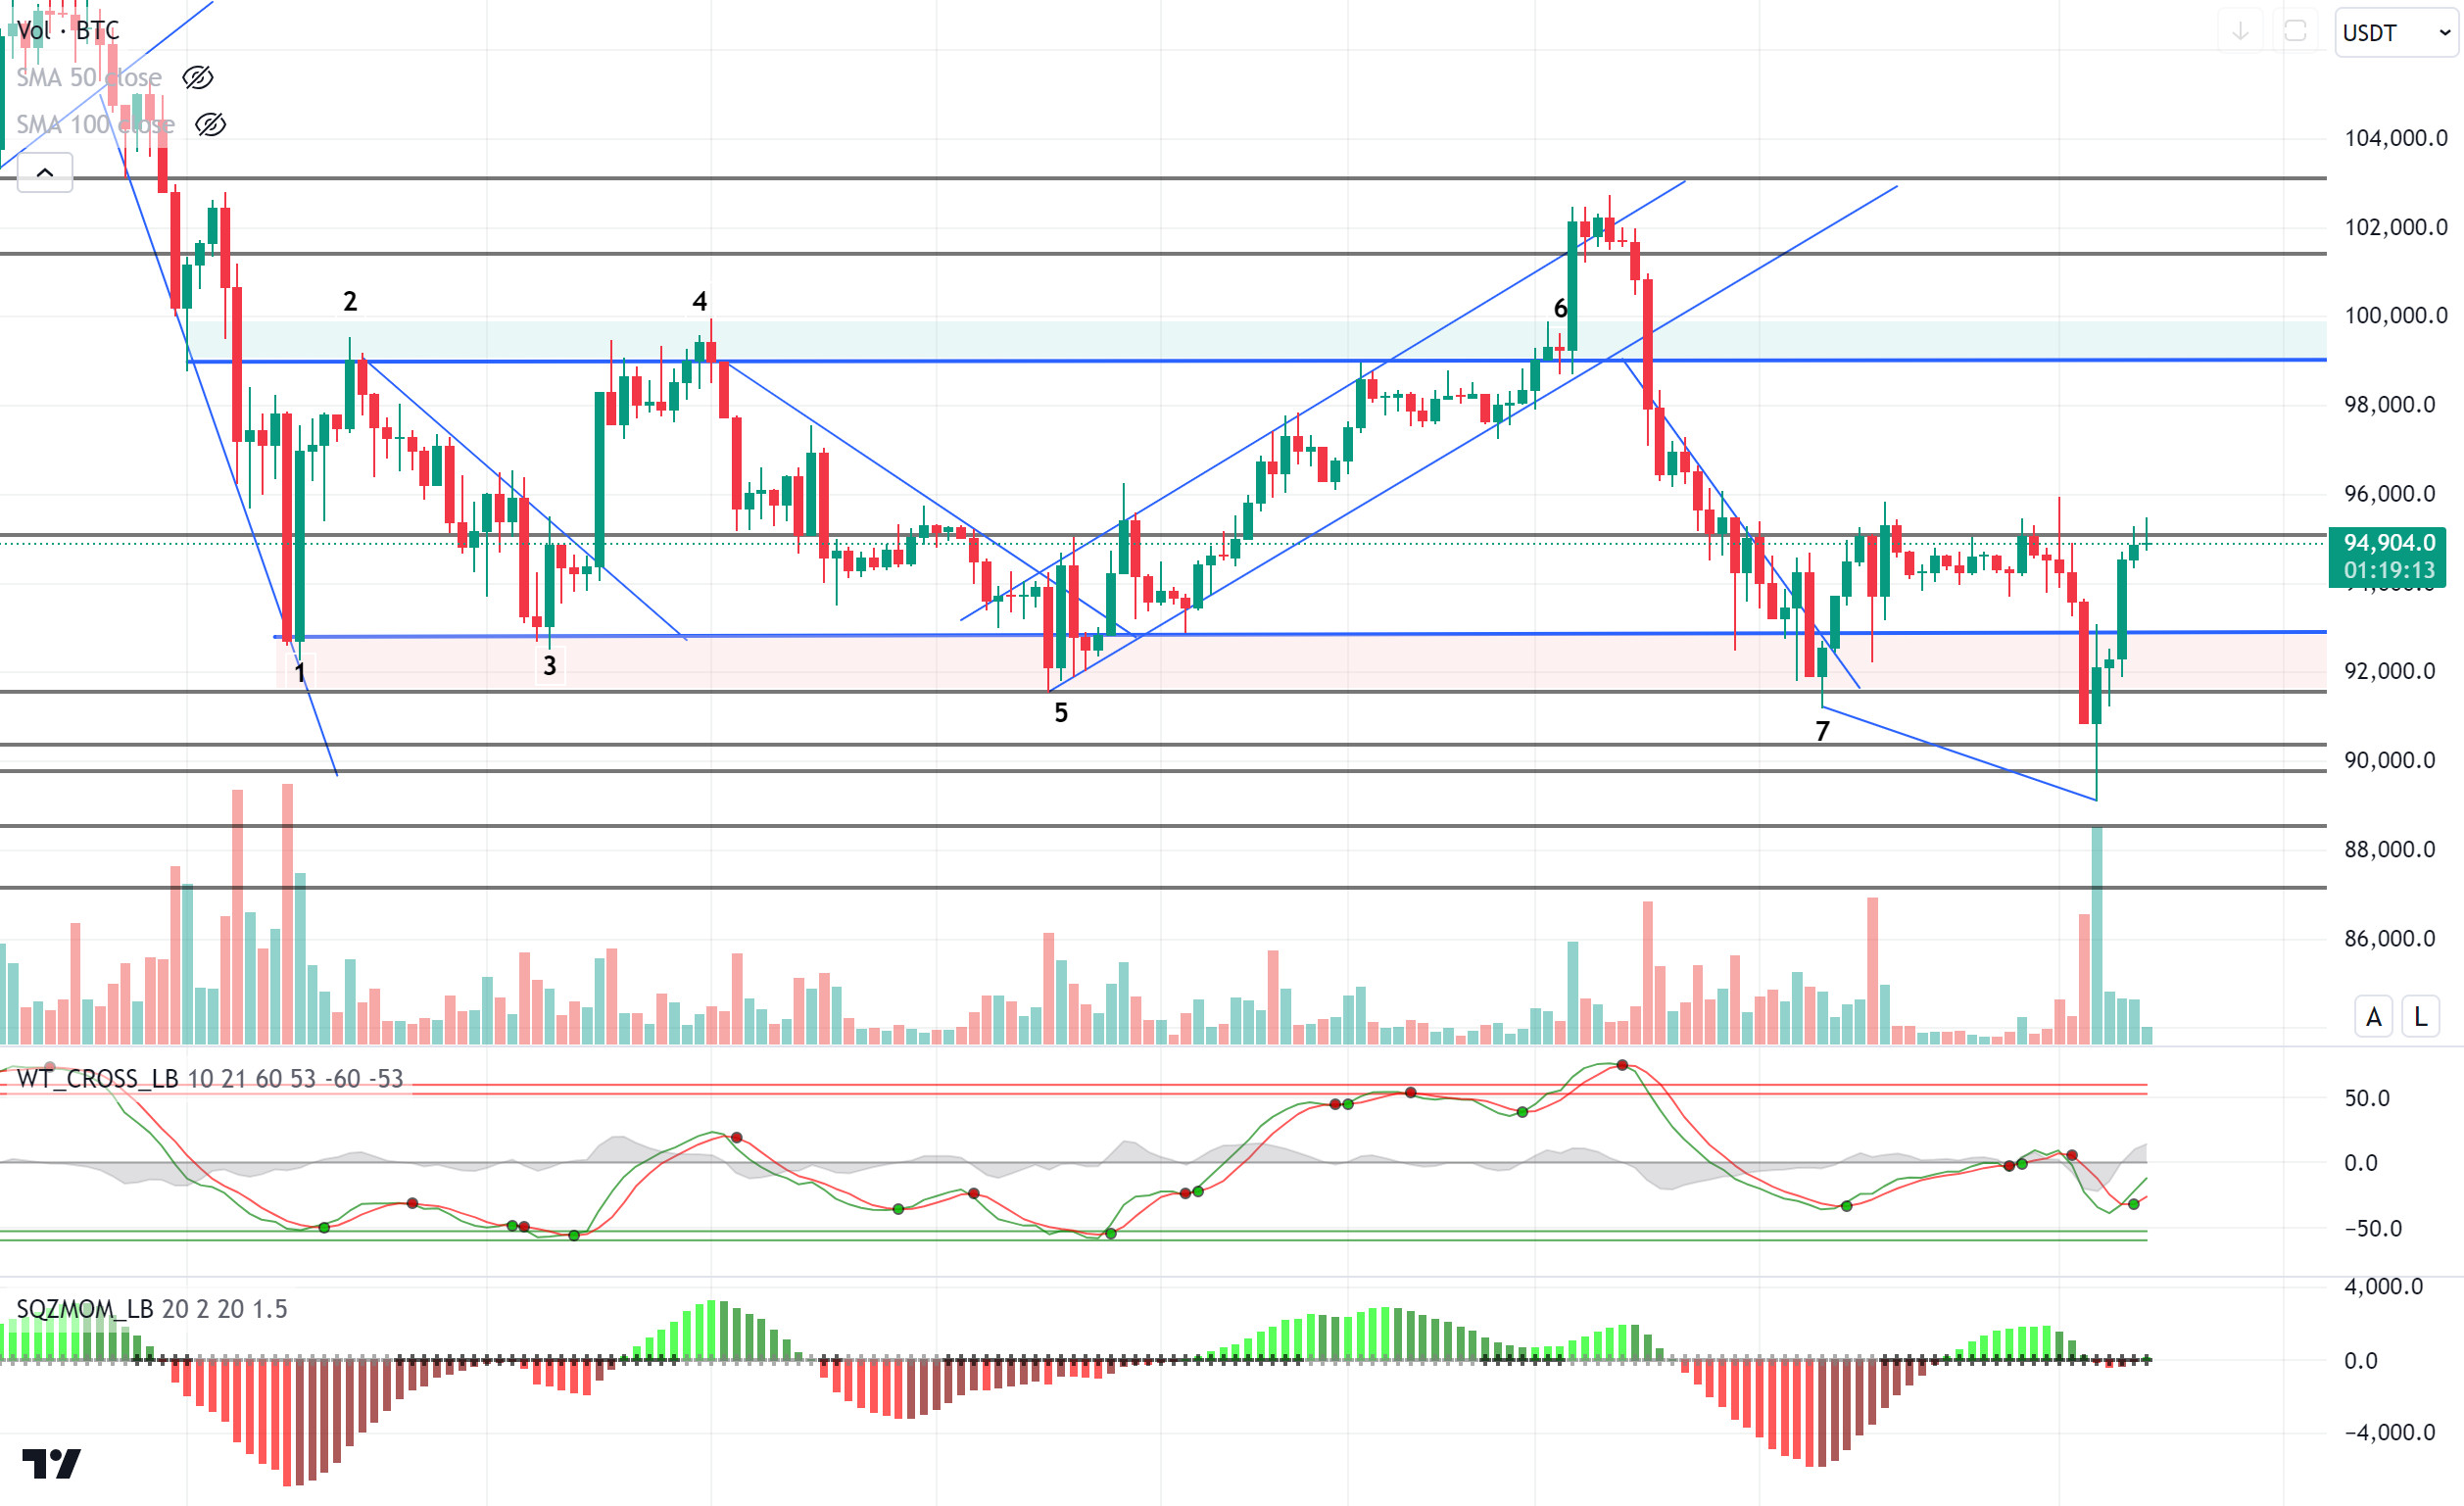
Bitcoin has rebounded in a strong V-shape after testing an eight-week low of $89,100 in the last 24 hours. On the weekly liquidation chart, it is observed that Bitcoin, which is heading up again after the liquidation of long positions, is targeting short trades this time. After falling to $1.77 trillion, the total market capitalization has rebounded to $1.88 trillion, while market capitalization remains high at 58.43%.
Looking at the technical outlook, BTC, which could not break the major resistance level of 95,000, retreated sharply with the break of the 92,800 level and tested the 89,100 level. Then, the price recovered quickly, exceeding the 92,800 level on the second attempt and reaching the 95,000 level again. Currently trading at 94,900, BTC continues to push the 95,000 point, which we take as a reference level. Technical oscillators continue to signal buying yesterday, while the momentum indicator is still weak. In the continuation of the rise, short trades extending from 96,000 to 99,000 can be targeted with the exceeding of the 95,000 level. In a possible new wave of selling, the 92,800 point can be seen as a critical level to stay in the positive zone again.
The election of D.Trump crypto committee members and critical macro data are seen as the developments we will follow in the rest of the week.
Supports 92,800 – 91,700 – 90,000
Resistances 95,000 – 97,200 – 98,100
ETH/USDT
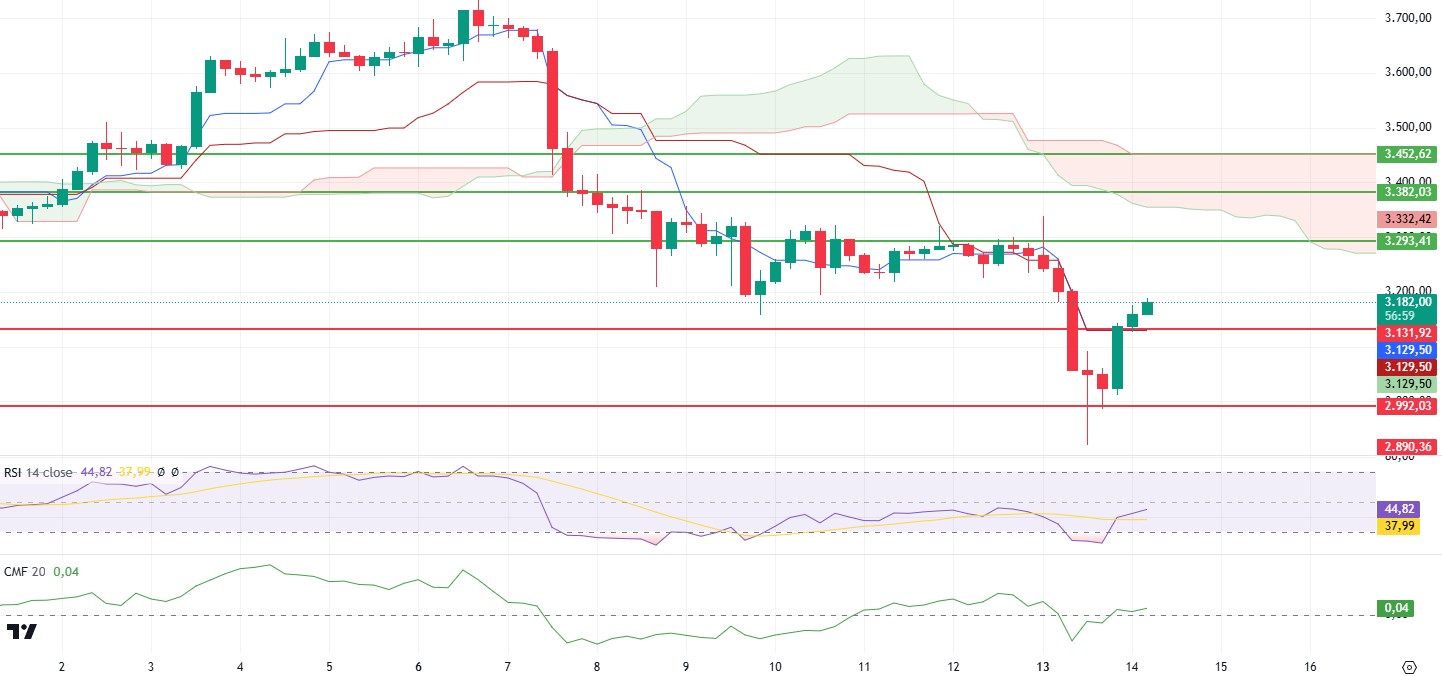
ETH broke the 3,131 support and fell as low as 2,900 yesterday evening as BTC dipped below the $90,000 level. However, it rebounded quickly to regain the 3,131 level . This price action led to significant shifts in technical indicators and positive signals in market momentum.
According to the Ichimoku indicator, the intersection of the tenkan and kijun lines provides a positive outlook, but this signal is weakened by the fact that the price remains below the kumo cloud. For a stronger bullish signal, the price needs to move above the cloud. The RSI indicator had entered the oversold zone with the recent decline. However, it started to rise from there with a strong momentum. However, there could be a risk of negative divergence if the price fails to break the 3,293 level. Chaikin Money Flow (CMF), on the other hand, moved into positive territory, indicating that buyers are gaining strength in the market.
As a result, the price can be expected to continue its rise provided that it does not lose 3,131 support during the day. With this move, the $3,293 level should be monitored as an important resistance. Exceeding this level could open the door for the price to test higher resistances. For ETH, the $3,131 level stands out as a critical support point. In case of a decline below this level, pricing below $3,000 may come back on the agenda and the $2,900 level may be tested.
Supports 3,131 – 2,992 – 2,890
Resistances 3,293 – 3,382 – 3,452
XRP/USDT
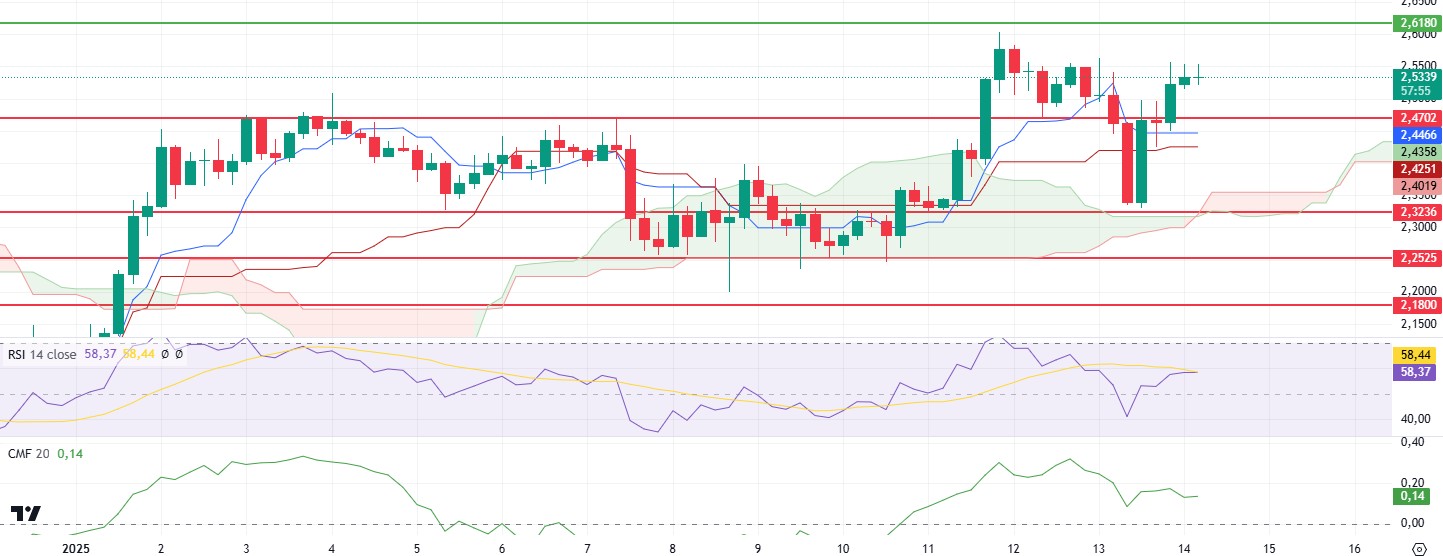
XRP managed to break through the 2.47 resistance with the effect of positive divergence in technical indicators after yesterday’s decline. The positive divergence in the Relative Strength Index (RSI) indicator played a critical role in the price’s rapid reaction and crossing this level. The RSI’s accompaniment to the bullish move paints a positive picture in terms of momentum. However, the fact that the Chaikin Money Flow (CMF) indicator is only at 0.14 indicates that buyers are not strong enough and there is some weakness in the sustainability of the uptrend. Looking at the Ichimoku indicator, the regain of the tenkan and kijun levels provides a technically positive outlook.
In light of the current data, there is an upside potential up to 2.61. Breaching this level may pave the way for stronger and faster rises. However, it should be noted that if the weakness in the CMF indicator continues, the buying pressure may decrease and the rise may remain limited. If the 2.47 level is broken to the downside, the chances of deepening declines in the XRP price will increase. Below this level, lower support levels may become targets as selling pressure increases.
Supports 2.4702 – 2.3236 – 2.2525
Resistances 2.6180 – 2.7267 – 2.8528
SOL/USDT
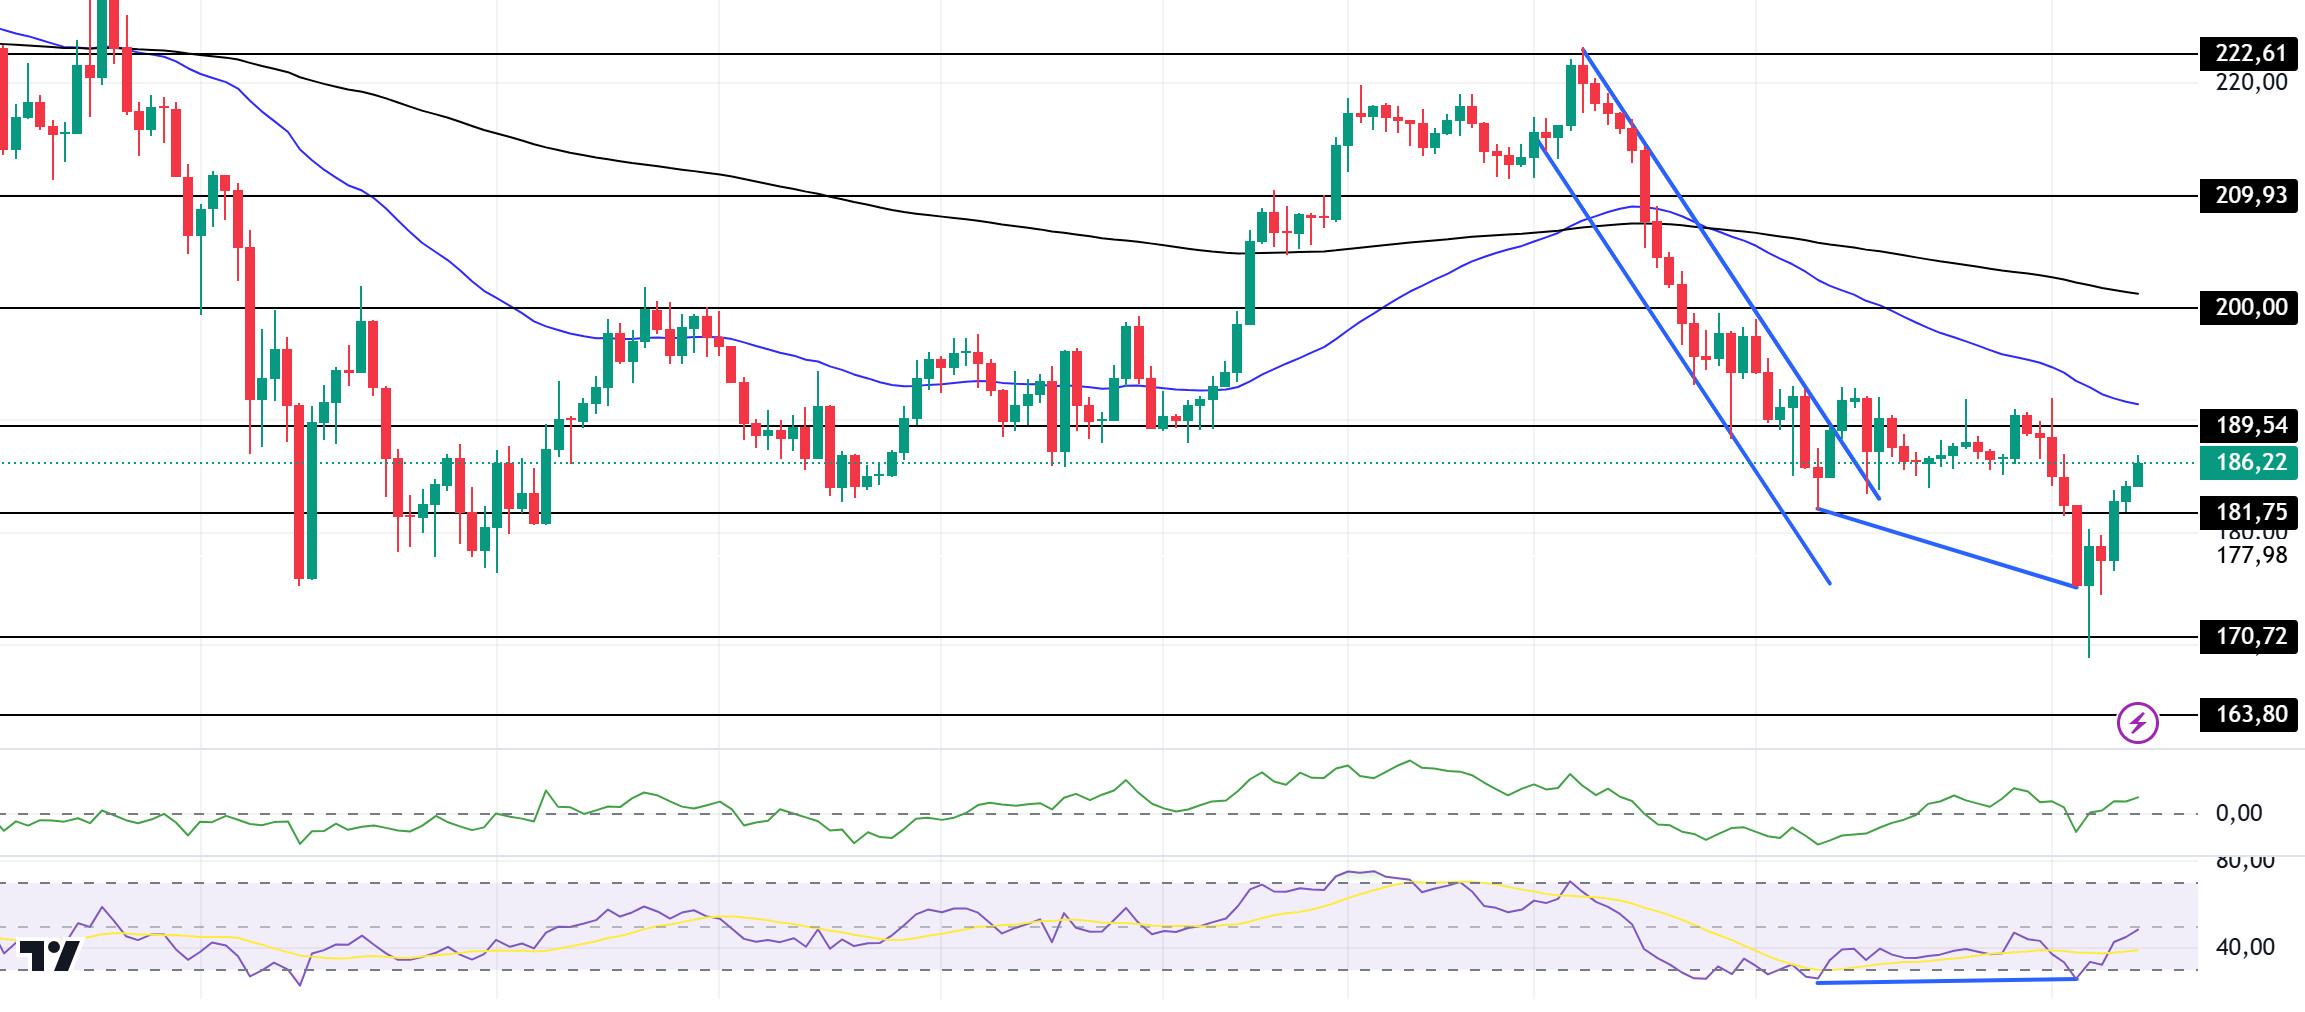
MoonPay acquires ‘leading’ Solana payments firm Helio in a $175 million deal. Oncahinde, liquidations at Solana reached $16.69 million and longs lost $14.89 million. Open interest fell to $5.61 billion and the long-to-short ratio stands at 0.9395.
Solana signaled a rebound after the deep retracement since our analysis yesterday. On the 4-hour timeframe, the 50 EMA (Blue Line) continues to be below the 200 EMA (Black Line). When we examine the Chaikin Money Flow (CMF)20 indicator, it is seen that money inflows are intense by moving from the negative zone to the positive zone. However, the Relative Strength Index (RSI)14 indicator is moving from oversold to neutral territory. At the same time, positive mismatch seems to have worked. The 200.00 level appears to be a very strong resistance point in the rises driven by both the upcoming macroeconomic and Solana ecosystem news. If it breaks here, the rise may continue. In case of retracements for the opposite reasons or due to profit sales, the 163.80 support level can be triggered. If the price comes to these support levels, a potential bullish opportunity may arise if momentum increases.
Supports 181.75 – 170.72 – 163.80
Resistances 189.54 – 200.00 – 209.93
DOGE/USDT
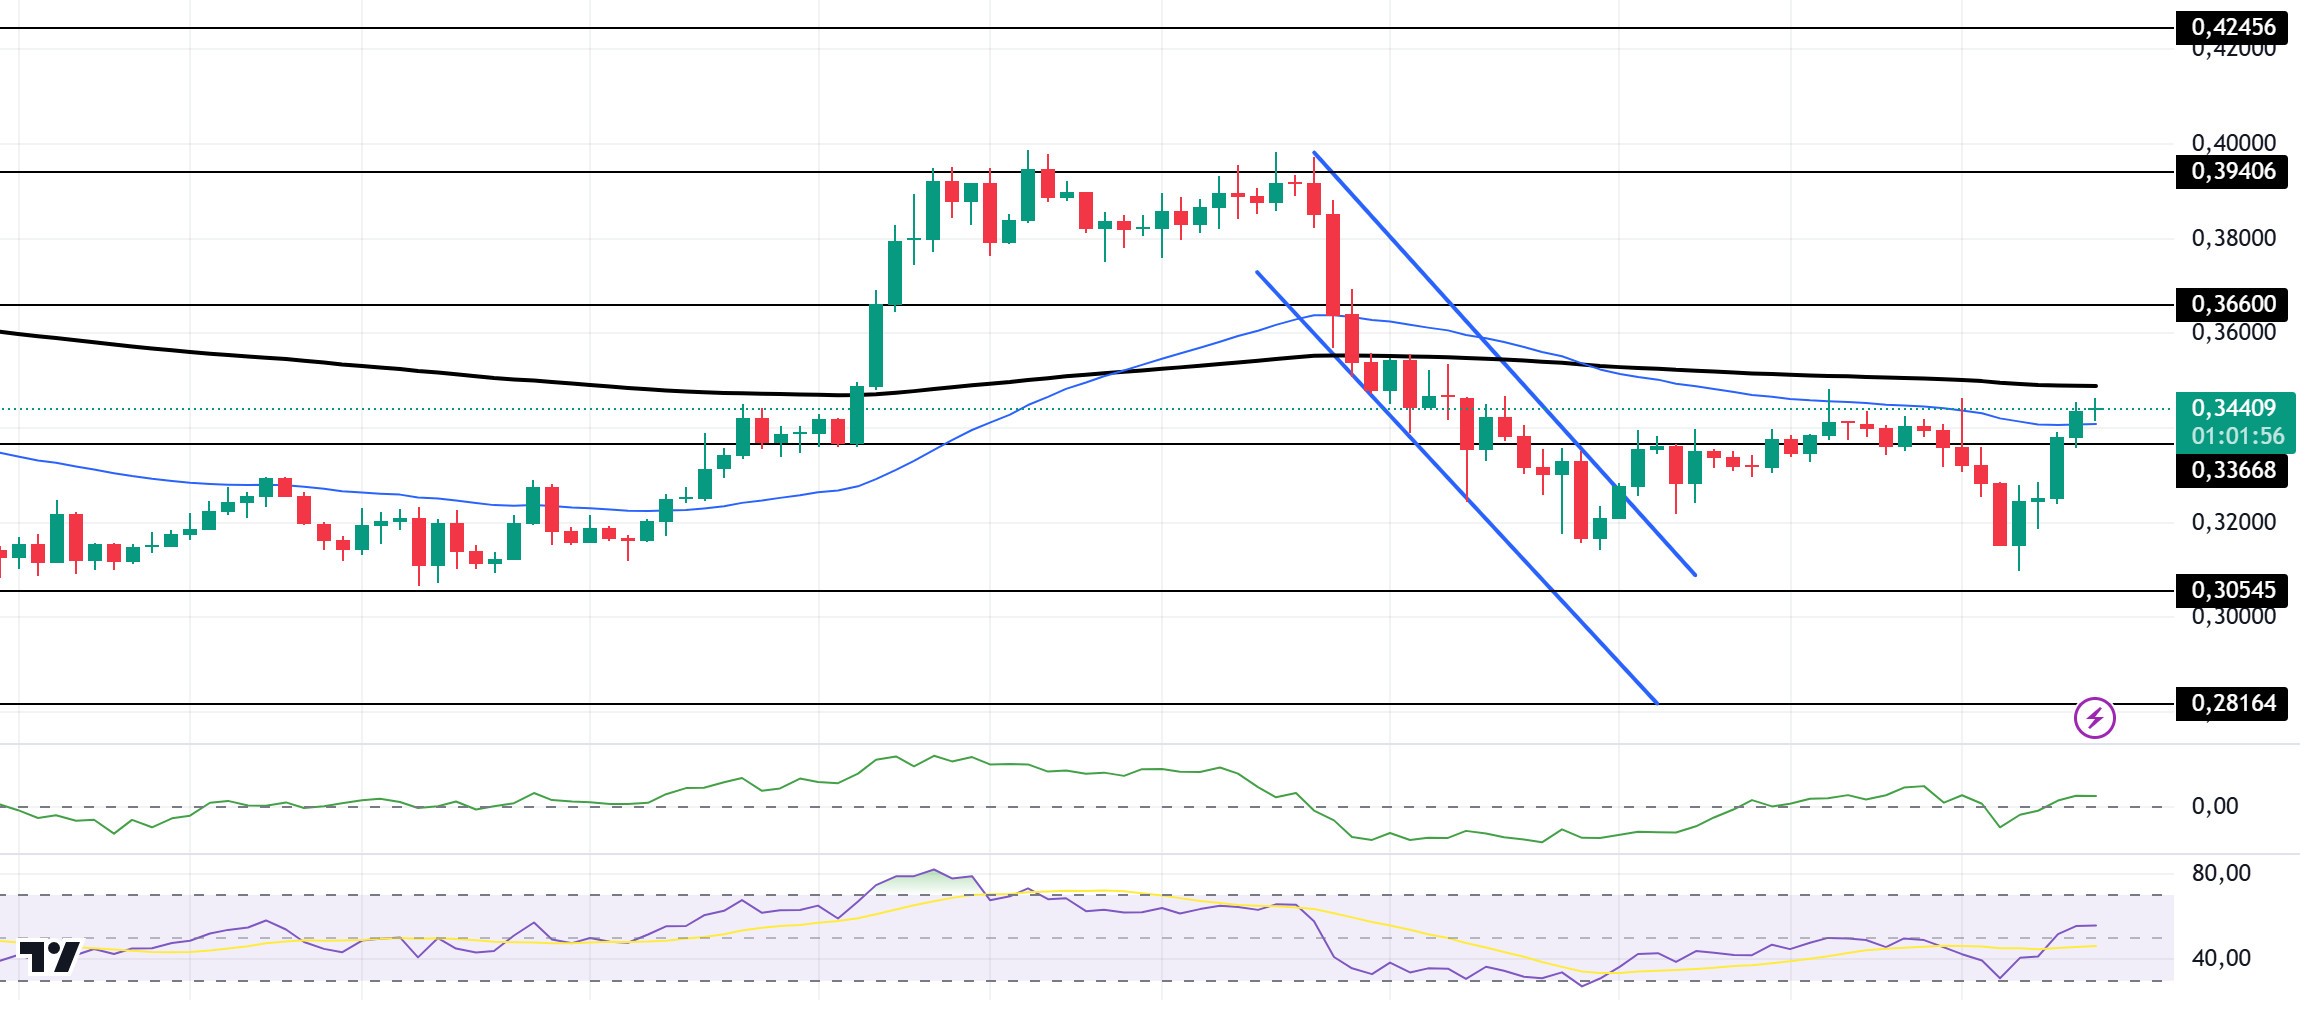
Doge seems to have recovered after yesterday’s deep pullback. Looking at the chart, the asset is between the 50 EMA (Blue Line) and the 200 EMA (Black Line) on the 4-hour timeframe. At the time of writing, the price is testing the 200 EMA as resistance with support from the 50 EMA. When we examine the Chaikin Money Flow (CMF)20 indicator, it switched from negative to positive territory. However, it seems that money outflows have increased slightly. However, Relative Strength Index (RSI)14 has moved from the oversold zone to the neutral zone. The 0.39406 level stands out as a very strong resistance point in the rises due to political reasons, macroeconomic data and innovations in the DOGE coin. In case of possible pullbacks due to political, macroeconomic reasons or negativities in the ecosystem, the 0.28164 level, which is the base level of the trend, is an important support. If the price reaches these support levels, a potential bullish opportunity may arise if momentum increases.
Supports 0.33668 – 0.30545 – 0.28164
Resistances 0.36600 – 0.39406 – 0.42456
LEGAL NOTICE
The investment information, comments and recommendations contained herein do not constitute investment advice. Investment advisory services are provided individually by authorized institutions taking into account the risk and return preferences of individuals. The comments and recommendations contained herein are of a general nature. These recommendations may not be suitable for your financial situation and risk and return preferences. Therefore, making an investment decision based solely on the information contained herein may not produce results in line with your expectations.


