MARKET SUMMARY
Latest Situation in Crypto Assets
| Assets | Last Price | 24h Change | Dominance | Market Cap. |
|---|---|---|---|---|
| BTC | 99,748.72 | 2.78% | 56.47% | 1,98 T |
| ETH | 3,379.58 | 4.70% | 11.63% | 407,00 B |
| XRP | 3.106 | 9.03% | 5.10% | 178,32 B |
| SOLANA | 202.89 | 7.29% | 2.81% | 98,25 B |
| DOGE | 0.3800 | 5.39% | 1.60% | 56,00 B |
| CARDANO | 1.0582 | 2.95% | 1.06% | 37,18 B |
| TRX | 0.2379 | 6.24% | 0.58% | 20,46 B |
| AVAX | 39.24 | 6.21% | 0.46% | 16,16 B |
| LINK | 21.74 | 5.96% | 0.40% | 13,87 B |
| SHIB | 0.00002228 | 3.73% | 0.37% | 13,12 B |
| DOT | 7.038 | 5.00% | 0.31% | 10,83 B |
*Prepared on 1.16.2025 at 07:00 (UTC)
WHAT’S LEFT BEHIND
Fed Rate Cut Expectations Renewed After US Inflation
Inflation data released in the US, headline inflation remained within expectations, while core inflation came in lower than expected, pushing the Bitcoin price above the 99-thousand-dollar level. After these data, the Fed’s interest rate cut expectations were pushed back to June. The market thinks that the slowdown in inflation could create room for a rate cut.
US Digital Committee
According to a January 15 post by Fox Business reporter Eleanor Terrett, Senator Tim Scott’s priority list for the 119th Congress includes the development of a regulatory framework for digital assets. In addition to setting a clear regulatory path for digital asset trading and custody services, the Commission aims to provide an open environment for innovative financial technologies such as stablecoins. Consumer protection, financial education and inclusion are also priorities.
Fed Beige Book: 2025 Outlook
According to the Beige Book published by the Federal Reserve, optimism towards 2025 has increased while pessimistic views have decreased. However, concerns were expressed in some regions that changes in immigration and tariff policies could adversely affect economic activity. From late November to late December, economic activity increased slightly to moderately in the twelve Federal Reserve Districts. Prices generally rose modestly, while growth rates ranged from steady to moderate. Employment generally increased, with six Districts recording no change in employment levels.
Crypto Move from Thailand
Thailand, one of the countries where crypto adoption is intense, is considering allowing Bitcoin ETFs through the SEC, which is responsible for regulating securities. Expansion of crypto payments in tourist areas such as Phuket is planned, while stablecoin projects backed by government bonds are also on the agenda. These steps are seen as part of Thailand’s strategy to strengthen the crypto ecosystem.
HIGHLIGHTS OF THE DAY
Important Economic Calender Data
| Time | News | Previous |
|---|---|---|
| Arbitrum (ARB) | 92.65M Token Unlock | – |
| Immutable (IMX) | RavenQuest mobile launch | – |
| Internet Computer (ICP) | CfC St. Moritz | – |
| 13:30 | US Initial Jobless Claims | 210K 201K |
| 13:30 | US Core Retail Sales (MoM) (Dec) | 0.5% 0.2% |
| 13:30 | US Retail Sales (MoM) (Dec) | 0.6% 0.7% |
| 13:30 | US Philadelphia Fed Manufacturing Index (Jan) | -5.2 -16.4 |
| 16:00 | US FOMC Member Williams Speaks | – |
INFORMATION:
*The calendar is based on UTC (Coordinated Universal Time) time zone.
The economic calendar content on the relevant page is obtained from reliable news and data providers. The news in the economic calendar content, the date and time of the announcement of the news, possible changes in the previous, expectations and announced figures are made by the data provider institutions. Darkex cannot be held responsible for possible changes that may arise from similar situations.
MARKET COMPASS
Yesterday’s US inflation data did not give a bad surprise and core CPI remained below expectations, which increased the risk appetite in the markets. The negative atmosphere of the last few days dissipated to some extent with both the Producer Price Index (PPI) and CPI data released the previous day. Wall Street closed yesterday with strong gains. This morning, Asia-Pacific stock markets are also bullish and both European and US futures are pointing to a bullish opening, albeit in a more moderate tone. The dollar index and US bond yields eased. Major digital assets also benefited from this reshaped positive sentiment. Following the gains in value with the aforementioned macro data that kept the possibility of a rate cut by the US Federal Reserve (FED) on the agenda, eyes will be on the first actions of Trump, who will take over in the White House.
During the day, the breathing trend after yesterday’s rises can be expected to continue. However, expectations that the FED issue may pose slightly less of a problem and that Trump, who will hold his inauguration ceremony on Monday, may help maintain the positive mood in the short term.
From the short term to the big picture.
The victory of former President Trump on November 5, which was one of the main pillars of our bullish expectation for the long-term outlook in digital assets, produced a result in line with our predictions. Afterwards, the appointments made by the president-elect and the increasing regulatory expectations for the crypto ecosystem in the US and the emergence of BTC as a reserve continued to take place in our equation as positive variables. Although it is expected to continue at a slower pace, the preservation of expectations that the FED will continue its interest rate cut cycle (for now) and the volume in ETFs based on crypto assets indicating an increase in institutional investor interest support our upward forecast for the big picture for now. In the short term, given the nature of the market and pricing behavior, we think it would not be surprising to see occasional pauses or pullbacks in digital assets. However, at this point, it is worth emphasizing again that we think the fundamental dynamics continue to be bullish.
TECHNICAL ANALYSIS
BTC/USDT
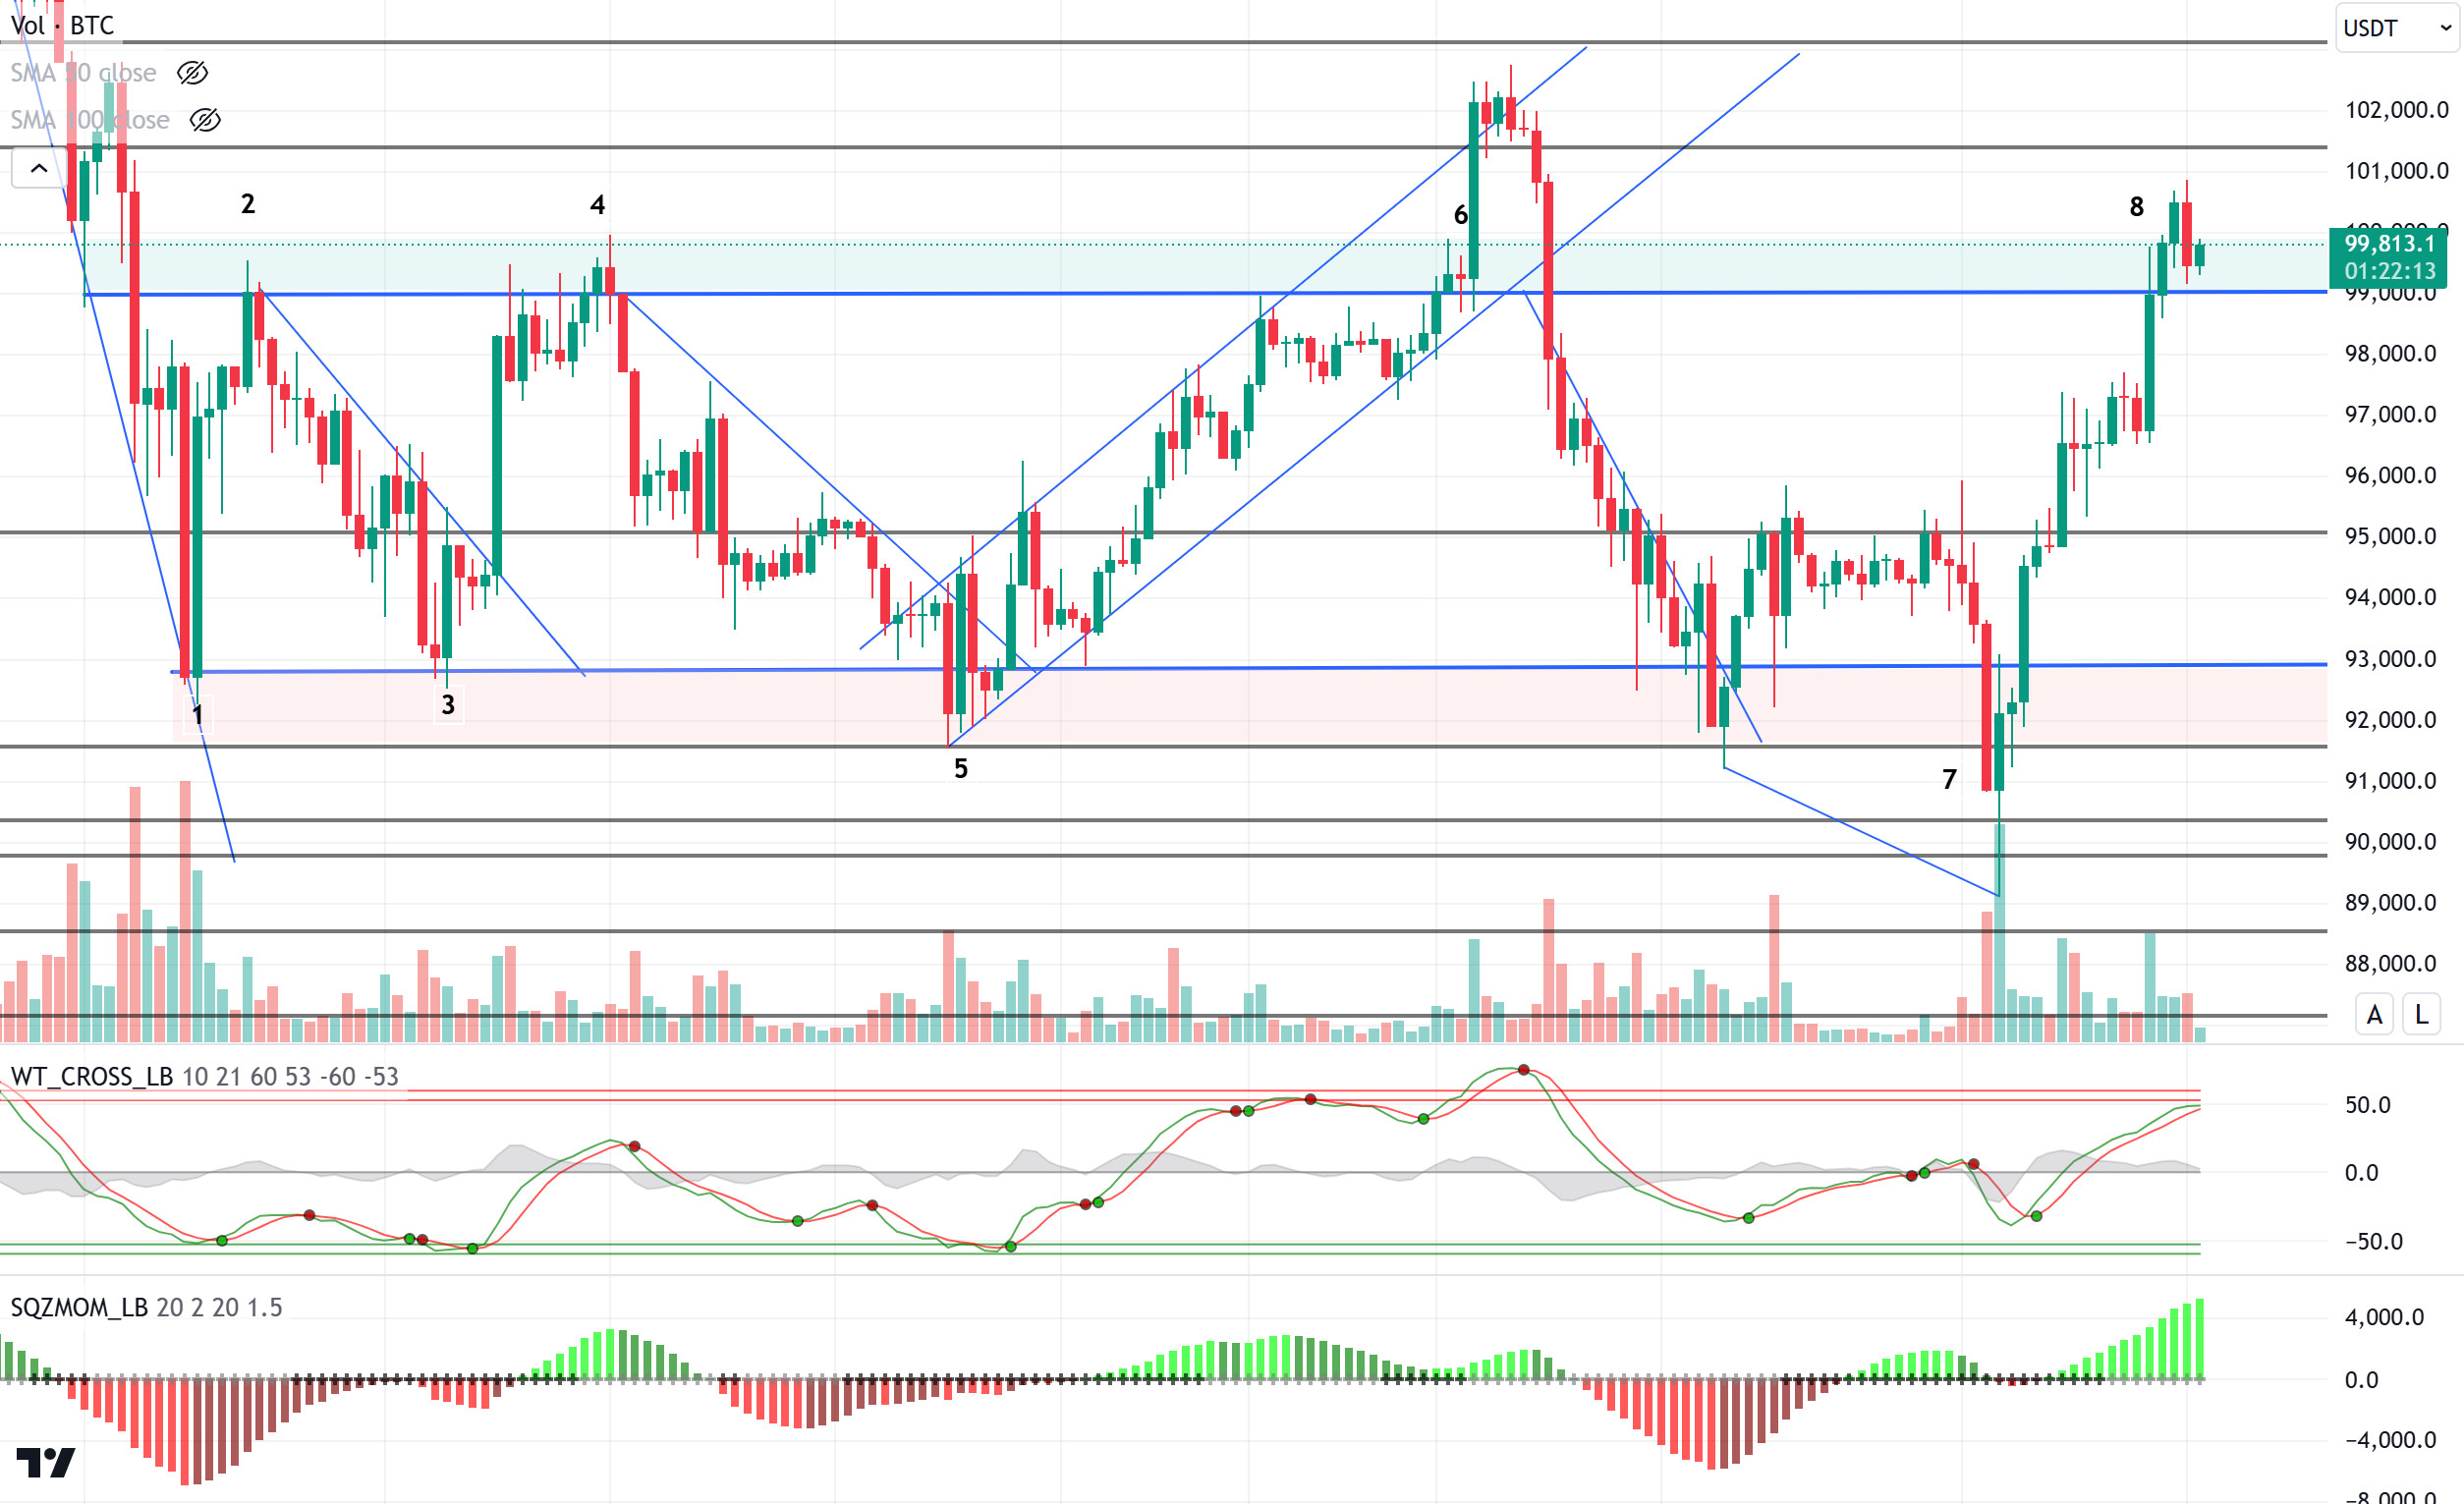
In the inflation data released in the US yesterday, headline inflation remained within expectations, while core inflation came in lower than expected, pushing the Bitcoin price above the $ 99,000 level. Following the macro data, Bitcoin spot ETFs saw a total net inflow of 755 million dollars. This was the first net inflow after four consecutive days of net outflows. Fidelity FBTC: $463 million net inflows, totaling $12.506 billion.
Looking at the technical outlook, BTC price has once again tested six-digit levels, bouncing back from its low at 89,000. Breaking through minor resistance levels one by one, BTC is currently trading at 99,700 within the green zone above the 99,100-resistance level. We have observed that the price has retreated below the 95,000 level three times before after testing these levels. Indeed, when we look at the technical oscillators, we see that the buy signal has weakened and the momentum indicator has peaked. While the 97,200 level appears as support in the correction of the rise, the increase in optimism with the D.Trump inauguration on January 20 may limit corrections in BTC price. In this direction, new ATH levels may come to the agenda as it settles above six-digit levels.
Supports 97,200 – 95,000 – 92,800
Resistances 99,100 – 101,400 – 103,000
ETH/USDT
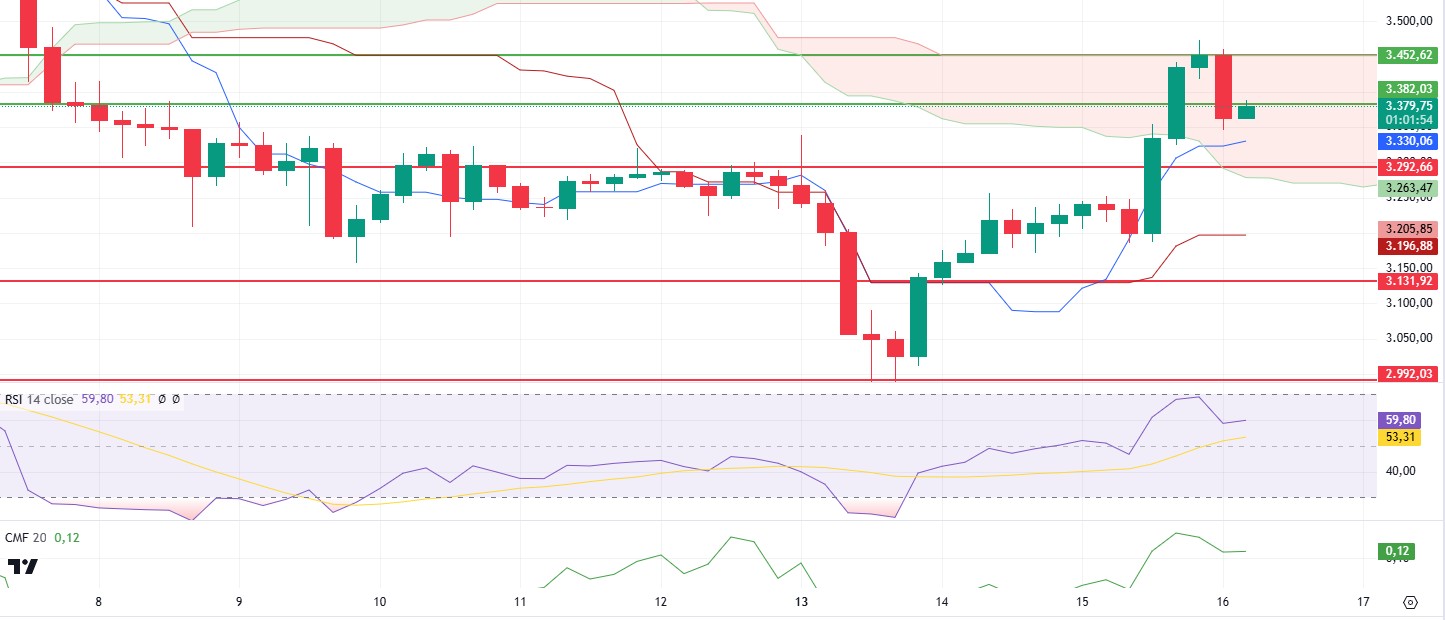
Ethereum exhibited strong price action as the US Consumer Price Index data released last night came in line with expectations. This rise, which started by exceeding the 3,292 level, lasted until the kumo cloud resistance at 3,452. However, the selling pressure encountered at this level caused the price to fall below the 3,382 support again in the overnight hours.
Looking at the technical indicators, the Relative Strength Index (RSI) was bullish along with the price, reaching the overbought zone for a while before pulling back slightly. However, the RSI still indicates that the bullish momentum continues. The Chaikin Money Flow (CMF) indicator is trending sideways in the positive territory, indicating that buyers continue to dominate and market liquidity remains strong. Looking at the Ichimoku indicator, the price is above both the tenkan and kijun levels, giving short-term bullish signals. In addition, the positive signals formed by the tenkan level cutting the kijun level upwards and the price hovering in the kumo cloud are among the strong signs supporting the market outlook.
While the 3.452 level stands out as an important resistance in the short term, if this level is exceeded, it seems likely that the upward momentum will accelerate and new peak attempts will be realized. On the other hand, 3,292 level should be followed as the main support on the downside. A close below this level could increase selling pressure and trigger a bearish scenario.
Supports 3,292 – 3,131 – 2,992
Resistances 3,382 – 3,452 – 3,565
XRP/USDT
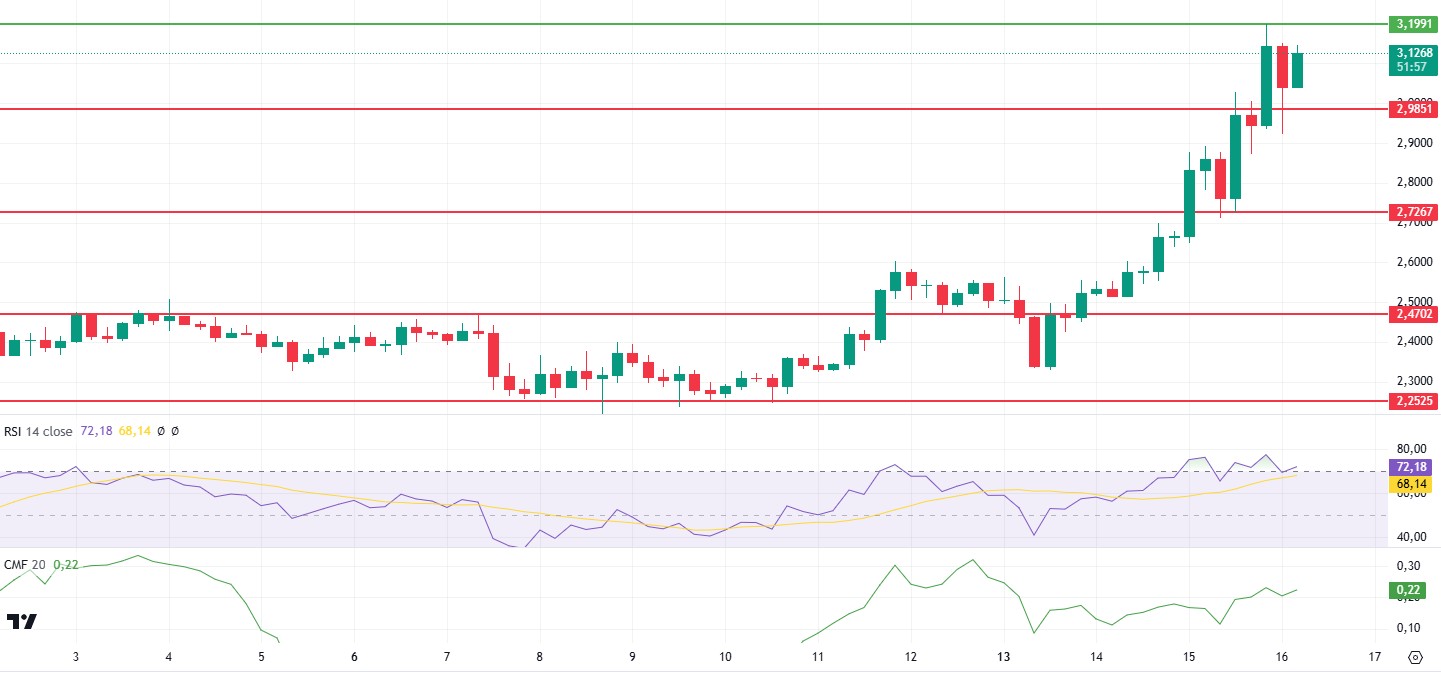
With the US Consumer Price Index data released yesterday evening coming in line with expectations and ETF expectations gaining strength, XRP experienced a very serious rise and managed to exceed the $ 3 level and managed to rise to $ 3.2 and continues to price at the level of 3.12.
Looking at the technical indicators, it is seen that the Relative Strength Index (RSI) indicator exhibits horizontal movements in the overbought zone without being parallel to the price. However, its momentum upward direction manages to maintain the positive structure. Chaikin Money Flow (CMF), on the other hand, managed to rise up to the level of 0.23 due to yesterday’s rise, indicating that buyers are regaining strength.
As a result, if there is no weakening in momentum during the day, the rise can be expected to continue. Especially exceeding the 3.20 level seems important. The 2.98 level looks like critical support. A break of this level may cause some retracement.
Supports 2.9851 – 2.7268 – 2.4702
Resistances 3.1991 – 3.3260- 3.5039
SOL/USDT
JPMorgan estimated that Solana ETP approvals could attract around $3-6 billion in new assets. Recent data showed that Solana has acquired more than 10 million unique active addresses in the last 8 weeks and more than 7 million active addresses in the last 22 days. Meanwhile, Burwick Law is suing Pump.fun on behalf of investors who lost money in failed meme coins and other questionable projects.
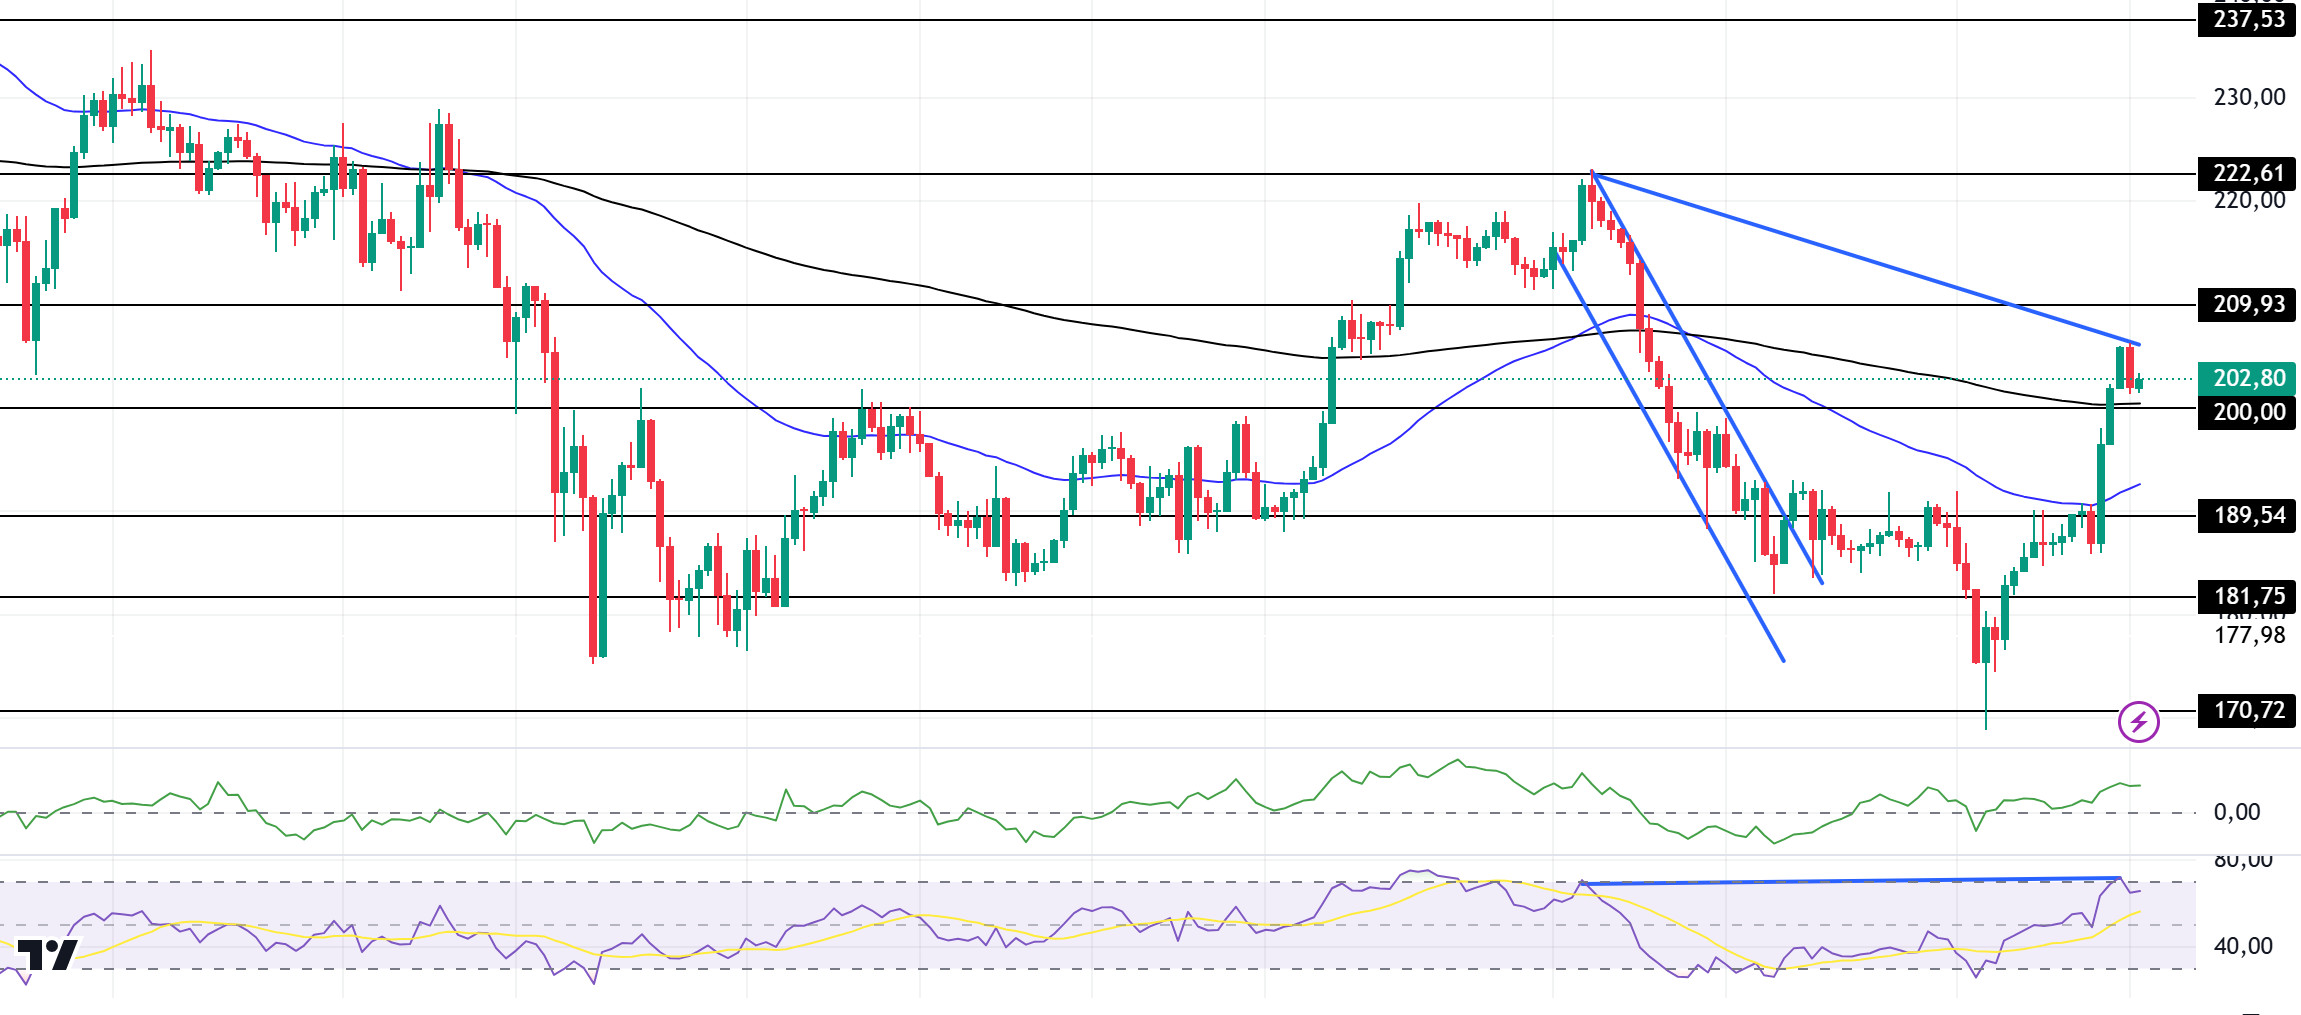
Solana continued its upward momentum and broke the strong resistance at 200.00. On the 4-hour timeframe, the 50 EMA (Blue Line) continues to be below the 200 EMA (Black Line). At the same time, the asset is above the 50 EMA and the 200 EMA. This suggests that the uptrend may continue in the short term. When we examine the Chaikin Money Flow (CMF)20 indicator, it is in positive territory and money inflows continue to increase. However, the Relative Strength Index (RSI)14 indicator is at a positive level, slightly retreating from the overbought level. However, the negative mismatch seems to have worked. This may push the price down to the level of the moving averages. The 222.61 level appears to be a very strong resistance point in the uptrend driven by both the upcoming macroeconomic data and the news in the Solana ecosystem. If it breaks here, the rise may continue. In case of retracements for the opposite reasons or due to profit sales, the 189.54 support level can be triggered. If the price reaches these support levels, a potential bullish opportunity may arise if momentum increases.
Supports 200.00 – 189.54 – 181.75
Resistances 209.93 – 222.61 – 237.53
DOGE/USDT
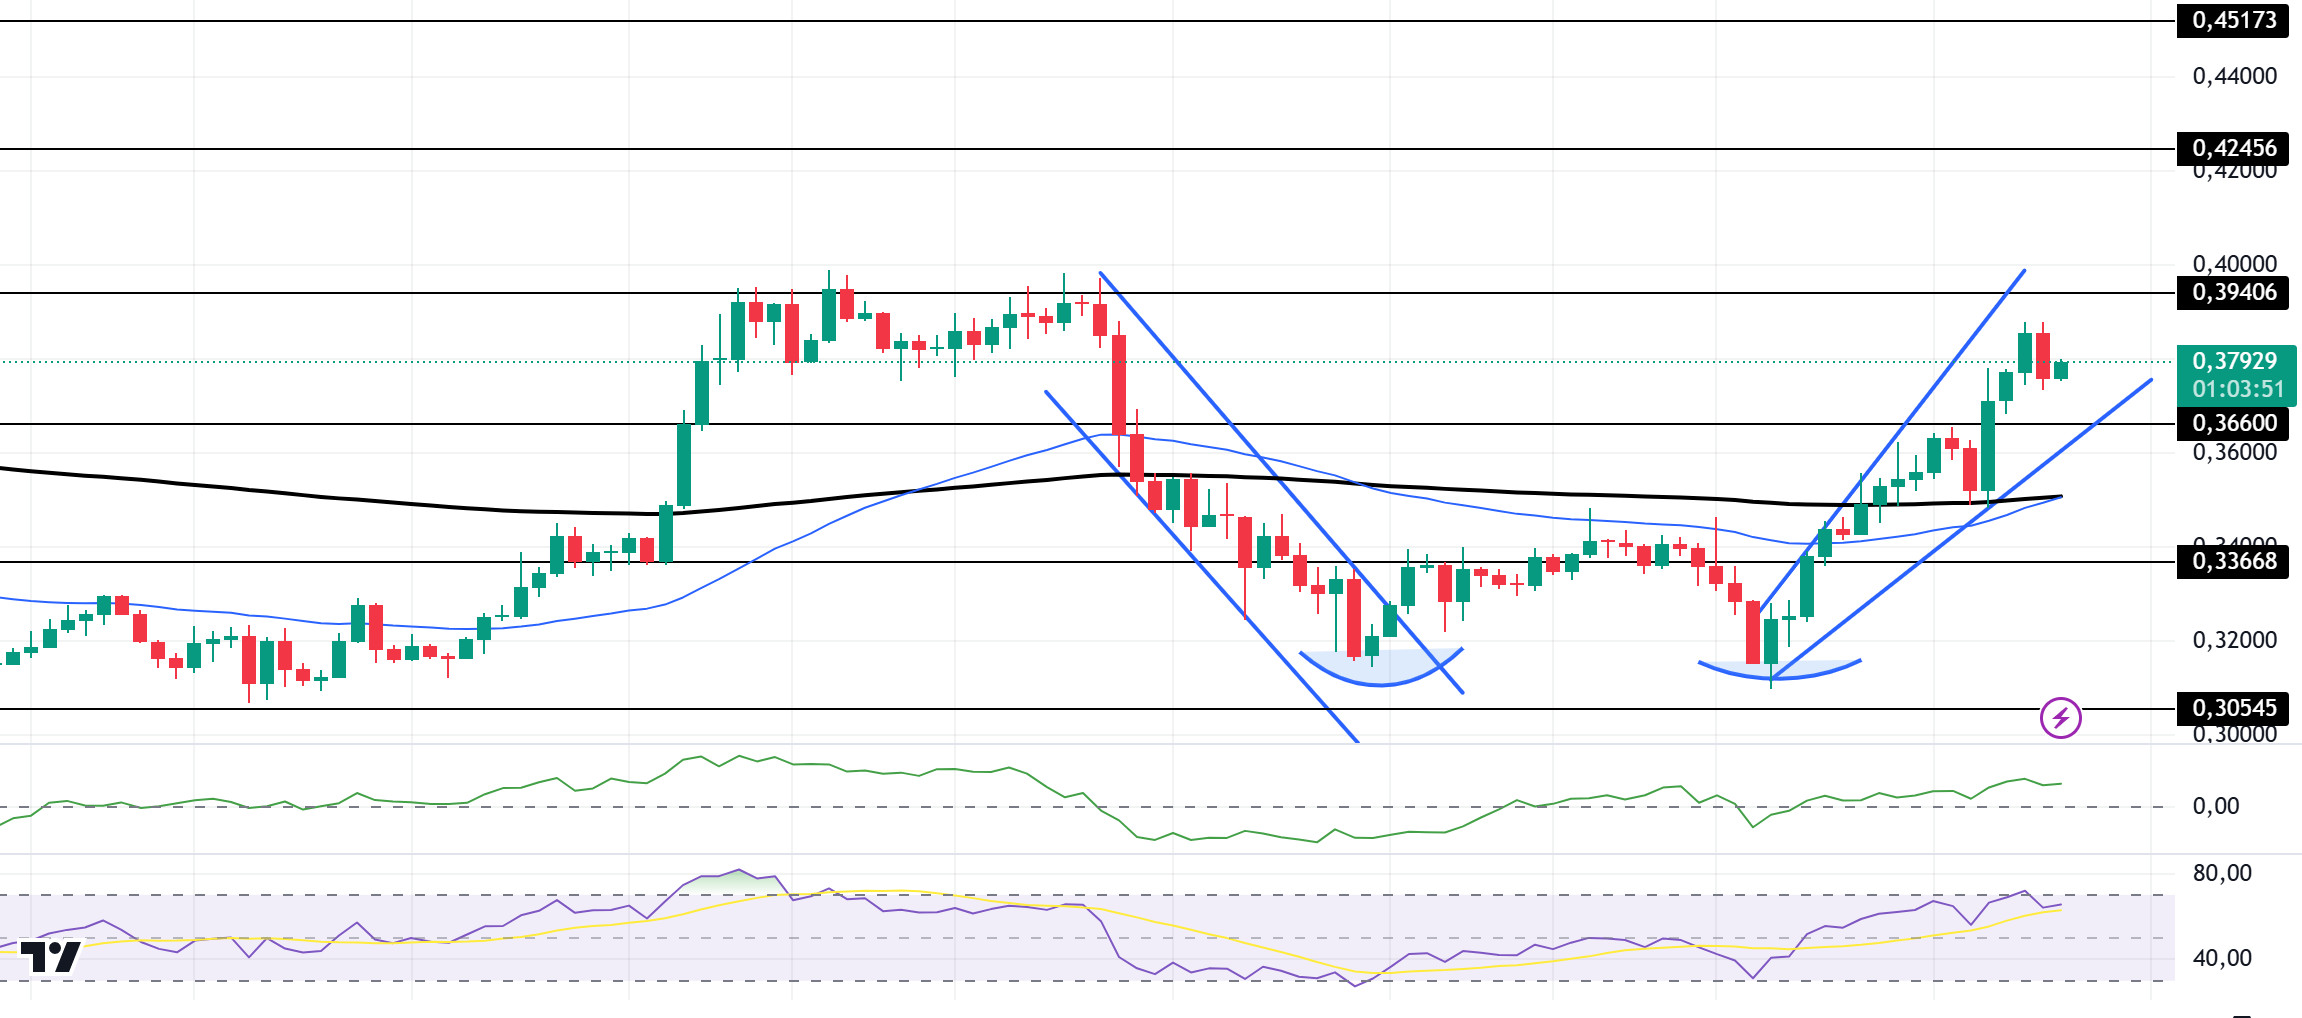
Doge has continued its uptrend since our analysis yesterday. Looking at the chart, the asset broke the 50 EMA (Blue Line) and 200 EMA (Black Line) to the upside on the 4-hour timeframe. The 50 EMA and the 200 EMA are overlapping. At the time of writing, the price increased by about 8.10% from the 200 EMA support. However, the rising wedge pattern should be taken into account. This could be a sign that the price will retrace. On the other hand, the double bottom pattern seems to have worked. When we examine the Chaikin Money Flow (CMF)20 indicator, it is in positive territory and money inflows continue to increase. However, Relative Strength Index (RSI)14 retreated slightly from the overbought zone and started to remove the bulge. The 0.39406 level appears to be a very strong resistance point in the uptrend due to political reasons, macroeconomic data and innovations in the DOGE coin. In case of possible pullbacks due to political, macroeconomic reasons or negativities in the ecosystem, the 0.33668 level, which is the base level of the trend, is an important support. If the price reaches these support levels, a potential bullish opportunity may arise if momentum increases.
Supports 0.36600 – 0.33668 – 0.30545
Resistances 0.39406 – 0.42456 – 0.45173
LEGAL NOTICE
The investment information, comments and recommendations contained herein do not constitute investment advice. Investment advisory services are provided individually by authorized institutions taking into account the risk and return preferences of individuals. The comments and recommendations contained herein are of a general nature. These recommendations may not be suitable for your financial situation and risk and return preferences. Therefore, making an investment decision based solely on the information contained herein may not produce results in line with your expectations.


