
MARKET SUMMARY
Latest Situation in Crypto Assets
| Assets | Last Price | 24h Change | Dominance | Market Cap. |
|---|---|---|---|---|
| BTC | 101,345.29 | 1.58% | 56.28% | 2,01 T |
| ETH | 3,366.15 | -0.38% | 11.37% | 405,53 B |
| XRP | 3.337 | 7.45% | 7.44% | 192,14 B |
| SOLANA | 212.58 | 4.82% | 2.90% | 103,47 B |
| DOGE | 0.3862 | 1.66% | 1.60% | 57,00 B |
| CARDANO | 1.126 | 6.44% | 1.11% | 39,61 B |
| TRX | 0.2447 | 2.85% | 0.59% | 21,09 B |
| AVAX | 40.92 | 4.28% | 0.47% | 16,84 B |
| LINK | 23.93 | 10.08% | 0.43% | 15,29 B |
| SHIB | 0.00002279 | 2.30% | 0.38% | 13,42 B |
| DOT | 7.367 | 4.69% | 0.32% | 11,35 B |
*Prepared on 1.17.2025 at 07:00 (UTC)
WHAT’S LEFT BEHIND
Trump Plans to Make Cryptocurrencies a National Priority
According to Bloomberg, US President-elect Trump plans to issue an executive order to establish cryptocurrencies as a national priority. It also envisions the establishment of a cryptocurrency advisory committee within the government. These steps aim to provide government agencies with guidance on collaborating with the crypto industry and increase the strategic importance of the industry. The Trump team has also reportedly discussed the issue of stopping crypto lawsuits at the federal level.
US-Centered Cryptocurrencies are a Matter of Controversy
Following the New York Post’s news that “Trump looks favorably on the inclusion of US-based cryptocurrencies in reserves such as Bitcoin”, the cryptocurrencies that could be included in this group have started to be discussed in the public.
Tether Considers Expanding US Operations
According to Bloomberg, Tether CEO Paolo Ardoino stated that the crypto regulatory environment in the US could improve following Trump’s election. Tether is considering expanding its US operations in this context. In addition, Tether’s profits for 2024 are expected to exceed $10 billion due to the 120% increase in Bitcoin assets.
ETH Transfer from World Liberty
According to Spot On Chain, the Trump-linked World Liberty fund transferred another 1,038 ETH (about $3.44 million) to Coinbase about 3 hours ago. The fund has transferred a total of 14,611 ETH (about $47.34 million) in the last two days and still holds 5,111 ETH (about $17.12 million).
Biden May Delegate Authority to Trump for TikTok Ban
According to ABC News, the Biden administration has announced that it will not take action to force TikTok to close its US operations. While TikTok is expected to take the initiative, the implementation of the ban will be left to the Trump administration.
Great Expectation for Litecoin ETFs
CoinDesk estimates that if the Litecoin ETF receives market acceptance similar to the Bitcoin ETF, it could generate between $290 million and $580 million in capital inflows in the first year. This is equivalent to about 6% of LTC’s current market capitalization.
HIGHLIGHTS OF THE DAY
Important Economic Calender Data
| Time | News | Expectation | Previous |
|---|---|---|---|
| – | ApeCoin (APE): 15.60M Token Unlock | – | – |
| – | Echelon Prime (PRIME): 750K Token Unlock | – | – |
| 13:30 | US Building Permits (Dec) | 1.46M | 1.49M |
| 13:30 | US Housing Starts (Dec) | 1.33M | 1.29M |
INFORMATION
*The calendar is based on UTC (Coordinated Universal Time) time zone.
The economic calendar content on the relevant page is obtained from reliable news and data providers. The news in the economic calendar content, the date and time of the announcement of the news, possible changes in the previous, expectations and announced figures are made by the data provider institutions. Darkex cannot be held responsible for possible changes that may arise from similar situations.
MARKET COMPASS
The ever-evolving expectations regarding the US Federal Reserve’s (FED) interest rate cut path have been a dynamic that has been effective on both the dollar and treasury bond yields in recent weeks. In addition to the latest inflation and other indicators, yesterday’s statements by Federal Open Market Committee (FOMC) member Waller, as well as expectations that the Bank may be relatively bolder in interest rate cuts this year, came to the fore, limiting the rise in the dollar and bond yields. We are watching the positive reflections of this on digital assets with increased risk appetite. Trump, who will take over the White House on Monday, is thought to be planning to make crypto a “national priority” and his first actions will be extremely important for the value of digital cryptocurrencies.
We believe that the new short rally that started yesterday during the Wall Street session is highly volatile. Expectations for Monday and beyond, as well as the size of expiring assets in the options market, may limit upward and downward movements, leading to rapid changes in narrow price areas with high volatility.
From the short term to the big picture.
The victory of former President Trump on November 5, which was one of the main pillars of our bullish expectation for the long-term outlook in digital assets, produced a result in line with our predictions. Afterwards, the appointments made by the president-elect and the increasing regulatory expectations for the crypto ecosystem in the US and the emergence of BTC as a reserve continued to take place in our equation as positive variables. Although it is expected to continue at a slower pace, the preservation of expectations that the FED will continue its interest rate cut cycle (for now) and the volume in ETFs based on crypto assets indicating an increase in institutional investor interest support our upward forecast for the big picture for now. In the short term, given the nature of the market and pricing behavior, we think it would not be surprising to see occasional pauses or pullbacks in digital assets. However, at this point, it is worth emphasizing again that we think the fundamental dynamics continue to be bullish.
TECHNICAL ANALYSIS
BTC/USDT
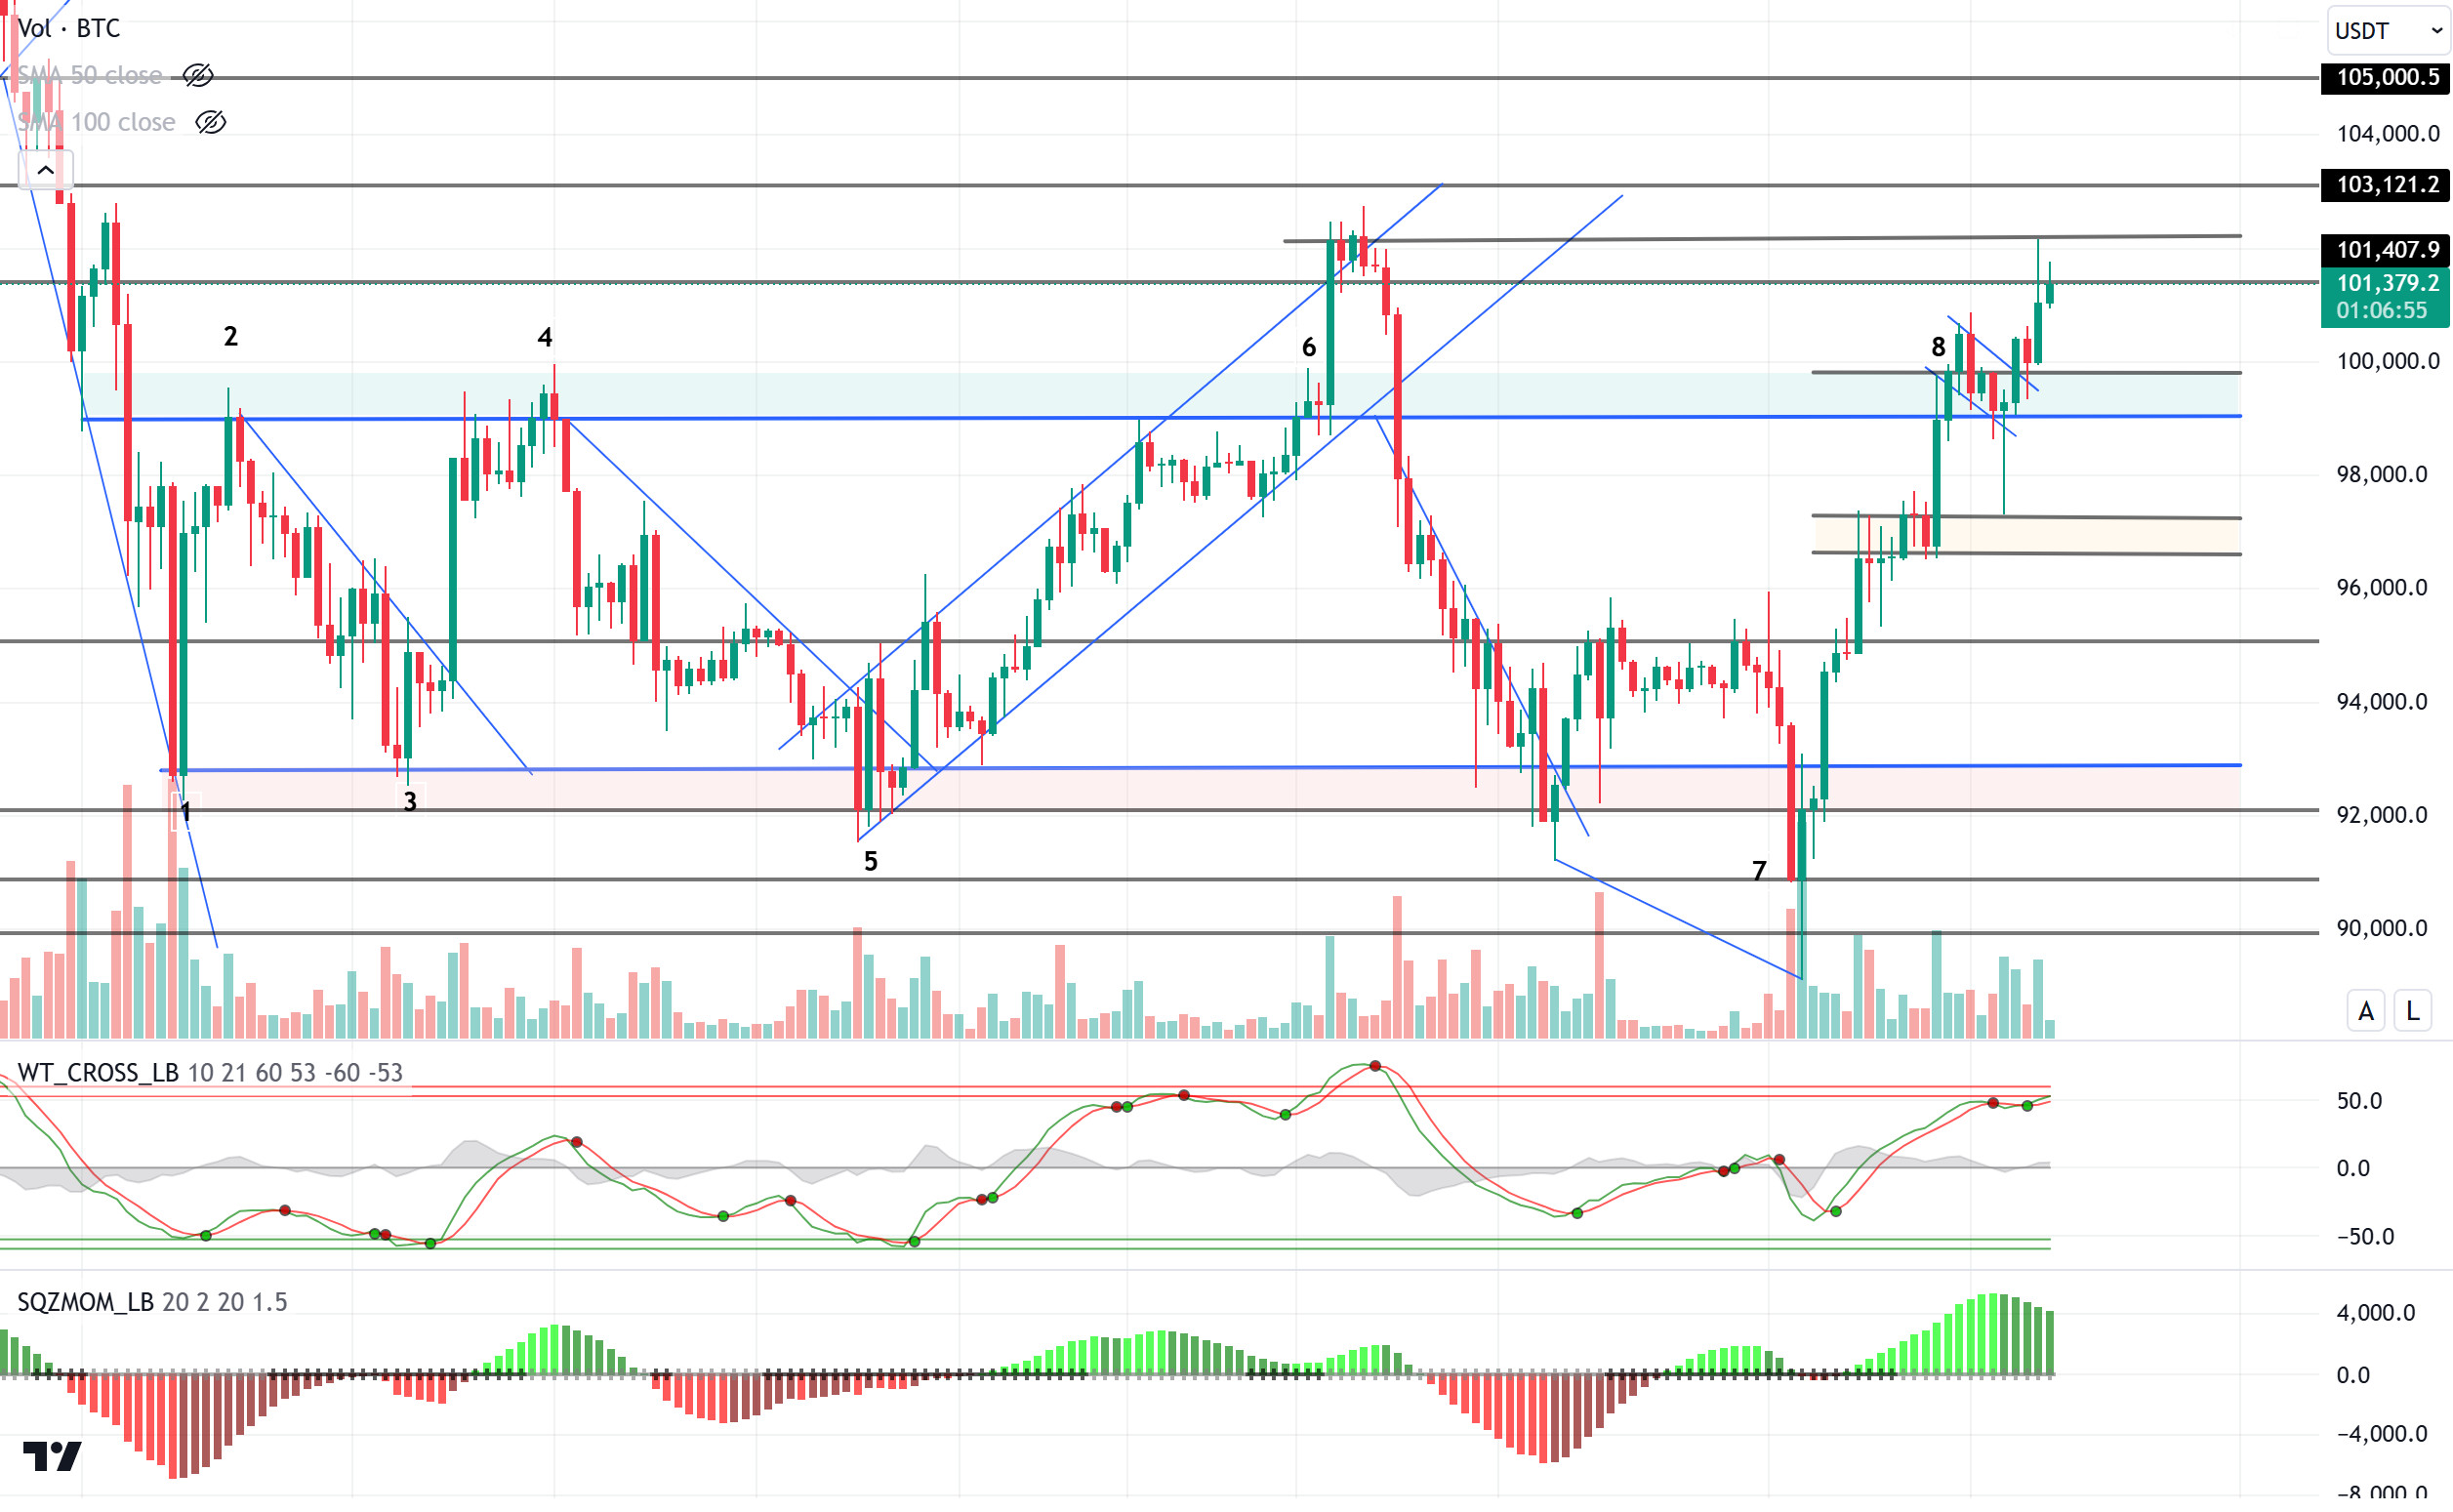
Ahead of US President D. Trump’s inauguration on January 20th, cryptocurrency market activity continues to increase. Trump’s national priority executive order and advisory committee insights on the crypto market are having a remarkable impact on the market. Accordingly, Spot ETFs saw net inflows of $626 million as of yesterday and the ETF net asset ratio reached 5.78%. At the same time, 22,000 BTC expired in Bitcoin options, while the Put/Call ratio was reported as 0.95. The maximum pain point was at 96,000, while the notional value of the options was recorded at $2.19 billion. The implied volatility (IV) of the short-term options increased and the market may exhibit a bullish bias towards the 105,000 level in the short term.
When we look at the technical outlook, BTC, which as of yesterday threw a pin at 97,200, the support level as a result of the heating of technical oscillators, managed to recover again. The rapidly recovering price tested the 102,200 level by completing the flag formation formed at its peak. In BTC, which is currently trading at the resistance level of 101,400, technical oscillators continue to generate buy/sell signals in the overbought zone. We can say that the momentum indicator is weakening in the positive zone. While 103,000 is the resistance level in the continuation of the rise, the persistence above the 100,000 level will be followed in a possible pullback and can be considered as a reference point. Pricing above this level may bring new ATH levels to the agenda with the Trump factor.
Supports: : 99,100 – 97,200 – 95,000
Resistances 101,400 – 103,000 – 105,000
ETH/USDT
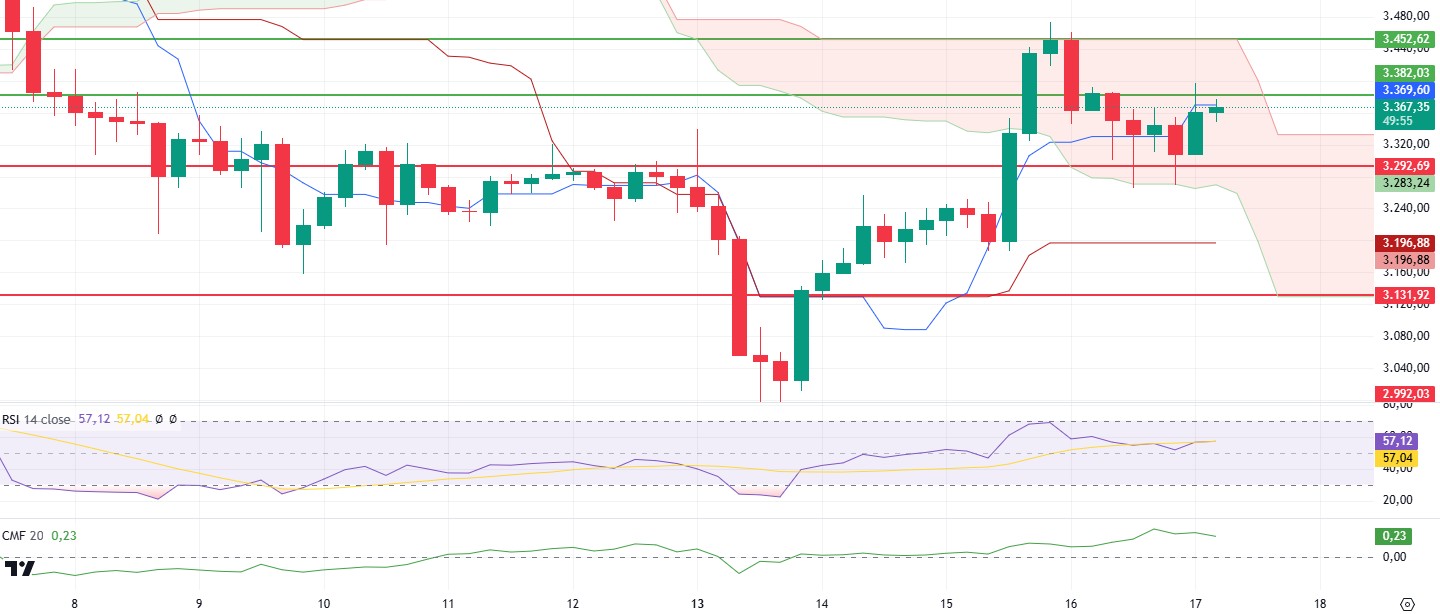
Although ETH dipped below the 3,292-support level twice in the evening hours yesterday, it recovered with the double bottom it formed in this region and rose to the 3,382 resistance level. However, it faced selling pressure again at this level and the upward movement of the price remained limited.
Looking at the technical indicators, the Relative Strength Index (RSI) has turned back up after correcting in the overbought area. This positive outlook of the RSI suggests that the market may remain under buyers’ control in the short term and maintain its bullish potential. The Ichimoku indicator gives important signals about market uncertainty and trend strength. The narrowing of the upper band of the Kumo cloud suggests that the price is at a critical decision point and a potential trend may take shape. However, the upward movement of the Tenkan level confirms that buyers are gaining strength in the short term. If the price can maintain the current levels and hold above the cloud, this could point to a positive trend in the medium term. However, it should be kept in mind that selling pressure may increase if the price moves below the cloud. The Chaikin Money Flow (CMF) indicator has been slightly bearish recently, indicating that buyers are losing momentum. However, the fact that CMF remains in positive territory suggests that buyer pressure on the market has not completely disappeared.
Considering the support and resistance levels, the 3,292 level stands out as an important support. A close below this level could weaken the market momentum and trigger a downtrend. However, a daily close above the 3,382 resistance could allow ETH to resume its uptrend, in which case the next target will be higher resistance levels.
Supports 3,292 – 3,131 – 2,992
Resistances 3,382 – 3,452 – 3,565
XRP/USDT
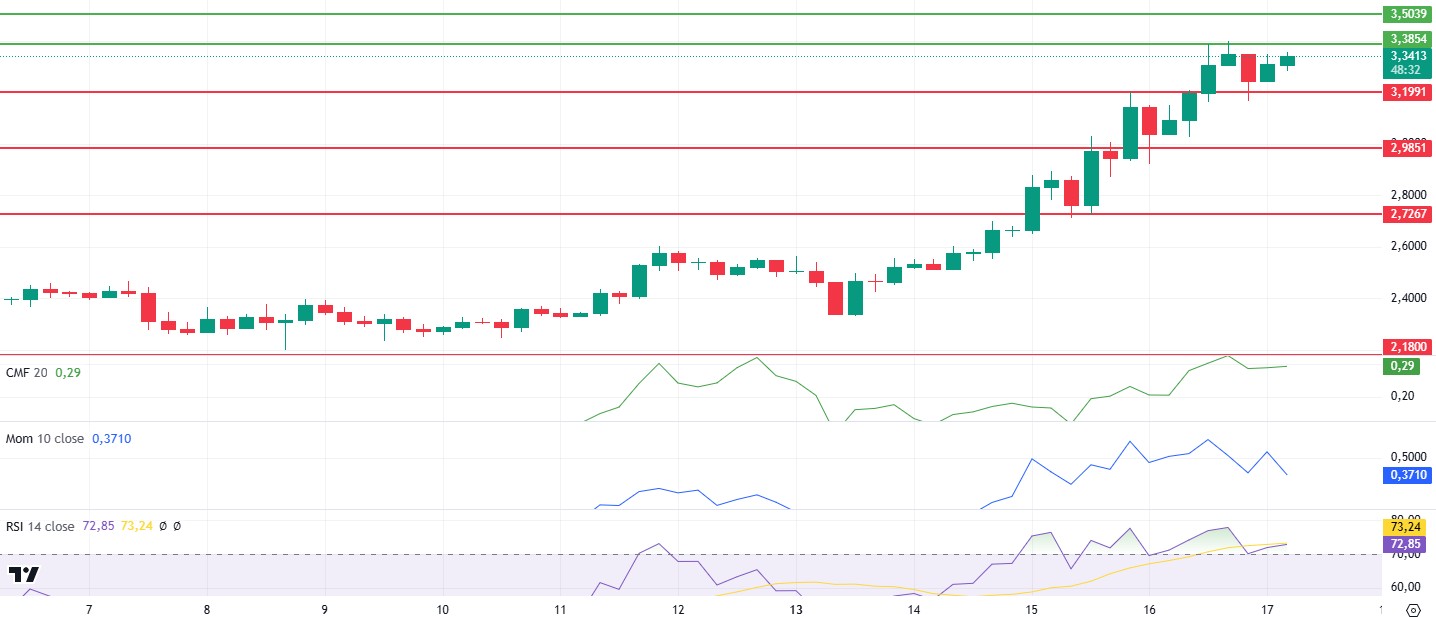
XRP continued its uptrend, breaking through the 3.20 resistance as news broke that Trump was open to the idea of creating a reserve of cryptocurrencies in the US. In addition, the positive atmosphere created by ETF expectations in the market has contributed to XRP’s strong bullish rally in recent days. The technical indicators of XRP, which exhibits remarkable movements with the effect of these fundamental factors, also attract attention.
The Relative Strength Index (RSI) is currently trending sideways in the overbought area. The fact that the RSI remains in this zone indicates that buyers continue to dominate the overall outlook. However, momentum is weakening and the RSI may need a correction at these levels. However, this may cause the price to move sideways by slowing down its bullish momentum. On the other hand, the Chaikin Money Flow (CMF) indicator continues to move upwards in the positive territory, indicating that the money inflows in the market continue and buyers are still strong.
In the current price movements, 3.38 and 3.19 levels stand out as critical thresholds. The price can be expected to move horizontally between these two levels. However, an upside break of the 3.38 level could trigger a continuation of the uptrend and bring higher resistance levels to the agenda. Otherwise, a downside break of the 3.19 level could trigger the start of a deeper correction in the market.
Supports 3.1991 – 2.9851 – 2.7268
Resistances 3.3854 – 3.5039- 3.7057
SOL/USDT
Mert Mumtaz of Helios Labs suggested that Solana could become deflationary following a proposed vote scheduled for next week. Sol Strategies has made its staking rewards non-custodial mobile staking app available for the first time through Orangefin Ventures, which has capitalized on investment opportunities in Solana-based projects. On the other hand, the Solana Tokenomics Revision Proposed by Multicoin Capital Multicoin Capital proposed a variable rate token emission model for Solana, aiming to reduce inflation and stabilize the network. On Onchain, Solana trading volume increased by 85% in the last 24 hours.
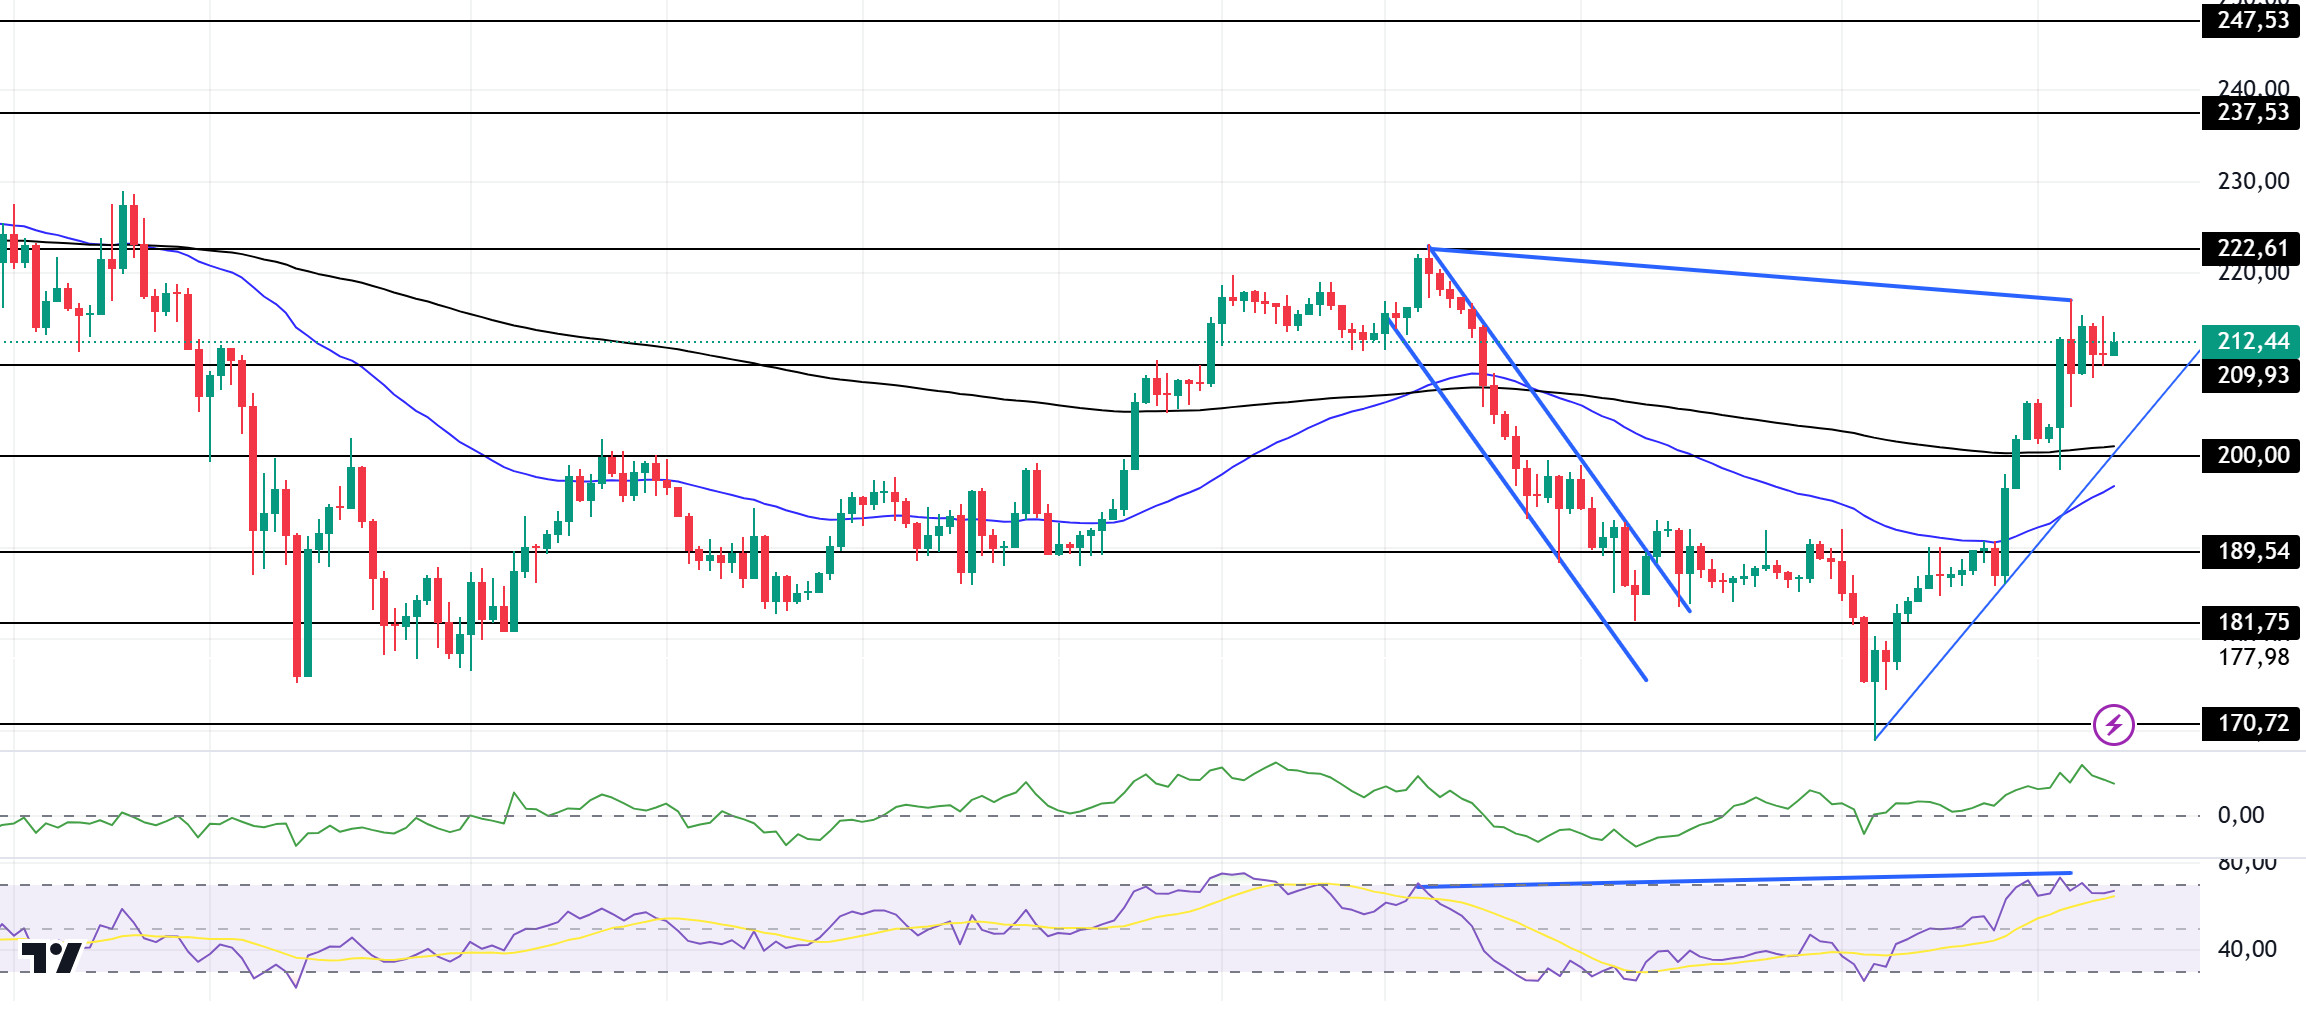
Solana moved sideways after its upward acceleration and managed to hold above 209.93. On the 4-hour timeframe, the 50 EMA (Blue Line) continues to be below the 200 EMA (Black Line). At the same time, the asset is above the 50 EMA and the 200 EMA. This suggests that the uptrend may continue in the short term. When we examine the Chaikin Money Flow (CMF)20 indicator, it is in positive territory and inflows have reached saturation and started to decrease. This may cause some pullback. However, the Relative Strength Index (RSI)14 indicator is at the overbought level. However, the negative mismatch is noteworthy. This could push the price down to the level of the moving averages. The 222.61 level is a very strong resistance point in the uptrend driven by both the upcoming macroeconomic data and the news in the Solana ecosystem. If it breaks here, the rise may continue. In case of retracements for the opposite reasons or due to profit sales, the 200.00 support level can be triggered. If the price comes to these support levels, a potential bullish opportunity may arise if momentum increases.
Supports 209.93 – 200.00 – 189.54
Resistances 222.61 – 237.53 – 247.53
DOGE/USDT
DOGE’s total liquidation amounted to $11.85 million, with short positions accounting for more than 60% of this figure. Traders with short positions had a total liquidation of $7.61 million, while traders with long positions recorded a liquidation of $4.24 million. Whales, however, accumulated 0.36M DOGE in 48 hours as the price held above the $200 resistance.
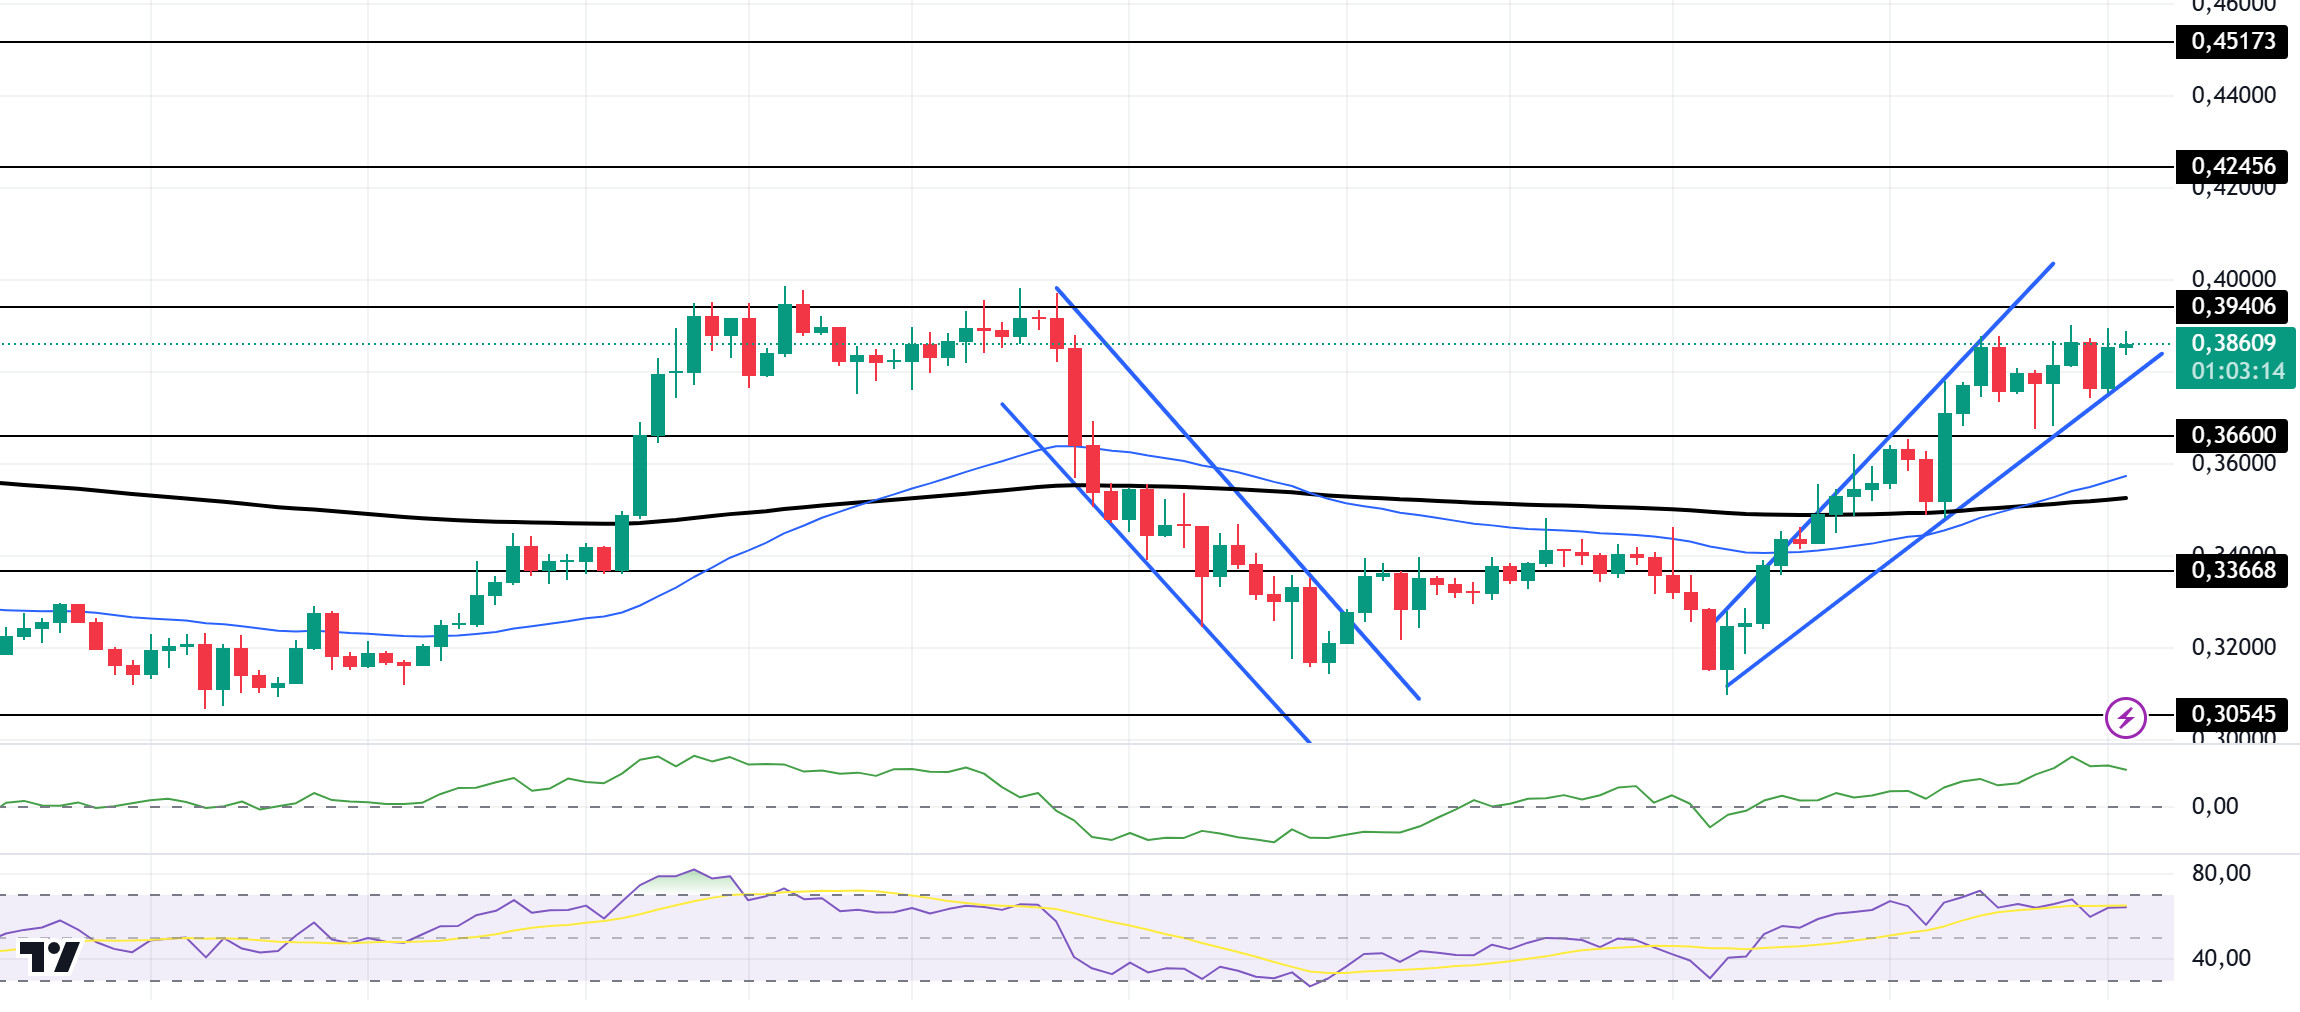
Doge continued its uptrend, holding above the 0.36600 level. Looking at the chart, the asset is above the 50 EMA (Blue Line) and the 200 EMA (Black Line) on the 4-hour timeframe. The 50 EMA is also starting to hover above the 200 EMA. This could be the beginning of a medium-term uptrend. However, the rising wedge pattern should be taken into consideration. This could be a sign that the price will retrace. When we analyze the Chaikin Money Flow (CMF)20 indicator, it is in positive territory but money inflows are decreasing. However, Relative Strength Index (RSI)14 started moving towards the overbought zone again. This may cause a pullback. The 0.39406 level appears to be a very strong resistance point in the rises due to political reasons, macroeconomic data and innovations in the DOGE coin. In case of possible pullbacks due to political, macroeconomic reasons or negativity in the ecosystem, the 0.33668 level, which is the base level of the trend, is an important support. If the price reaches these support levels, a potential bullish opportunity may arise if momentum increases.
Supports 0.36600 – 0.33668 – 0.30545
Resistances 0.39406 – 0.42456 – 0.45173
LEGAL NOTICE
The investment information, comments and recommendations contained herein do not constitute investment advice. Investment advisory services are provided individually by authorized institutions taking into account the risk and return preferences of individuals. The comments and recommendations contained herein are of a general nature. These recommendations may not be suitable for your financial situation and risk and return preferences. Therefore, making an investment decision based solely on the information contained herein may not produce results in line with your expectations.

