MARKET SUMMARY
Latest Situation in Crypto Assets
| Assets | Last Price | 24h Change | Dominance | Market Cap |
|---|---|---|---|---|
| BTC | 93,116.85 | -1.43% | 57.33% | 1,84 T |
| ETH | 3,431.41 | 0.45% | 12.85% | 412,48 B |
| SOLANA | 230.94 | -3.01% | 3.41% | 109,64 B |
| XRP | 1.380 | -3.17% | 2.45% | 78,66 B |
| DOGE | 0.3924 | -2.59% | 1.80% | 57,67 B |
| CARDANO | 0.9621 | -0.94% | 1.05% | 33,70 B |
| AVAX | 42.55 | 2.22% | 0.54% | 17,40 B |
| TRX | 0.1982 | -0.89% | 0.53% | 17,11 B |
| SHIB | 0.00002460 | -2.08% | 0.45% | 14,49 B |
| DOT | 8.143 | -2.04% | 0.39% | 12,39 B |
| LINK | 18.11 | 3.82% | 0.35% | 11,34 B |
*Prepared on 11.27.2024 at 07:00 (UTC)
WHAT’S LEFT BEHIND
Fed Minutes: Gradual Rate Cuts and the Possibility of a Pause
Minutes from the Federal Reserve’s most recent policy meeting showed that Fed officials generally favored caution on future rate cuts as the economy remains robust and inflation slowly cools. According to the minutes, “participants expect that a gradual transition to a more “neutral” policy stance over time may be appropriate if data are about the same as expected, inflation continues to fall sustainably to 2%, and the economy remains near maximum employment.”
Buying Opportunities in Bitcoin: Standard Chartered Forecasts
Bitcoin price started the week with a decline and fell below $ 92,000. Standard Chartered analysts maintain their targets of $ 125,000 for the end of the year and $ 200,000 for the end of 2025, while pointing out certain purchase levels to their clients.
Record Bug Bounty Program from Uniswap Labs
Uniswap Labs has announced the largest bug bounty program in history for the Uniswap v4 core contract. The total reward pool for this program, which was launched to identify vulnerabilities, was announced as $15.5 million.
Starknet Becomes the First Ethereum Layer-2 Network to Offer Staking
Ethereum Layer-2 scaling solution Starknet announced the launch of staking support. This feature represents a first among Layer-2 networks, allowing users to generate revenue by staking tokens.
Pump.fun Continues to Dominate Solana DEX Trading Volume
Pump.fun accounted for 62.3% of Solana’s decentralized exchange (DEX) trading volume in November. For three months running, the platform has contributed more than 60% of Solana DEX trading volume. By allowing users to create tokens for free, Pump.fun has enabled the emergence of many of the popular meme coins.
Big SOL Transfer from Pump.fun to Kraken
According to on-chain data, Pump.fun has transferred 99,999 SOL (about $22.74 million) to the Kraken exchange. So far, a total of 893,242 SOL have been deposited to this address at an average price of $164. Pump.fun’s total earnings amounted to approximately 1,487 million SOL ($344.85 million).
HIGHLIGHTS OF THE DAY
Important Economic Calender Data
| Time | News | Expectation | Previous |
|---|---|---|---|
| 5:00 PM | Helium Community Call | – | – |
| – | GNY (GNY) 50MM Token Burn | – | – |
| – | Ethena (ENA) 12.86MM Token Unlock | – | – |
| 12:00 | ApeX (APEX) 9.24M Token Unlock | – | – |
| 13:00 | Tezos (XTZ) Town Hall 4: Explore gaming projects, tools, and partnerships on Tezos | – | – |
| 13:30 | US GDP (QoQ) (Q3) | 2.8% | 2.8% |
| 13:30 | US Initial Jobless Claims | 2015K | 213K |
| 13:30 | US Core Durable Goods Orders (MoM) (Oct) | 0.2% | 0.5% |
| 13:30 | US Durable Goods Orders (MoM) (Oct) | 0.4% | -0.7% |
| 14:00 | Yield Guild Games 14.08M Token Unlock | – | – |
| 14:45 | US Chicago PMI | 44.9 | 41.6 |
| 15:00 | US Core PCE Price Index (YoY) (Oct) | 2.8% | 2.7% |
| 15:00 | US Core PCE Price Index (MoM) (Oct) | 0.3% | 0.3% |
| 15:00 | US PCE Price index (YoY) (Oct) | 2.3% | 2.1% |
| 15:00 | US Pending Home Sales (MoM) (Oct) | -2.1% | 7.4% |
INFORMATION
*The calendar is based on UTC (Coordinated Universal Time) time zone.
The economic calendar content on the relevant page is obtained from reliable news and data providers. The news in the economic calendar content, the date and time of the announcement of the news, possible changes in the previous, expectations and announced figures are made by the data provider institutions. Darkex cannot be held responsible for possible changes that may arise from similar situations.
MARKET COMPASS
Global markets have been weighed down by the positive sentiment brought by the ceasefire in the Middle East and the results of the minutes of the last meeting of the US Federal Reserve (FED), as well as expectations of the chaotic global trade environment that will begin with the Trump era. Ahead of today’s important data from the US, traditional markets have an indecisive outlook with these agenda items. Digital assets are welcoming the new day positively.
The minutes of the last meeting of the Federal Open Market Committee (FOMC) showed that FED officials were close to interest rate cuts, albeit cautiously, and the probability of a rate cut for the meeting on December 18 has risen above 60% on the CME FedWatch Tool. The US-brokered ceasefire between Israel and Hamas and the news that Trump has plans for crypto regulation can also be listed as positive dynamics for today. It is rumored that the President-elect may appoint the Commodity Futures Trading Commission (CFTC) for crypto regulation. In addition, Trump’s new appointments are likely to increase trade war and tariff tensions in the coming period. However, we can say that digital asset investors are focusing on good news headlines for now and the rallies that started during yesterday’s US trading were formed on this basis. Ahead of the Thanksgiving holiday, markets will be watching macro indicators from the US today.
Inflation and growth in the US under scrutiny…
Among the data set to be released today, growth (GDP) and PCE Price Index will provide information on how comfortable the FED will be for further rate cuts and may have an impact on asset prices.

Source: Bloomberg
The world’s largest economy grew by 2.8% in the third quarter of the year, according to the first estimate. In the second quarter, the economy grew by 3%. The 2.8% rate announced for the third quarter is not expected to be revised, but a surprise figure could cause the stones to shift. Still, for this to happen, we are really waiting for a very distant 2.8%.

Source: Bloomberg
According to the latest report, personal consumption expenditures, which account for about 67% of the US economy, were again the largest contributor to growth. While the change in private inventories contributed to growth last quarter, it was a negative component in the calculation in the third quarter. As a feature of the pre-election period, government spending increased, limiting the decline in growth from 3% to 2.8%. We do not expect a major revision in the changes in these items. Therefore, our expectation is that there will be no major change in the first figure announced. However, a downside surprise could fuel expectations that the FED might be bold in cutting interest rates, providing an excuse for the recent rally in the market. A higher-than-expected figure, on the other hand, may have a restraining effect on risk appetite.
An hour and a half after the growth data, all eyes will turn to the PCE Price Index, which is used by the FED to monitor inflation. Since we think that a more micro perspective is needed, we think it would be better to consider the core PCE figures on a monthly basis for this month’s data.
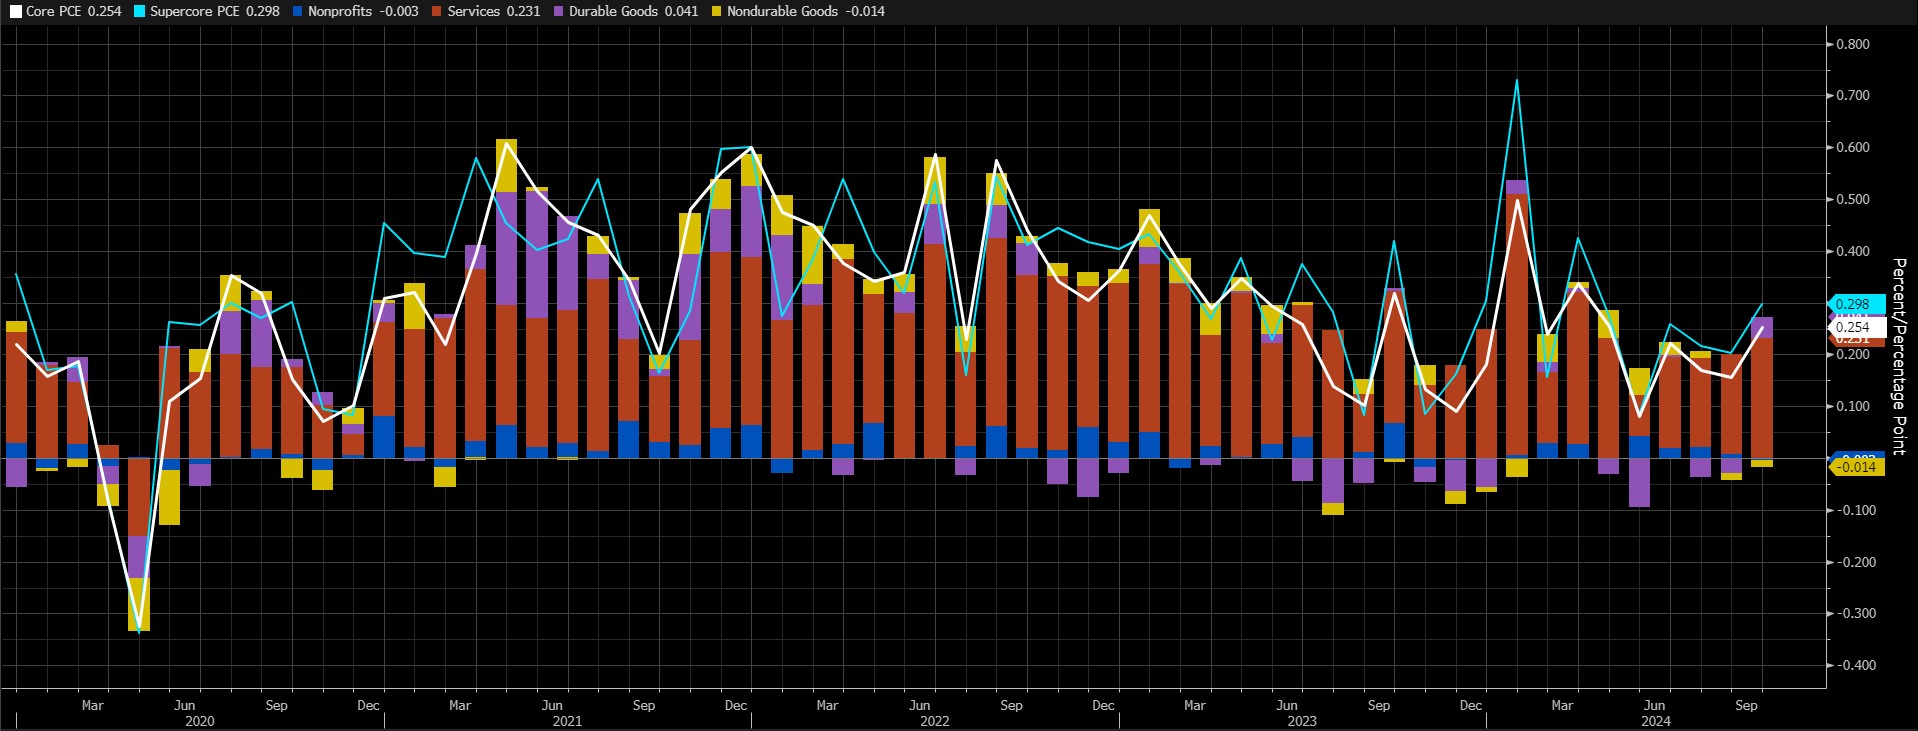
Source: Bloomberg
This figure had pointed to an increase of around 0.3% in September. Expectations are for the same level in October. Services inflation seems to be the item that will make the highest contribution to the index again. A higher-than-expected data may suggest that the FED should put the brakes on interest rate cuts and we think this may reduce risk appetite. On the other hand, a lower data may provide a basis for a rise in digital assets.
From the short term to the big picture.
The victory of former President Trump on November 5, which was one of the main pillars of our bullish expectation for the long-term outlook in digital assets, produced a result in line with our forecasts. Despite Powell’s cautious messages in his recent speech, the Fed’s continuation of the interest rate cut cycle, and the volume in BTC ETFs indicating an increase in institutional investor interest (in addition, MicroStrategy’s BTC purchases, Microsoft’s start to evaluate the purchase, BlackRock’s BTC ETF options trading…) support our upside forecast for the big picture for now.
For the short term, given the nature of the market and pricing behavior, we think it would not be surprising to see occasional respite or pullbacks in digital assets. We have also evaluated the downward movements that occurred after Trump’s statements on tariffs in this context . Also, at this point, it would be useful to underline again that fundamental dynamics continue to be bullish. We continue to monitor the struggle between buyers whose appetite for taking new, upward positions may revive and the masses who may look for space for profit realization.
TECHNICAL ANALYSIS
BTC/USDT
The minutes of the US Federal Reserve meeting held on November 6-7 were released. According to the minutes, participants believe that a shift to a more “neutral” policy stance over time may be appropriate if data are within expectations, inflation continues to fall sustainably to 2% and the economy remains close to maximum employment, suggesting that Fed officials are open to gradual rate cuts in light of economic data.
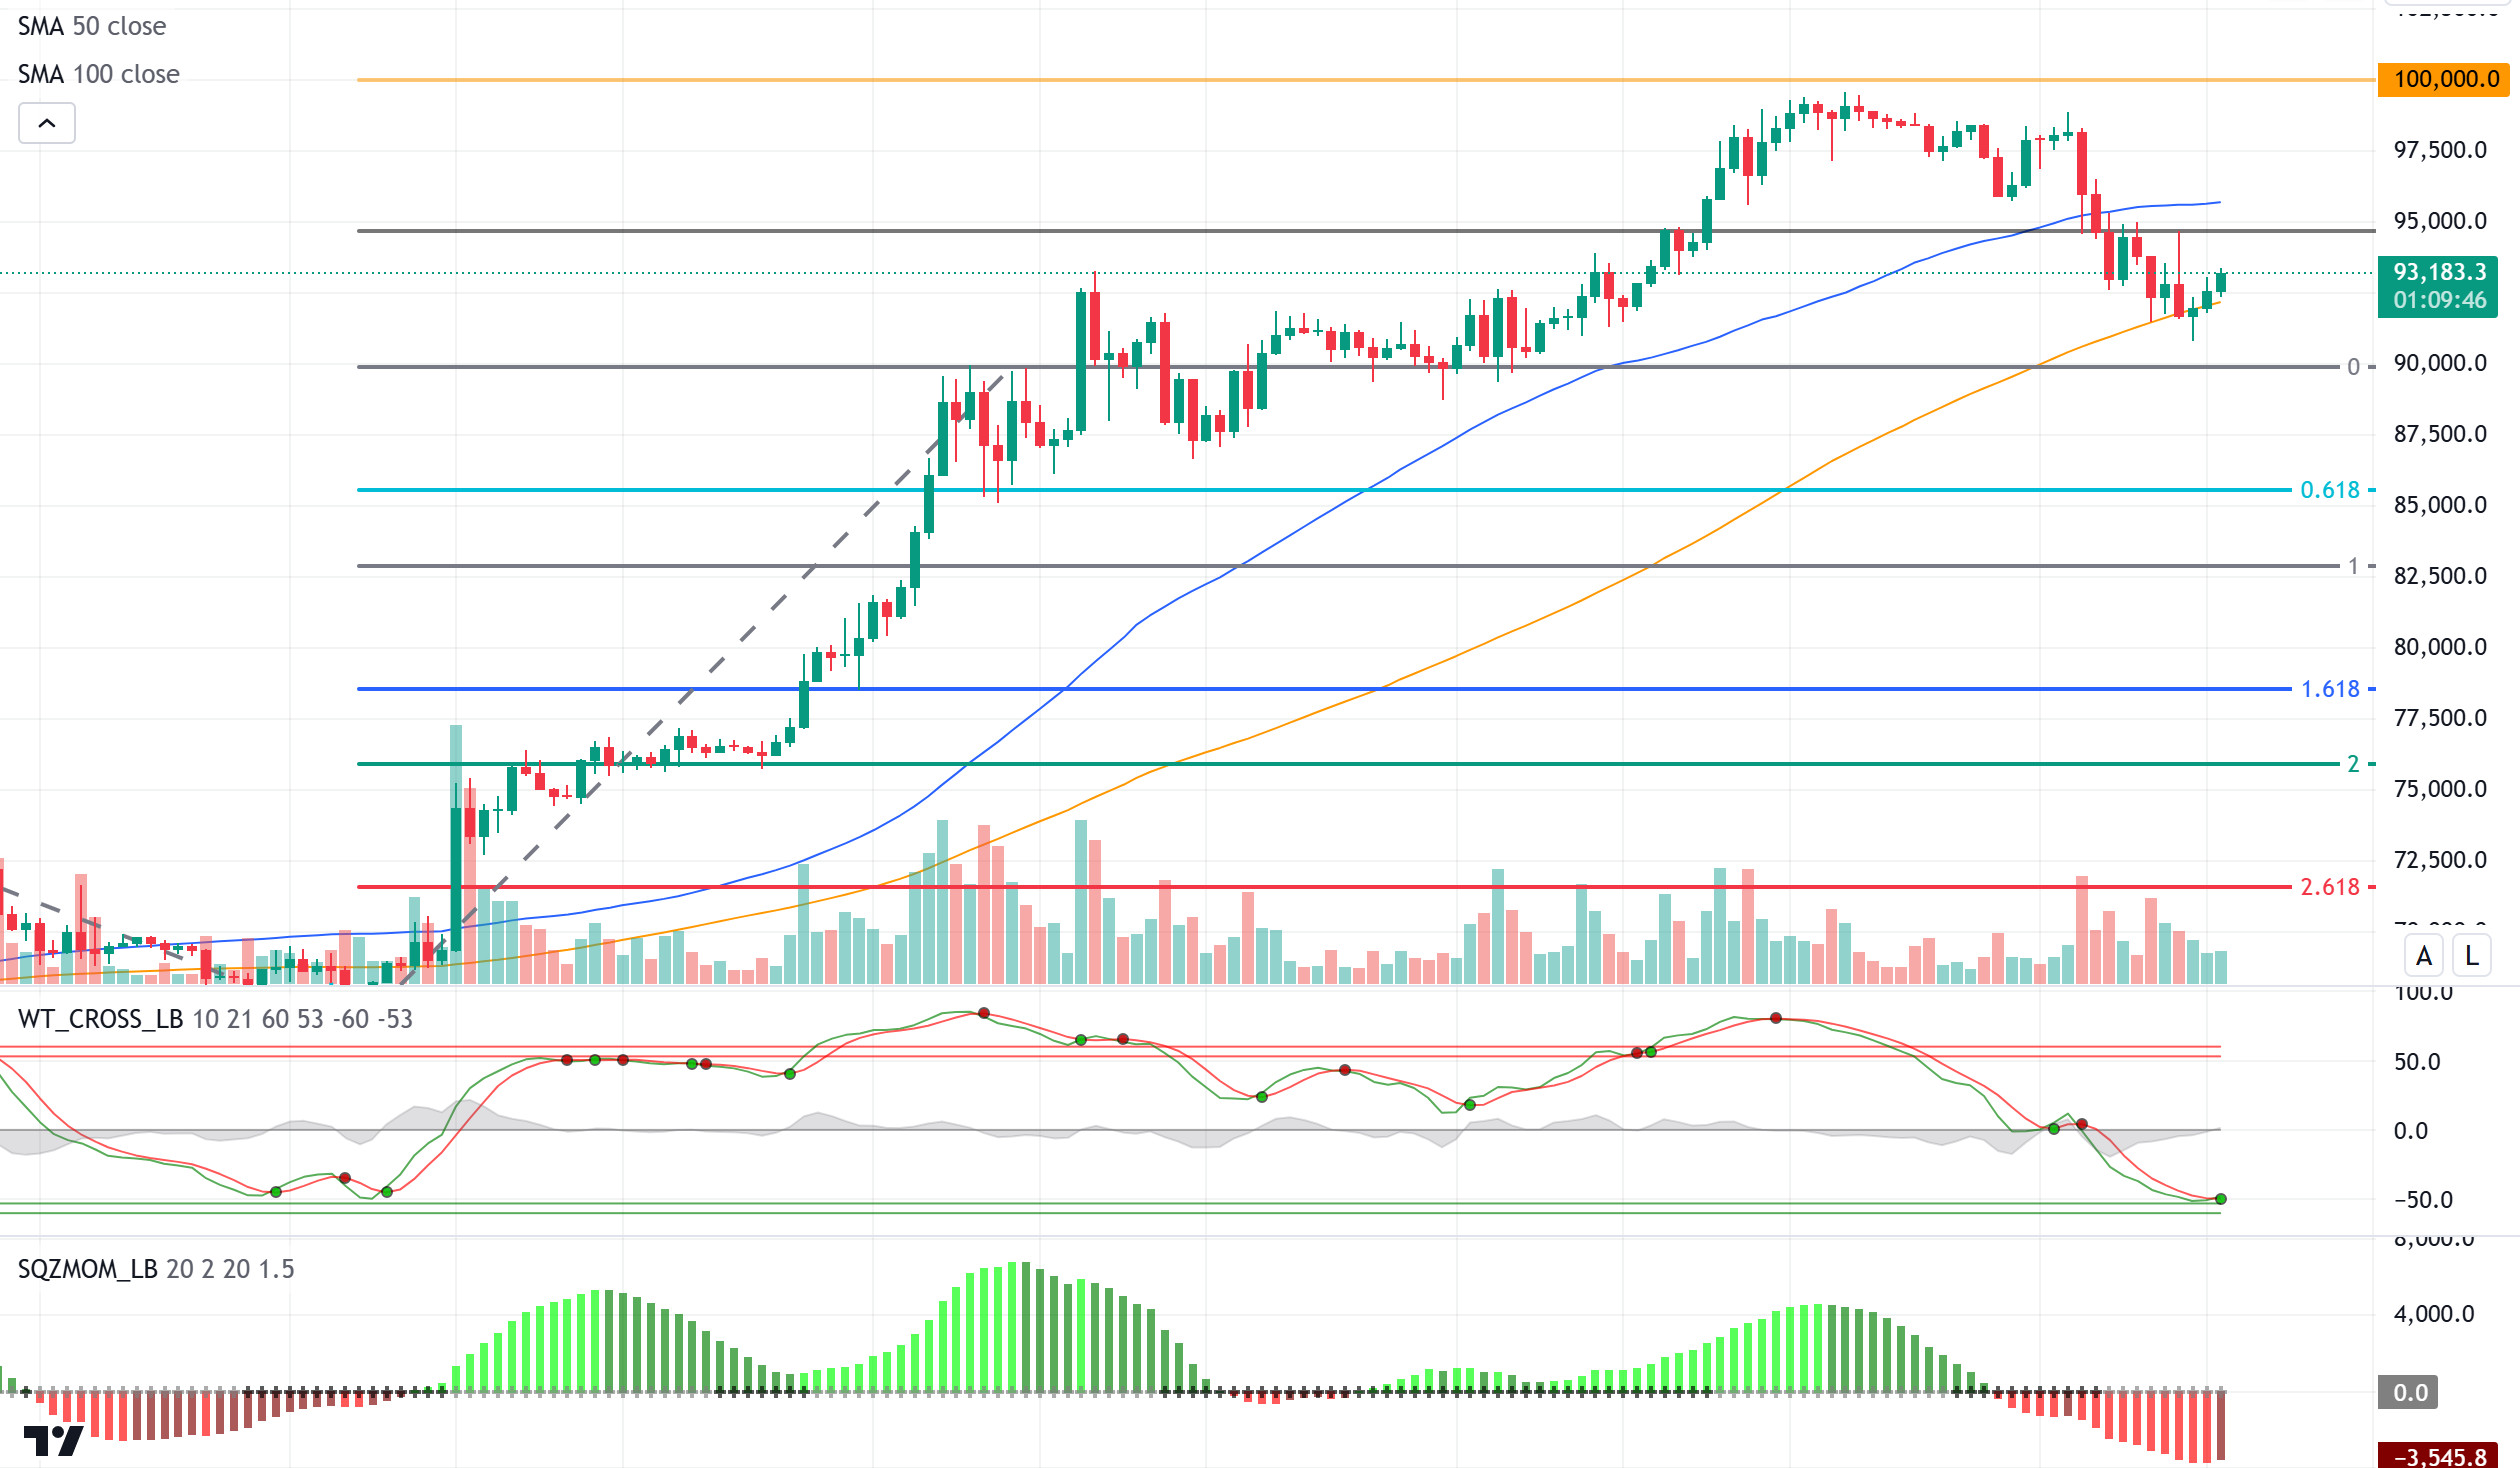
When we look at the BTC technical outlook with fundamental developments, we observed that as of yesterday, the price received support from the 100-day simple moving average (SMA) level of 92,500 and tested the 95,000 resistance level. Failing to cross this level, BTC continues to receive support from the moving average line again. In BTC, which is currently priced at 93,200, we see that technical oscillators give a buy signal on hourly charts, but we see that the momentum indicator is regaining strength. With the completion of the correction phase, if the price comes above the 95,000 level, the 100,000 level, which is seen as a critical threshold, can be tested again. In case the correction deepens, closes below the 100-day SMA will bring the major support level of 90,000 back to the agenda.
Supports:92,500 – 90,000 – 87,000
Resistances 95,000 – 99,655 – 100,000
ETH/USDT
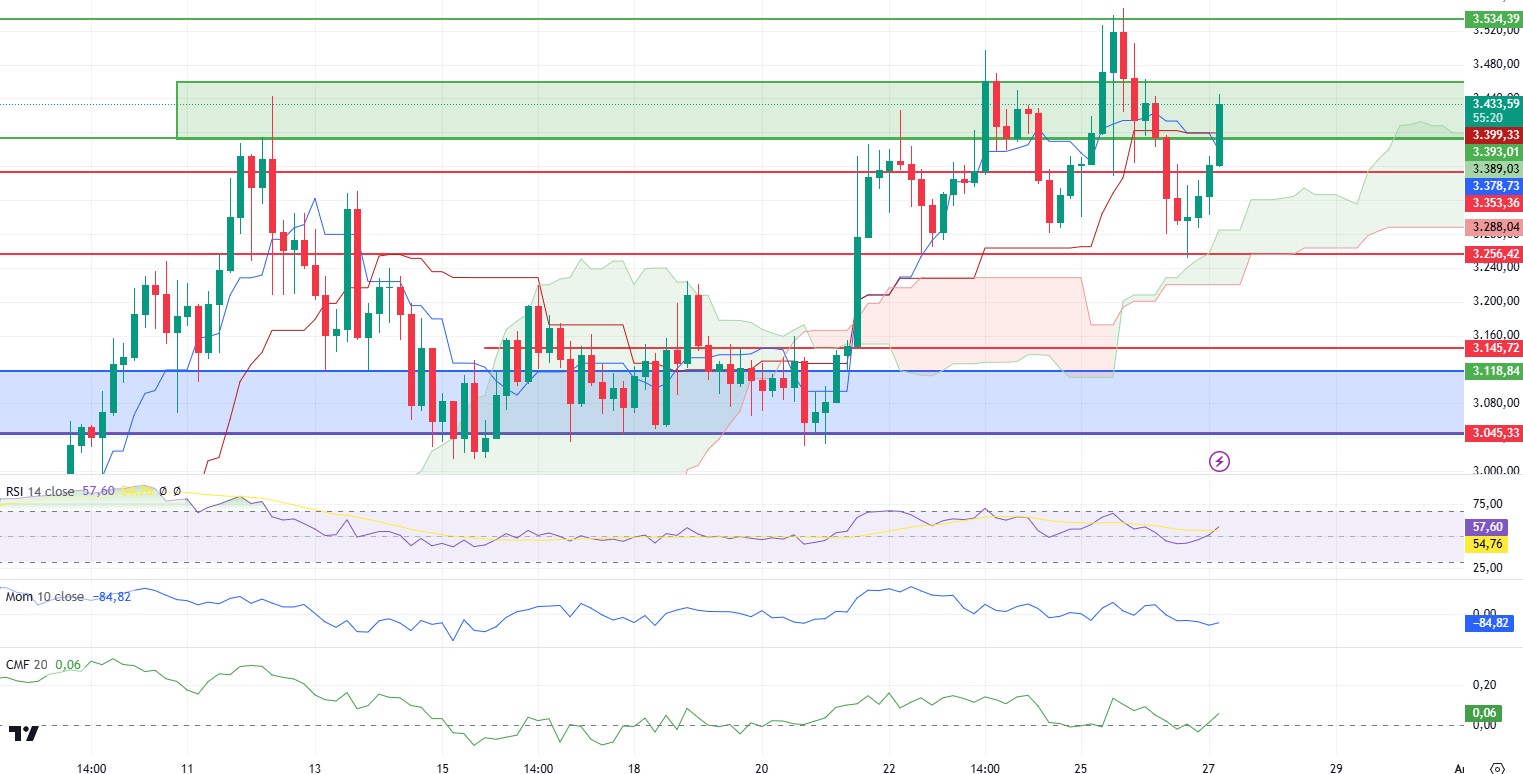
ETH regained bullish momentum with the opening of Asian markets and managed to break through the 3.353 and then 3.393 resistances. The absence of any negative divergence on the Relative Strength Index (RSI) for ETH, which has risen by making a double bottom, seems quite positive. With this rise, it is seen that momentum is moving up again. Chaikin Money Flow (CMF), on the other hand, is drawing a positive upward picture by coming back to the positive area after violating the zero zone. In addition, the fact that the price managed to rise above the tenkan and kijun levels also supports the positive outlook. However, it seems important for the price to rise above the 3.459 level to avoid a possible obo pattern. With a reaction from this level, there may be a bearish scenario dominated by the futures side. However, the breakout of the level may trigger a rapid rise to 3,534 and with the breakout of this region to 3,719.
Supports 3,393 – 3,353 – 3,256
Resistances 3,459 – 3,534 – 3,719
XRP/USDT
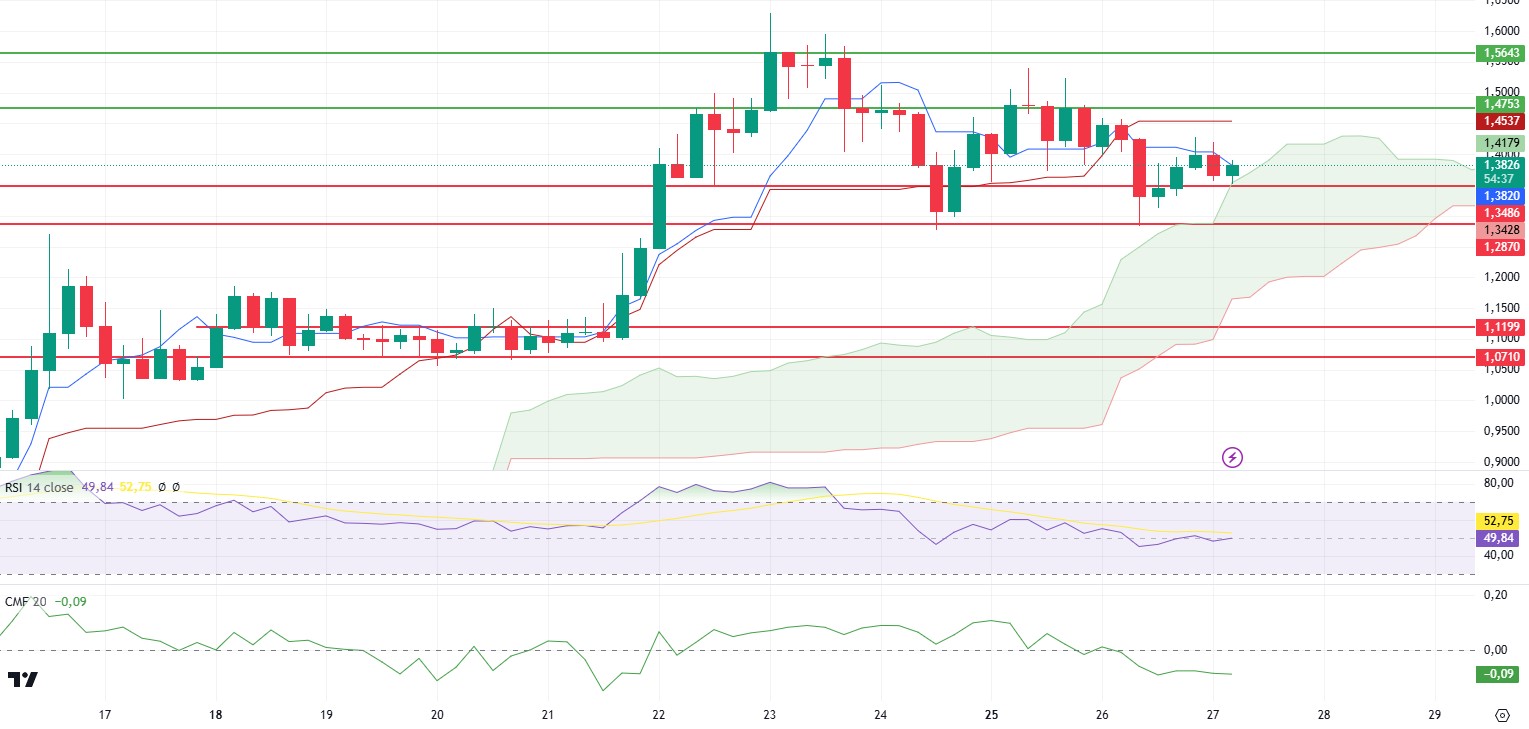
The sell signal on the Ichimoku indicator mentioned in the evening analysis for XRP seems to remain valid. As can be seen in the chart, the loss of the 1.34 zone for XRP, which managed to find support from the kumo cloud, could clearly initiate a negative scenario and bring declines to 1.28 – 1.12 levels, respectively. The Relative Strength Index (RSI) continues to move negatively, while Chaikin Money Flow (CMF) is down in the negative area and the selling pressure is increasing, supporting the negative picture. On the other hand, if the price regains the 1.47 level, the entire negative outlook may disappear and rapid rises to the 1.56 region may be seen.
Supports 1.3486 – 1.2382 – 1.0710
Resistances 1.4753 – 1.5643 – 1.7043
SOL/USDT
GDP data and Core PCE Price Index from the US will be important. Unexpected readings may cause fluctuations in prices. On the other hand, tensions in the Middle East have eased with a ceasefire.
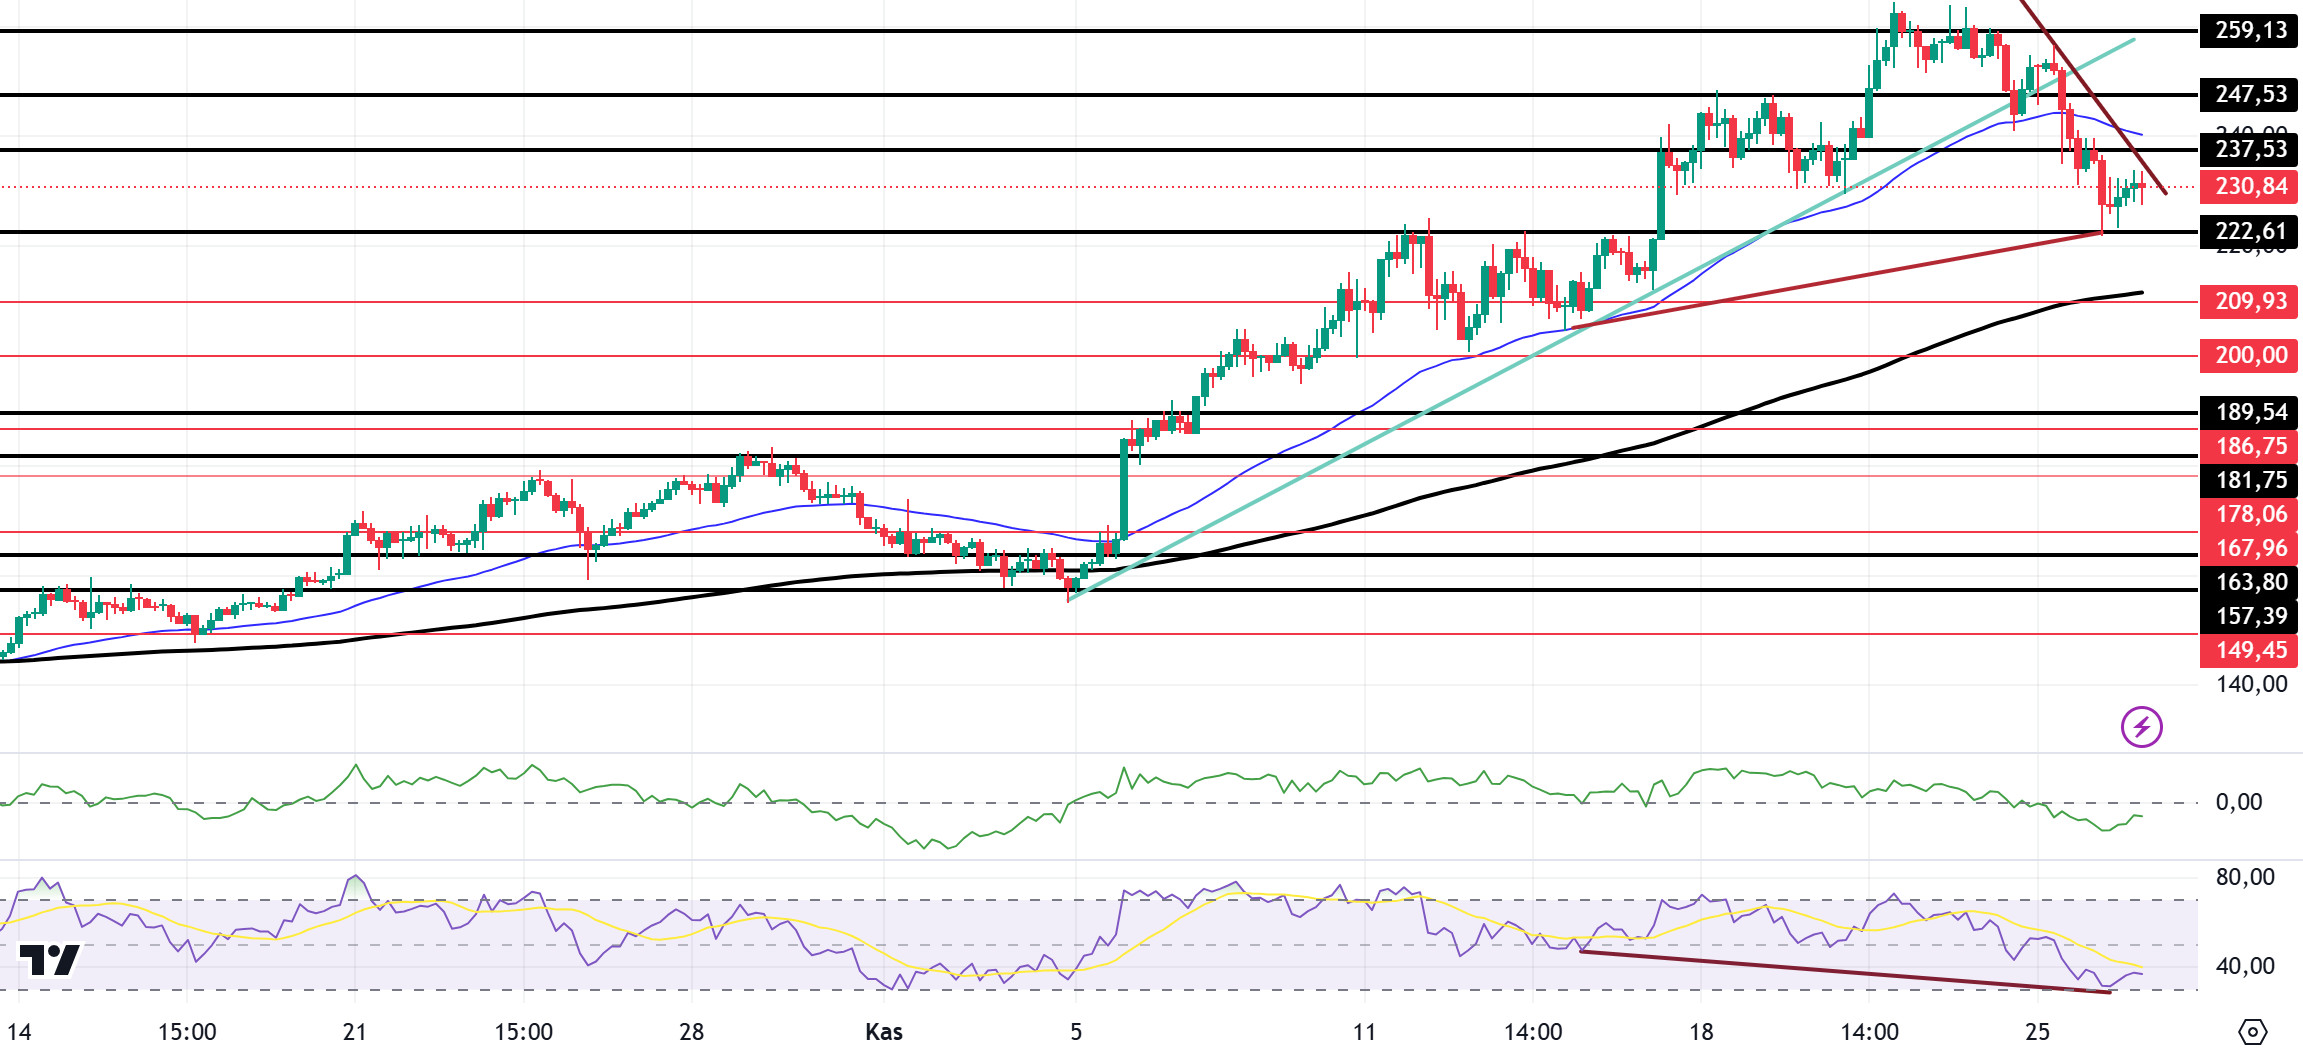
Over the past 24 hours, Solana’s price has fallen 2.94% to $230.80. This continues its negative trend from last week, when it suffered a loss of 6.38%, moving from $247.53 to its current price. Onchain Lens, an on-chain data monitoring firm, revealed that Solana memecoin launchpadi Pump.fun moved 99,999 SOLs worth over $23 million to a centralized exchange. The data analytics firm also revealed that the Solana memecoin launcher has so far deposited over 890,000 SOLs at an average price of $164. The move comes after Pump.fun announced that it was indefinitely suspending its live streaming feature as a moderation update. On the other hand, Solana officially activated Timely Vote Credits (TVC), a new consensus mechanism that aims to reduce block approval times and improve validator performance. First proposed in September 2022 and approved by the administration in April 2024, this feature is now fully operational on the Solana blockchain.
On the 4-hour timeframe, the 50 EMA (Blue Line) is above the 200 EMA (Black Line). Since November 4, SOL, which has been in an uptrend since November 4, has broken this trend downwards. However, when we examine the Chaikin Money Flow (CMF)20 indicator, money inflows have turned negative after a long time, but there is a decline in inflows. At the same time, Relative Strength Index (RSI)14 is in overbought territory. However, there is a mismatch. This can be shown as a bullish signal. The 259.13 level is a very strong resistance point in the uptrend driven by both macroeconomic conditions and innovations in the Solana ecosystem. If it breaks here, the rise may continue. In case of retracements due to possible macroeconomic reasons or profit sales, support levels 222.61 and 189.54 can be triggered again. If the price reaches these support levels, a potential bullish opportunity may arise if momentum increases.
Supports 222.61 – 209.93 – 200.00
Resistances 237.53 – 247.53 – 259.13
DOGE/USDT
GDP data and Core PCE Price Index from the US will be important. Unexpected readings may cause fluctuations in prices. On the other hand, tensions in the Middle East have eased with a ceasefire.
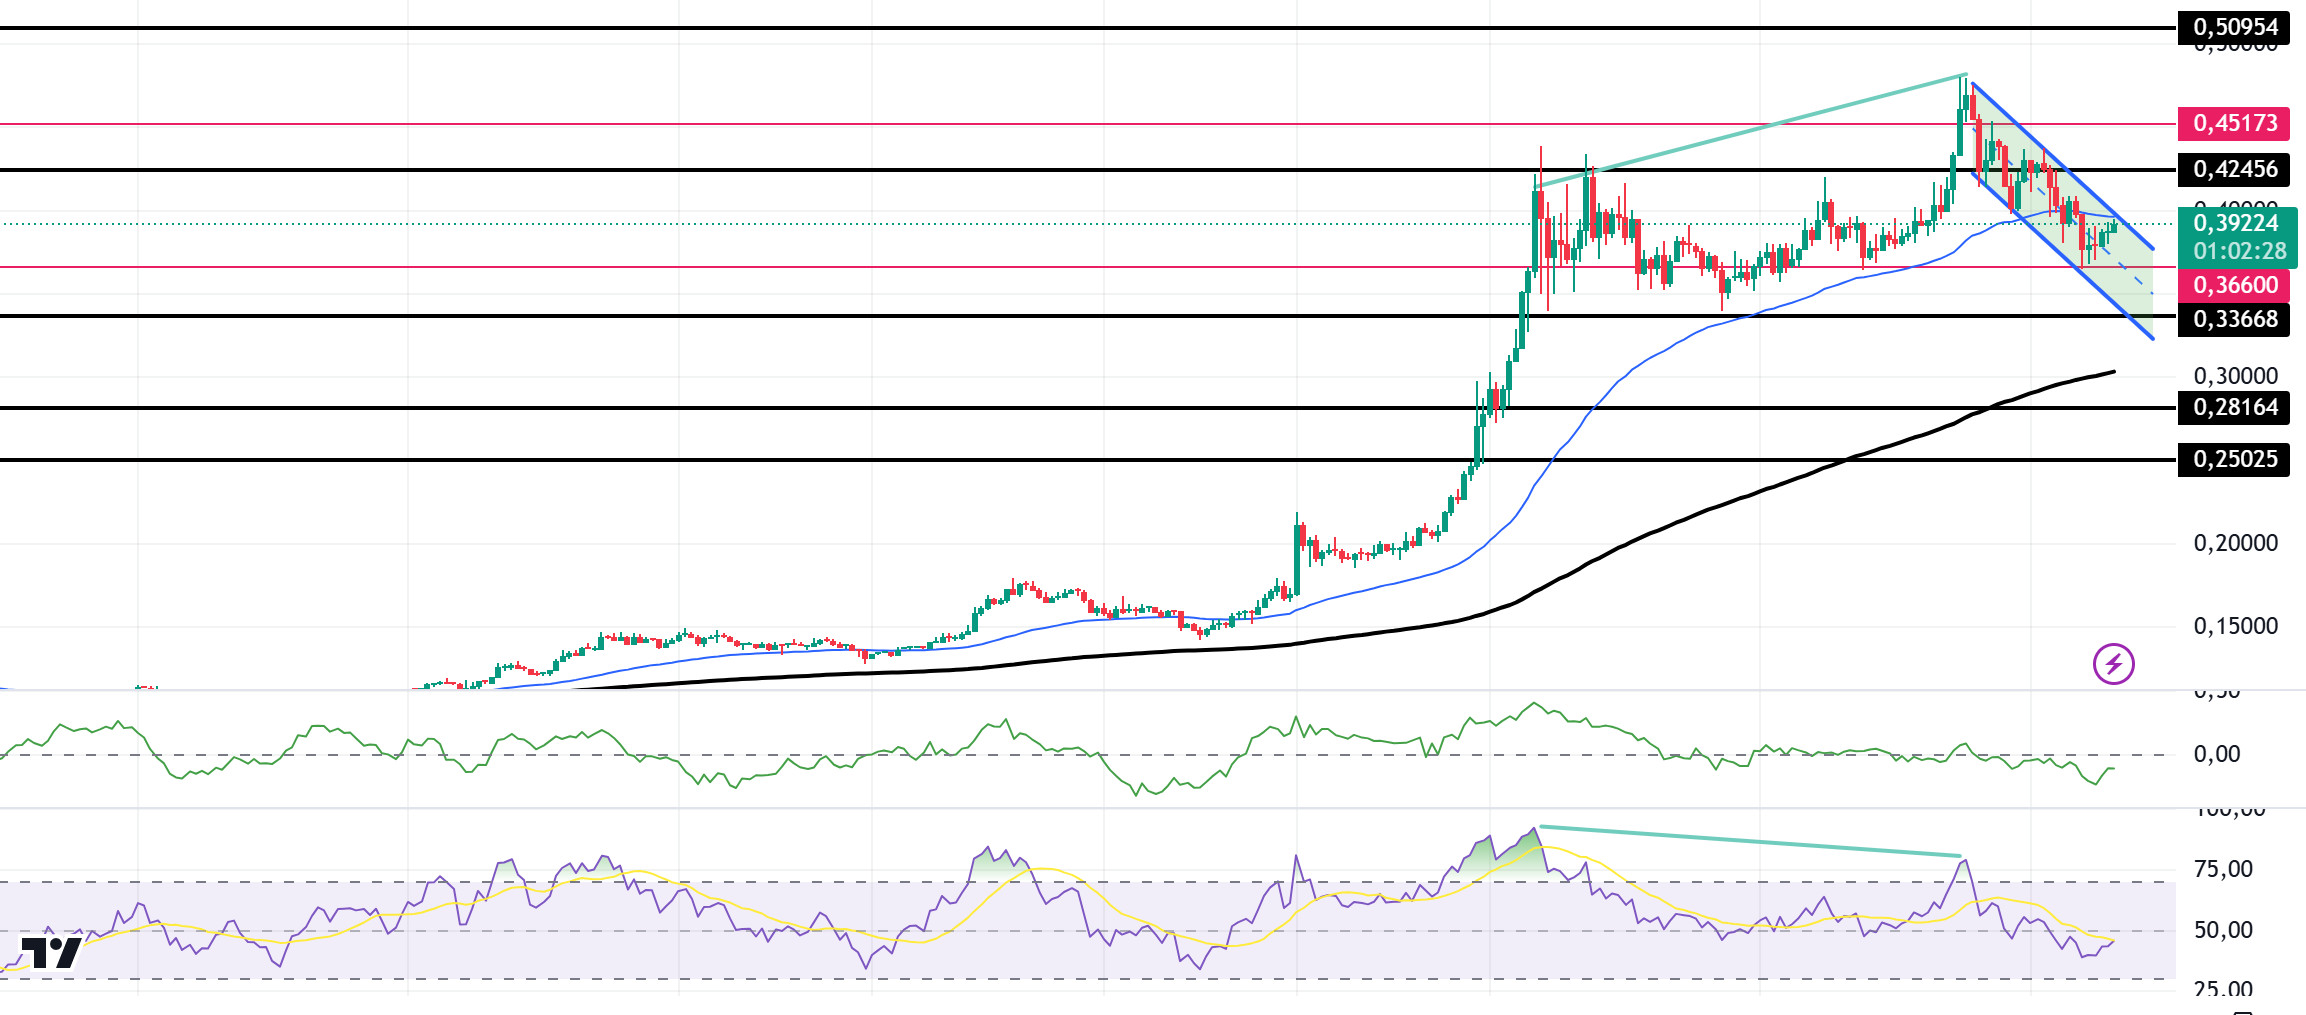
The cryptocurrency market has fallen by 7.5% in the last 24 hours, while Dogecoin’s price has dropped by 3.93% to $0.3922. Despite the massive 24-hour correction, the coin looks set for further gains in the coming weeks. Among the highlights, Valour launched its first DOGE ETP, which will be traded on Sweden’s Spotlight Exchange, giving investors access to the world’s largest memecoin. Crypto fund issuer Valour has launched the first exchange-traded product (ETP) for the famous memecoin Dogecoin DOGE $0.3924, Valour’s parent company DeFi Technologies announced on November 26. Valour said the ETP will be traded on Sweden’s Spotlight Exchange and will enable retail and institutional investors to access the world’s largest memecoin by market capitalization in a regulated fund package. Futures, on the other hand, reached $3.4 billion in open interest, highlighting the increase in speculative activity. In 24 hours, 60.9 billion tokens changed hands by major investors, setting a record for network activity. This means the whales are taking action.
Technically, there is a mismatch between the Relative Strength Index (RSI) 14 and the chart. If this mismatch works, retracements may deepen. On the 4-hour timeframe, the 50 EMA (Blue Line) is above the 200 EMA (Black Line). But the gap between the two averages is still too wide. This may cause pullbacks. The price broke the 50 EMA and may use the moving average as resistance. On the other hand, looking at some indicators, RSI 14 has moved from the overbought zone to the neutral level . However, the Chaikin Money Flow (CMF)20 indicator has also turned negative. This shows us that there are money outflows, indicating that the pullbacks may deepen. The 0.50954 level appears to be a very strong resistance place in the rises due to both macroeconomic conditions and innovations in Doge coin. If DOGE maintains its momentum and rises above this level, the rise may continue strongly. In case of retracements due to possible macroeconomic reasons or profit sales, the support levels of 0.36600 and 0.33668 can be triggered again. If the price hits these support levels, a potential bullish opportunity may arise if momentum increases.
Supports 0.36600 – 0.33668 – 0.28164
Resistances 0.42456 – 0.45173 – 0.50954
LEGAL NOTICE
The investment information, comments and recommendations contained herein do not constitute investment advice. Investment advisory services are provided individually by authorized institutions taking into account the risk and return preferences of individuals. The comments and recommendations contained herein are of a general nature. These recommendations may not be suitable for your financial situation and risk and return preferences. Therefore, making an investment decision based solely on the information contained herein may not produce results in line with your expectations.


