TABLE OF CONTENT
hide
MARKET SUMMARY
Latest Situation in Crypto Assets
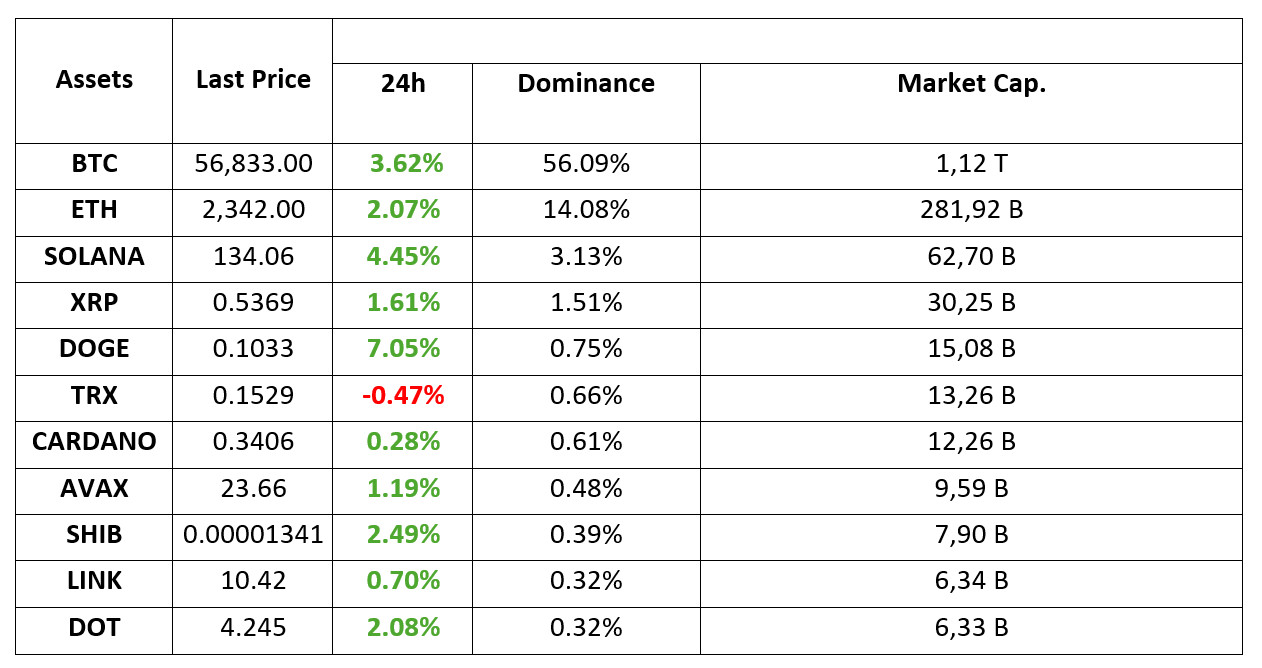
*Prepared on 10.09.2024 at 07:00 (UTC)
WHAT’S LEFT BEHIND
Bitcoin Price Rises Above $58K on Market Optimism
Cryptocurrency markets experienced a significant rally today, indicating an increase in investor confidence. With Bitcoin crossing the $58,000 threshold, various altcoins also performed impressively, creating a positive trend in the cryptocurrency space.
Fed forecasts have intensified: 50 basis points seriously on the table
While financial markets are eagerly awaiting the Fed’s decision at its meeting on September 18, the CEO of Destination Wealth Management (DWM), a California-based asset management company, made an important comment. CEO Michael Yoshikami said that the possibility of a 50 basis point cut is still on the table and that the Fed has many logical reasons to make this cut.
The Democrats are also upset with Gary Gensler: “Fire him.”
After Donald Trump pledged to fire Gary Gensler if he wins the election, it has emerged that Democrats are also unhappy with the SEC chairman. Some Democratic Party donors are allegedly uncomfortable with the leadership of Gary Gensler and FTC chair Lina Khan and have asked Kamala Harris’ team to remove them if she wins the election.
The Ethereum Foundation is Selling ETH in the New Week!
Cryptocurrency investors have been reacting to the Ethereum Foundation’s ETH sales for some time. Although it is said that the Ethereum Foundation conducts these sales for the development of the ETH ecosystem, the fact that the revenues from ETH are not shared transparently makes investors uneasy. Some time ago, Ethereum founder Vitalik Buterin also sold many ETH. On the first day of the new week, it is seen that the Ethereum Foundation is selling ETH.
HIGHLIGHTS OF THE DAY
INFORMATION
*The calendar is based on UTC (Coordinated Universal Time) time zone. The economic calendar content on the relevant page is obtained from reliable news and data providers. The news in the economic calendar content, the date and time of the announcement of the news, possible changes in the previous, expectations and announced figures are made by the data provider institutions. Darkex cannot be held responsible for possible changes that may arise from similar situations.
MARKET COMPASS
Global markets are waiting for the inflation data to be released on Wednesday in order to understand the FED’s rate cut course. In the run-up, we have seen some of the risk aversion dissipate. Investors are now getting used to the fact that the US economy is slowing down and only seem to be struggling to build consensus on the pace of rate cuts. Inflation data may shed some light on this issue.
TECHNICAL ANALYSIS
BTC/USDT
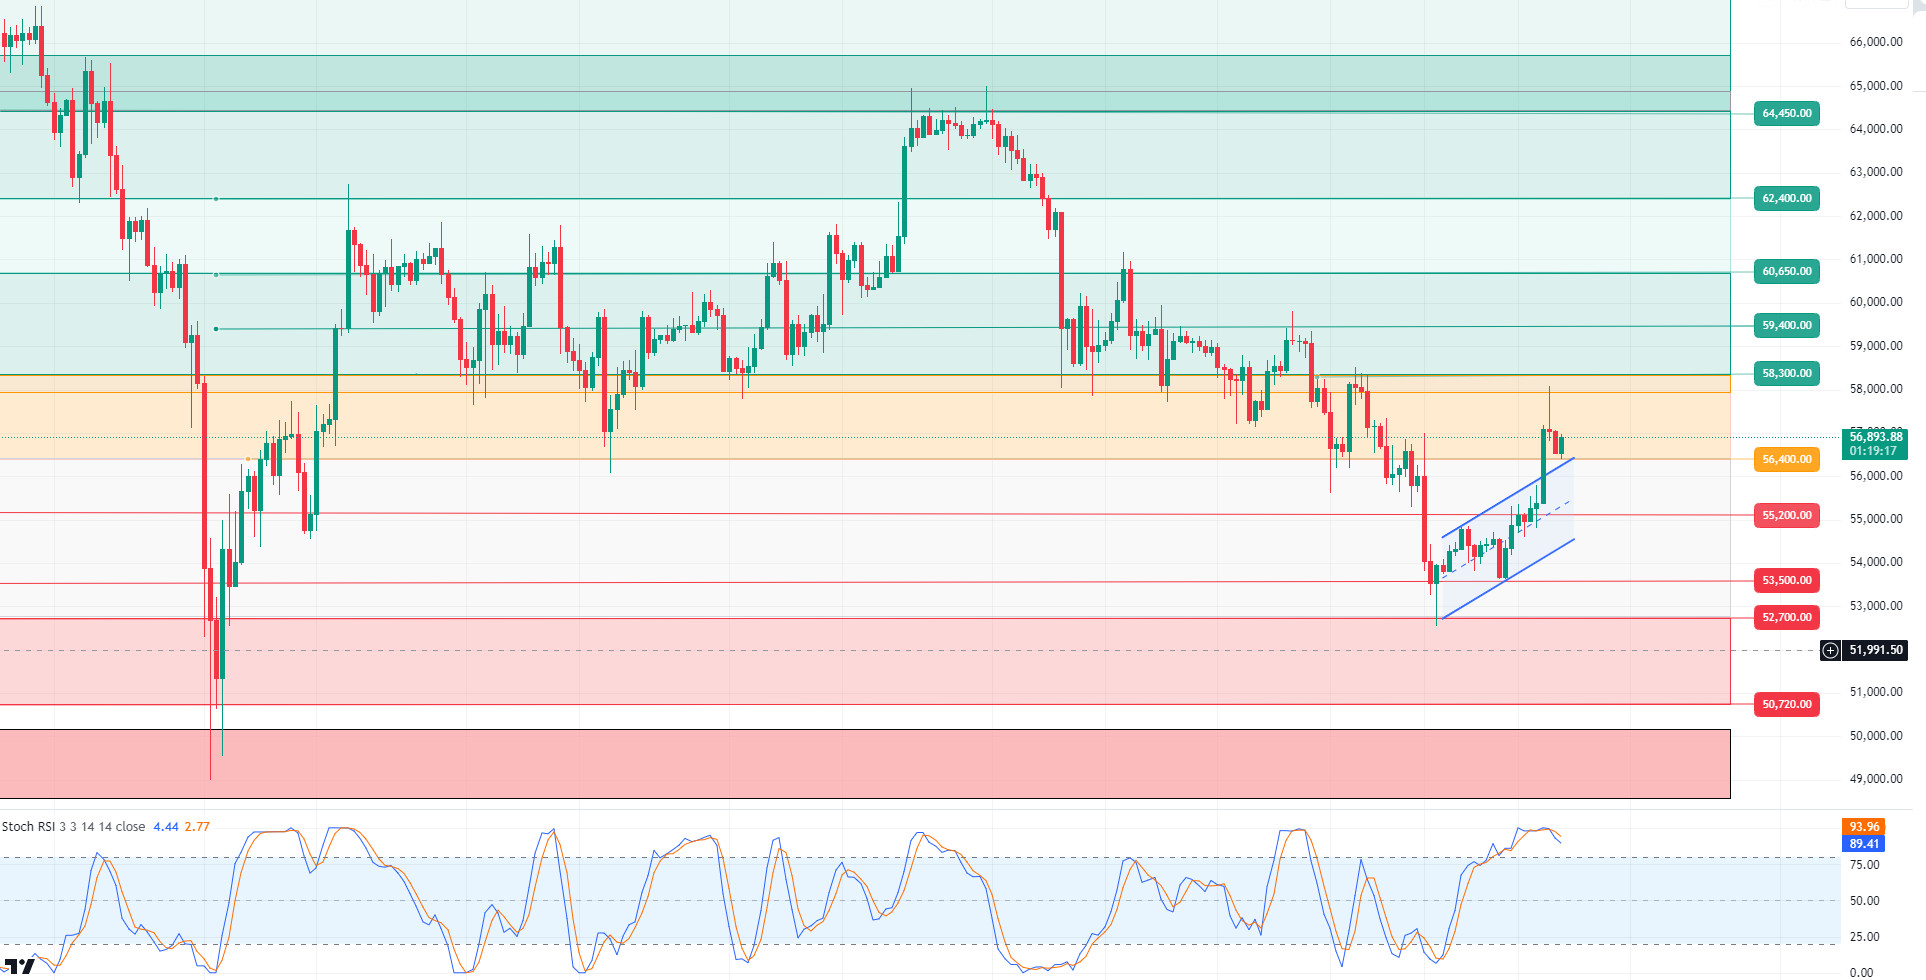
Attack from Bitcoin! Bitcoin, which has lost a little support from institutional investors with Spot ETF outflows in recent days, has experienced a sharp retreat and tested 52,500 levels. While the macroeconomic data wind was blowing on the US side, the data so far pointing to a FED interest rate cut brought an upward momentum in its price with the support of the optimistic atmosphere in the market and 58,000 levels were tested. Now eyes will be on the interview between presidential candidates D. Trump and Kamala Harris. Subsequently, the direction of the market can be determined with the inflation data coming from the US tomorrow. In the BTC 4-hour technical analysis, price movements, which form an ascending channel within the falling trend, exceeded the resistance level of 56,400 and pinned the 58,000 point. With sales coming from these levels, it retreated back to the 56,400 support point. It can be said that 4-hour closures above the critical support level may continue the positive course for the market and may bring a new attack towards the 58,000 level. With the closes below the support level of 56,400, the 55,200 level may be retested as the RSI moves in the oversold zone. In a pullback scenario, a bowl handle pattern can be seen on the chart.
Supports 55,200 – 56,400 – 53,500
Resistances 57,200 – 58,300 – 59,400
ETH/USDT
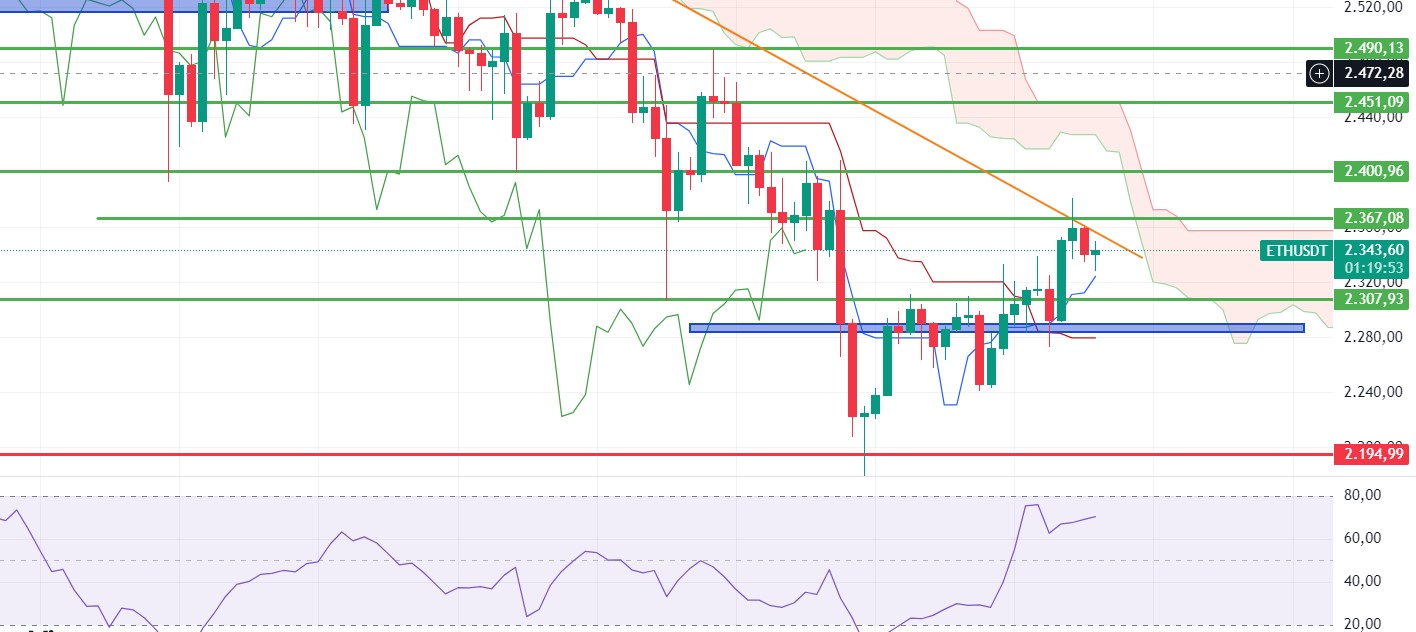
Ethereum, which rose to close to 2,400 levels as expected, managed to hold on to 2,340 levels with some retracement. It is seen that the recent rises have been experienced with purchases on the spot side. Although the technical picture is still positive (MFI, CMF, RSI), the amount of ETH transferred by Metalpha to exchanges has exceeded 33,000 in total. A sharp retracement may occur with a possible sale. The most important resistance level is seen as 2,400. Closures below 2,284 levels may initiate negative movements again.
Supports 2,289 – 2,194 – 2,112
Resistances 2,367 – 2,400 – 2,436
LINK/USDT
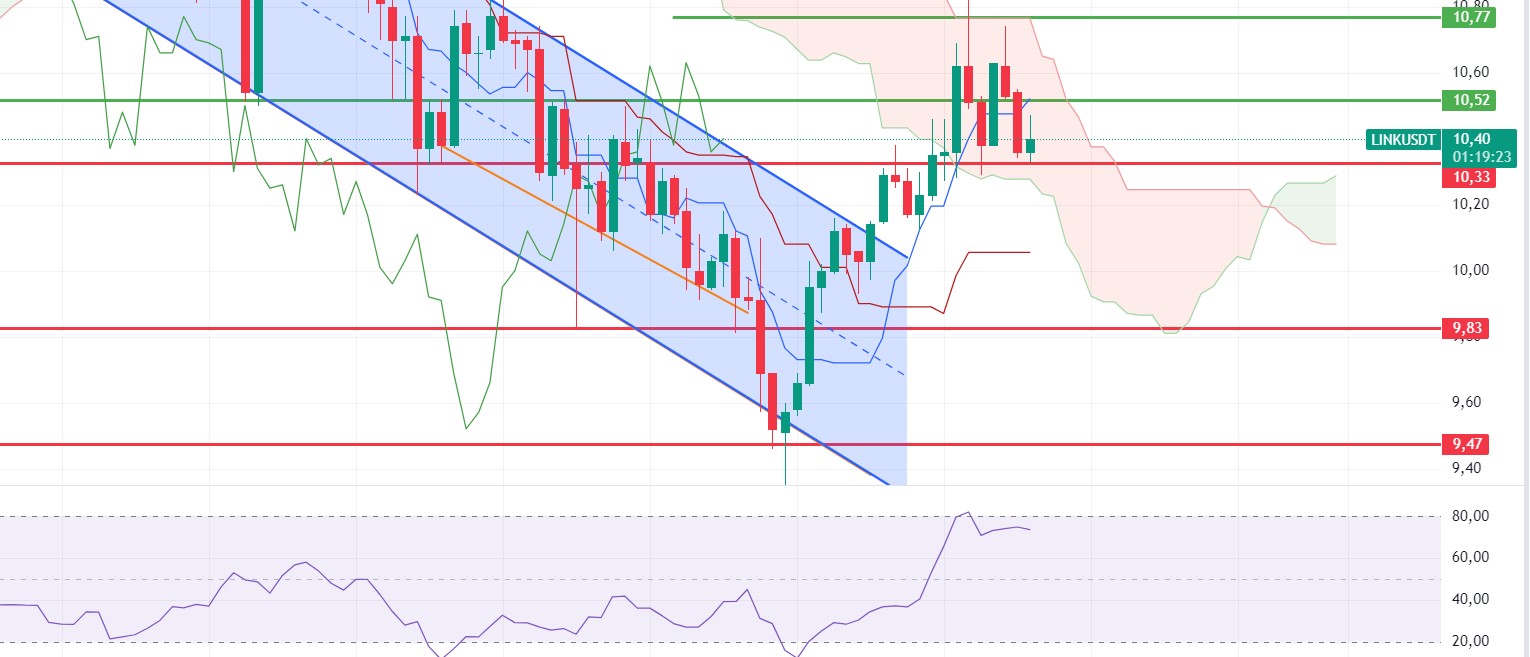
LINK, which continues its positive outlook, is having difficulty getting out of the kumo cloud. Provided that volatility is not high in the markets, we can see rises up to kijun resistance 10.52 and then cloud resistance 10.77 levels during the day. The 10.33 level stands out as the most important support level to be considered.
Supports 10.33 – 9.82 – 9.47
Resistances 10.52 – 10.98 – 11.45
SOL/USDT
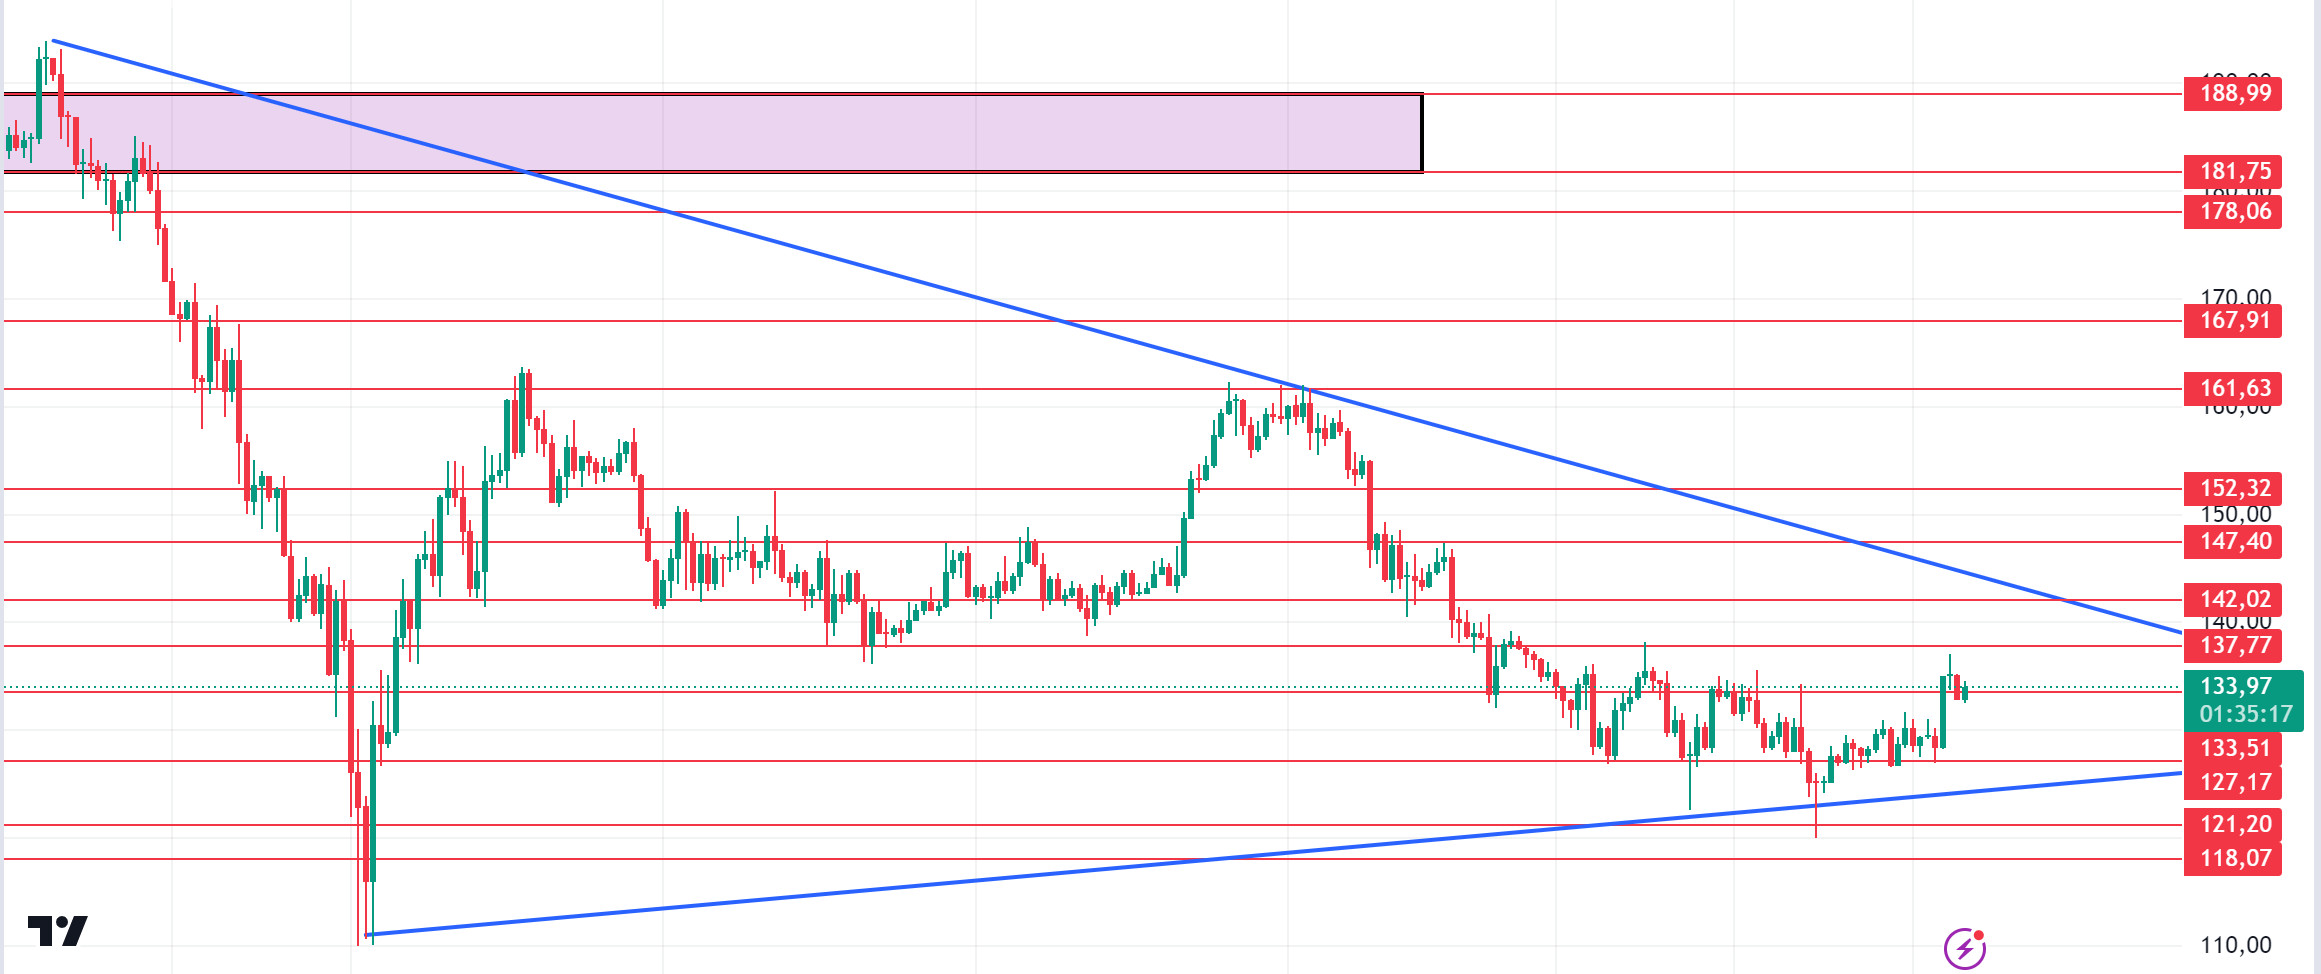
The Fed meeting is approaching. A rate cut is almost certain. The expectation for a 50 basis point cut is 71% according to CME data. According to Lookonchain data, a whale staked 12 hours ago, buying 34,807 SOL ($4.52 million). Technically, we see a narrowing triangle pattern. SOL, which has been accumulating in a certain band since April, may test 137.77 – 142.02 resistance levels if the rises continue due to the increase in volumes. In case of profit sales due to yesterday’s rises, support levels 133.51 – 127.17 should be followed.
Supports 133.51 – 127.17 – 121.20
Resistances 137.77 – 142.02 – 147.40
ADA/USDT
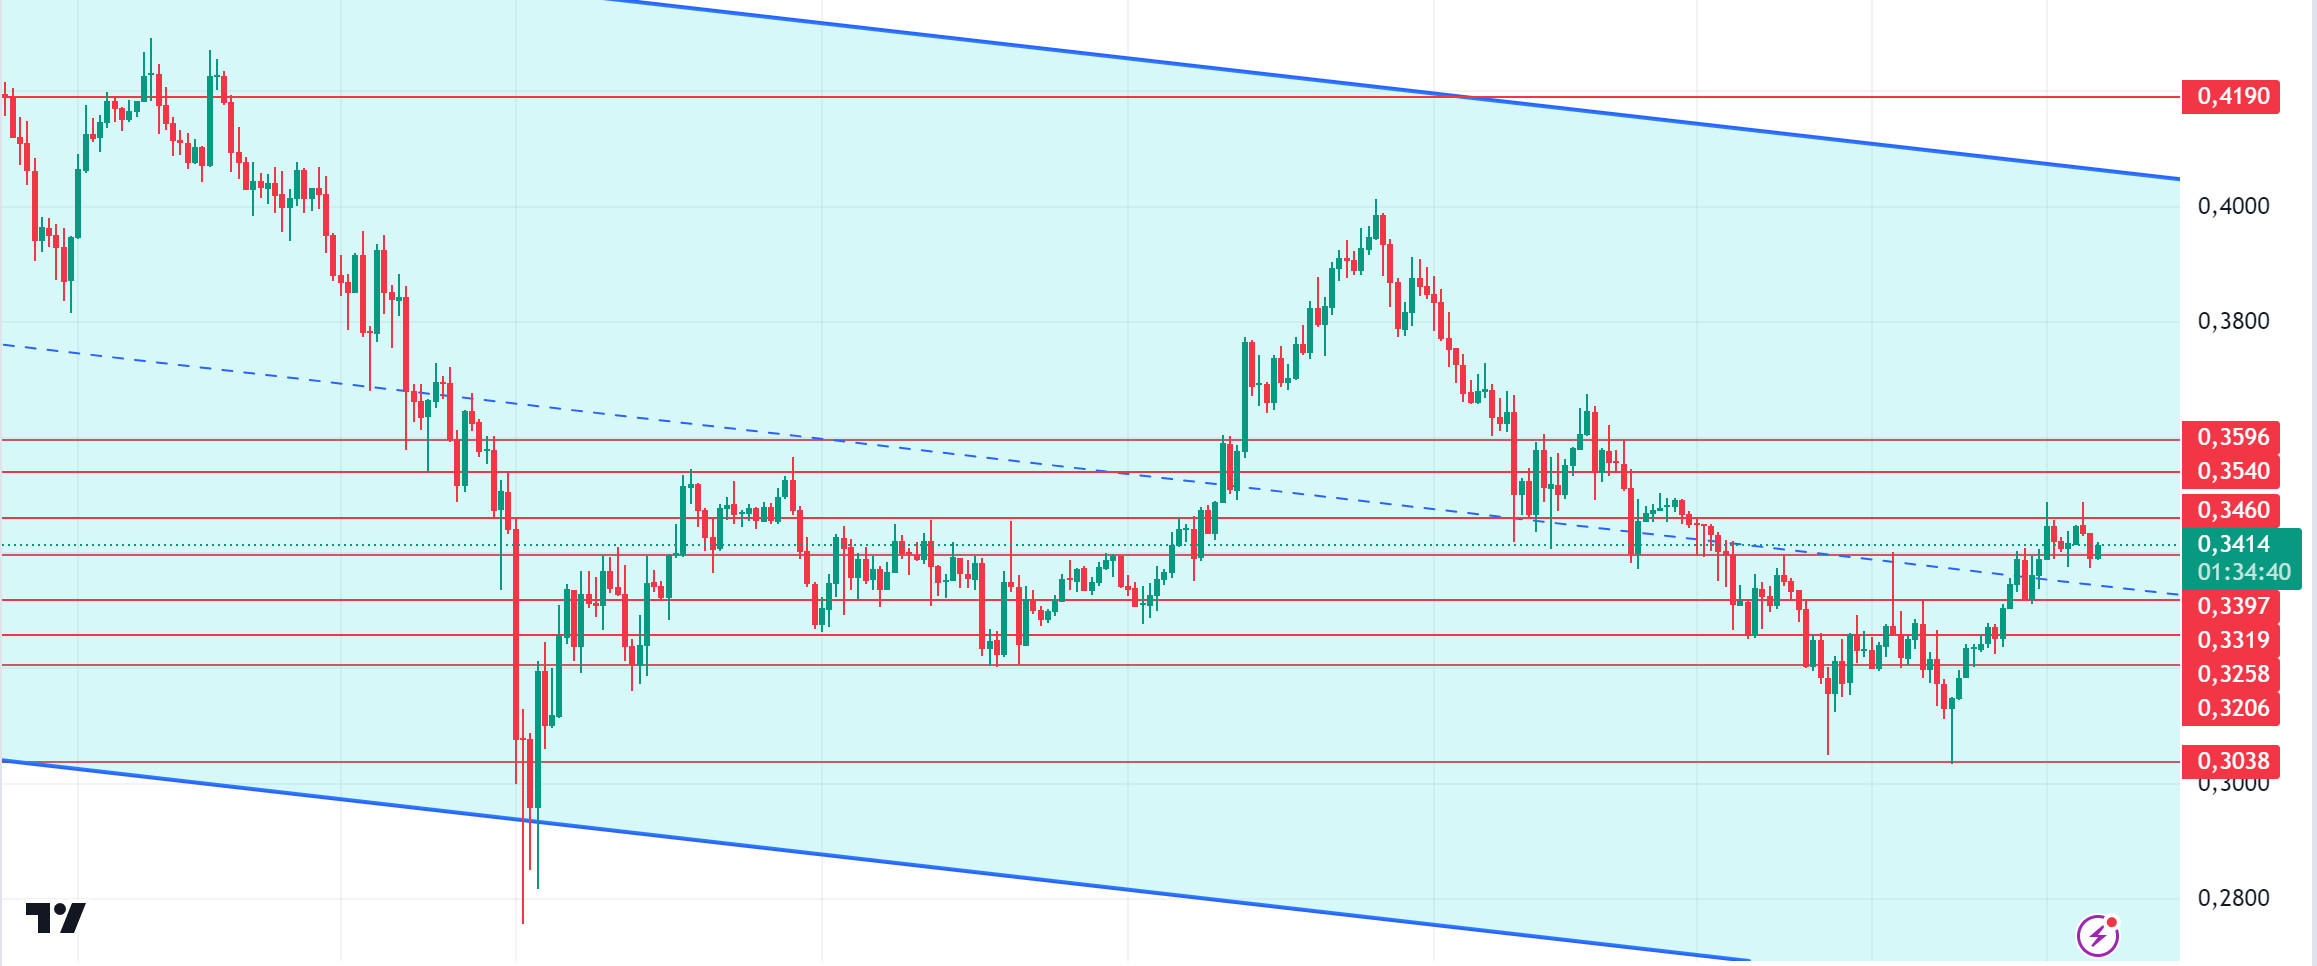
When we look at the chart of ADA, it is priced at the middle levels of the falling channel. ADA, which made a double bottom at 0.3038, continues to rise due to the innovations brought by the update and continues to be priced with purchases, which can bring the price to 0.3540 – 0.3596 levels. Due to the retracements, the support place to look at is 0.3397 – 0.3319 levels can be followed.
Supports 0.3397 – 0.3319 – 0.3258
Resistances 0.3460 – 0.3540 – 0.3596
AVAX/USDT
AVAX, which opened yesterday at 23.25, rose 2.5% during the day and closed at 23.84. There is no planned data flow that will affect the markets today. Markets are waiting for the inflation data to be announced tomorrow.
AVAX is currently trading at 23.66 and continues its movement within the rising channel on the 4-hour chart. It is in the lower band of the channel and may want to move towards the middle and upper band with the reaction it will receive from here. In such a case, it may test the 24.09 and 24.65 resistances. If it fails to get a reaction from the lower band of the channel and breaks the 23.60 support downwards, it may test the 22.79 and 22.23 supports. As long as it stays above 20.38 support during the day, we can expect it to maintain its upward demand. With the break of 20.38 support, sales may deepen.
Supports 23.60 – 22.79 – 22.23
Resistances 24.09 – 24.65 – 25.35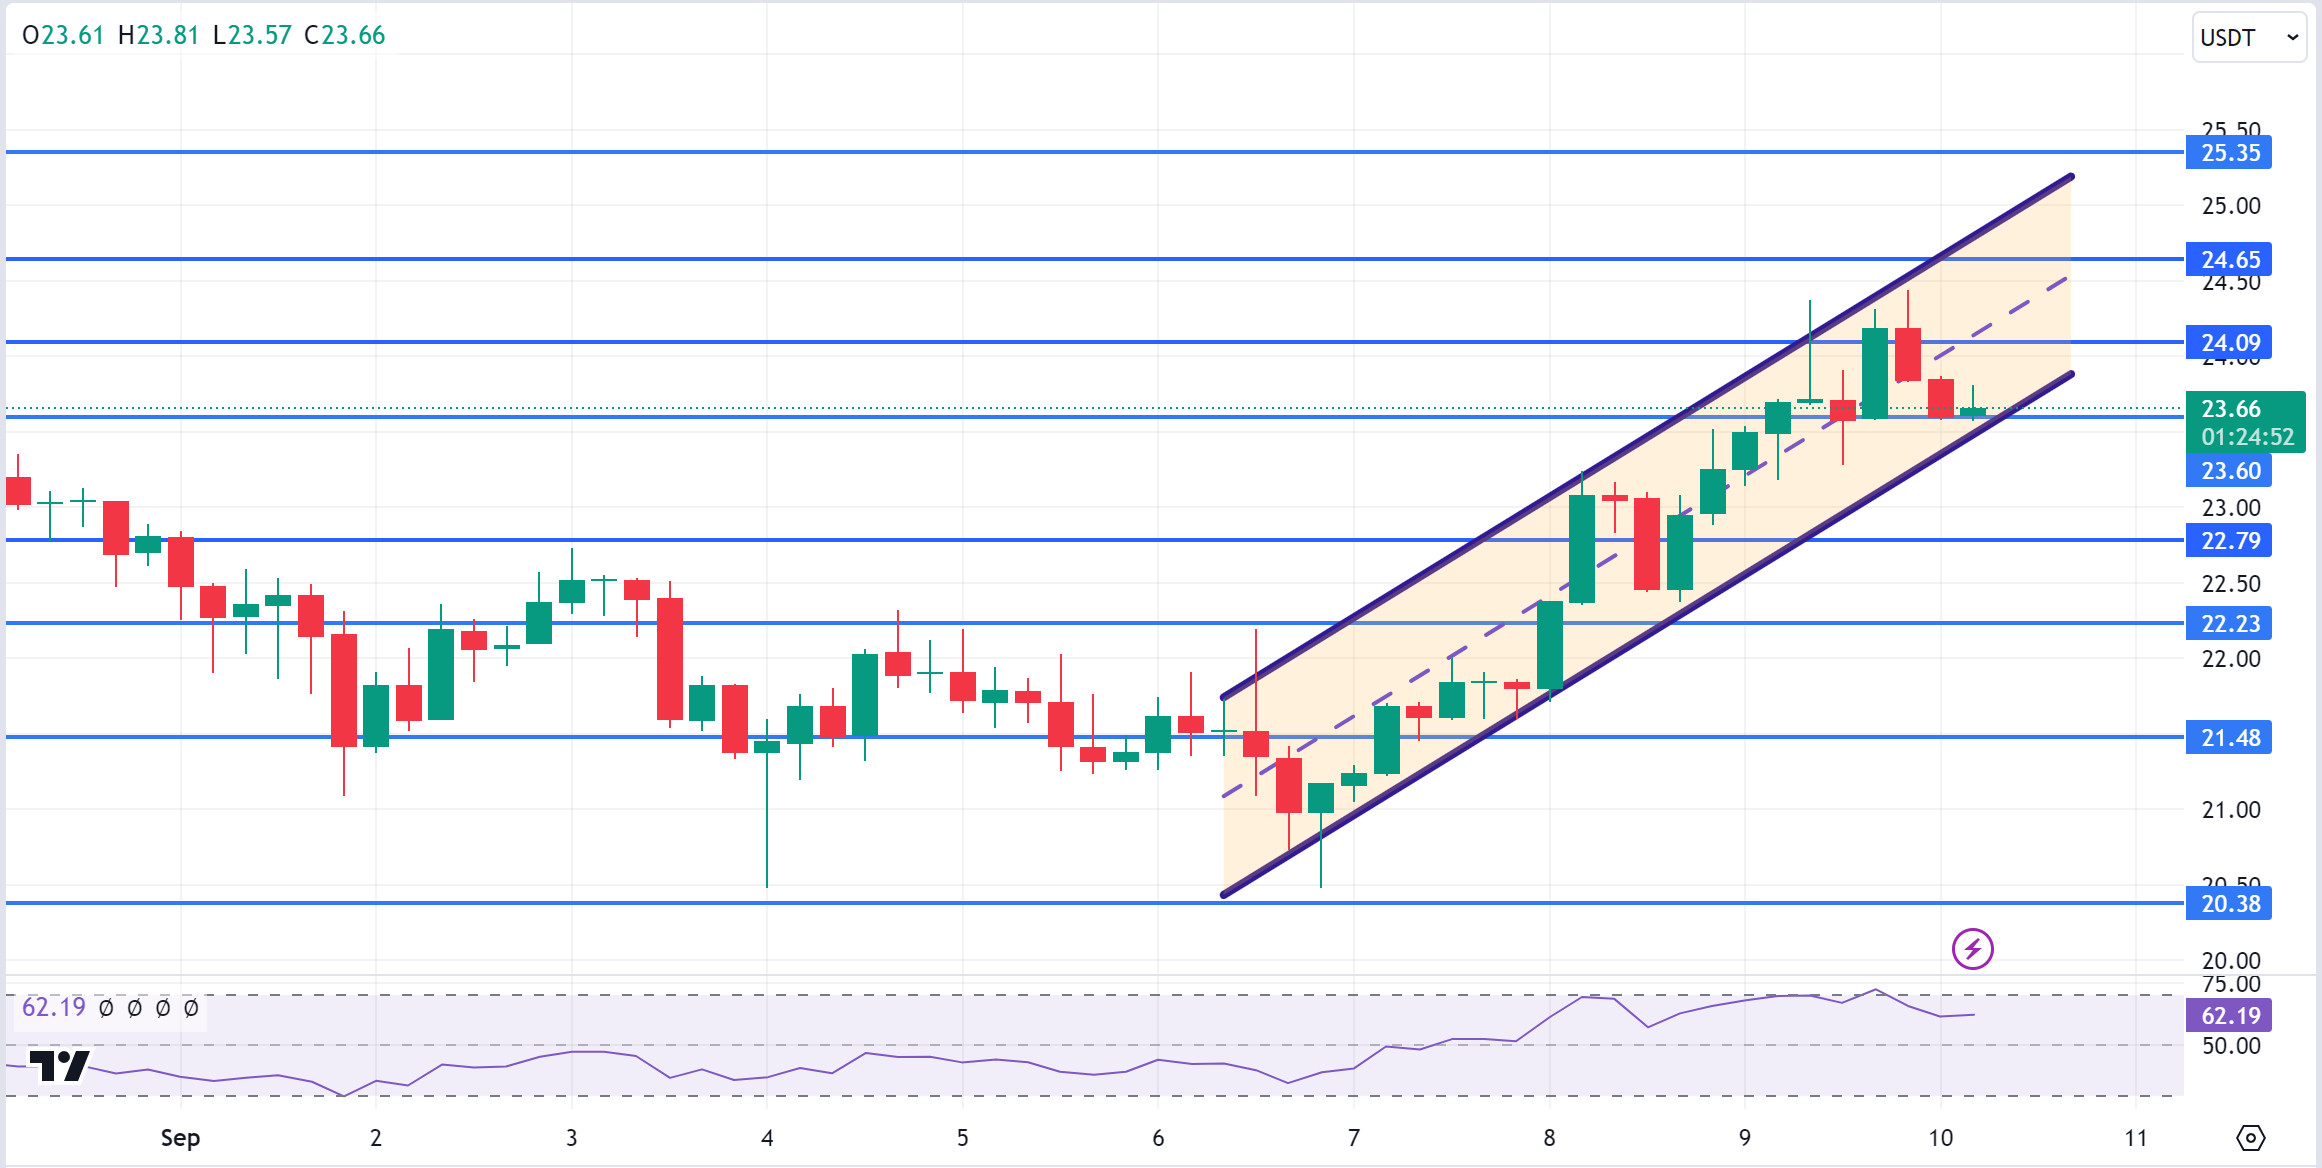

TRX/USDT
TRX, which started yesterday at 0.1532, rose about 1% during the day and closed at 0.1546. As today is a quiet day in terms of planned data, we can expect volumes to remain low. Markets are waiting for the US CPI data to be released tomorrow.
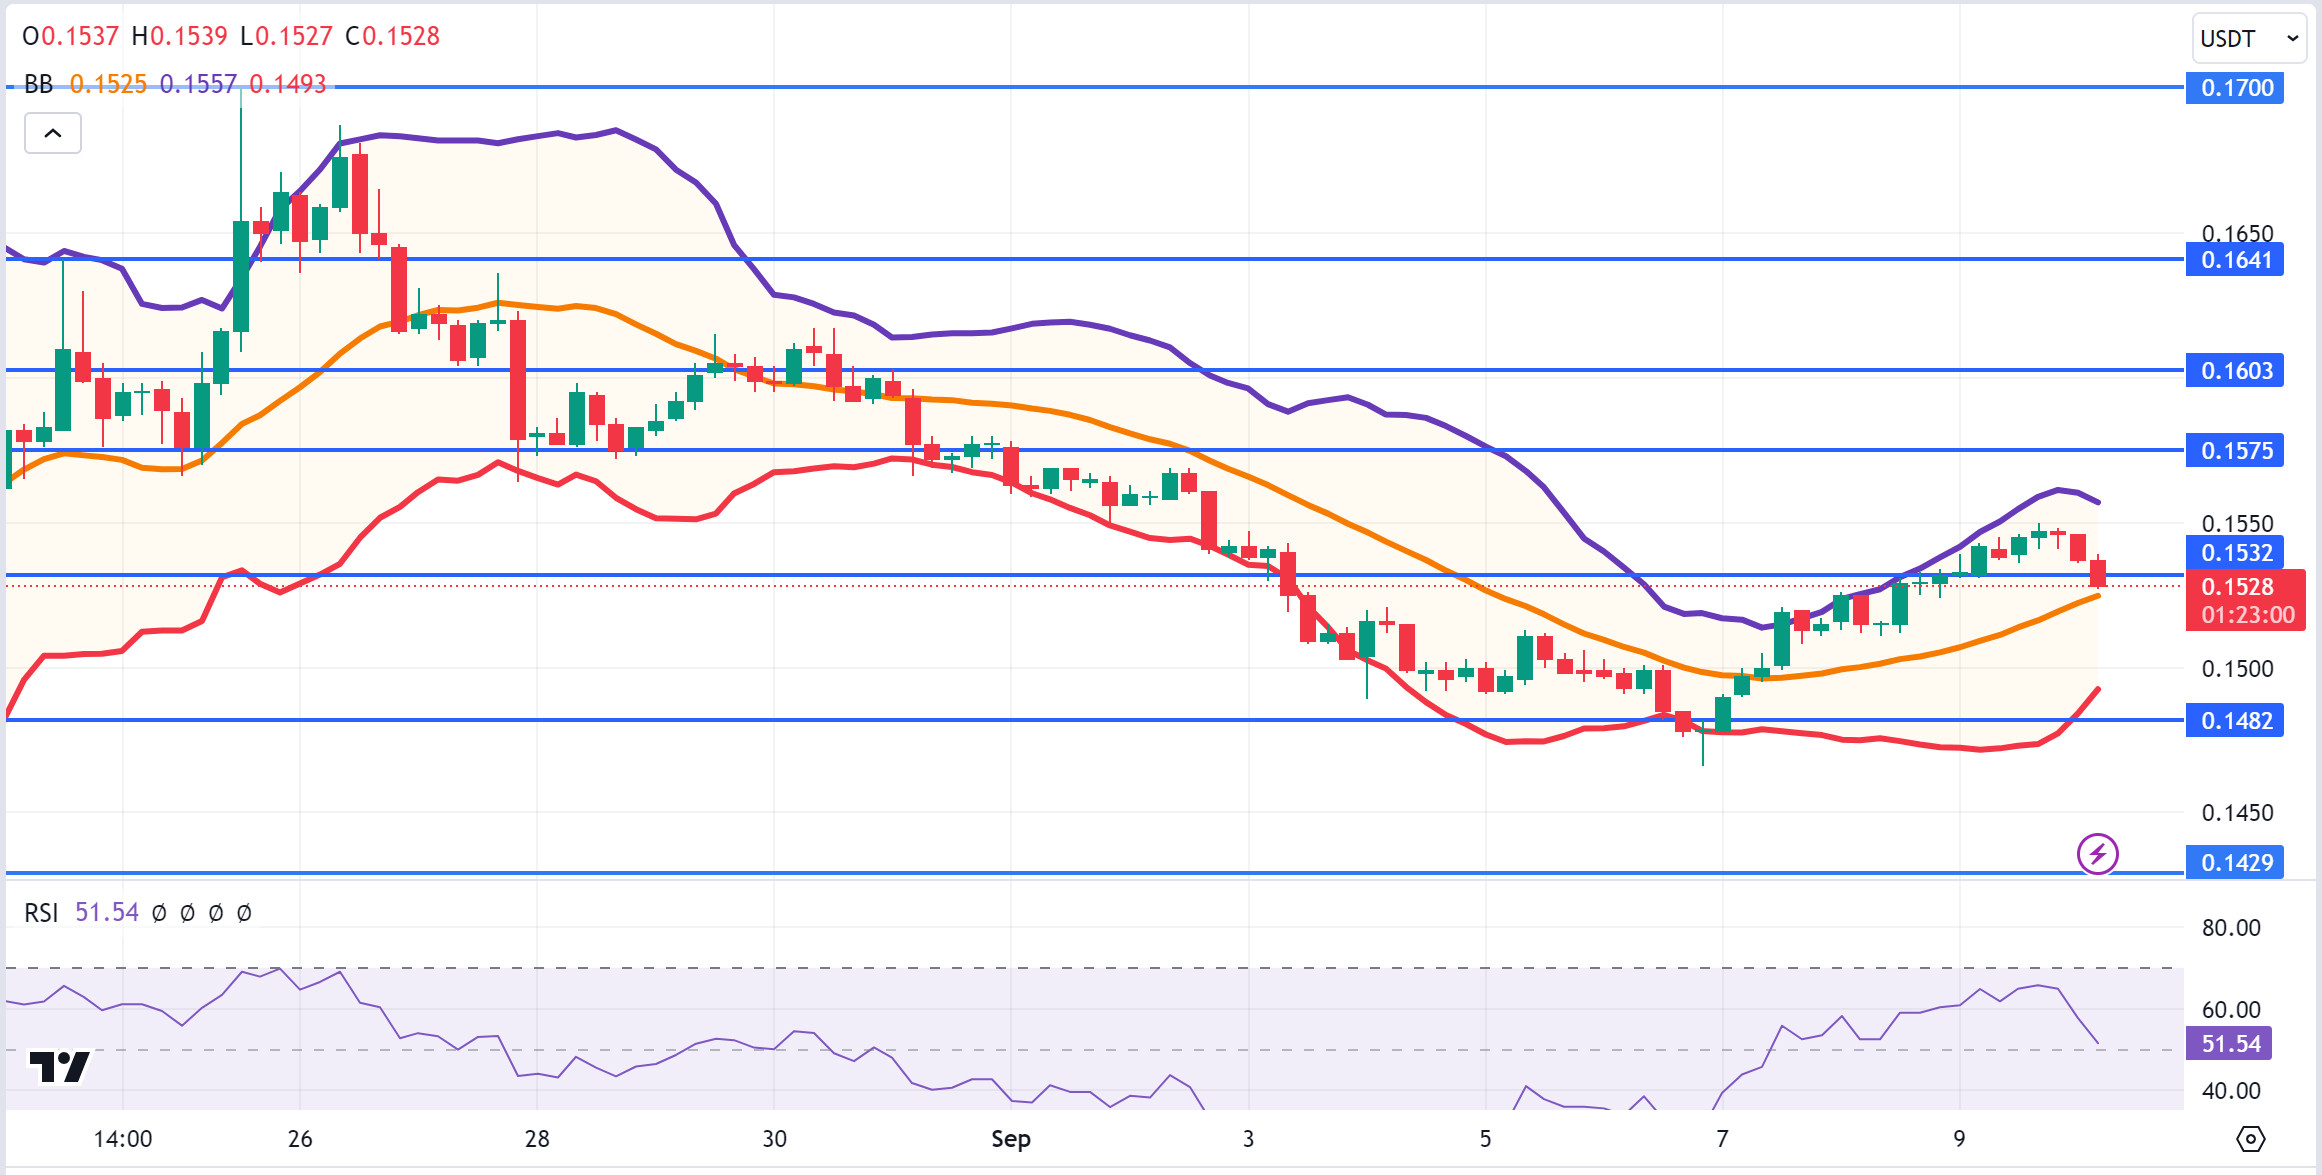
TRX, which is currently trading at 0.1528, has approached the Bollinger mid-band on the 4-hour chart. If it breaks the 0.1532 support downwards, a buying reaction can be expected from the Bollinger middle band. In such a case, it may move towards the upper band. However, if the sales deepen in the Bollinger middle band, it may move to the lower band and may want to test the 0.1482 support. As long as TRX stays above 0.1482 support, it can be expected to continue its upward trend. If this support breaks down, selling pressure may increase.
Supports 0.1532 – 0.1482 – 0.1429
Resistances 0.1575 – 0.1603 – 0.1641
XRP/USDT
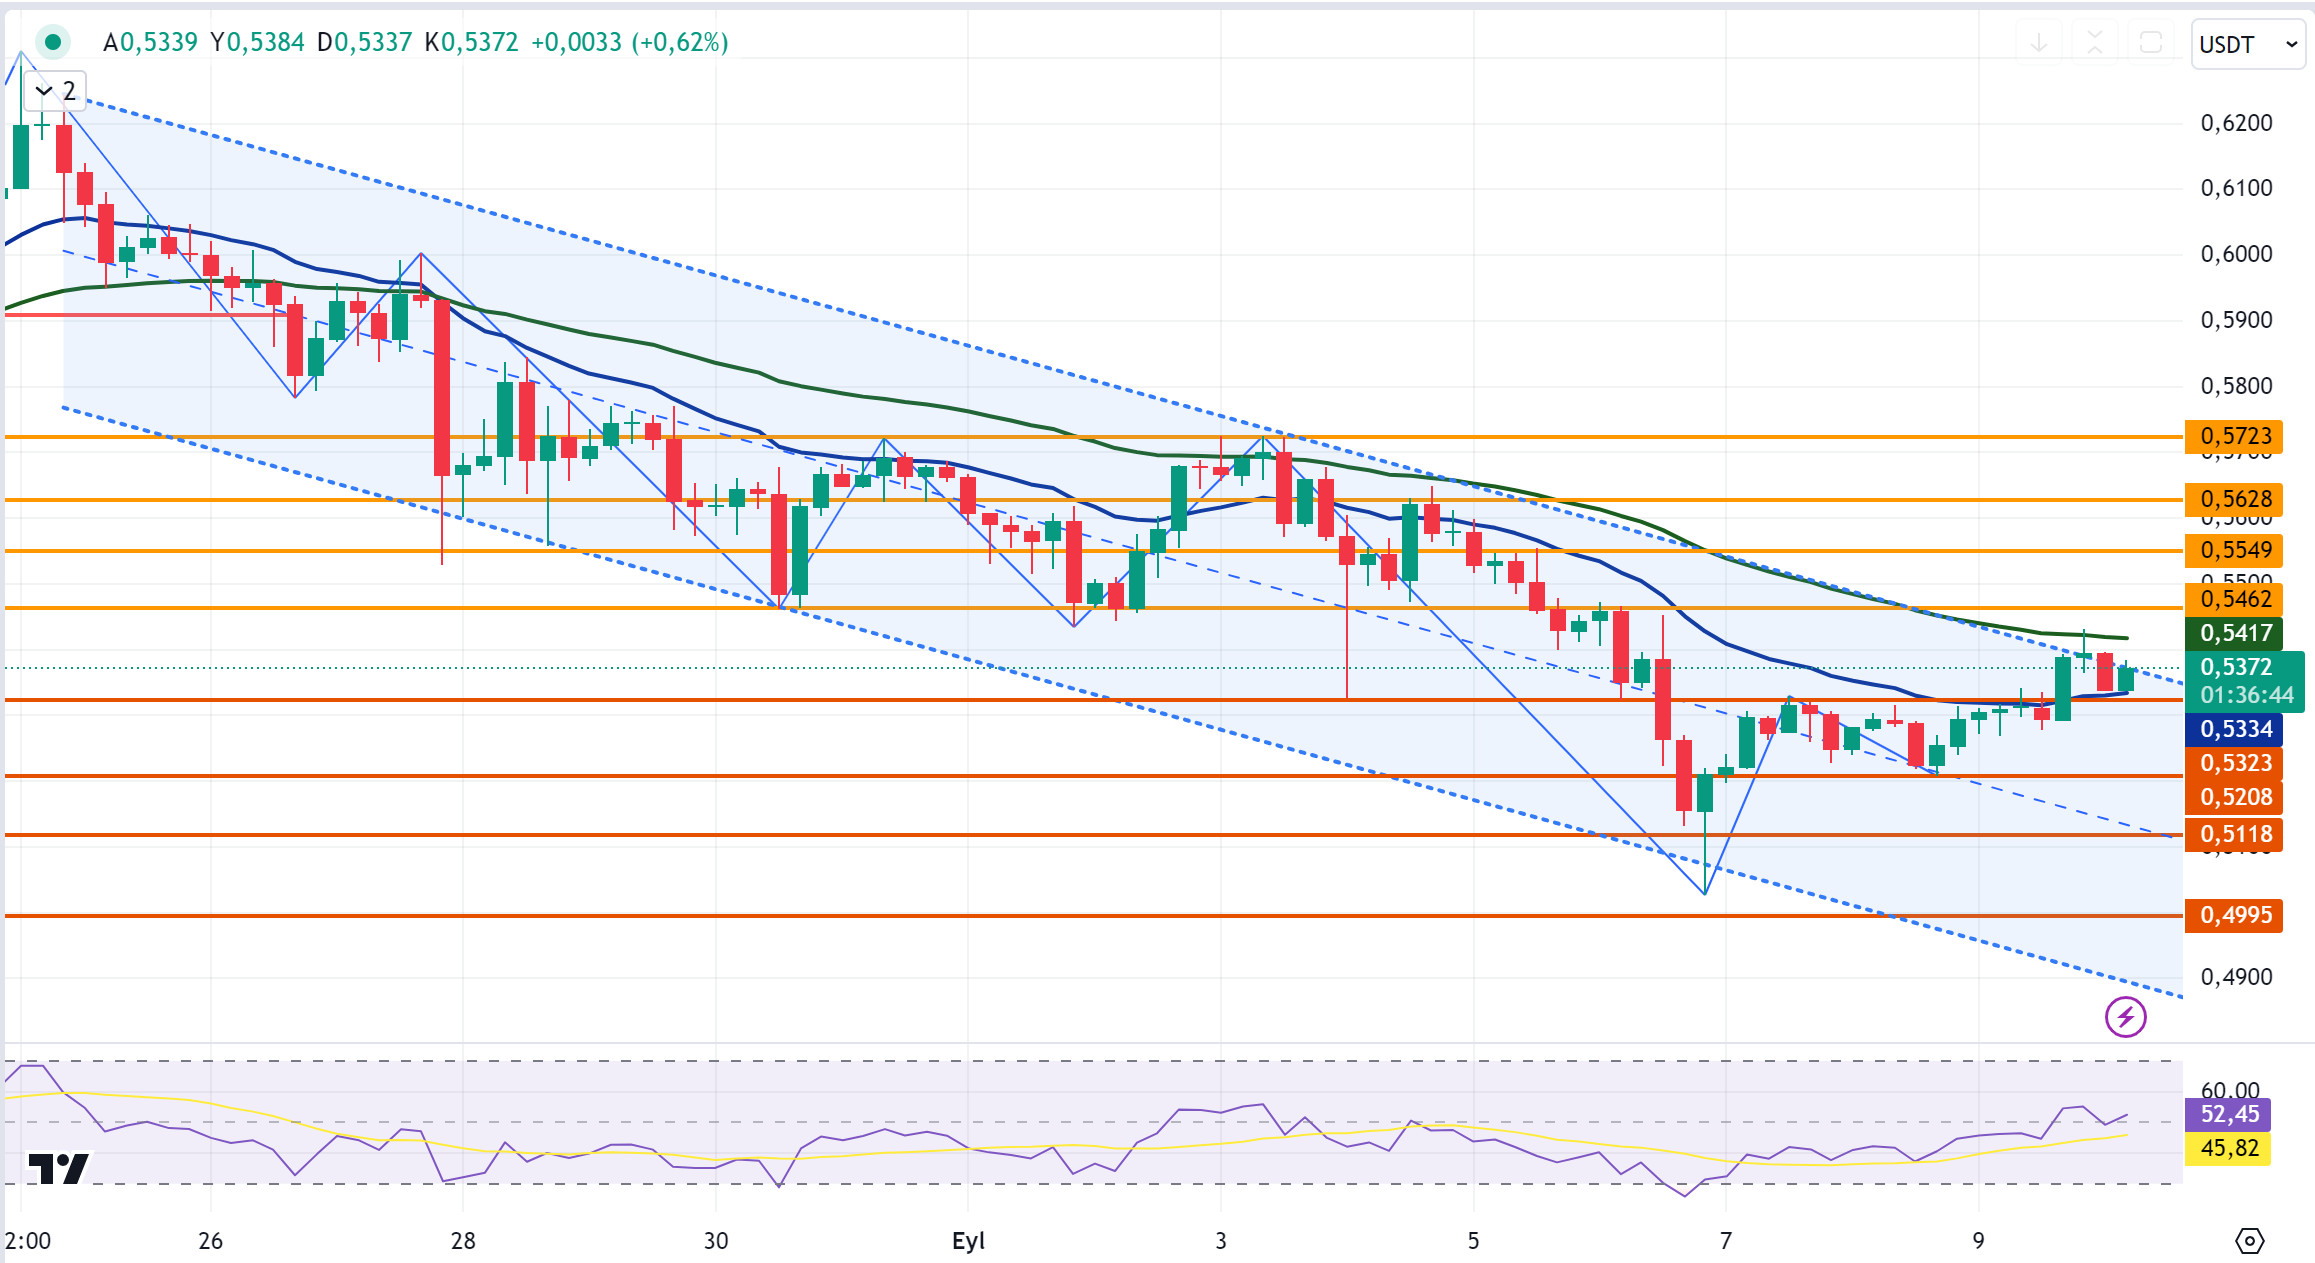
XRP, which closed yesterday at 0.5392 with a 1.9% increase in value, is currently trading at 0.5372 with a recovery after falling to 0.5334 with the decline it experienced in the first candle today.
In the 4-hour analysis, XRP, which continued to rise after breaking the EMA20 (Blue Color) level yesterday, fell back to the downtrend zone after the decline it experienced with the reaction sales on its rise out of the downtrend. If the decline continues, XRP may test the support levels of 0.5323-0.5208-0.5118. If it starts to rise, it may test the resistance levels of 0.5462-0.5549-0.5628.
During the downward movement in XRP value, it may rise with reaction purchases at the 0.5208 support level and may offer a long trading opportunity. On the contrary, it may decline and offer a short trading opportunity with reaction sales that may come at the level of 0.5462 during the rise and increase in value.
Supports 0.5323 – 0.5208 – 0. 5118
Resistances 0.5462 – 0.5549 – 0.5628
DOGE/USDT
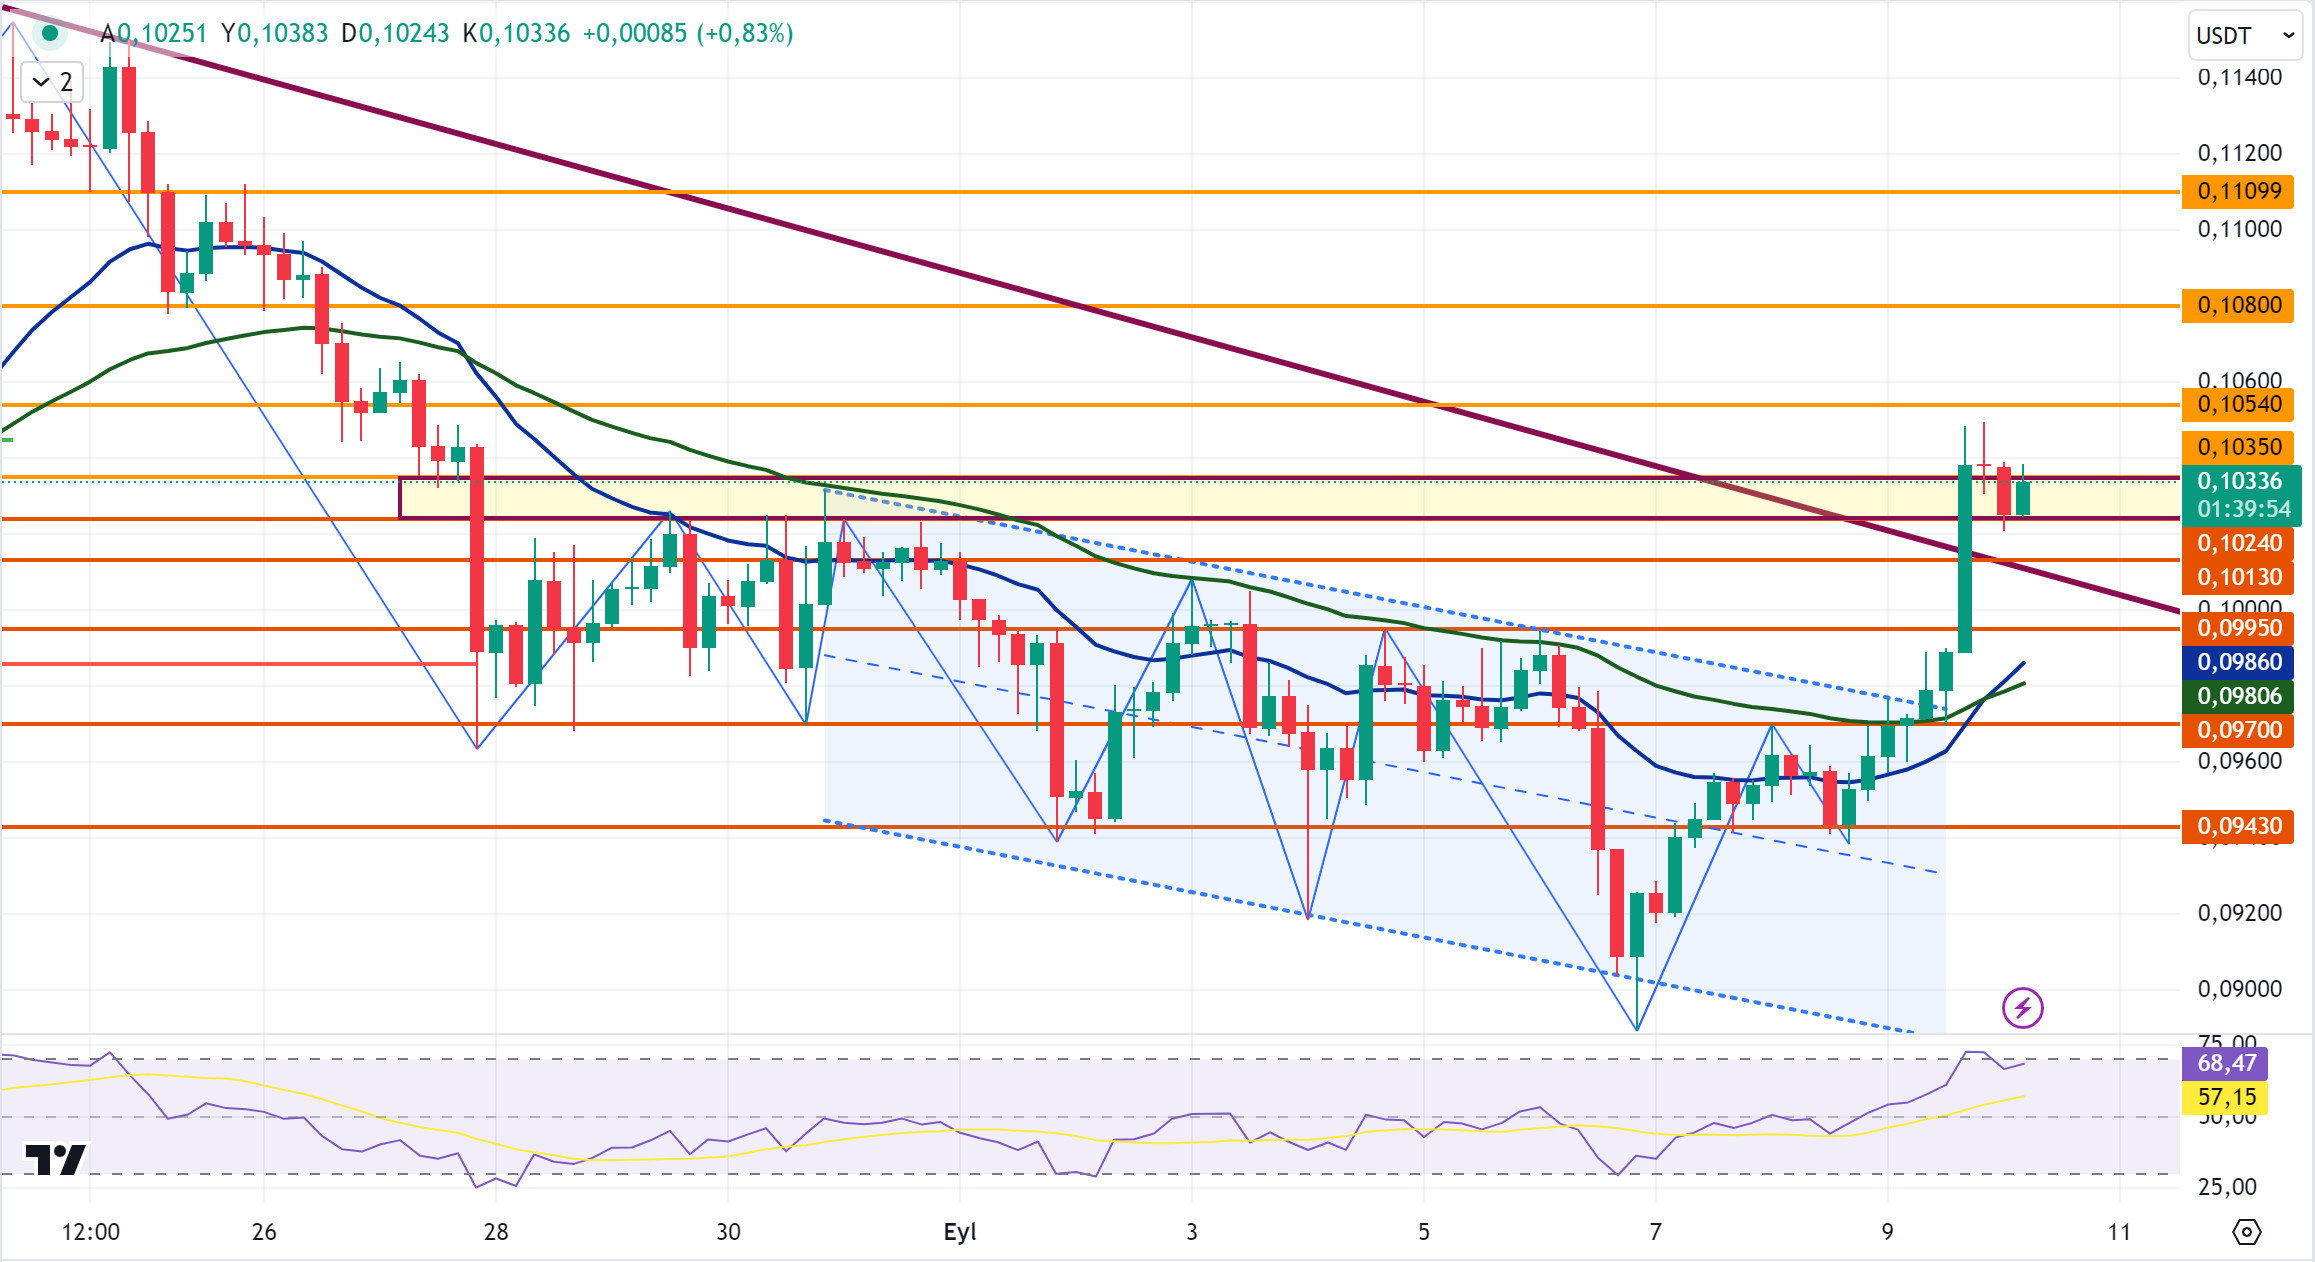
DOGE gained nearly 8% yesterday to close the day at 0.1037. In the 4-hour analysis, DOGE, which broke the EMA50 (Green Color) level yesterday after testing it, broke out of the downtrend and continued its uptrend, rising from 0.0970 to 0.1050. It then fell to the 0.1025-0.1035 band with the reaction sales. DOGE is currently trading at 0.1033.
In the 4-hour analysis, the 0.1024-0.1035 band stands out for DOGE and on the rise above this band, DOGE may test the resistance levels of 0.1054-0.1080-0.1109. In case of a decline below the mentioned band, DOGE may test the support levels of 0.1013-0.0995-0.0970.
If the rise in DOGE, which is on the rise by breaking the downtrend, continues to rise, it may decline with the reaction sales that may come at the 0.1054 resistance level and may offer a short trading opportunity. On the contrary, if it declines, it may rise with the reaction purchases that may come at the 0.0995 support level and may offer a long trading opportunity.
Supports 0.1013 – 0.0995 – 0.0970
Resistances 0.1054 – 0.1080 – 0.1 109
DOT/USDT
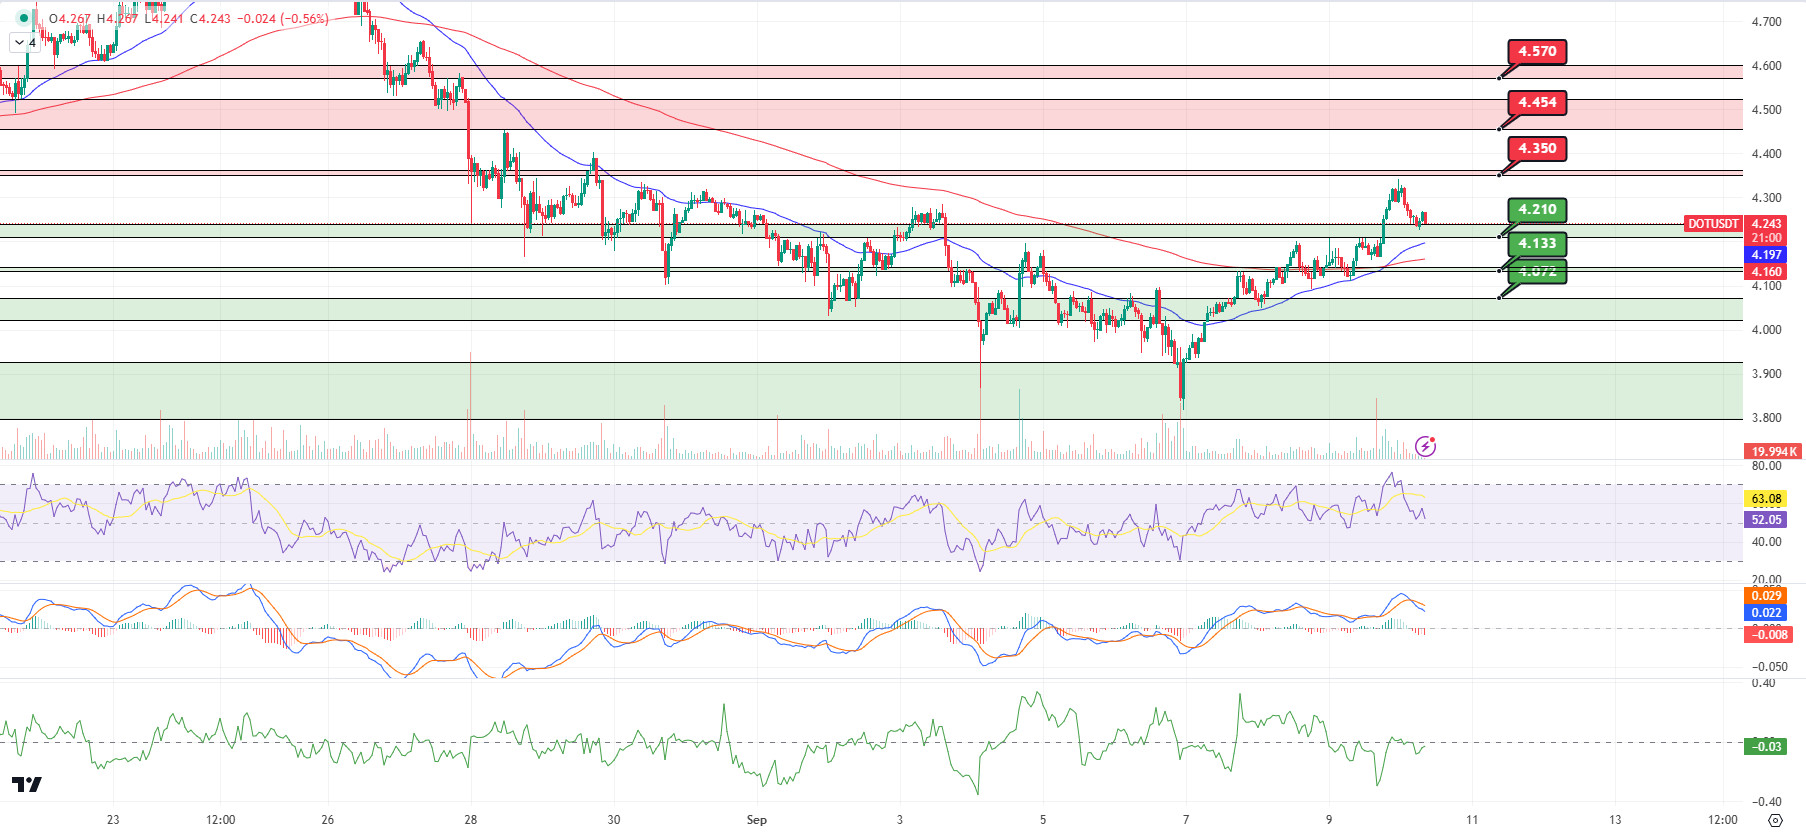
On the Polkadot (DOT) chart, the price broke the 4,210 resistance upwards and rose towards 4,350 levels with the reaction it received from 4,133 levels. At 4,350 levels, DOT, which corrected down with increasing selling pressure, may find support in the 4,210 band. When we look at the MACD and CMF (Chaikin Money Flow) oscillators, we can say that selling pressure dominates. Accordingly, if the price cannot get a reaction from 4,210 levels, it may retreat to the next support level of 4,133 levels. On the other hand, the EMA50 breaking the EMA200 upwards (Golden Cross) may cause investors to look at the chart more positively. In a positive scenario, if the price reacts from 4,210, it may want to break the selling pressure in the 4,350 band.
(Blue line: EMA50, Red line: EMA200)
Supports 4,210 – 4,133 – 4,072
Resistances 4.350 – 4.454 – 4.570
SHIB/USDT
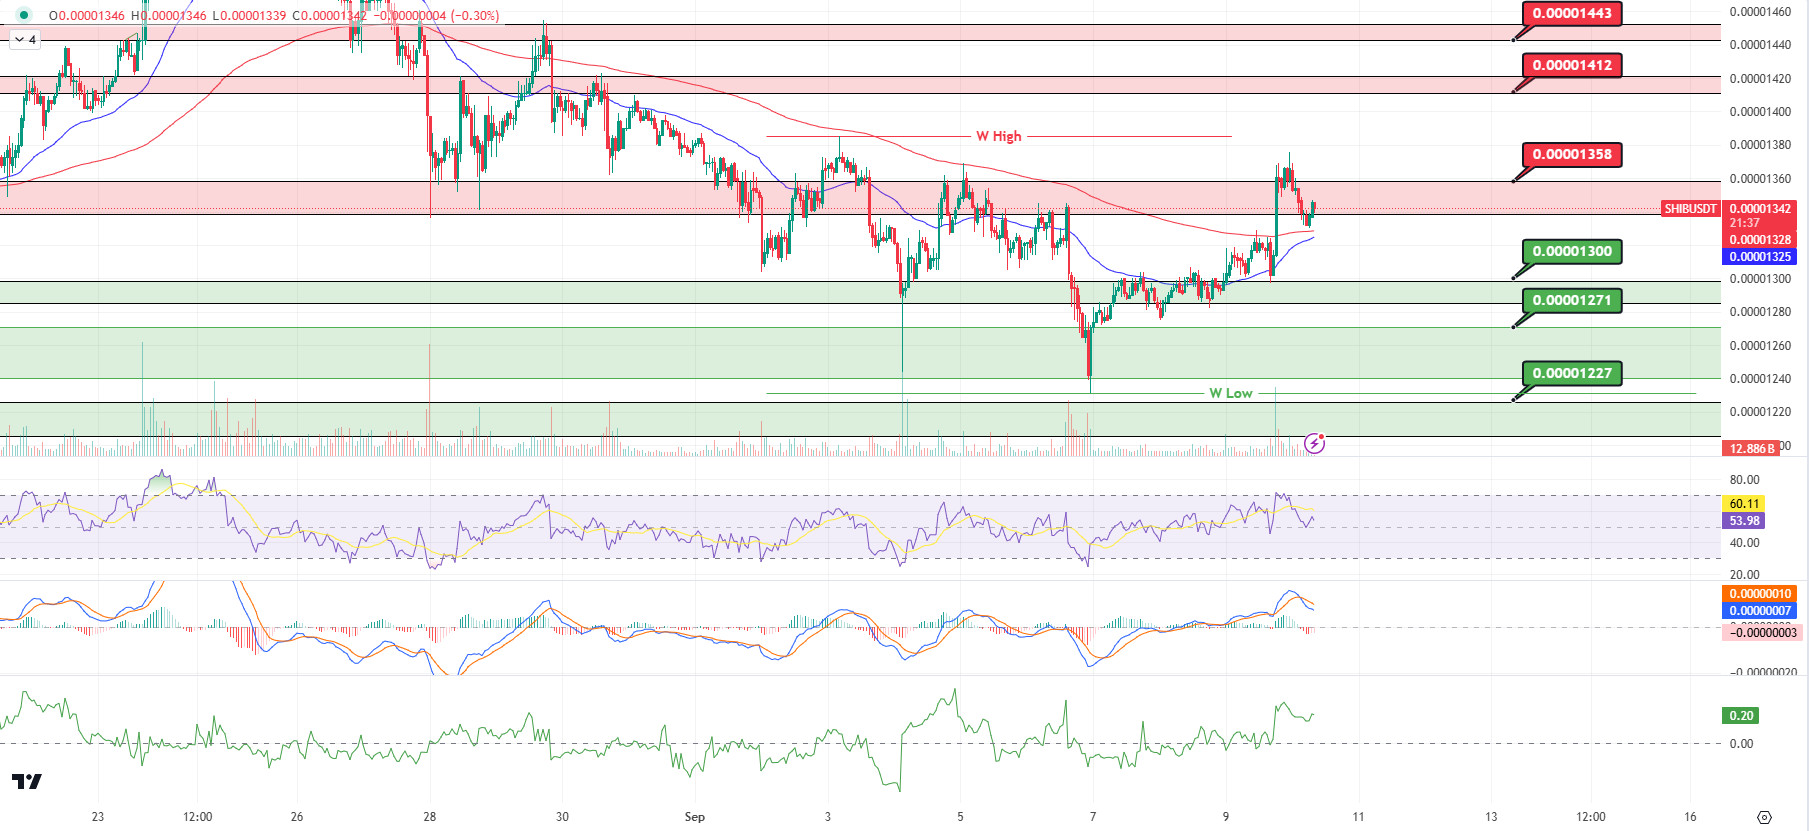
On the Shiba Inu (SHIB) chart, the price reacted from 0.00001300 to 0.00001358 but failed to break the selling pressure. On the MACD, it can be said that the selling pressure increased compared to the previous hour. If the selling pressure continues in the negative scenario, the price may want to test the 0.00001300 support again. When we examine the CMF (Chaikin Money Flow) oscillator, we see that the buying pressure is higher. In a positive scenario, the price may react to the EMA200 and break the selling pressure at 0.00001358. Also, in case the EMA50 breaks the EMA200 upwards (Golden Cross), the price may move towards the next resistance level at 0.00001412.
(Blue line: EMA50, Red line: EMA200)
Supports 0.00001300 – 0.00001271 – 0.00001227
Resistances 0.00001358 – 0.00001412 – 0.00001443
LEGAL NOTICE
The investment information, comments and recommendations contained herein do not constitute investment advice. Investment advisory services are provided by authorized institutions on a personalized basis, taking into account the risk and return preferences of individuals. The comments and recommendations contained herein are of a general nature. These recommendations may not be suitable for your financial situation and risk and return preferences. Therefore, making an investment decision based solely on the information contained herein may not produce results in accordance with your expectations.


