MARKET SUMMARY
Latest Situation in Crypto Assets
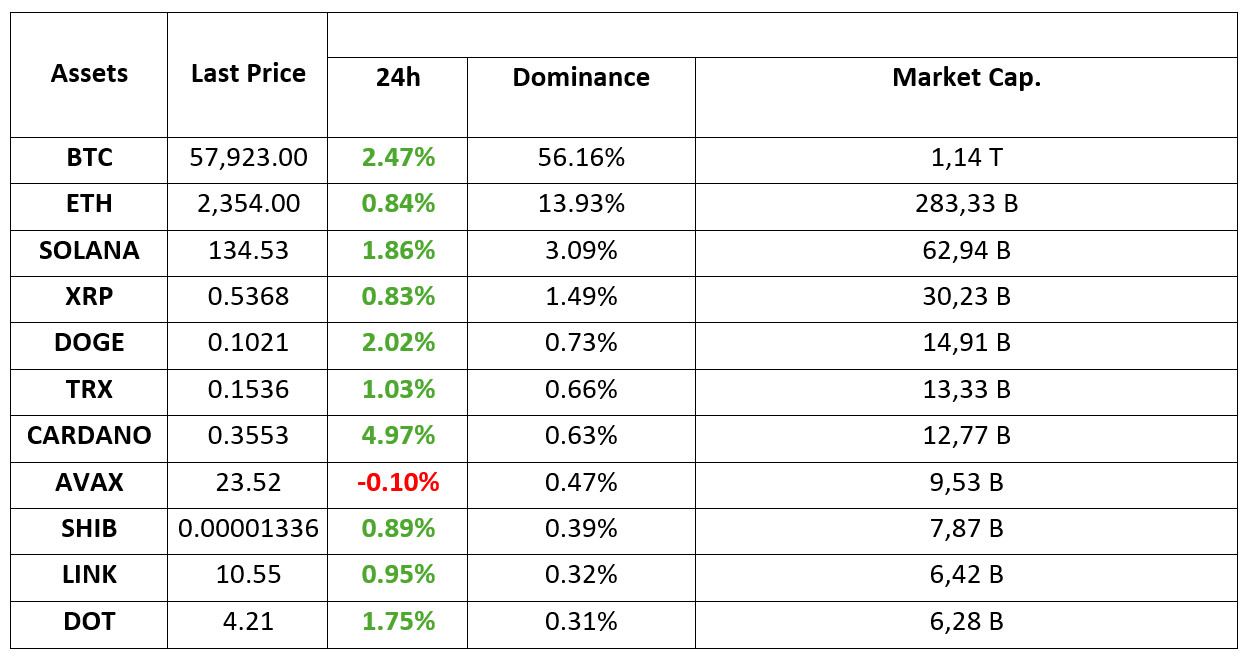
*Prepared on 12.09.2024 at 07:00 (UTC)
WHAT’S LEFT BEHIND
What will the Fed do after the inflation data
The US inflation figures came in at the expected level, which significantly increased the markets’ expectations for a 25 bps rate cut. Expectations for a 50 bps rate cut fell to 17% on the CME, the lowest level in recent times. Moreover, inflation in the US has declined for the last 5 consecutive months.
ENS move from PayPal as it launches 2021 bull
Two major US payment companies, PayPal and its subsidiary Venmo, have added support for Ethereum Name Service (ENS). Millions of users will now be able to send cryptocurrency to each other via ENS names.
UK Government’s New Bill Recognizes Bitcoin as Personal Property
The UK government has taken a decisive step towards clarifying the legal framework for digital assets, particularly cryptocurrencies. This is an important step in protecting the rights of digital asset owners and strengthens the UK’s position in the global crypto market.
HIGHLIGHTS OF THE DAY
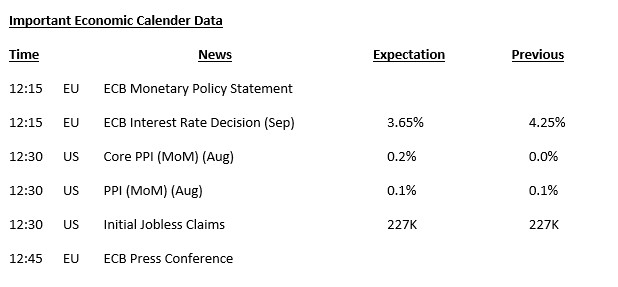
INFORMATION:
*The calendar is based on UTC (Coordinated Universal Time) time zone. The economic calendar content on the relevant page is obtained from reliable news and data providers. The news in the economic calendar content, the date and time of the announcement of the news, possible changes in the previous, expectations and announced figures are made by the data provider institutions. Darkex cannot be held responsible for possible changes that may arise from similar situations.
MARKET COMPASS
Expectations regarding the US Federal Reserve’s (FED) interest rate cut course continue to be the main dynamic driving price movements in global markets and therefore the value of digital assets. After yesterday’s Consumer Price Index (CPI), all eyes will be on today’s Producer Price Index (PPI). The European Central Bank (ECB) is also expected to cut its policy rate today.
Following the CPI figures, which included both good and bad data, US stock markets recorded significant losses during the day, but managed to close the day with an increase led by technology stocks. With the purchases made by investors who saw the losses as an opportunity, especially in the Nasdaq index, the gain exceeded 2%. During the Asian session, the dollar gave back some of the rise it recorded after the CPI data, while Asian indices also gained value following Wall Street. Ahead of the ECB’s monetary policy decision, European indices are expected to start the day with a rise in line with the general market perception.
We cannot say that the CPI data actually changed anything fundamentally. Markets are almost certain to see a 25 basis point cut by the Fed in September, while they continue to price in a 100 basis point cut by the end of the year. This implies that a “jumbo” rate cut of 50 basis points is still expected at one of the meetings in November or December. According to recent pricing, November is more likely. However, we have seen this probability distribution change very frequently recently.
ECB’s monetary policy statement is important for the overall market perception. However, PPI indicators will be critical for pricing behavior. PPI data, which includes the components of the PCE Price Index used by the FED to monitor inflation, may affect expectations regarding the FED’s interest rate cut course.
In yesterday’s evening analysis, we said that markets seemed more inclined to price the positive. And from a short-term perspective, they did. If we use BTC as a barometer, the rise from around 56k reflected this. We can see that the risk appetite has strengthened a little more, but it seems that PPI data will be important today for the continuation of the rise in digital assets that started yesterday. While the data may reflect negatively on crypto assets by exceeding expectations, a data set that will remain below may support the rises. It should be added that there is still no full rally mood in the market, and a few signs that the FED may accelerate interest rate cuts may support this mood.
TECHNICAL ANALYSIS
BTC/USDT
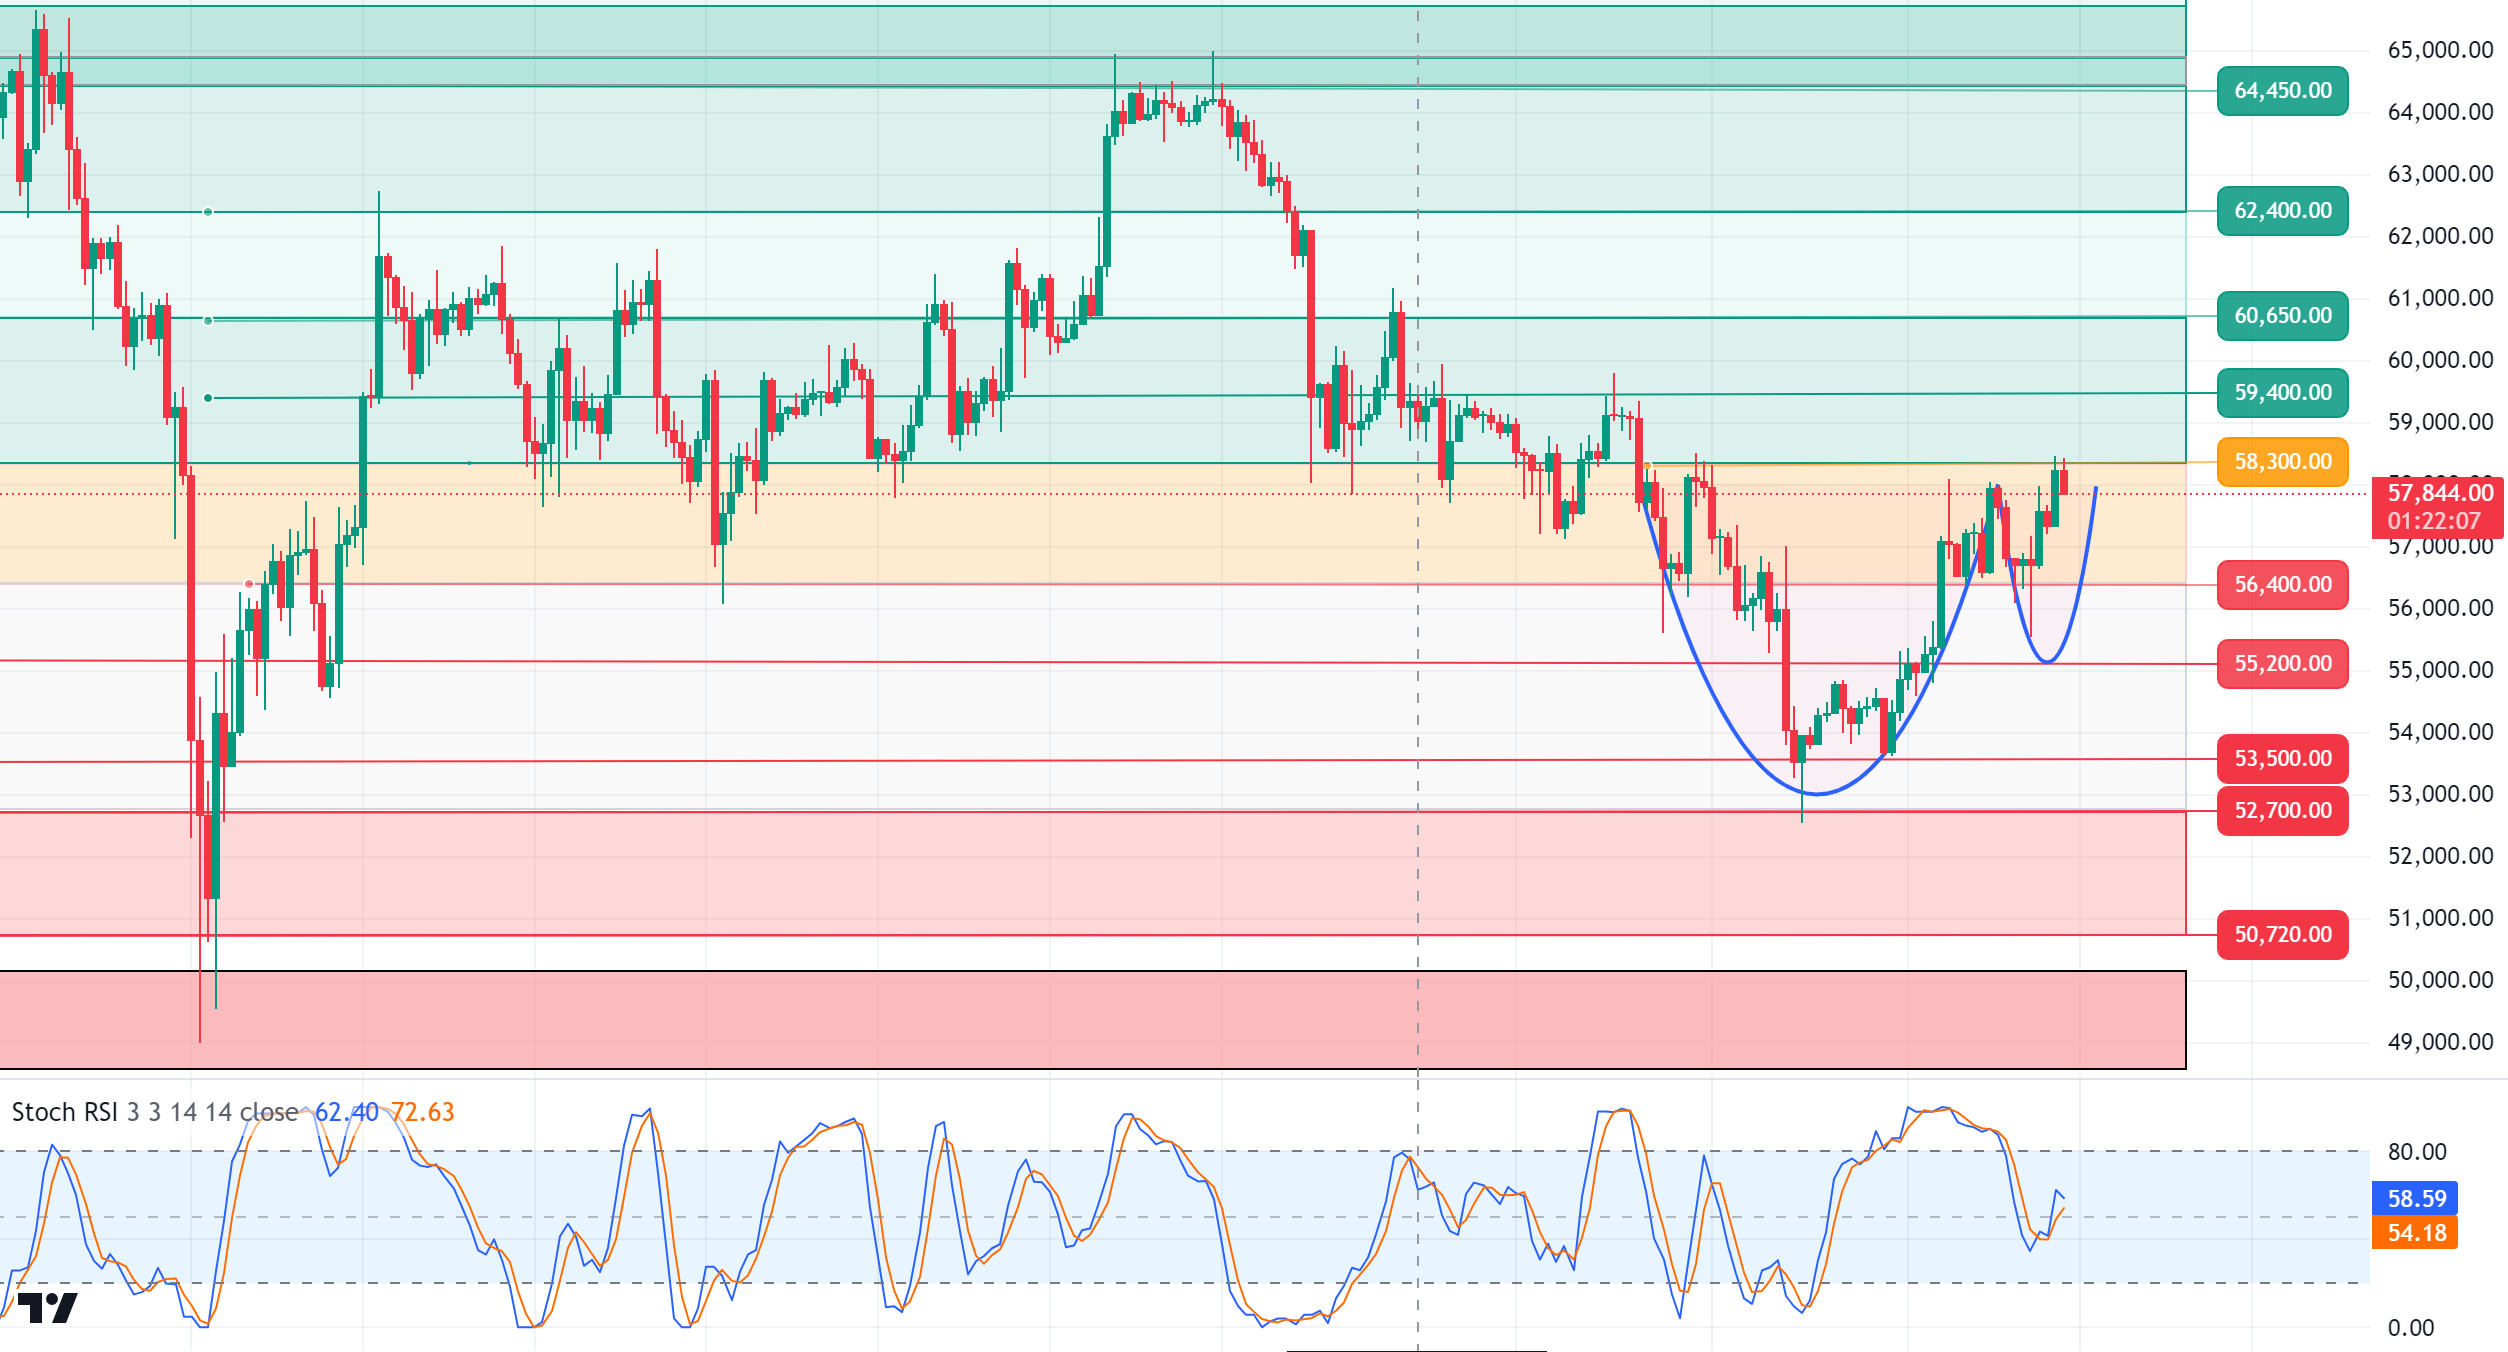
in Bitcoin! The volatility we expected in Bitcoin after the US inflation data seems to have started again with the price testing 58,000 levels. The easing in inflation data, which is an important factor driving Bitcoin’s price increase, shapes the FED interest rate policy. Finally, the expectation of a 50 basis point rate cut has dropped to 17% on the CME, indicating that Bitcoin will now price in 25 basis points until the rate meeting. As a matter of fact, in the BTC 4-hour technical analysis, we can see that the selling pressure has decreased as the price, which retreated to 55,600 yesterday, showed a rapid recovery and tested 58,000 levels again. With the increase in risk appetite with the interest rate cut and the market turning “greedy” in the fear and greed index, the price may reorient towards the psychological resistance level of 60,650. We see that the bowl-handle, which is one of the trend continuation patterns, has not yet fully completed the handle part. A pullback towards the 56,400 level, which is the support point, can ensure the completion of the handle part and show that the price will rise harder.
Supports 57,200 – 55,200 – 56,400
Resistances 58,300 – 59,400 – 60,650
ETH/USDT
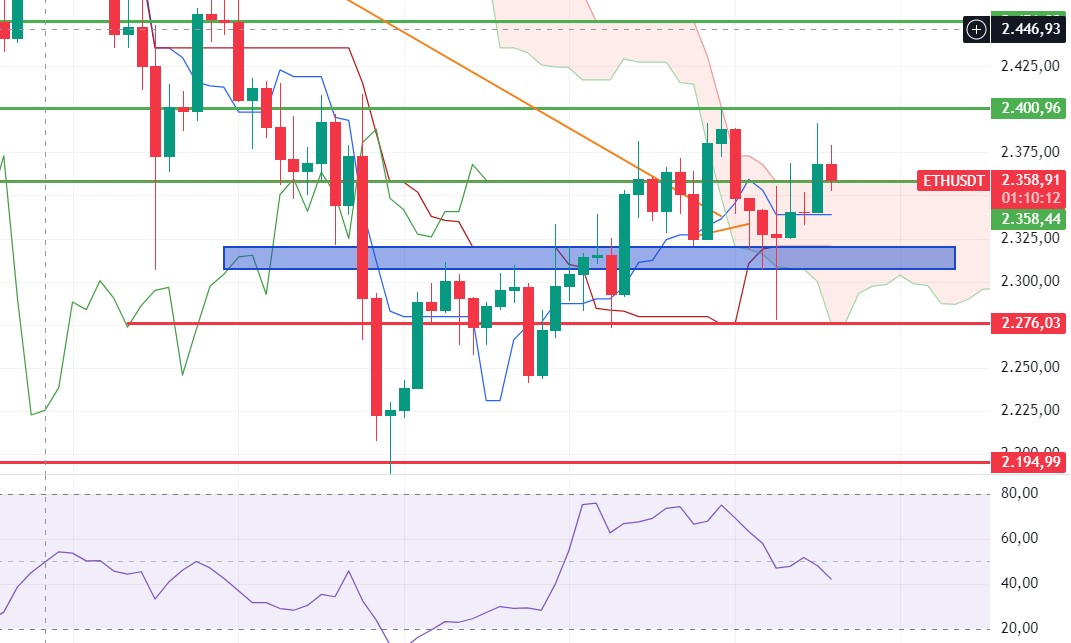
Ethereum, which rose as high as 2,400 levels at the Asian open yesterday as expected, was once again rejected and fell back to the upper band of the kumo cloud. This latest sharp decline came on the back of a Vitalik Buterin-funded biodefense group’s cowswap twap-ordered ETH sale. While the positive mismatch in Ethereum’s MFI continues, we could see another 2,400 attempt during the day if the coin can get a reaction from the cloud level. Exceeding 2,400 could quickly bring 2,450 and then 2,558 levels. The most important support point seems to be 2,276. A break of this level may bring deep declines.
Supports 2,307 – 2,273 – 2,194
Resistances 2,358 – 2,400 – 2,451
LINK/USDT
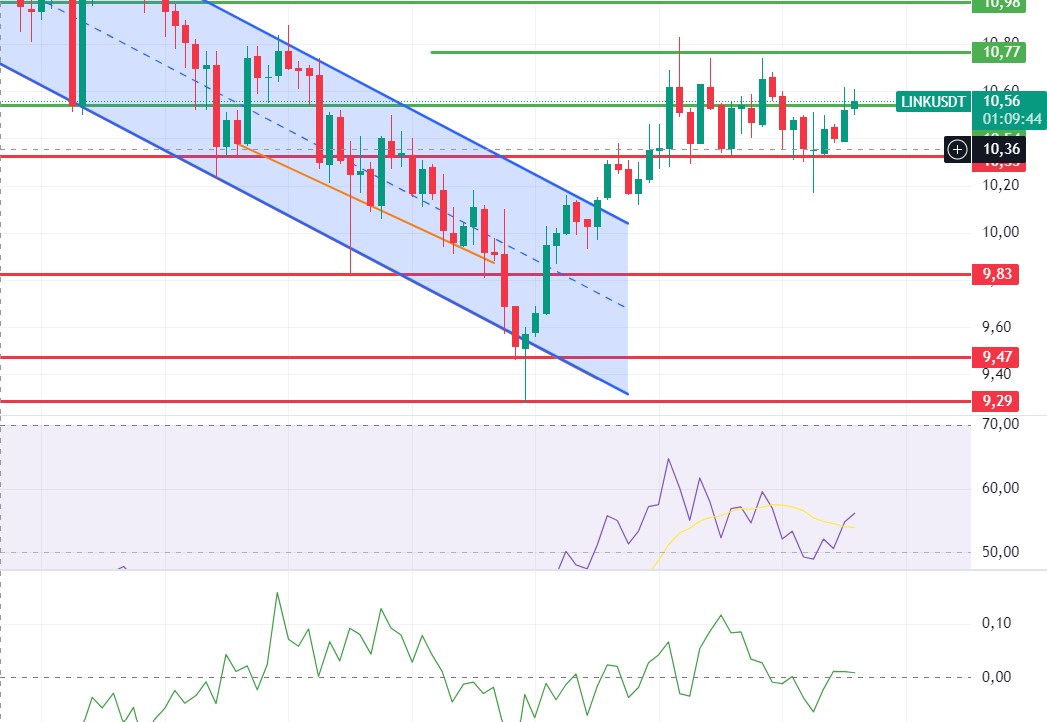
Gain of 10.56 is positive, but descending highs in RSI and negative trend in CMF may cause deep declines as the market retreats. Loss of the 10.33 level may reveal a very negative outlook. For these reasons, it is necessary to be very careful in transactions during the day for LINK. Gaining the 10.77 level may start a positive trend.
Supports 10.54 – 10.33 – 9.83
Resistances 10.77 – 10.98 – 11.45
SOL/USDT
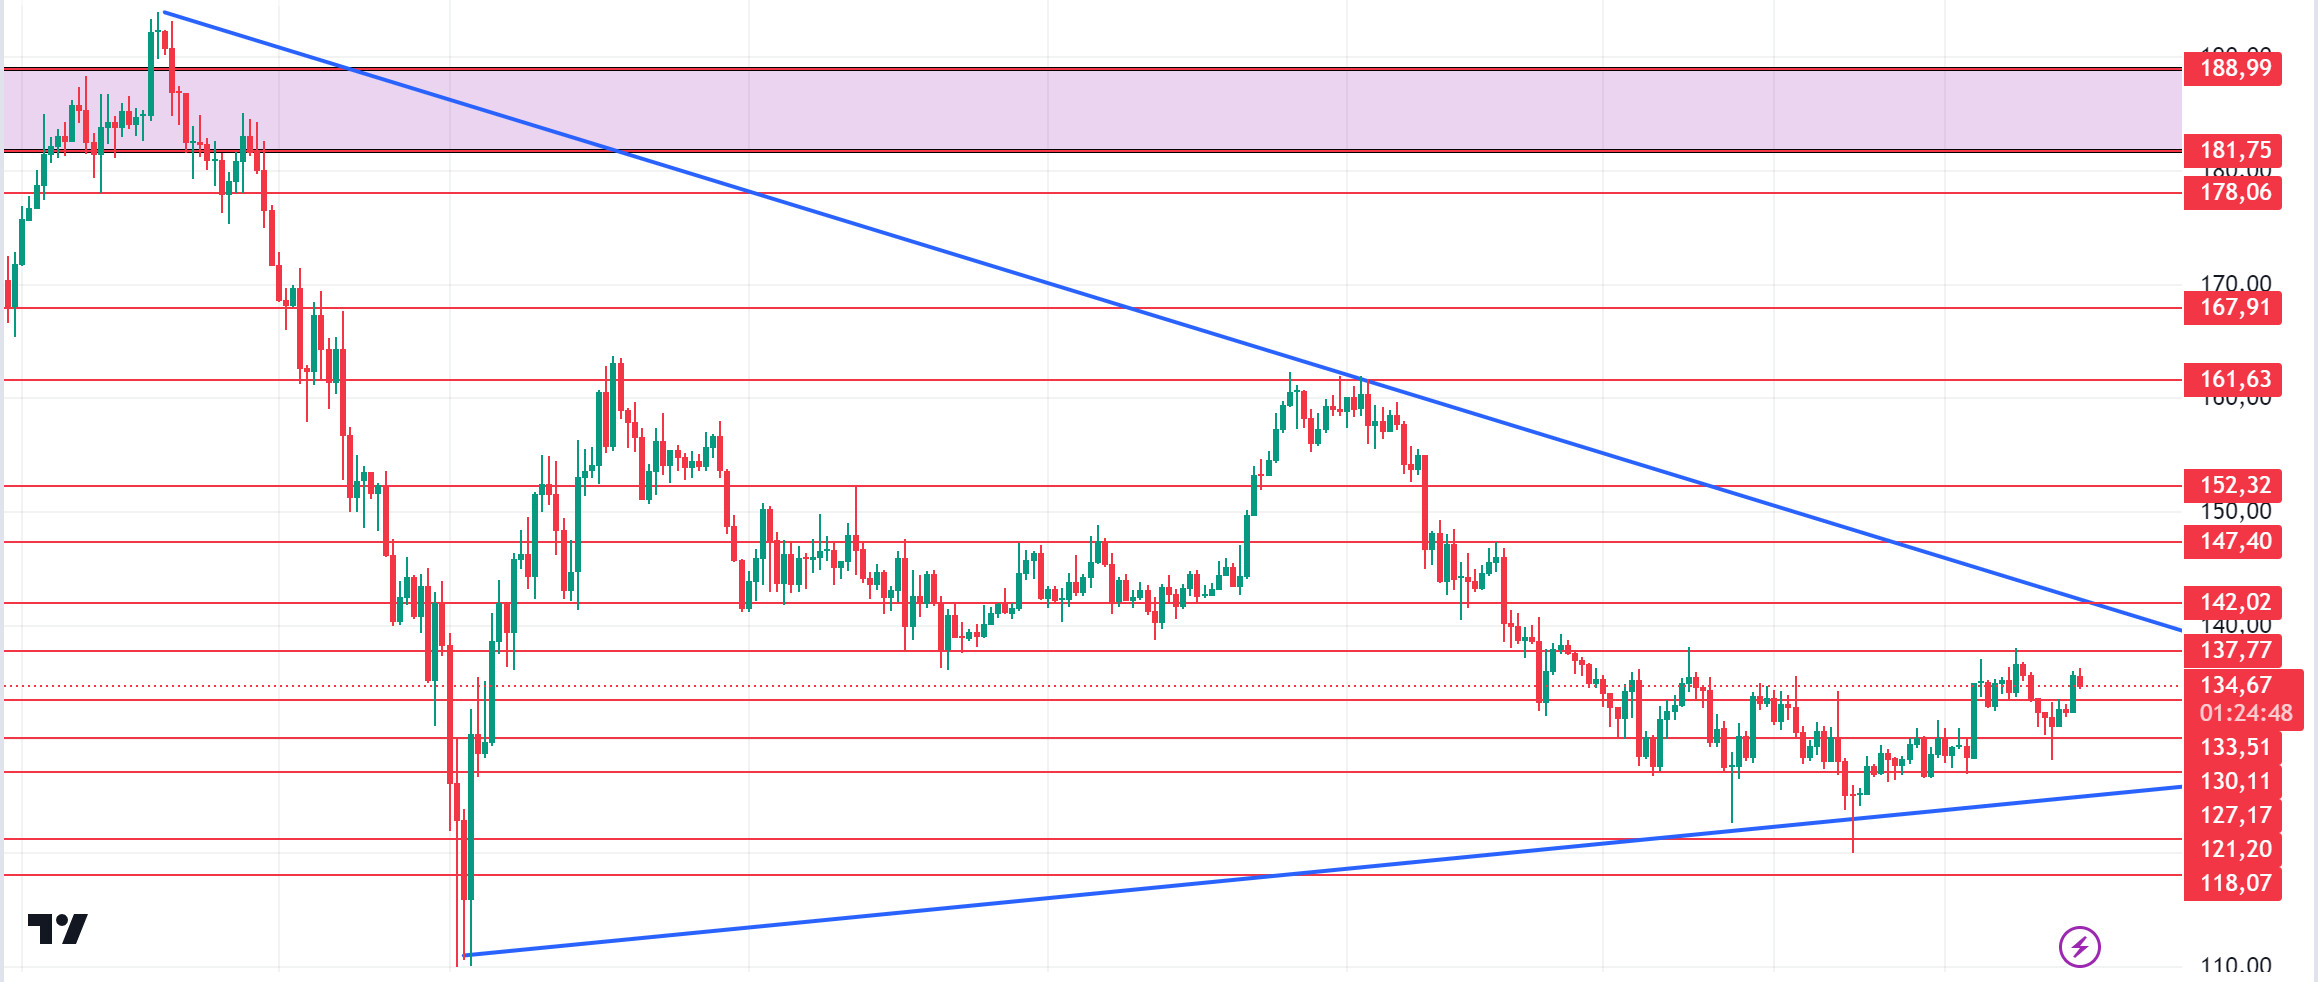
Today, unemployment claims data, August PPI inflation data and ongoing jobless claims data from the US are among the data to be followed. On the other hand, according to Solscan data, the Alameda-affiliated wallet reportedly transferred a total of $ 23.75 million worth of SOL from the Proof-of-Stake (PoS) network today. This led the crypto community to wonder whether SOL could be transferred to centralized exchanges (CEX). However, Solana recently joined hands with some centralized exchanges and launched liquid staking tokens called BNSOL and BGSOL respectively. Is this pre-rally break news? According to data from Artemis, Solana has passed 5.5 million daily active addresses. Technically, we see a narrowing triangle pattern. SOL tried the important level of $ 138. But it retreated a little as a result of yesterday’s inflation data. With the recovery of the market, it is currently trading at $ 135. If the rises continue due to the increase in volumes, it may test the resistance levels 137.77 – 142.02. In case of profit sales due to yesterday’s rises, a potential rise should be followed if it reaches the support levels of 133.51 – 130.11.
Supports 130.11 – 127.17 – 121.20
Resistances 133.51 – 130.11 – 127.17
ADA/USDT
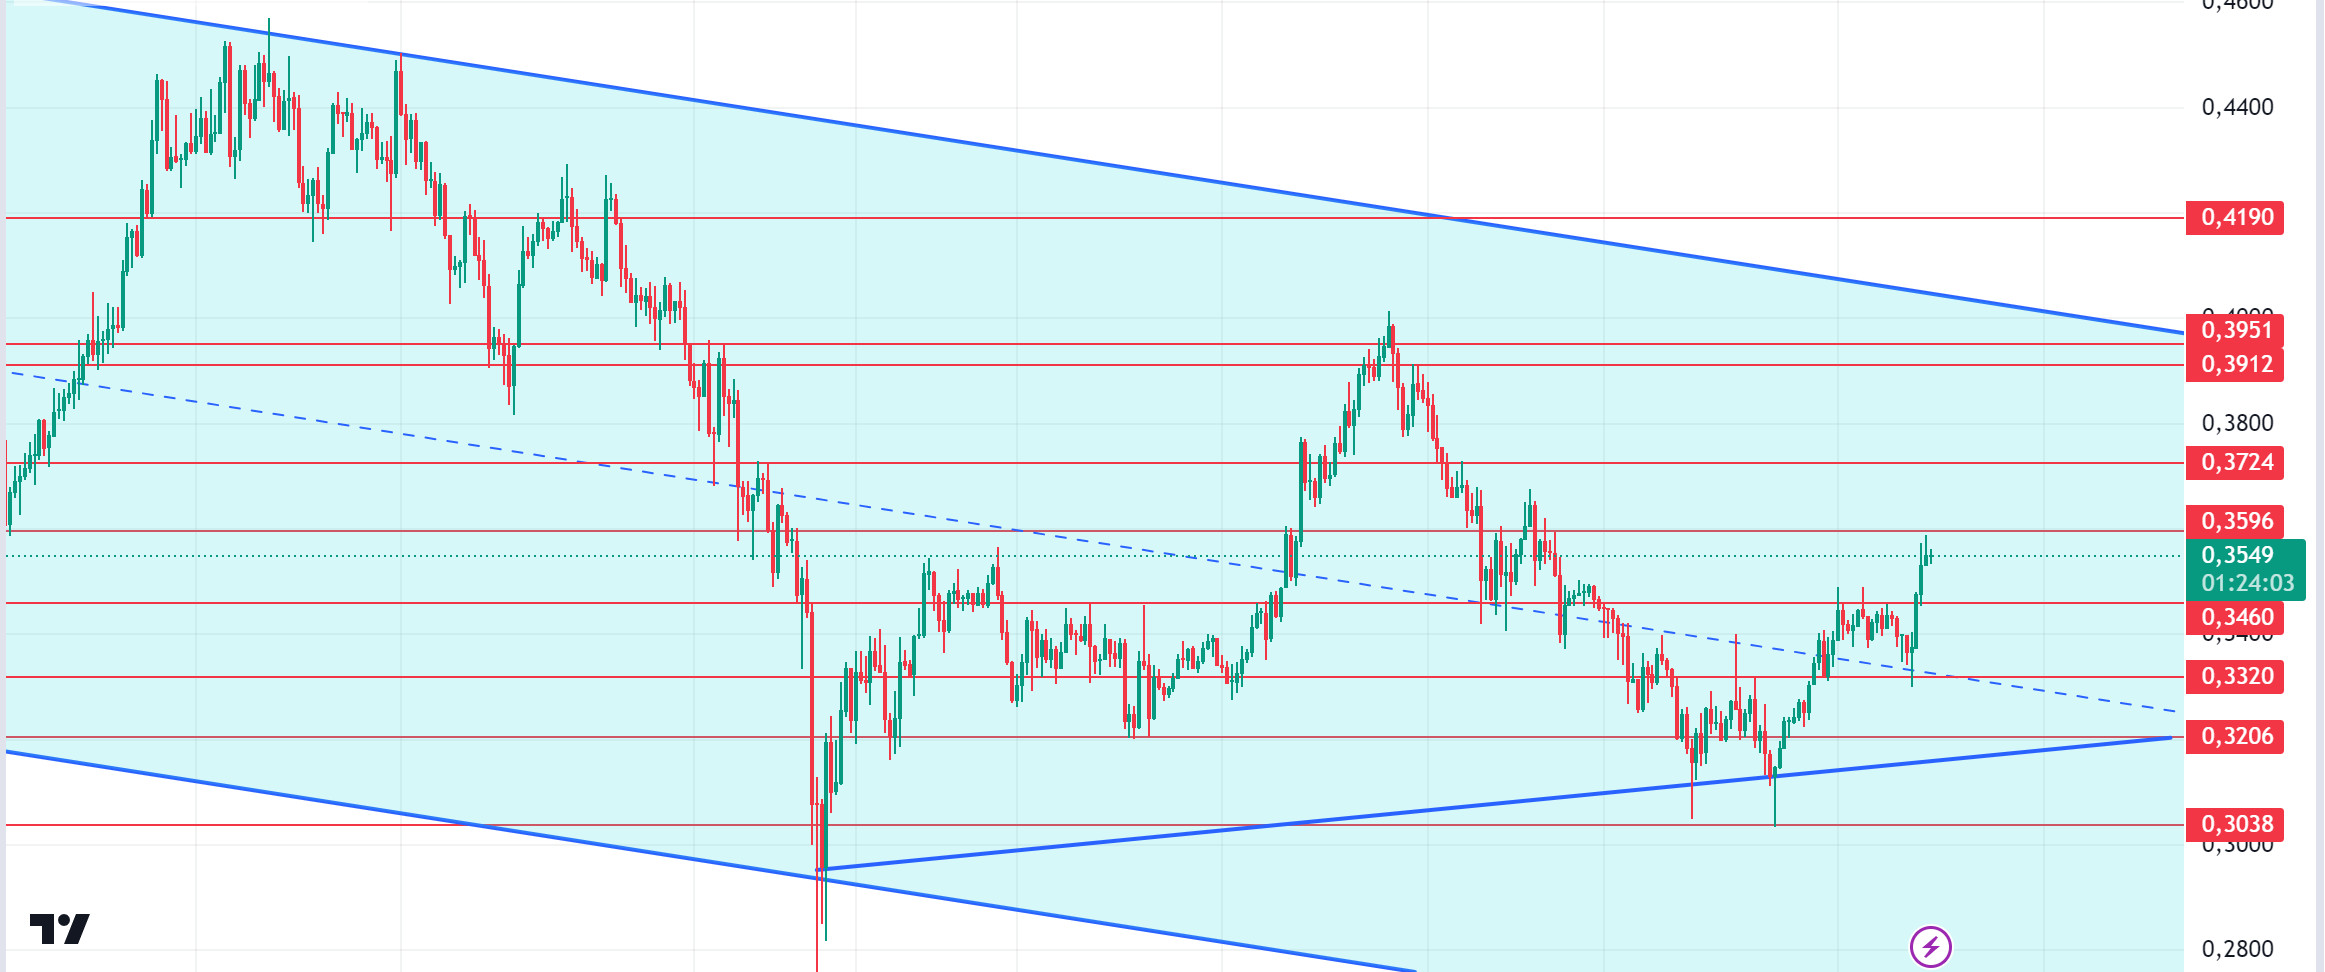
Unemployment claims data, August PPI inflation data and ongoing jobless claims data from the US today are among the data to be followed. In the Cardano ecosystem, Cardano liquid staking was recently discussed on the X platform. Charles Hoskinson refuted the claims that ADA is locked when staking in the protocol. This was reflected as an increase in ADA. ADA consolidates in a narrow range between $0.3020 and $0.3950. When we look at the chart of ADA, it has exceeded the middle level of the falling channel. ADA’s market capitalization has increased by 5.83% in the last 24 hours, while its last 24-hour volume increased by 40% to $275 million. This rise in volume could enable ADA to break through the 0.3951 resistance. In this scenario, 0.3596 – 0.3724 levels can be followed as resistance points. If the volume falls, 0.3460 – 0.3320 levels can be followed.
Supports 0.3460 – 0.3320 – 0.3206
Resistances 0.3596 – 0.3724 – 0.3912
AVAX/USDT
AVAX, which opened yesterday at 24.36, closed the day at 23.28, down 4.5%. Today, US unemployment claims and US producer price index data will be announced. The data to be announced in this period when the market is in search of direction is important and may cause volatility in the market.
AVAX, which is trading at 23.45 today, is seen to react from the EMA200 support on the 4-hour chart. With the buying reaction from here, it broke the 23.60 resistance and is trying to hold on to it. As long as it stays above 23.60, it may want to test the 24.65 resistance. It cannot hold on 23.60 support and may test 22.79 and 22.23 supports with the candle close below the EMA200. As long as it stays above 20.38 support during the day, we can expect the bullish appetite to continue. With the break of 20.38 support, sales may increase.
(EMA200: Orange)
Supports 23.60 – 22.79 – 22.23
Resistances 24.09 – 24.65 – 25.35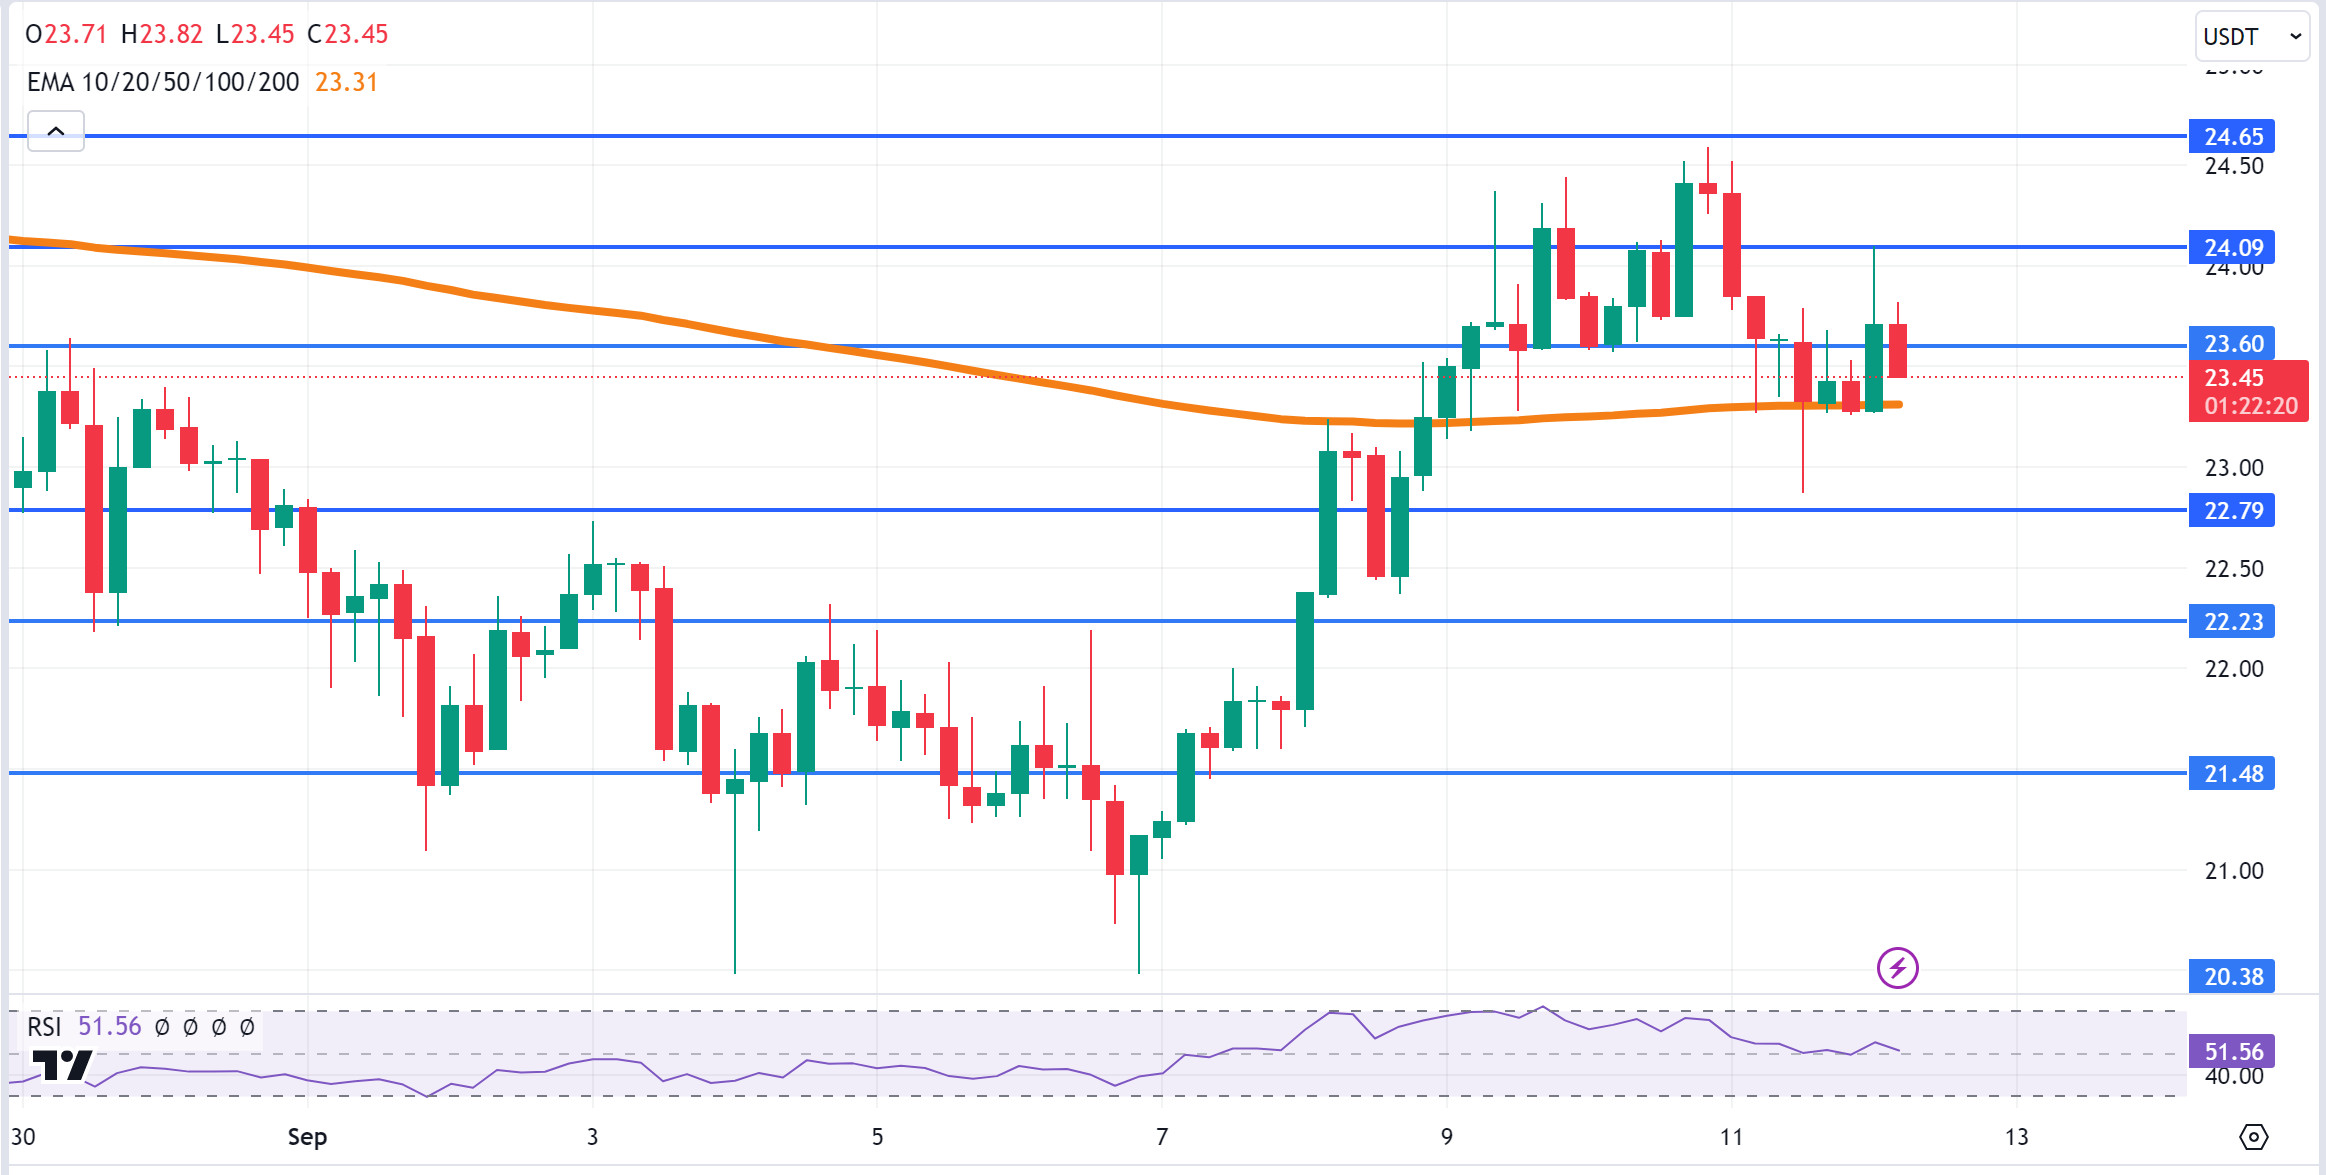
TRX/USDT
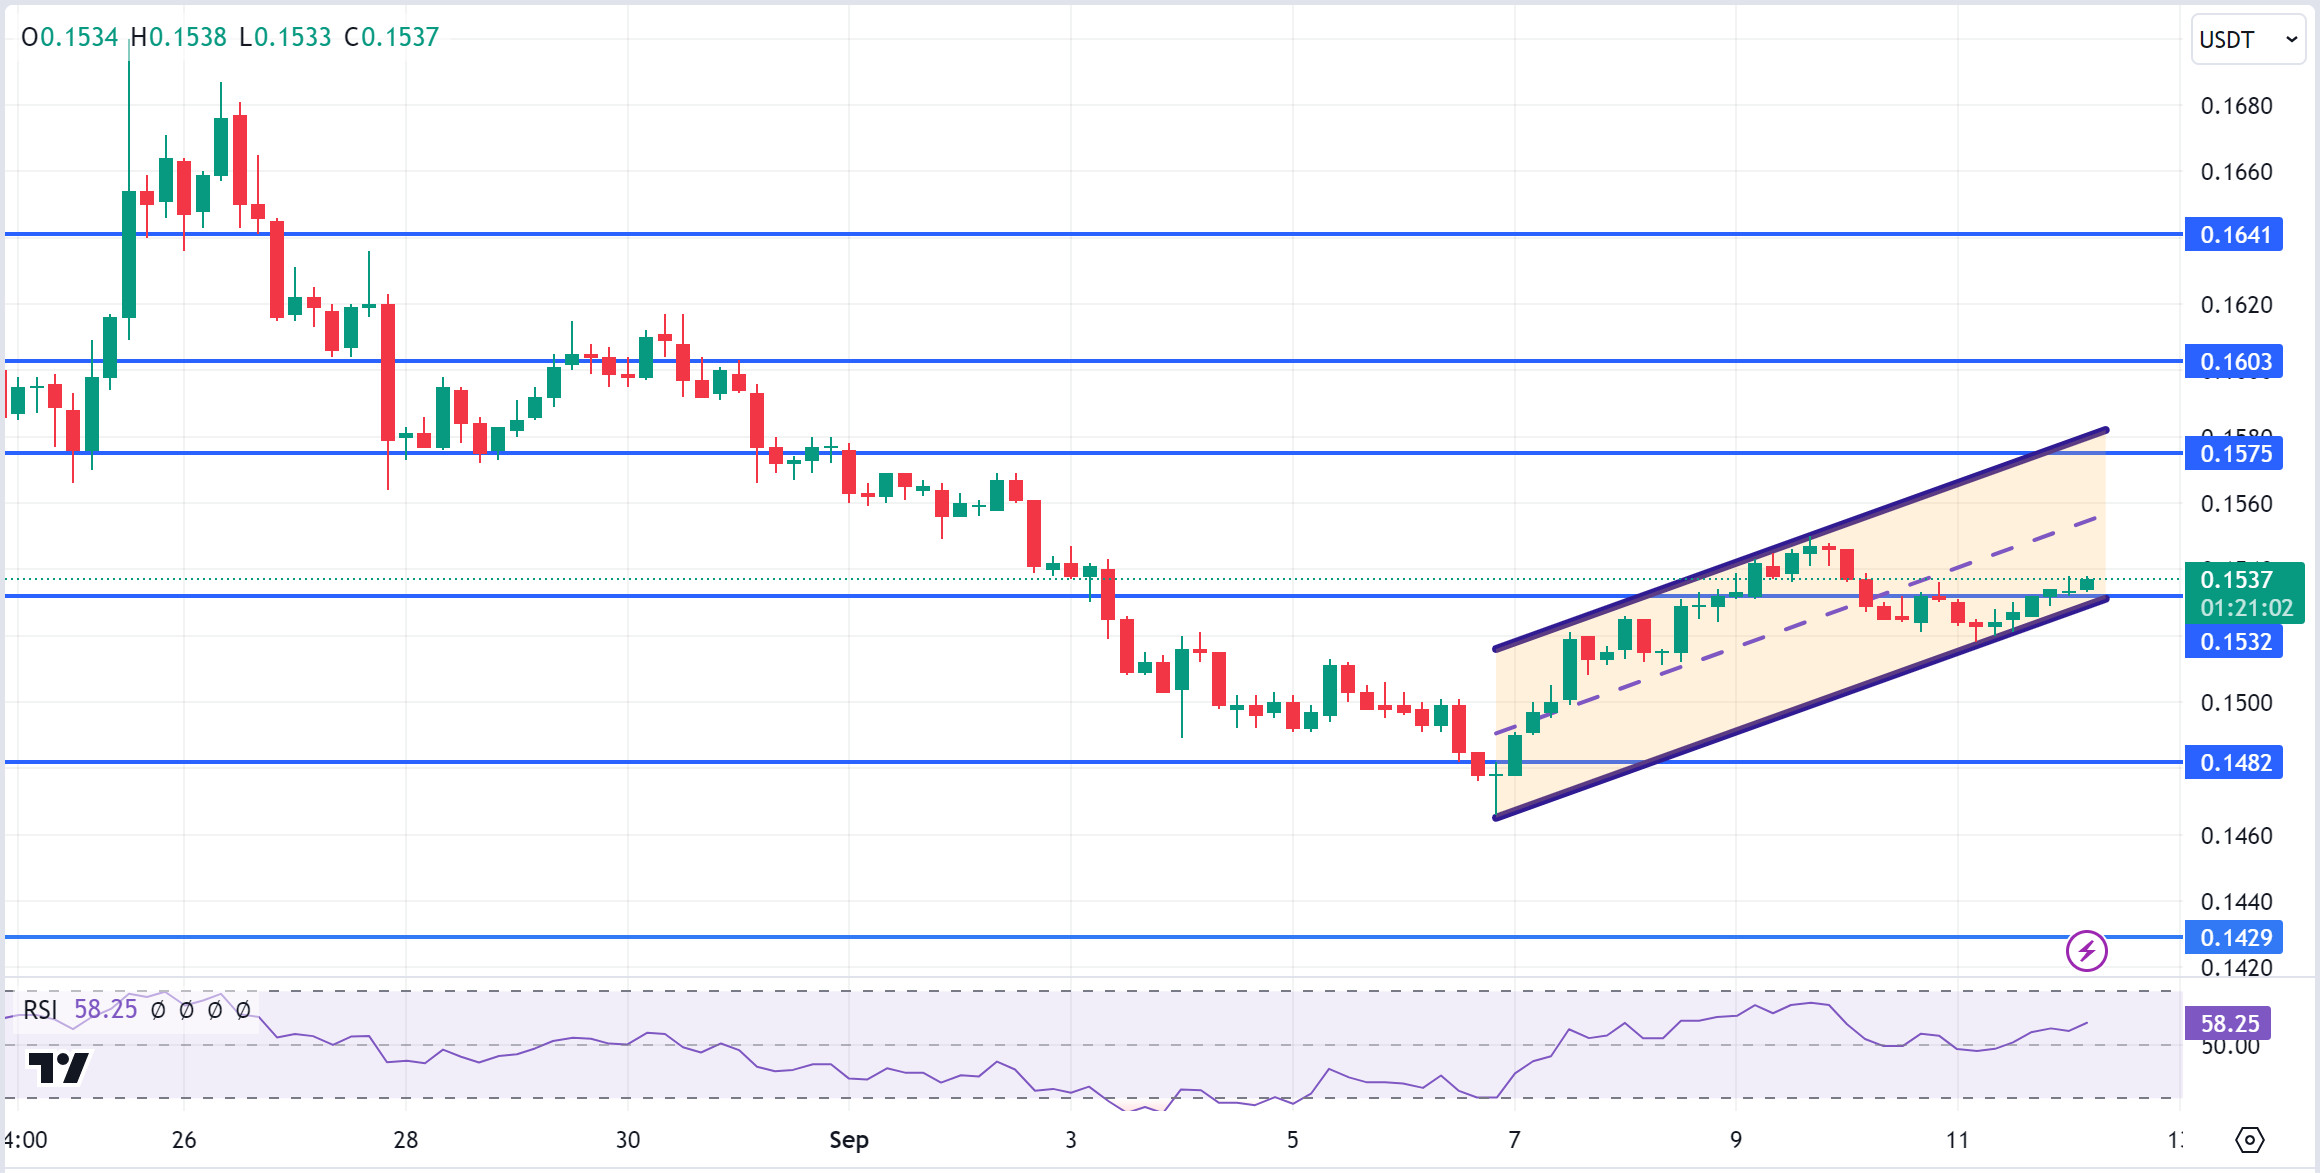
TRX, which started yesterday at 0.1530, closed the day at 0.1534. Today, unemployment claims and producer price index data will be released by the US and the market will be closely following these data. If the data comes in line with expectations, it may be positive for the market. TRX, which is trading at 0.1537 today, continues its movement within the rising channel on the 4-hour chart. It is in the lower band of the channel and can be expected to rise from here. In such a case, it can continue its movement to the upper band of the channel and test the 0.1575 resistance. If there is no reaction from the lower band of the channel and the decline continues, it may want to test 0.1482 support. As long as TRX stays above 0.1482 support, it can be expected to continue its upward demand. If this support breaks down, sales may increase.
Supports 0.1532 – 0.1482 – 0.1429
Resistances 0.1575 – 0.1603 – 0.1641
XRP/USDT
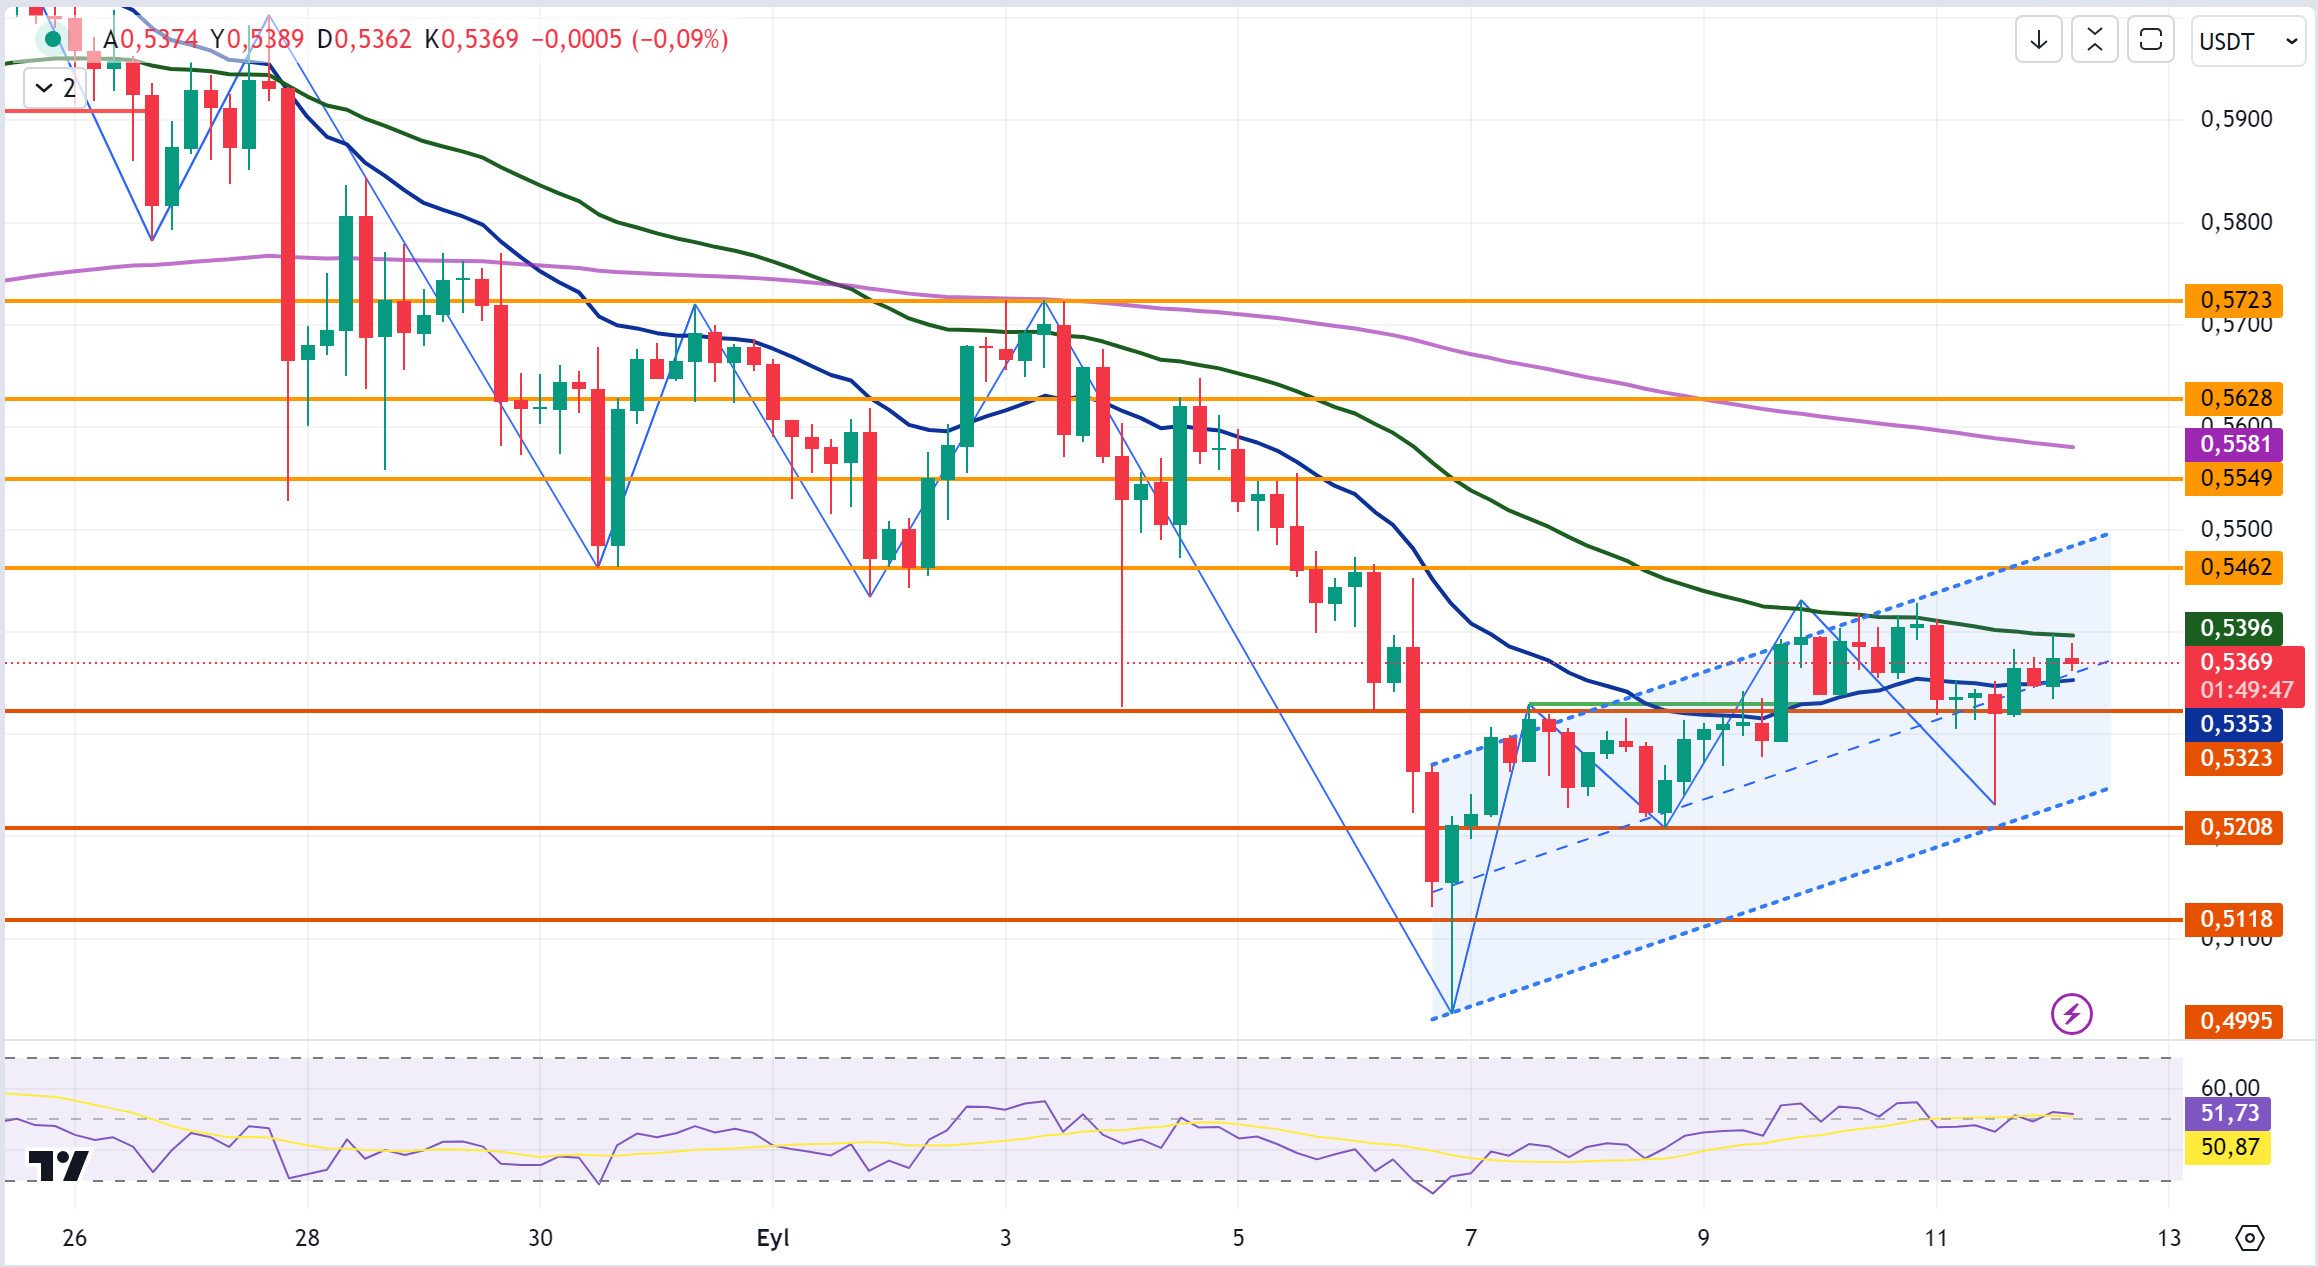
XRP started the new day at 0.5346 with a 1% loss on a daily basis yesterday and is currently trading at 0.5369. In the 4-hour analysis, XRP, which started trading between the EMA20 (Blue Color) level and the EMA50 (Green Color) level after its rise, tested and failed to break the EMA20 and EMA50 levels and continues to move within this horizontal band. XRP, which started the day bullish, may test the resistance levels of 0.5462-0.5549-0.5628 with the continuation of the rise if it continues to rise and breaks the EMA50 level after testing it again. In case of a decline, it may test the support levels of 0.5323-0.5208-0.5118 in the continuation of the decline after retesting and breaking the EMA20 level, which it tested yesterday on the last candle and today on the first candle in the 4-hour analysis.
As XRP continues to move in a horizontal band between the EMA20 and EMA50 levels, it may offer short trading opportunities on a downside break of the EMA20 level and long trading opportunities on an upside break of the
EMA50 level.
Supports 0.5323 – 0.5208 – 0. 5118
Resistances 0.5462 – 0.5549 – 0.5628
DOGE/USDT
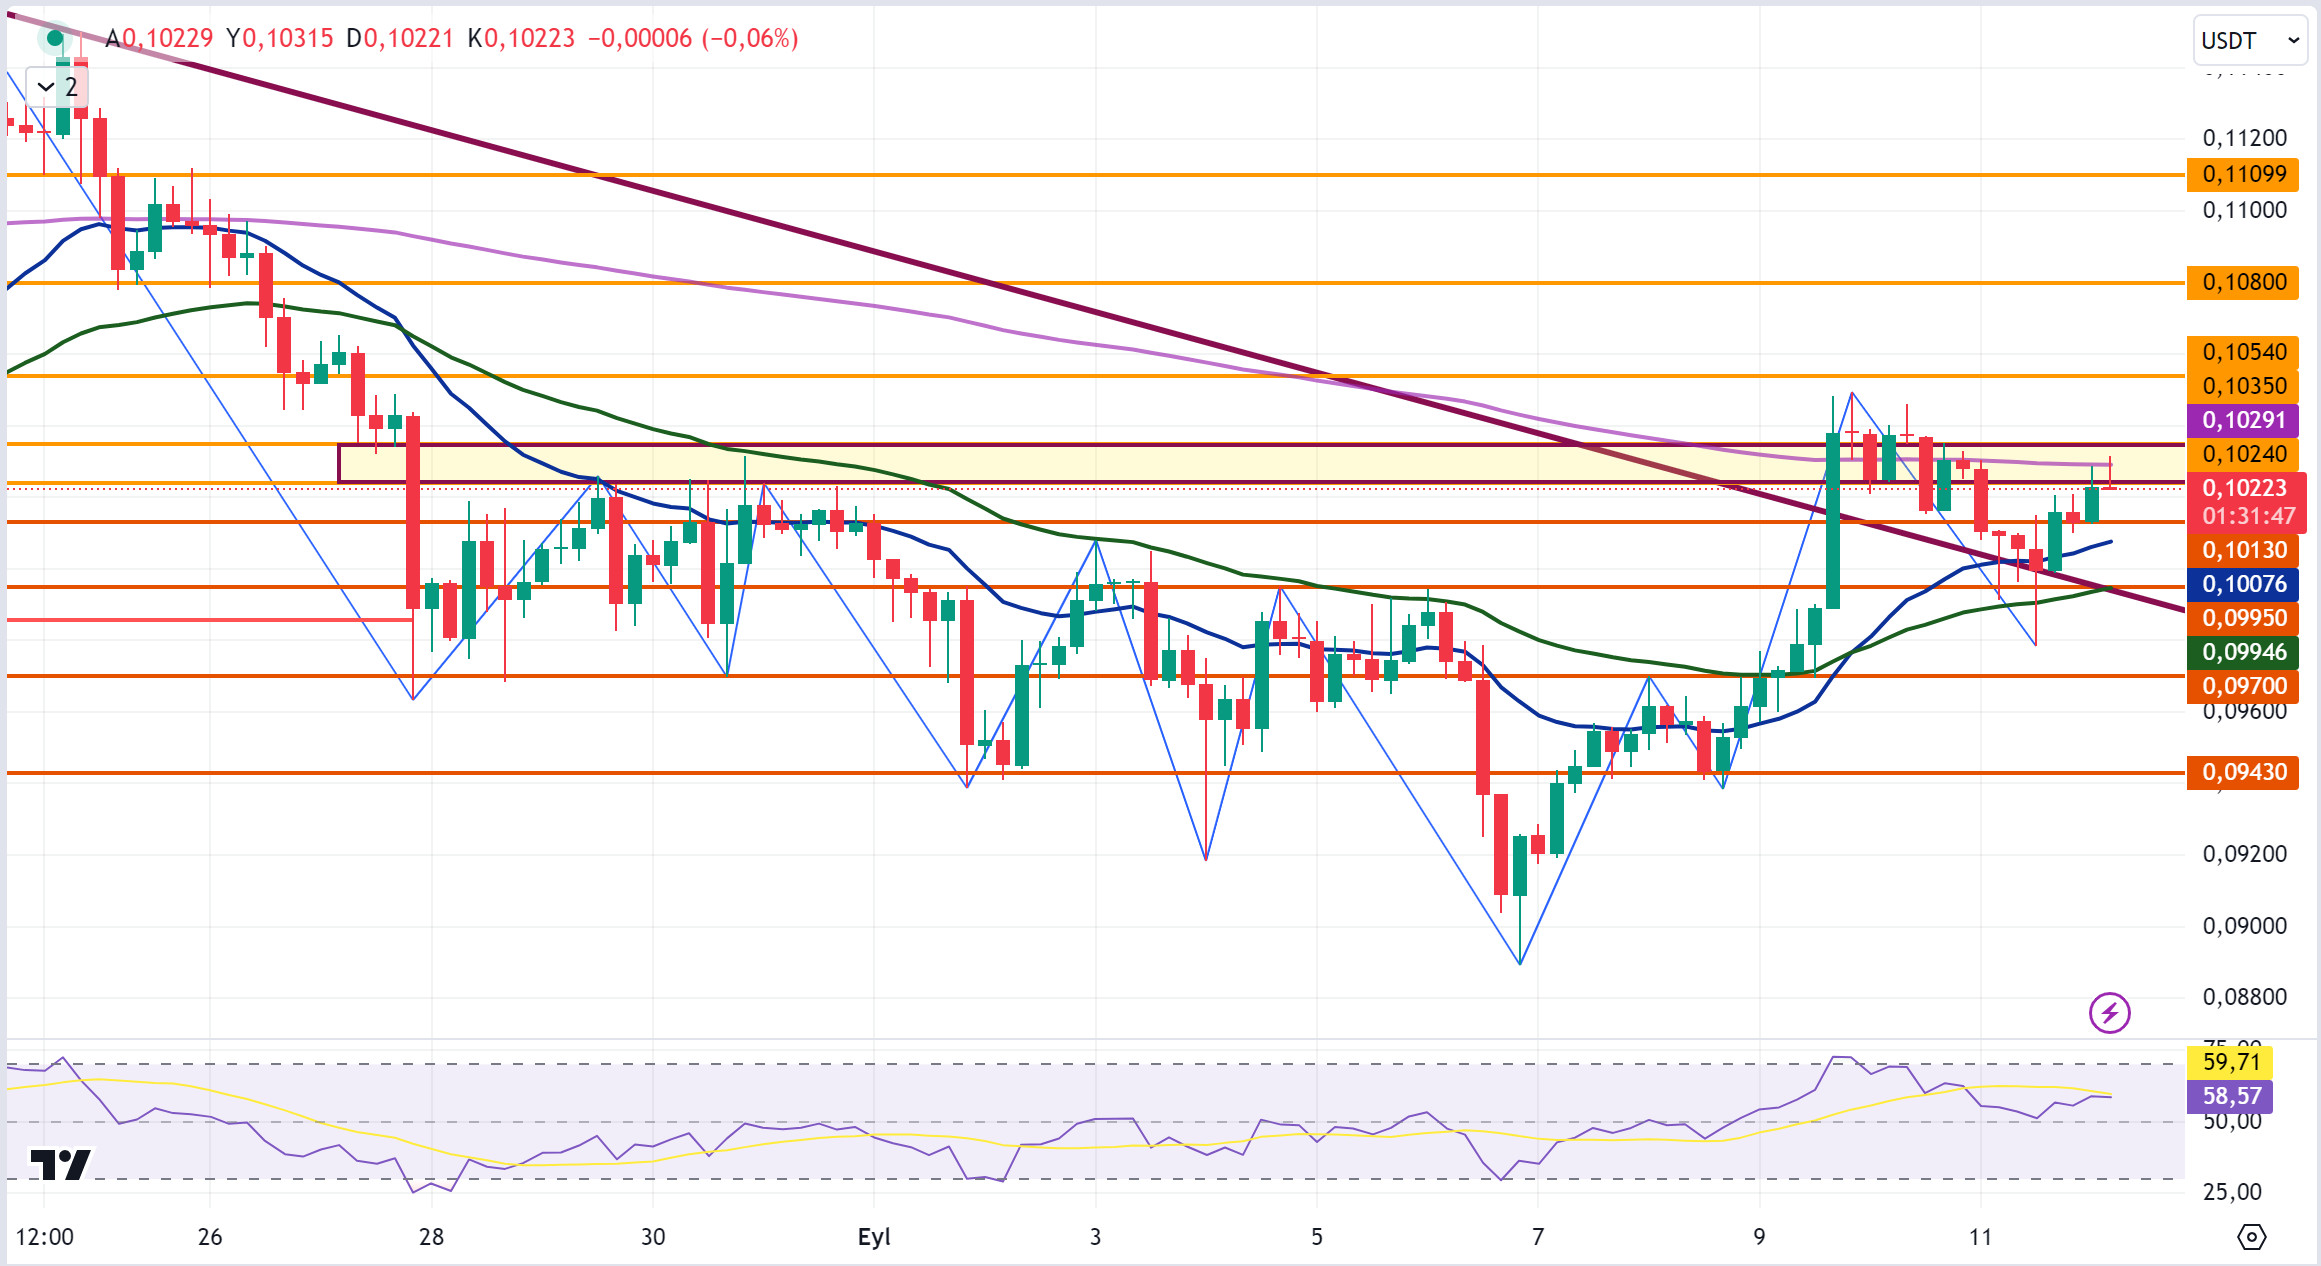
DOGE, which started today at 0.1012, is currently trading at 0.1022 with a 1% increase in value. When we examine the 4-hour analysis, DOGE, which tested the EMA200 (Purple Color) level yesterday and fell after failing to break the EMA200 (Purple Color) level, tested the EMA200 (Purple Color) level on the opening candle and the last candle in the 4-hour analysis today, but failed to break it and fell. If DOGE continues its rise and retests and breaks the EMA200 level, it may test the resistance levels of 0.1035-0.1054-0.1080 with the continuation of the rise. If the EMA200 level cannot be broken and reaction sales come, DOGE may test 0.1013-0.0995-0.0970 support levels with a decline.
DOGE may offer long trading opportunities if it breaks the EMA200 level in its uptrend and short trading opportunities if it fails to break the EMA200 level and turns bearish.
Supports 0.1013 – 0.0995 – 0.0970
Resistances 0.1035 – 0.1 054 – 0.1080
DOT/USDT
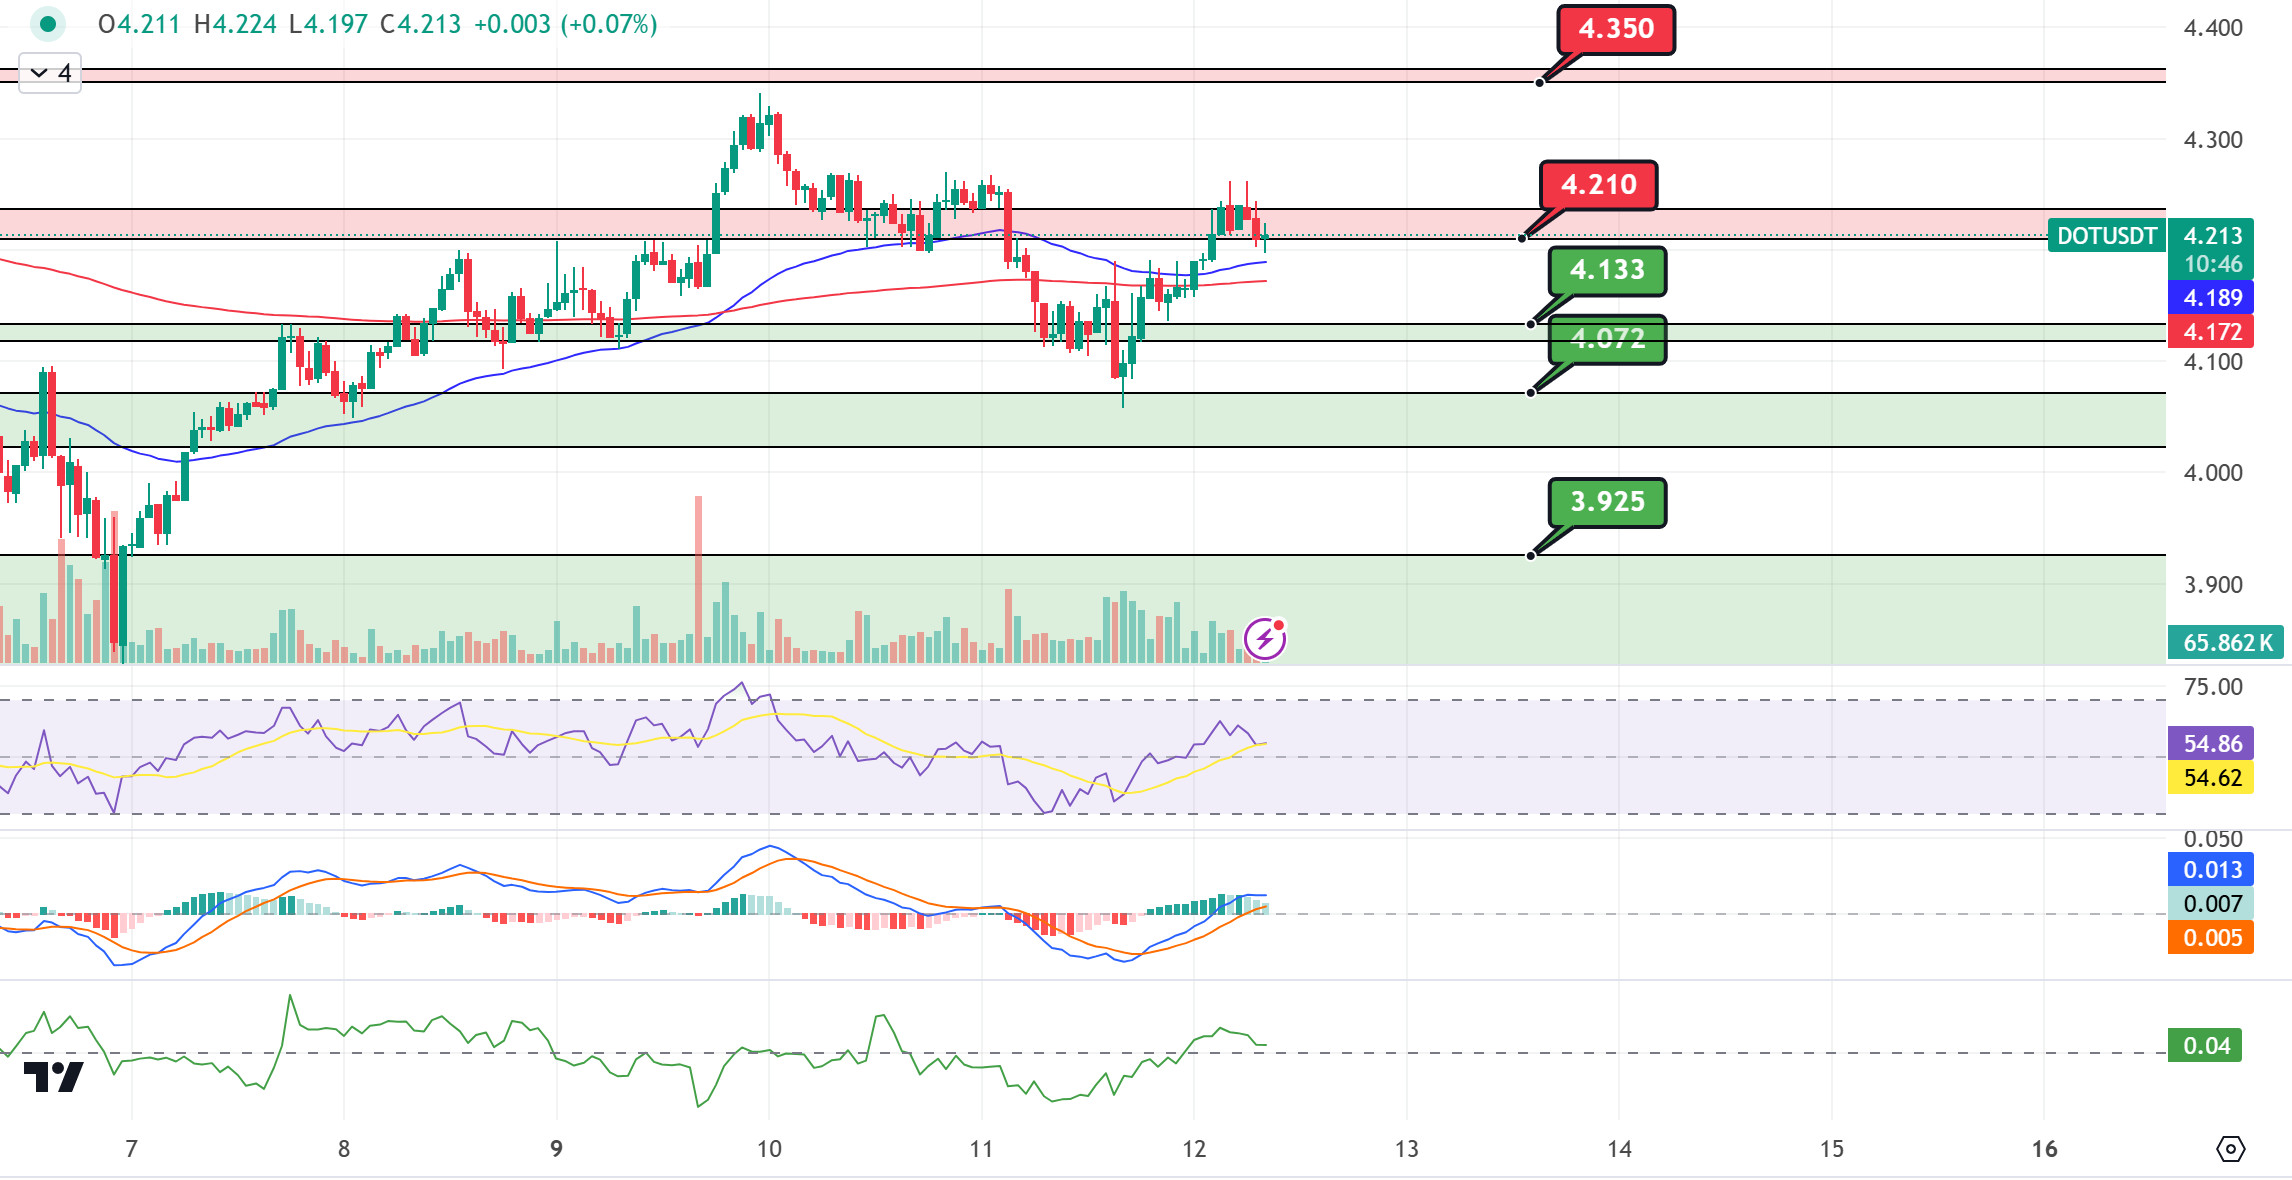
On the Polkadot (DOT) chart, the price lost the support at 4,210 and retreated to the support level of 4,072. With the reaction from the 4.072 level, the price rose to the 4.210 resistance but could not break the selling pressure at this level. When we analyze the MACD oscillator, we can say that the buying pressure has decreased compared to the previous hour. The price may retreat to the EMA50 level in a negative scenario. If the price stays below the EMA50 level, its next target could be 4.133 levels. In the positive scenario, if the price breaks the selling pressure at the 4,350 resistance level and provides persistence above the 4,350 band, the next target may be the 4,454 resistance level.
(Blue line: EMA50, Red line: EMA200)
Supports 4,210 – 4,133 – 4,072
Resistances 4.350 – 4.454 – 4.570
SHIB/USDT
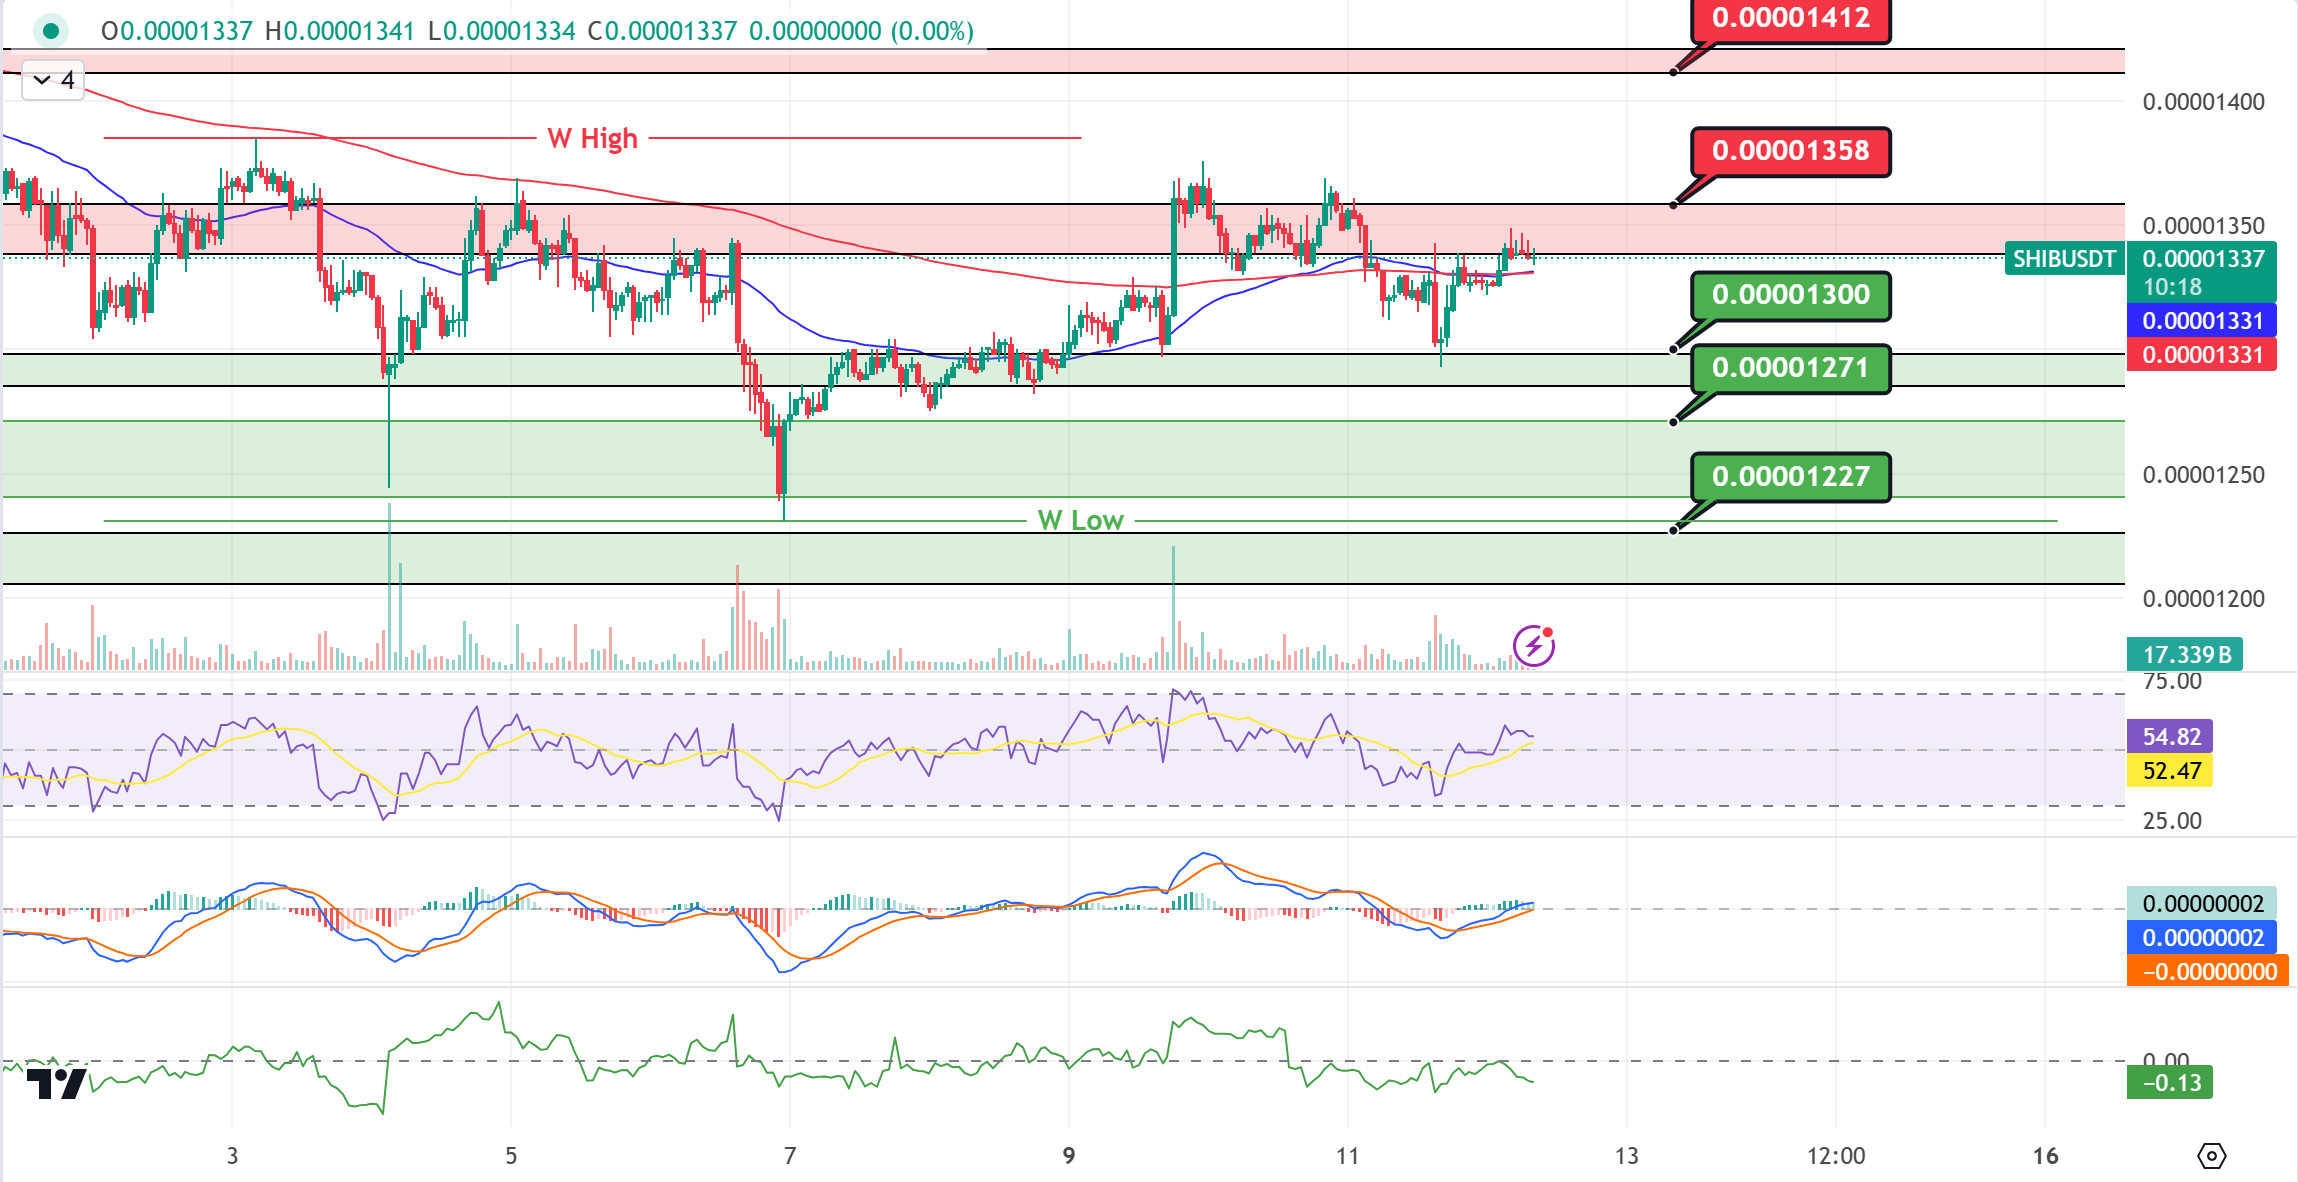
Shiba Inu (SHIB) retreated to 0.00001300 support with increasing selling pressure and seems to have risen to 0.00001358 resistance level with the reaction it received from here. The price is correcting in the 0.00001358 band with increasing selling pressure. When we examine the MACD oscillator, we see that the buyer pressure is decreasing. In the negative scenario, the price may retreat to the EMA50 level. If the price persists below the EMA50, it may want to retest the support level of 0.00001300. In the positive scenario, if the price stays above the EMA50, it may want to break the selling pressure at 0.00001358.
(Blue line: EMA50, Red line: EMA200)
Supports 0.00001300 – 0.00001271 – 0.00001227
Resistances 0.00001358 – 0.00001412 – 0.0000144
LEGAL NOTICE
The investment information, comments and recommendations contained herein do not constitute investment advice. Investment advisory services are provided individually by authorized institutions taking into account the risk and return preferences of individuals. The comments and recommendations contained herein are of a general nature. These recommendations may not be suitable for your financial situation and risk and return preferences. Therefore, making an investment decision based solely on the information contained herein may not produce results in line with your expectations.


