
MARKET SUMMARY
Latest Situation in Crypto Assets
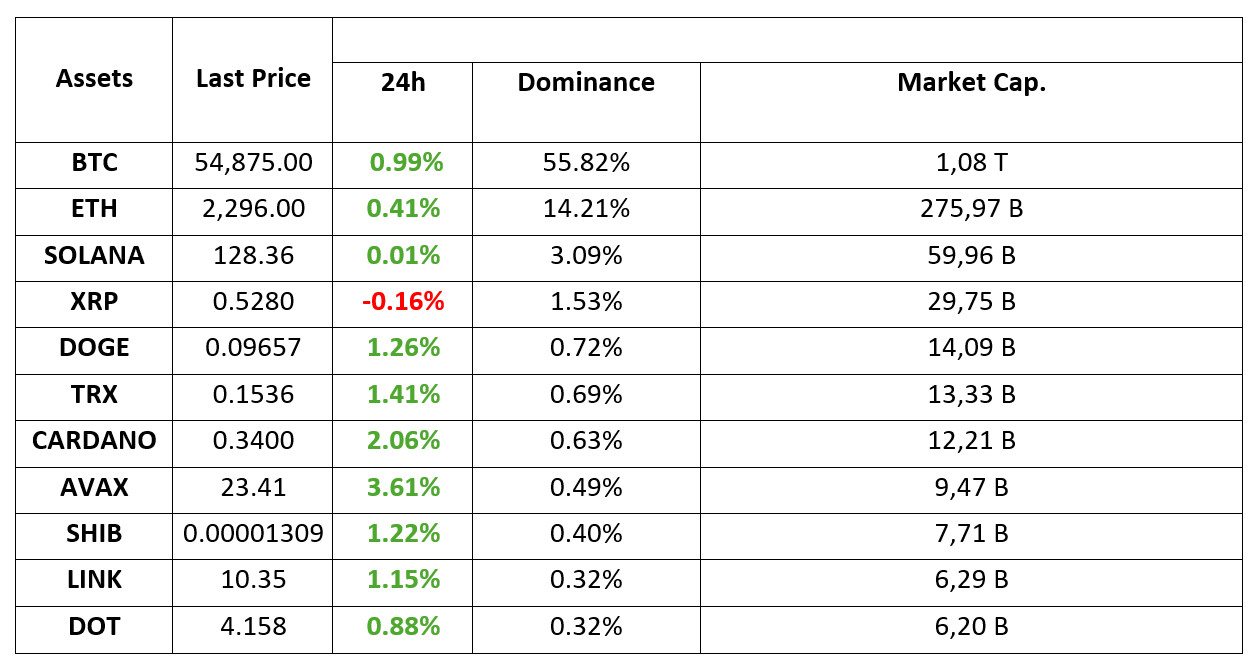
*Prepared on 9.09.2024 at 07:00 (UTC)
WHAT’S LEFT BEHIND
JPMorgan: Crypto Market Lacks Major Near-Term Catalysts
JPMorgan (JPM) said in a research report published today that the crypto market has fallen 24% from the peak levels recorded in March to a value of $ 2.02 trillion. The bank emphasized that the only chance for the market to recover is an important catalyst. Analysts led by Kenneth Worthington said in the report, “Overall, we continue to see that the crypto ecosystem lacks major catalysts. Therefore, we expect crypto token and asset prices to gradually become more sensitive to macro factors.”
Philadelphia Fed’s crypto report reveals contradiction in the market
The Philadelphia branch of the Fed published a study on whether changes in cryptocurrency prices affect the ownership rate. The study concluded that the ownership rate decreased significantly when prices fell, but did not increase at the same rate when prices rose.
Hayes, who warned $50,000 for Bitcoin, closes short position
BitMEX founder Arthur Hayes, who recently warned that Bitcoin could fall below $50,000, announced that he closed his short position.
USDT Company Tether Announces an Extraordinary Acquisition!
Tether, the issuer of the stablecoin USDT, acquired a 9.8% stake in Latin America’s agricultural powerhouse Adecoagro for $100 million.
HIGHLIGHTS OF THE DAY
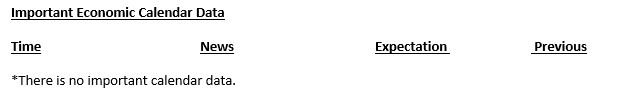
INFORMATION
*The calendar is based on UTC (Coordinated Universal Time) time zone. The economic calendar content on the relevant page is obtained from reliable news and data providers. The news in the economic calendar content, the date and time of the announcement of the news, possible changes in the previous, expectations and announced figures are made by the data provider institutions. Darkex cannot be held responsible for possible changes that may arise from similar situations.
MARKET COMPASS
After the US employment data released on Friday, we saw that the country’s stock markets ended the day and the week with losses. This morning, after China’s inflation and Japan’s economic growth figures, Asian indices are also on a downward trend. On the other hand, European investors are not expected to have a bad start. After the recent losses, futures contracts in the old continent are pointing to some reaction bullishness. US futures are also slightly positive.
The main agenda item for the markets continues to be the health of the US economy and expectations regarding the monetary policy change by the Federal Reserve (FED). This week will see the release of US inflation data, which will give investors an indication as to the size of the rate cut ahead of the Fed’s Federal Open Market Committee (FOMC) meeting on September 18. Although there are differing views on the Fed’s rate cut decision, according to CME FedWatch, a 25 bps rate cut is priced at 73% probability.
Digital assets, which have been bleeding due to the recent recession in the markets and the resulting decline in risk appetite, did not have a good weekend. On Sunday, however, we saw some reaction to the recent declines. Although the mood in Asian markets is not very positive, as the European and US futures contracts indicate, if the markets can start the new week with a reaction in these regions, we can watch the continuation of the recovery in crypto assets, albeit weak. Nevertheless, it is necessary to carefully monitor how the risk appetite will evolve during the day.
TECHNICAL ANALYSIS
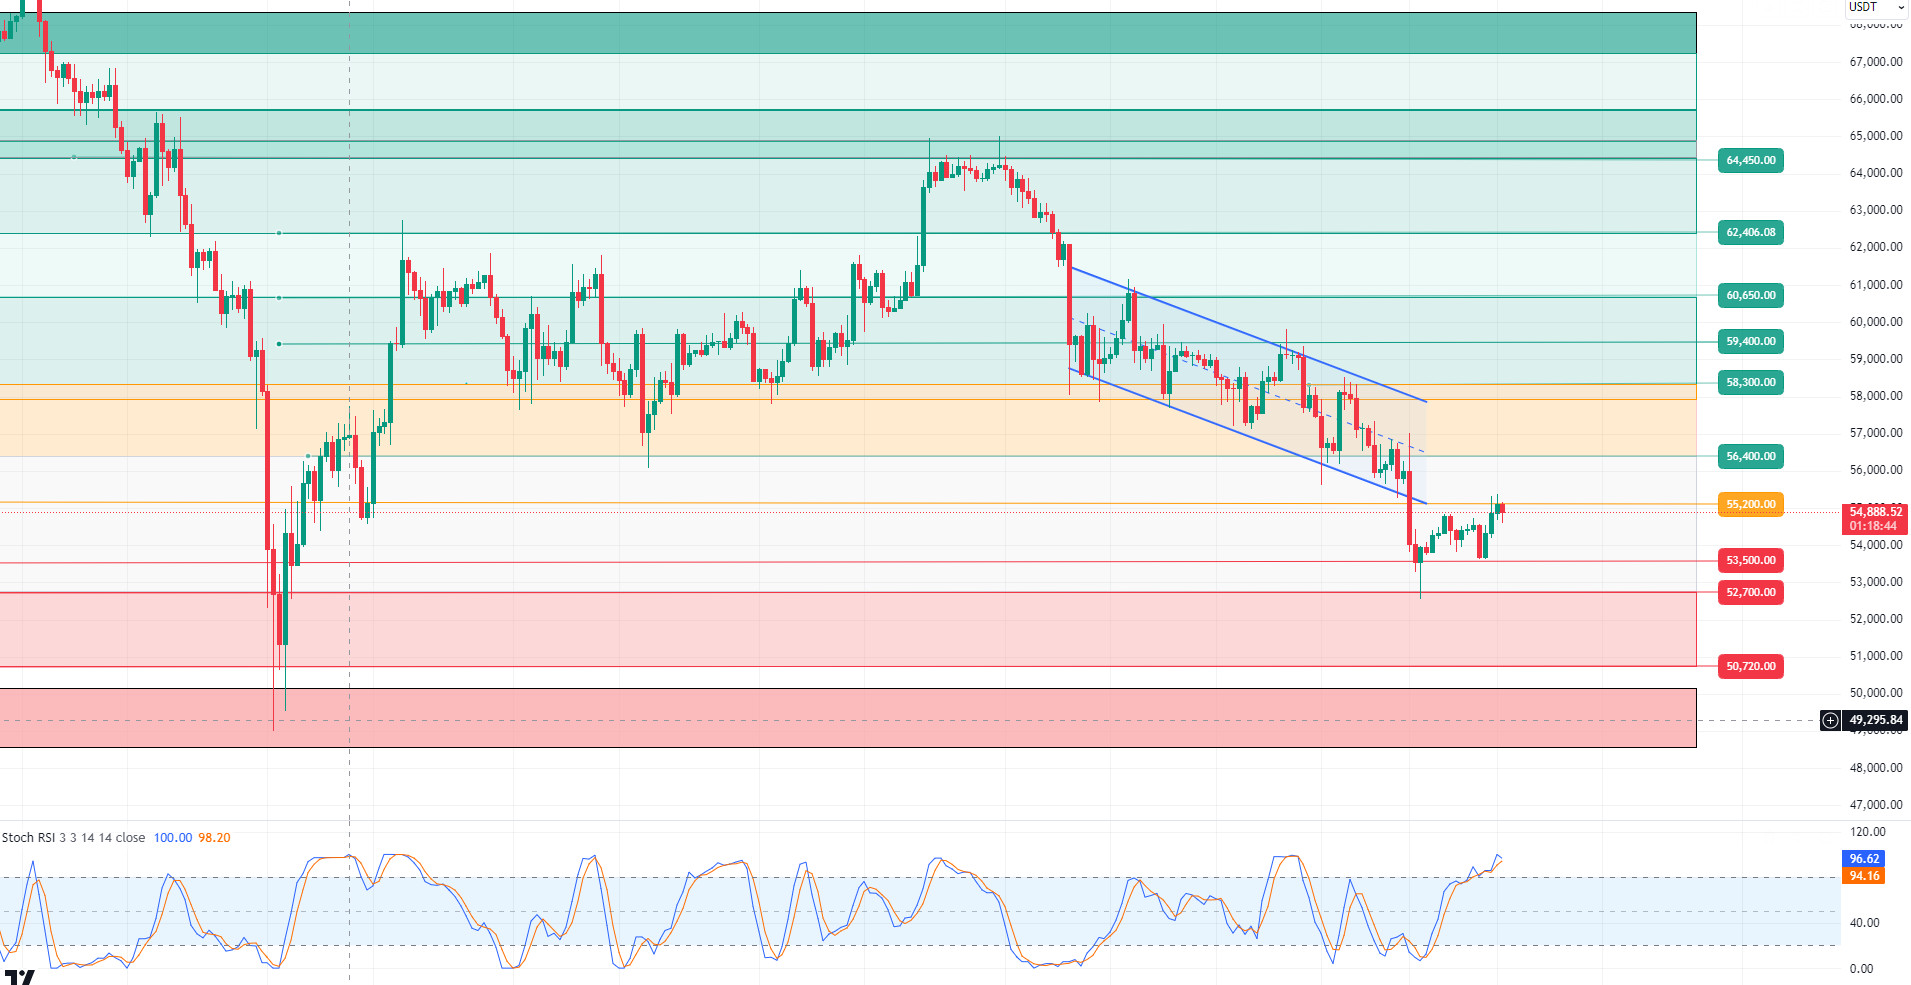
BTC/USDT
Bitcoin retreat! Before the September 18 FED interest rate meeting, although the employment data and unemployment figures from the US pointed to an interest rate cut, we saw that the data did not correspond to the price of the data with the retreat in Bitcoin. This week, PPI and RPI data, which are among the macroeconomic data to be announced by the US, are the data that we will follow carefully. As we approach the last week for the critical interest rate cut cycle, volatility may increase in Bitcoin and cryptocurrencies. In the BTC 4-hour technical analysis, the price, which broke the downward trend structure in the downward direction, quickly crossed the area we call the “gap” zone and exceeded the 53,300 resistance point after needling 52,600 levels. Bitcoin, which is rapidly recovering, is currently trading at 54,900. If the resistance level of 55,200 is passed, this bearish movement may end. Otherwise, we can think that the selling pressure may continue and the market is moving under bear control. Our technical indicator RSI is in the overbought zone and the 53,300 level appears as a support point in case of a pullback.
Supports 53,500 – 52,700 – 50,720
Resistances 55,200 – 56,400 – 57,200
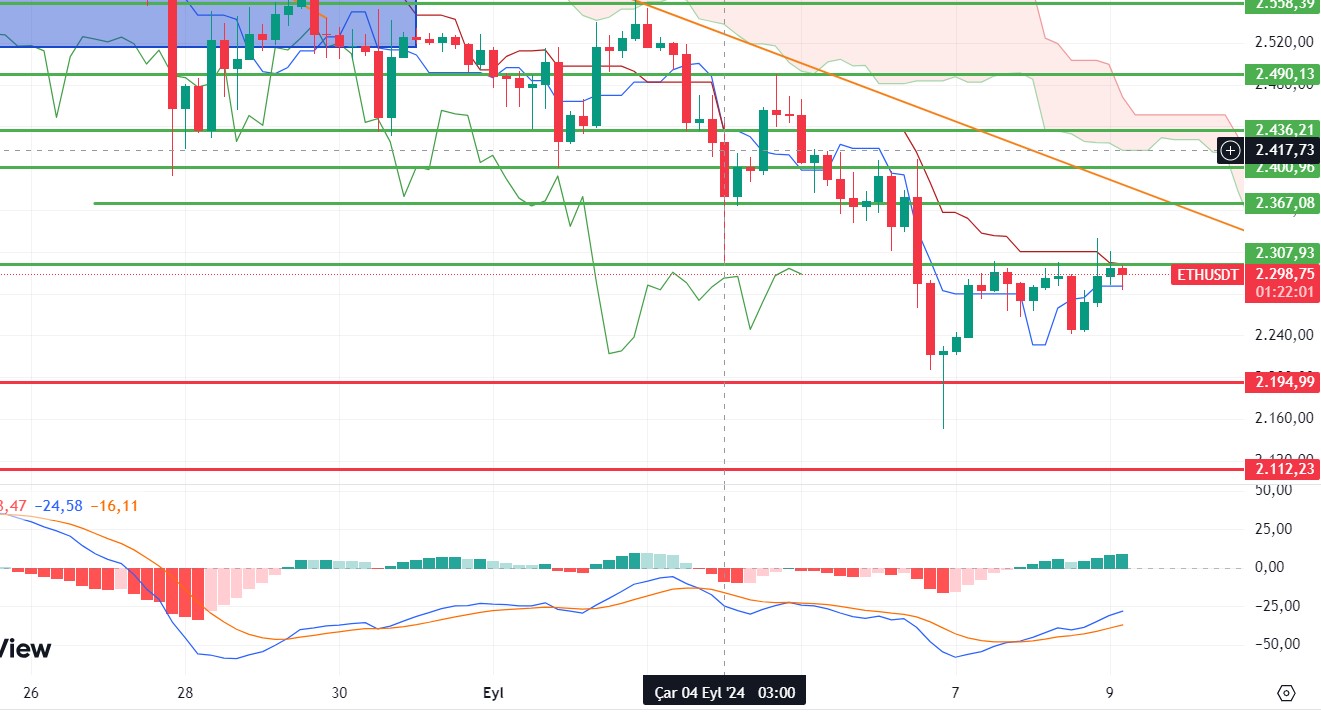
 ETH/USDT
Ethereum is trying to heal its wounds after the deep decline on Friday. In Ethereum, which struggled to exceed the 2,307 tenkan level, closes above this level seem positive, while below the 2,288 kijun support can be interpreted negatively. It is stuck in a narrow range. While Macd and Momentum are positive, CMF has a negative mismatch. In addition, the re-positivity of funding rates can also be perceived negatively. It seems important to be prepared for breakouts in Ethereum, which is quite uncertain for now.
Supports 2,288 – 2,194 – 2,112
Resistances 2,307 – 2,367 – 2,400
LINK/USDT
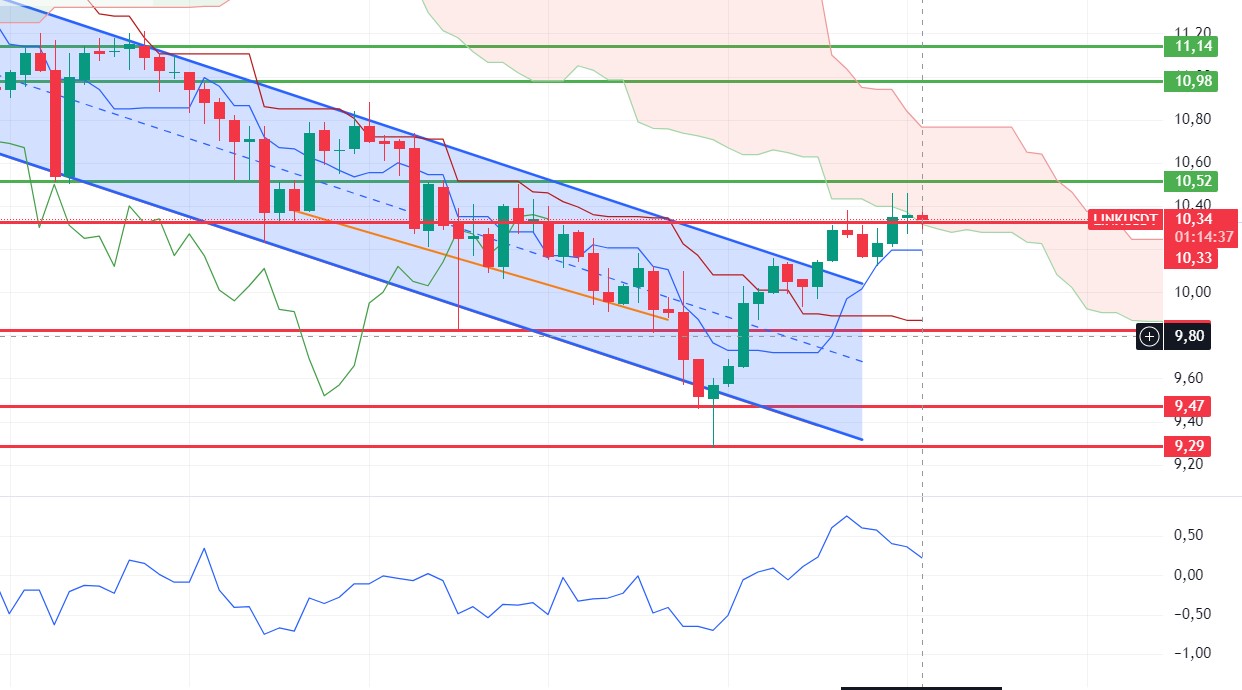
LINK looks very positive as it broke the falling channel, managed to re-enter the kumo cloud and regained the main resistance of 10.33. Although momentum looks negative, all other important indicators look positive. With the recovery of 10.52, it can be expected to gain a much more positive outlook. The loss of 10.33 may cause small retracements.
Supports 9.82 – 9.47 – 8.12
Resistances 10.35 – 10.52 – 10.98
SOL/USDT
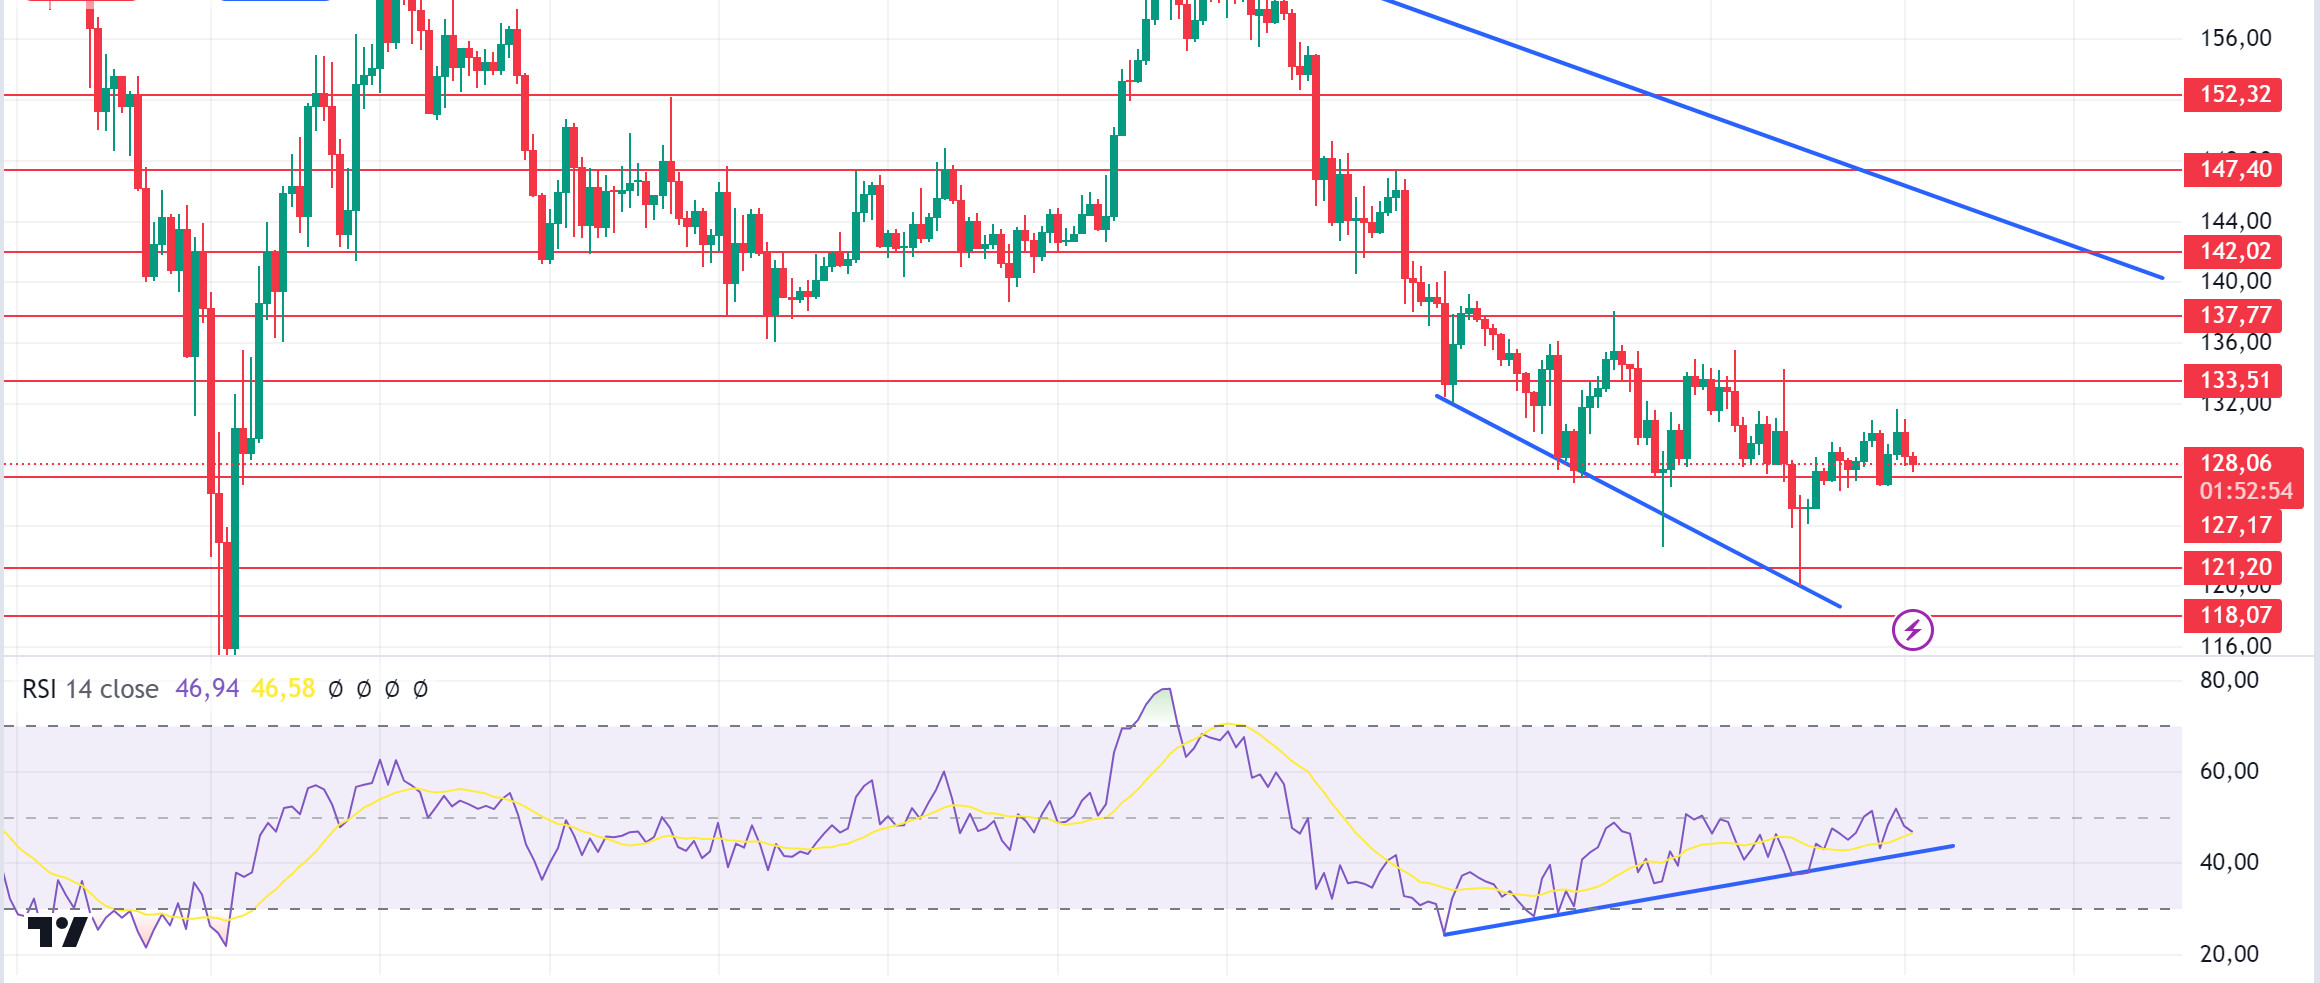
The risk of interest rate hikes in Japan continues. As such, the fluctuations seen in BTC have also affected Solana. This explains the lack of volume in the Solana ecosystem for a long time. When we examine it technically, SOL has been supported by the 121.20 – 118.07 band for a long time and has accumulated from these levels for a long time. When we compare the RSI and the price, we see that there is a bullish mismatch. SOL, which has been accumulating in a certain band since April, may test the resistance levels of 133.51 – 137.77 if the rises continue due to the increase in volumes. In the scenario where the uncertainty and lack of volume in the market continues, support levels of 127.17 – 121.20 should be followed.
Supports 127.17 – 121.20 – 118.07
Resistances 133.51 – 137.77 – 142.02
ADA/USDT
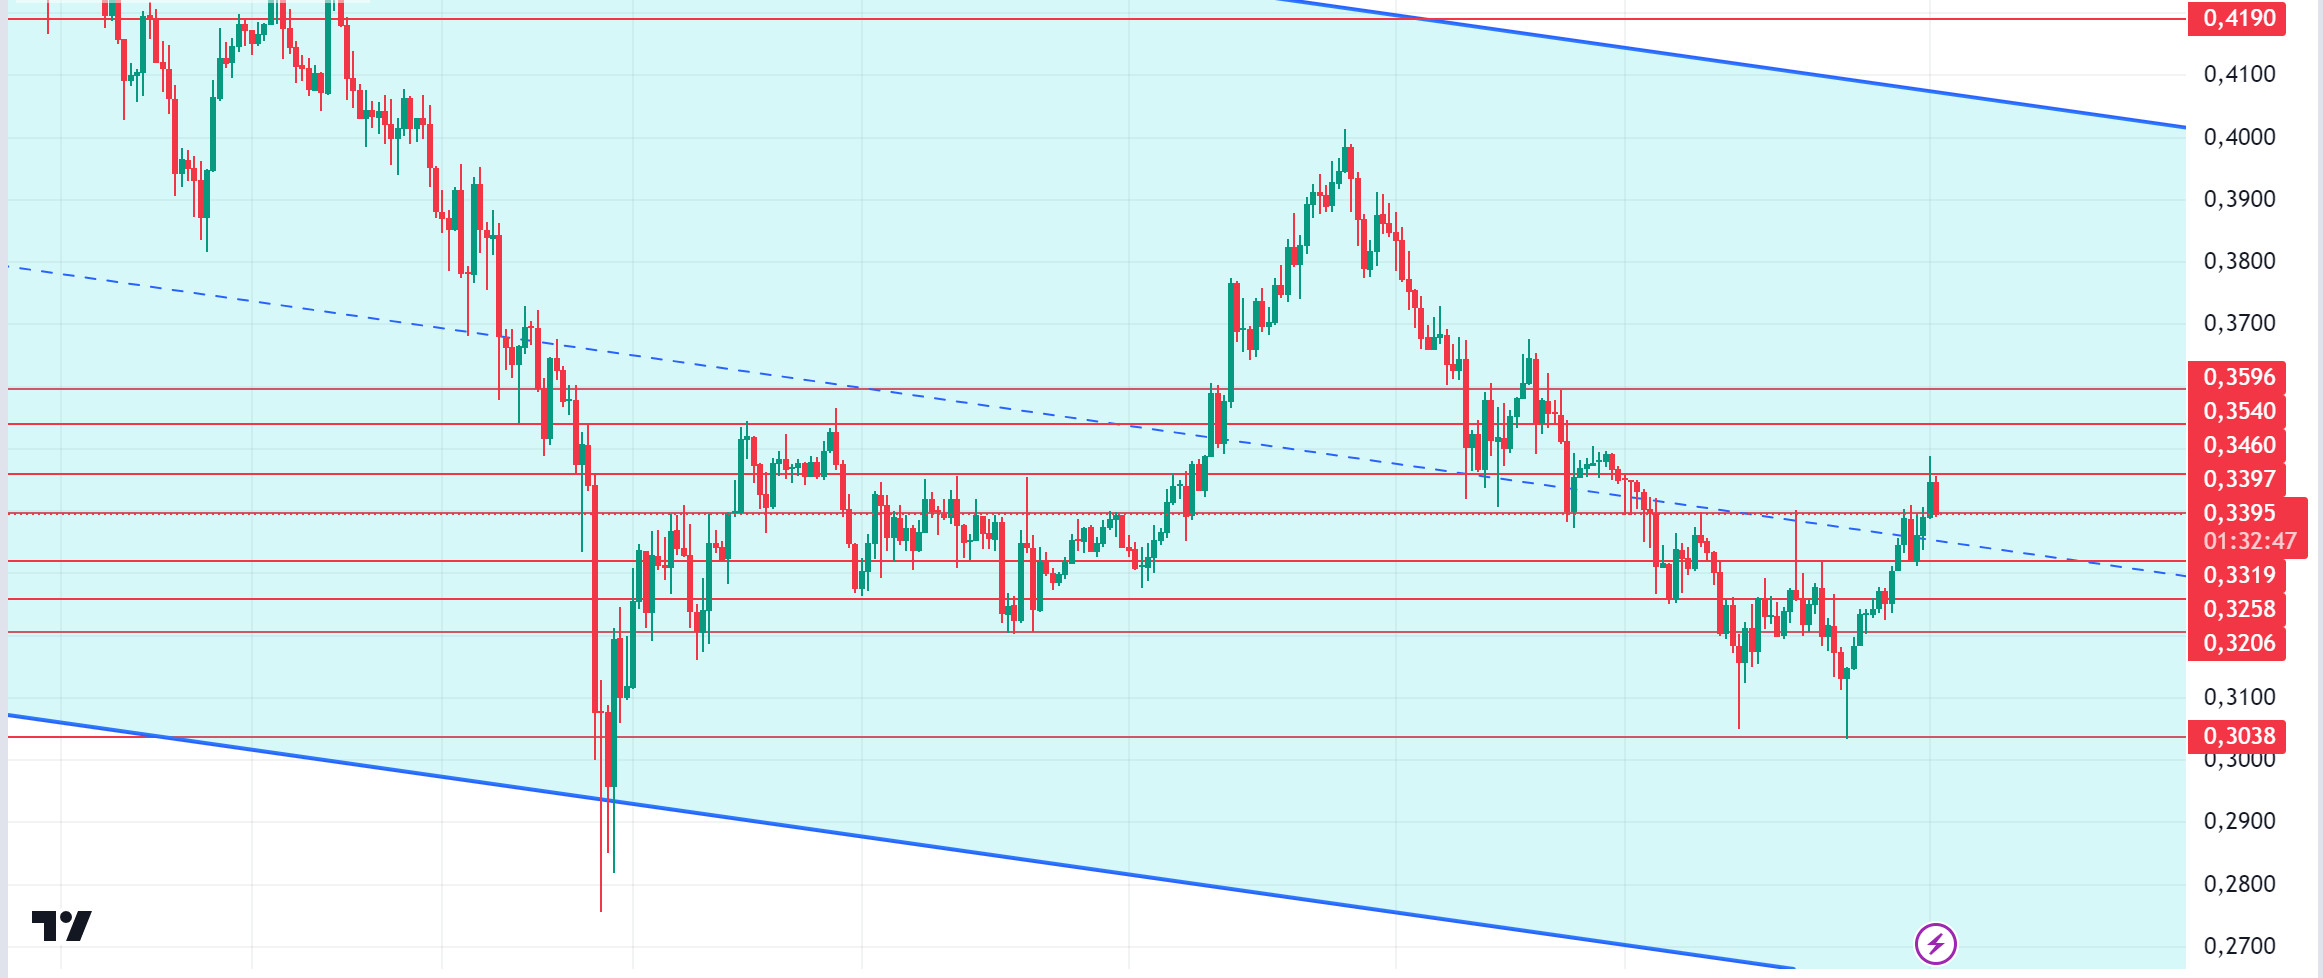
ADA continues to rise due to the update. Cardano’s daily active addresses show that it has reached its highest level in the last five months. According to data from Santiment, ADA’s daily active addresses rose above 52,000 last week. On the other hand, Cardano founder Hoskinson said, “We are currently in the bootstrapping phase. We will need to be careful about how we set up this fledgling governance. He emphasized that full governance capabilities will be enabled with the next hard fork, “Chang plus one”, which is planned to be held around December. “At that point, we will have full Cardano government,” Hoskinson explained. When we look at the chart of ADA, it is priced at the middle levels of the falling channel. The continued pricing of ADA, which made a double bottom at 0.3038, by investors experiencing a rise due to the innovations brought by the update, can bring the price to 0.3397 – 0.3596 levels. The support place to look for due to retracements is 0.3319 – 0.3258 levels can be followed.
Supports 0.3319 – 0.3258 – 0.3206
Resistances 0.3460 – 0.3540 – 0.3596
AVAX/USDT
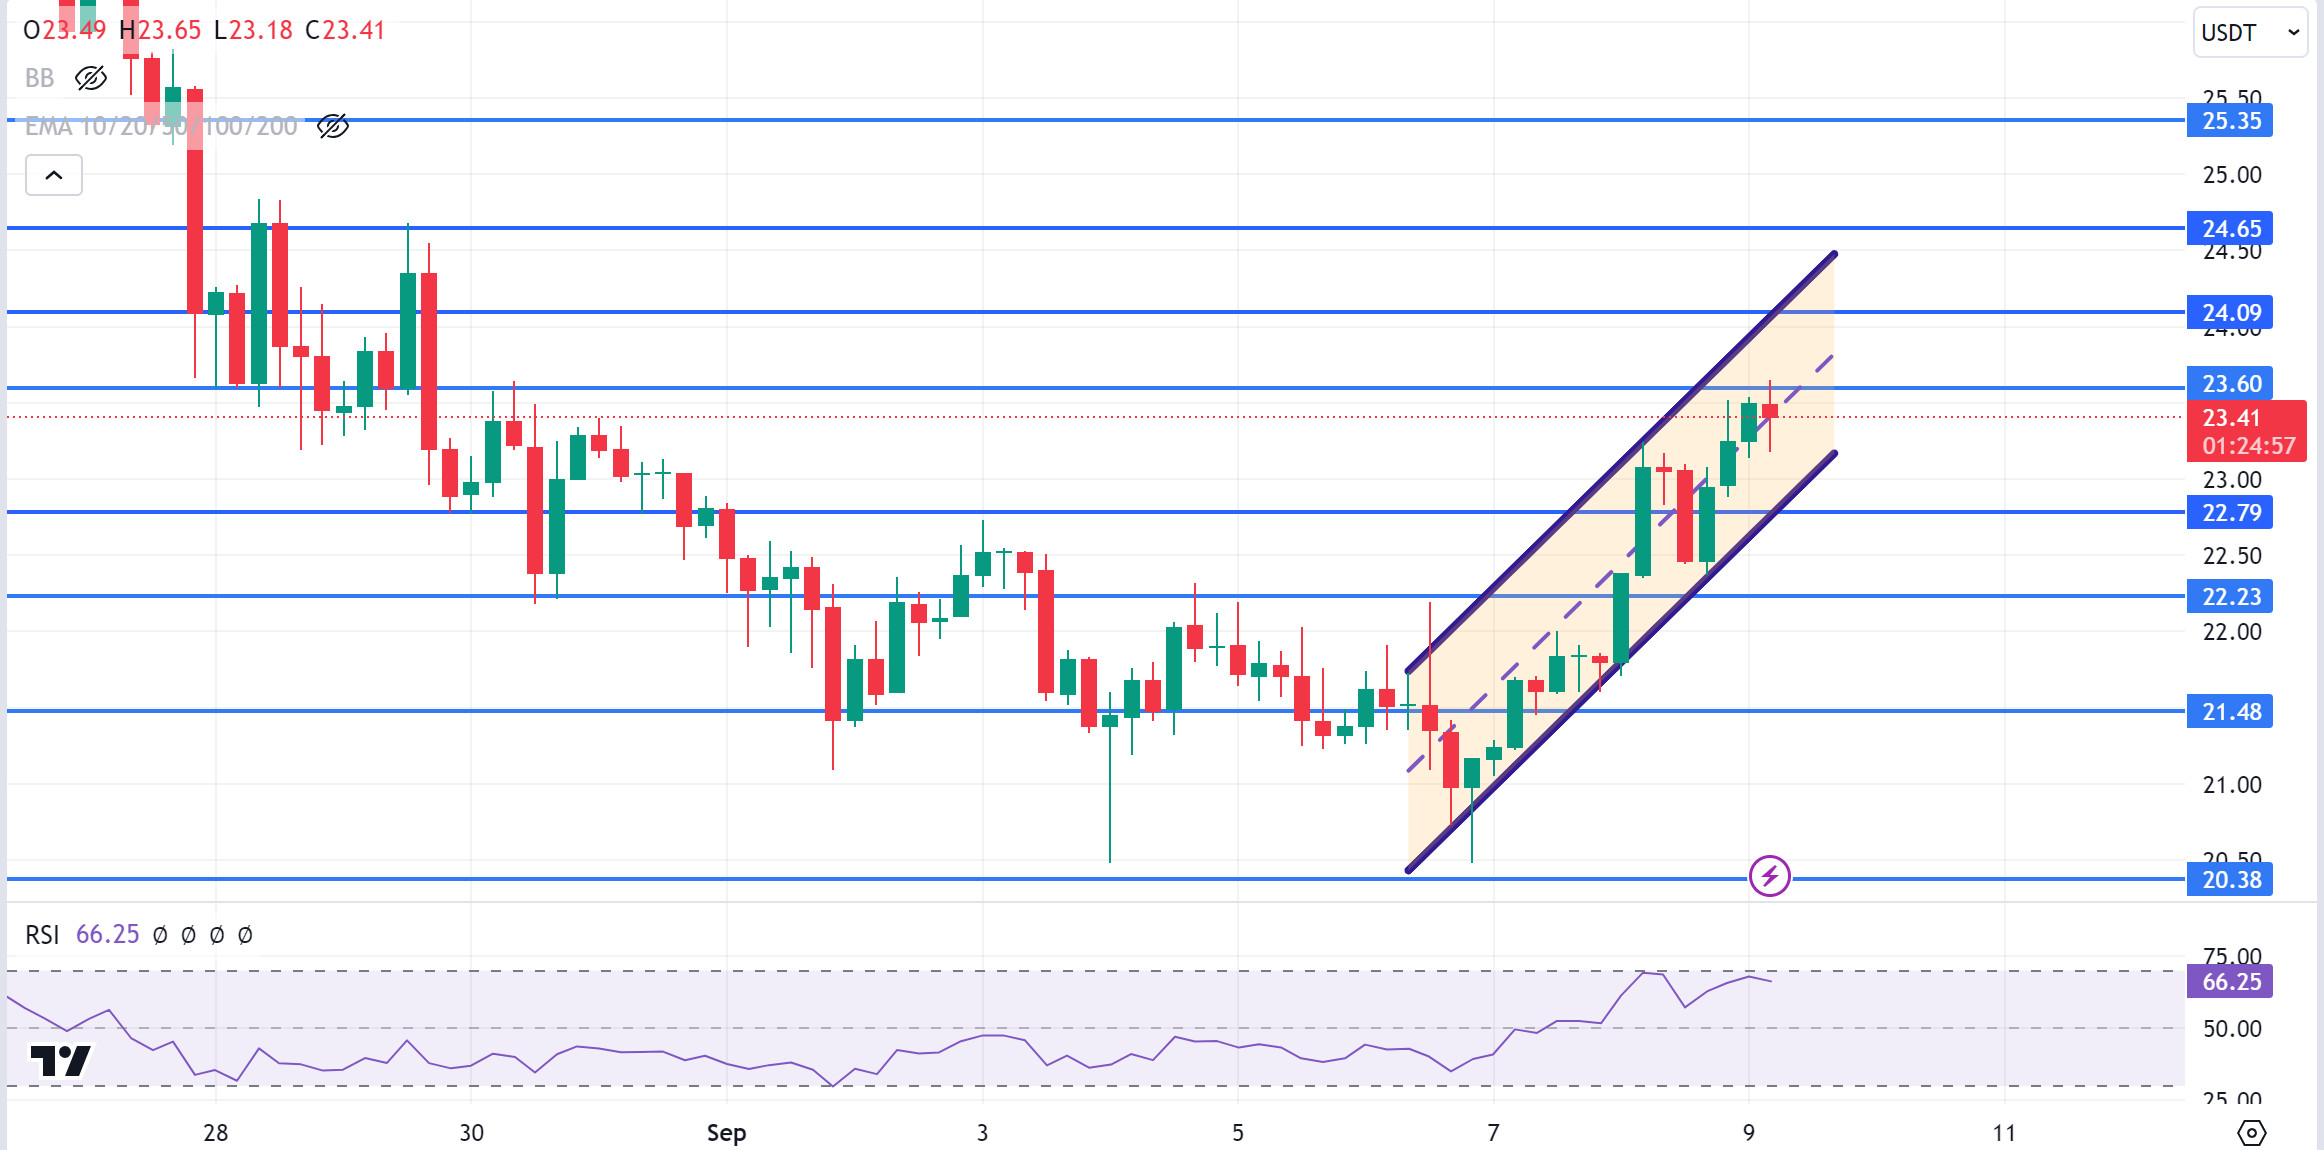
AVAX, which opened yesterday at 21.80, rose 6.5% during the day and closed at 23.25.
There will be no important data from the US today. This week, the markets are focused on the consumer price index data to be announced on Wednesday. AVAX is currently trading at 23.41 and continues its movement within the rising channel on the 4-hour chart. It is moving from the middle band to the lower band of the channel and may test the support of 22.79 during the day. If it closes the candle under this support, it may test 22.23 and 21.48 supports. If it rises with the reaction from 22.79 support, it may move towards the upper band of the channel. In such a case, it may test 23.60 and 24.09 resistances. As long as it stays above 20.38 support during the day, we can expect it to maintain its desire to rise. With the break of 20.38 support, sales may deepen.
Supports 22.79 – 22.23 – 21.48
Resistances 23.60 – 24.09 – 24.65
TRX/USDT
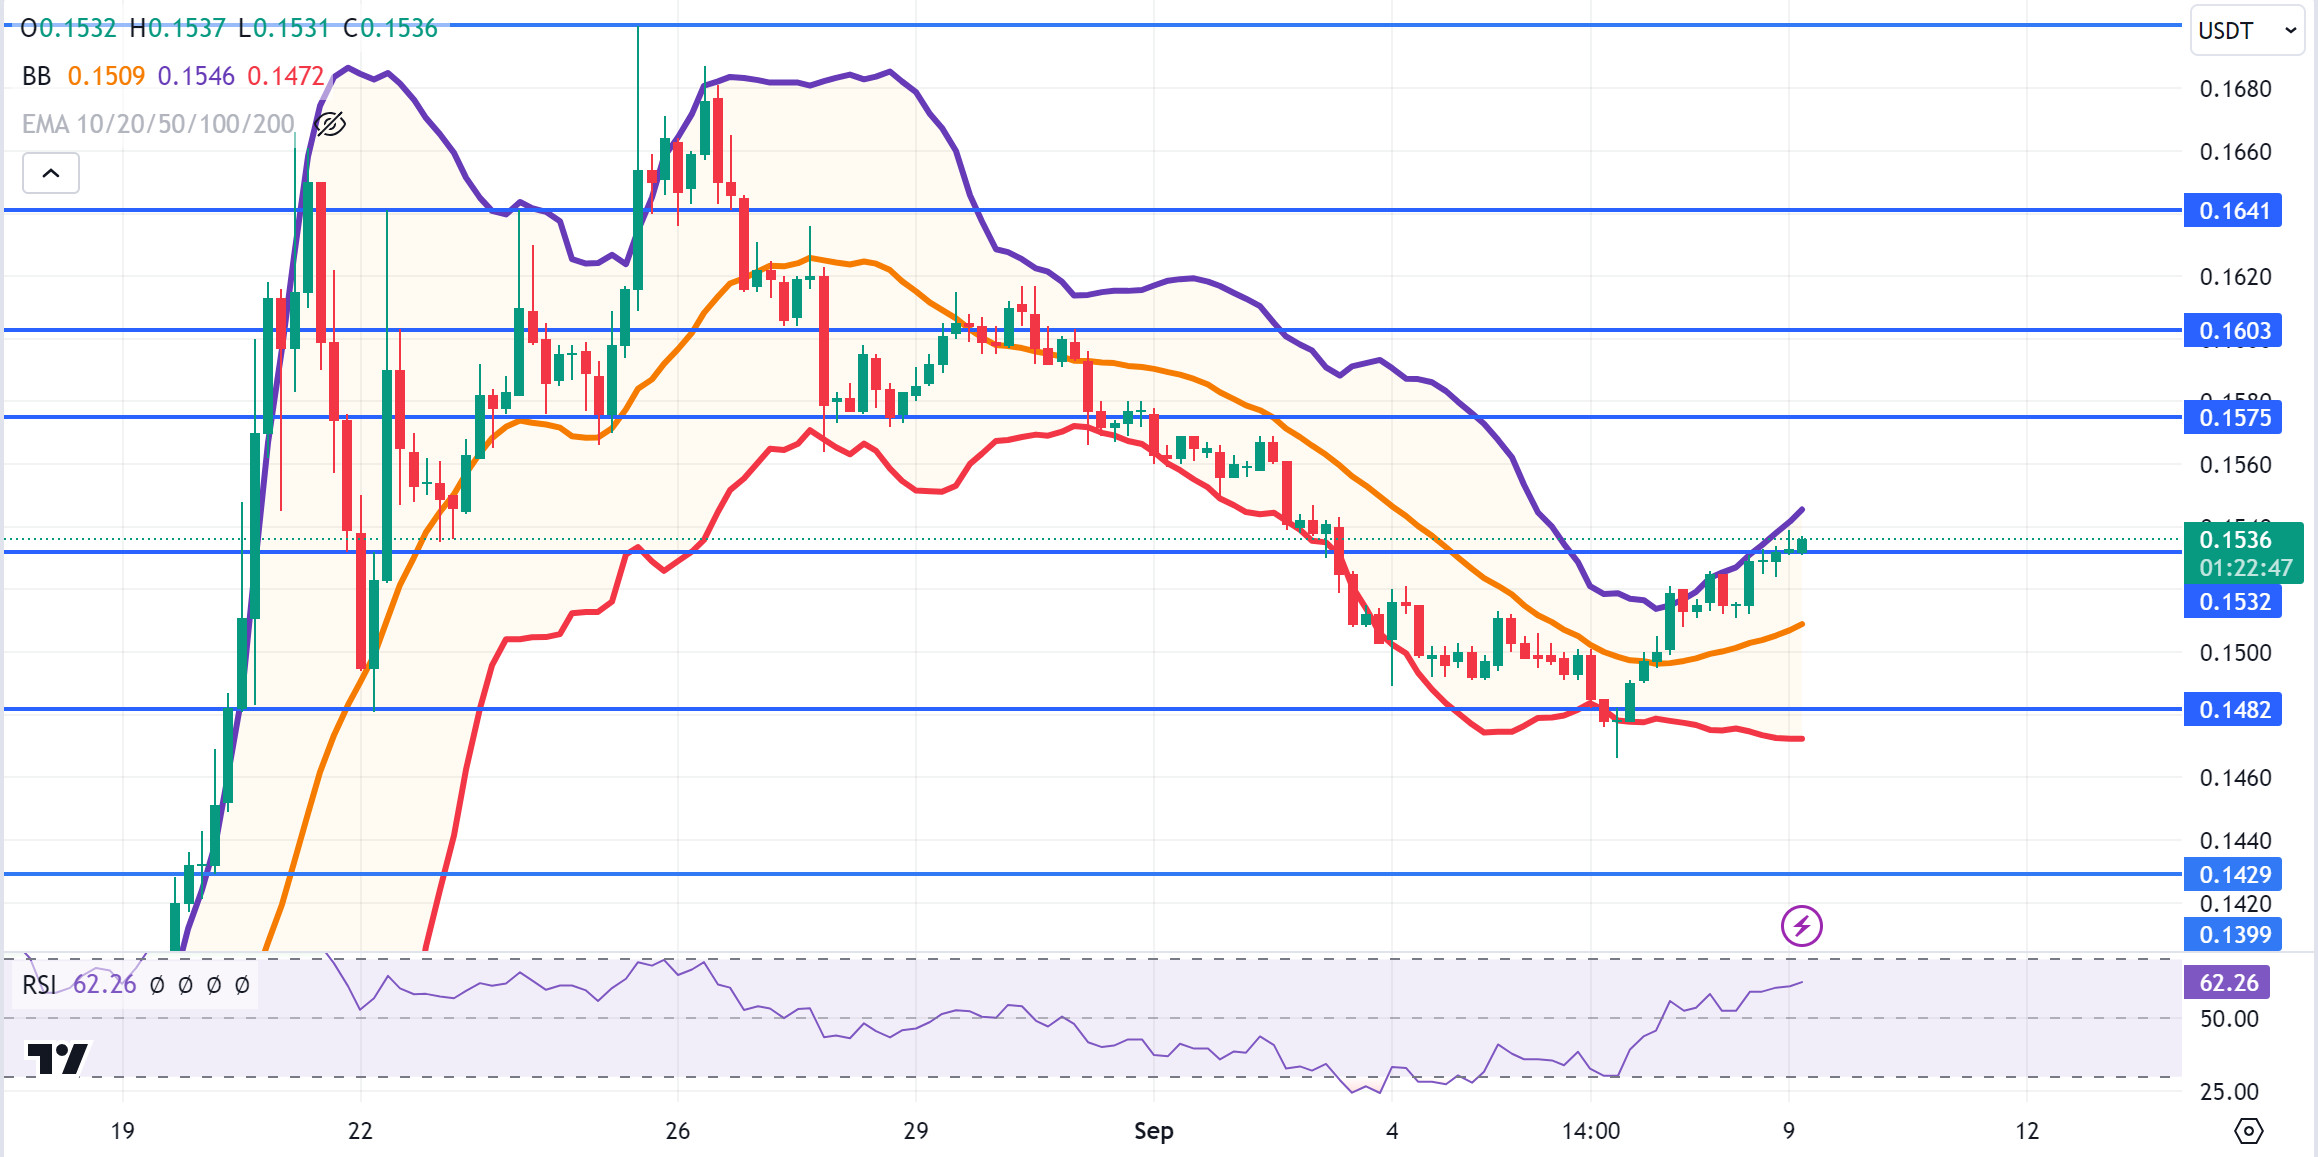
TRX, which started yesterday at 0.1516, rose 1% during the day and closed at 0.1532. As today is a quiet day in terms of planned data, we can expect volumes to remain low. Markets are waiting for the US CPI data to be announced this week. TRX, which is currently trading at 0.1536, is located at the Bollinger upper band on the 4-hour chart and the RSI value has approached the overbought zone with 62. Some further rise can be expected from this zone. In such a case, 0.1575 resistance may be tested. However, if there is a sales reaction from the upper Bollinger band, it may move towards the middle and lower band. In such a case, it may want to test the 0.1482 resistance. As long as TRX stays above 0.1482 support, it can be expected to continue its upward demand. If this support breaks down, selling pressure may increase.
Supports 0.1532 – 0.1482 – 0.1429
Resistances 0.1575 – 0.1603 – 0.1641
DOT/USDT
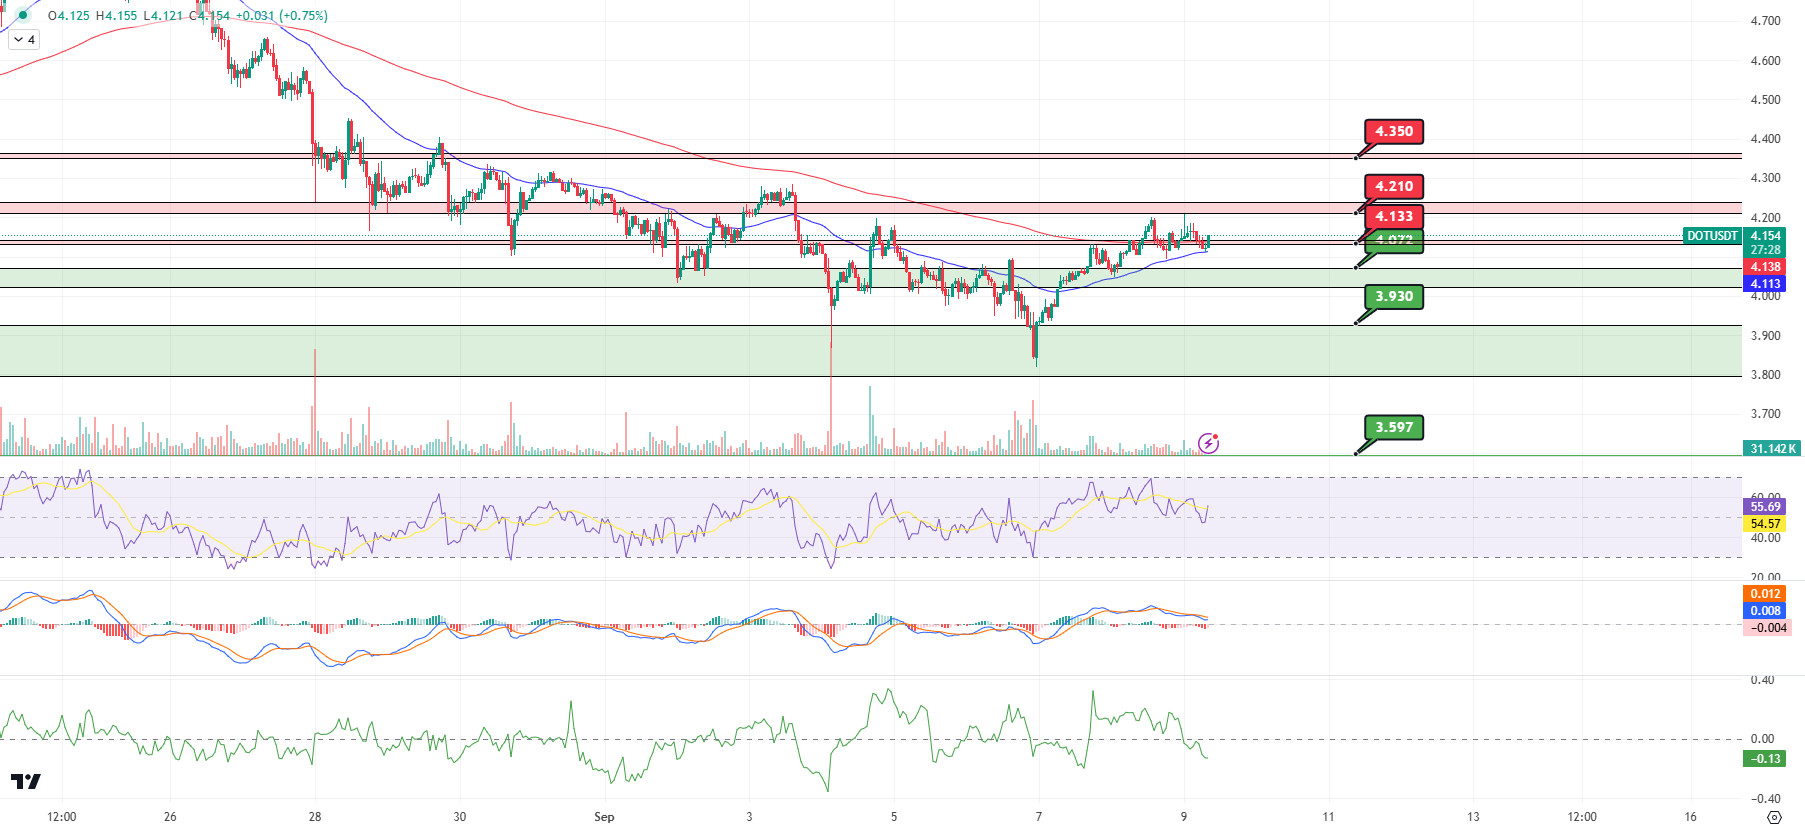
Polkadot (DOT) seems to have retreated to the 3.930 support band with the reaction it received from 4.072 resistance and rose to 4.210 levels with the reaction it received from here. At 4.210 resistance, DOT, which made its correction with the increase in selling pressure, is currently above the 4.133 band. When we examine the MACD, we see that the selling pressure has decreased compared to the previous hour. We can say that if the price is permanent above the 4.133 band, it may retest the 4.210 levels. On the other hand, when we examine the CMF (Chaikin Money Flow) indicator, we can say that sellers are more dominant. If the price breaks the 4.133 level downwards, the next support level may be the 4.072 band.
(Blue line: EMA50, Red line: EMA200)
Supports 4,072 – 3,930 – 3,597
Resistances 4.133 – 4.210 – 4.350
SHIB/USDT
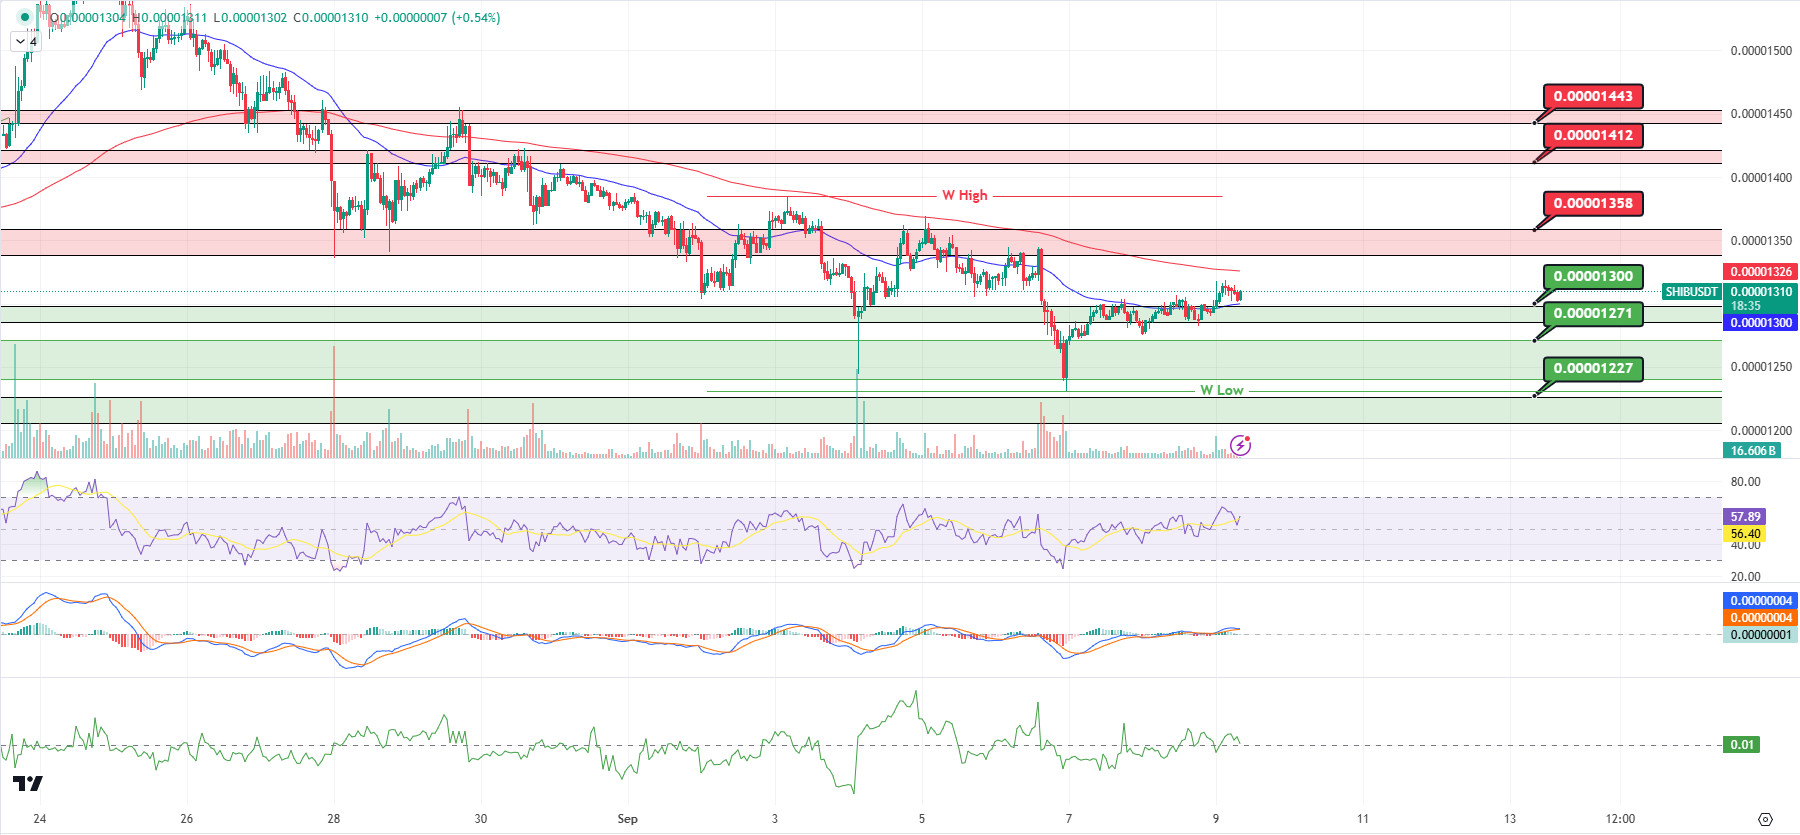
When we examine the Shina Inu (SHIB) chart, the price retreated to 0.00001227 bands with the reaction it received from the 0.00001358 resistance level and rose to 0.00001300 levels with the reaction it received from this level. When we analyze the CMF (Chaikin Money Flow) oscillator, buyers seem to be more dominant. Accordingly, if the price persists above the EMA50, the price may move towards the EMA200. On the other hand, when we analyze the MACD, we see that the buying pressure has decreased compared to the previous hour. In the negative scenario, if the price breaks below the EMA50, the price may retreat to 0.00001300 and 0.00001271 respectively.
(Blue line: EMA50, Red line: EMA200)
Supports 0.00001300 – 0.00001271 – 0.00001227
Resistances 0.00001358 – 0.00001412 – 0.00001443
LEGAL NOTICE
The investment information, comments and recommendations contained herein do not constitute investment advice. Investment advisory services are provided individually by authorized institutions taking into account the risk and return preferences of individuals. The comments and recommendations contained herein are of a general nature. These recommendations may not be suitable for your financial situation and risk and return preferences. Therefore, making an investment decision based solely on the information contained herein may not produce results in line with your expectations.
