MARKET SUMMARY
Latest Situation in Crypto Assets
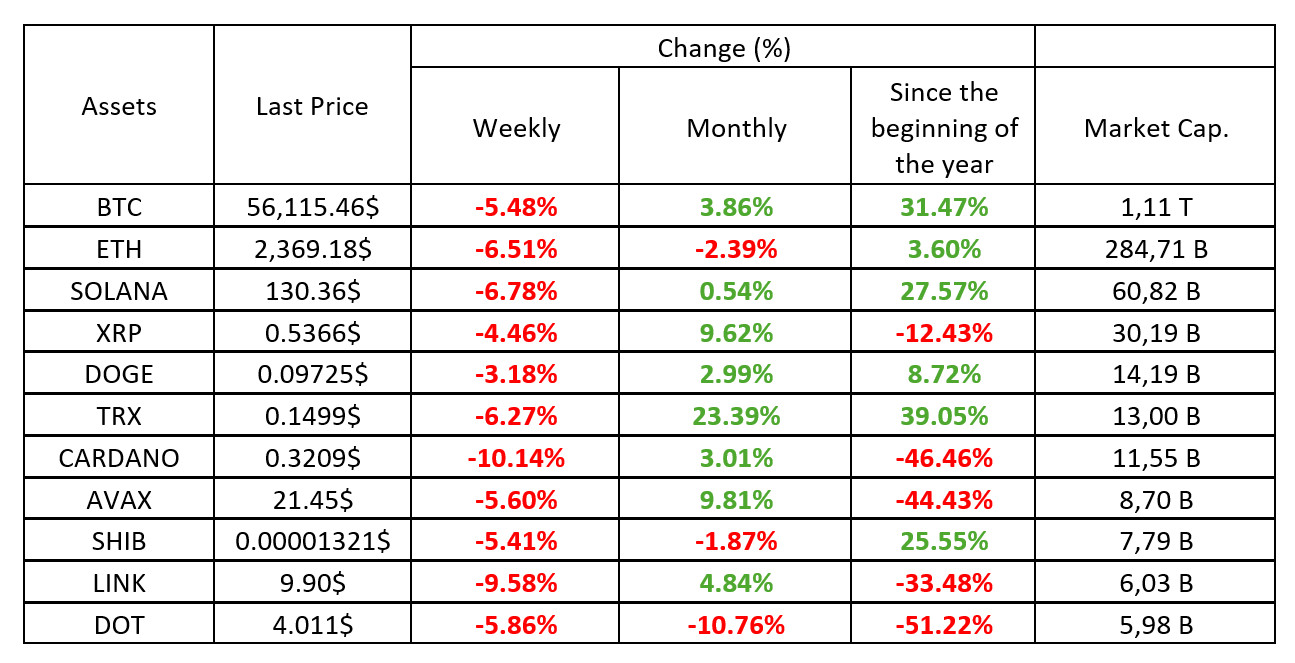
*Table was prepared on 30.08.2024 at 14:30 (UTC). Weekly values are calculated for 7 days based on Friday.
Fear & Greed Index
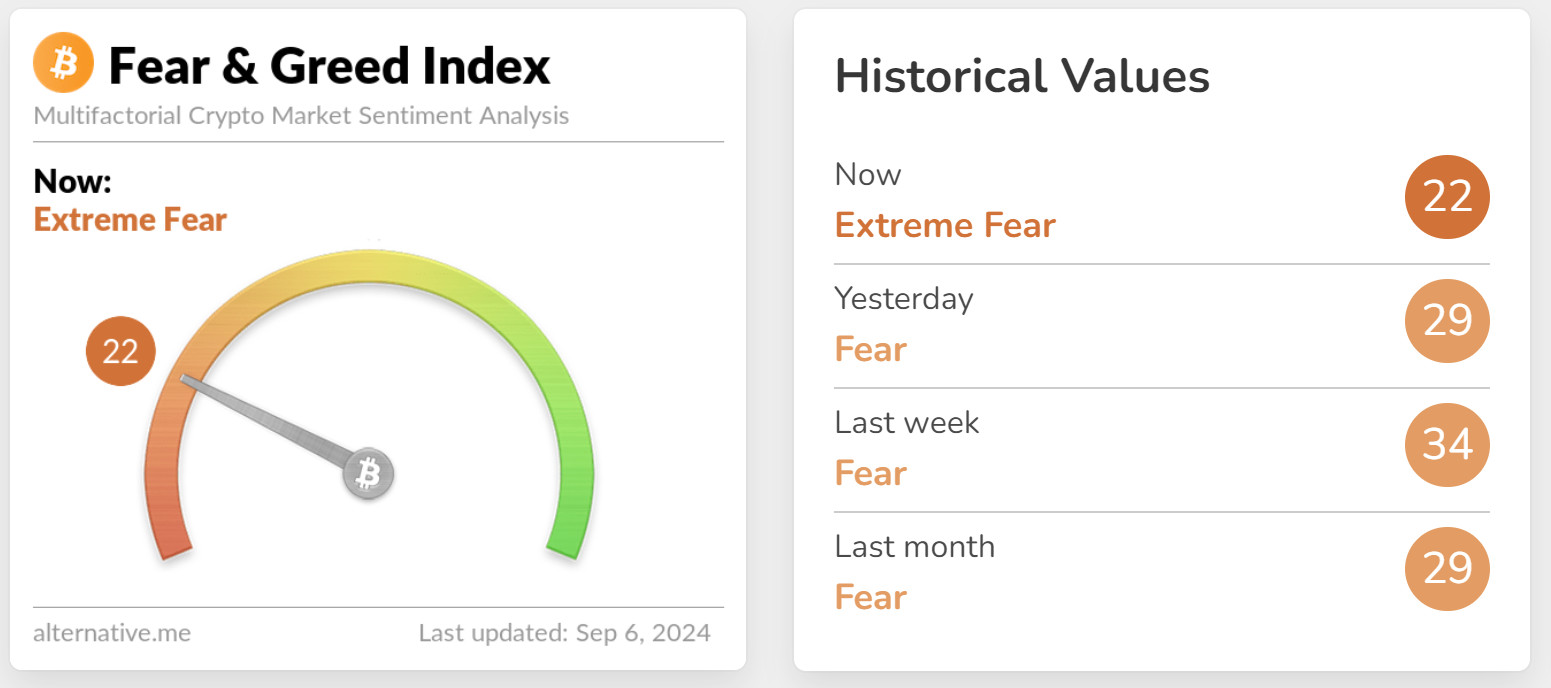
Source: alternative.me
US Stock Markets and Post-Labor Day Developments
On Monday this week, US stock markets were closed for Labor Day, which led to a sluggish start to the new week. However, with the negative opening of the stock markets on Tuesday, recession fears came back to the agenda in global markets. This decline in the US stock markets was seen as a clear indication of the decline in risk appetite.
Asian Stock Markets and Investors’ Risk Appetite
The fall in the US stock markets was quickly reflected in the Asian markets. This volatility in Asian stock markets further reduced investors’ risk appetite. Investors, especially in emerging markets, have become more cautious due to the current global uncertainties and uncertainties regarding the monetary policies of central banks.
General Evaluation
- The negative opening of the US stock markets reinforced concerns about a new wave of recession in global markets and reduced investors’ risk appetite.
- The volatility in Asian markets clearly shows the impact of global economic uncertainty on investors.
- The Bank of Japan’s determination to raise interest rates deepens the monetary policy differences with the US and increases concerns in global markets.
While these developments have led investors to turn to safe-haven assets, they may be a harbinger of a period in which the pressure on risky assets will continue to increase.
“Bitcoin Dominance
Source: Tradingview
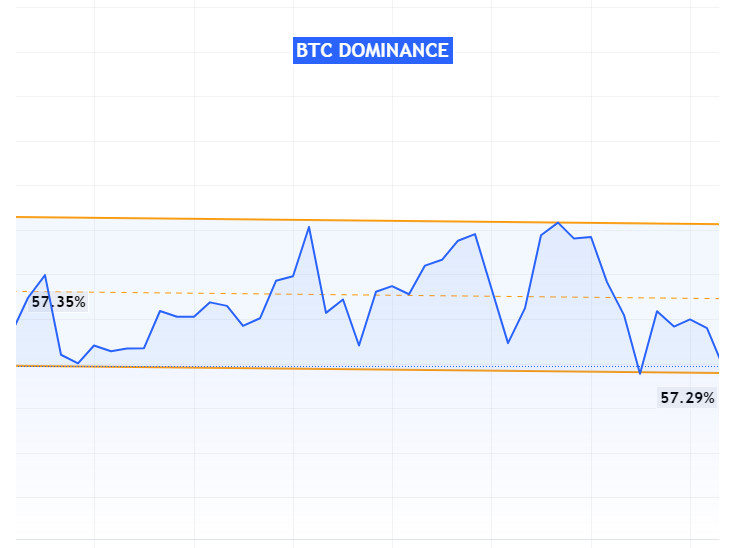
Last week’s surge in Bitcoin dominance led to pullbacks in altcoins. This week, however, a sideways range in Bitcoin dominance is visible. The horizontal range observed in Bitcoin dominance indicates that the market is generally stabilizing and not showing a specific direction.
Bitcoin Dominance
- Last Week’s Level: 57.35
- This Week’s Level: 57.29
Market Stability
The sideways movement in Bitcoin dominance may indicate that the market has found a short-term equilibrium and that neither Bitcoin nor altcoins are dominating. This could mean that investors are indecisive or that market conditions are uncertain.
Macroeconomic Data
A sideways movement may also indicate that overall market conditions are stable and investors are trying to stabilize their reactions to market movements. This could mean waiting for the impact of possible new news or developments.
Total MarketCap
Source:Tradingview
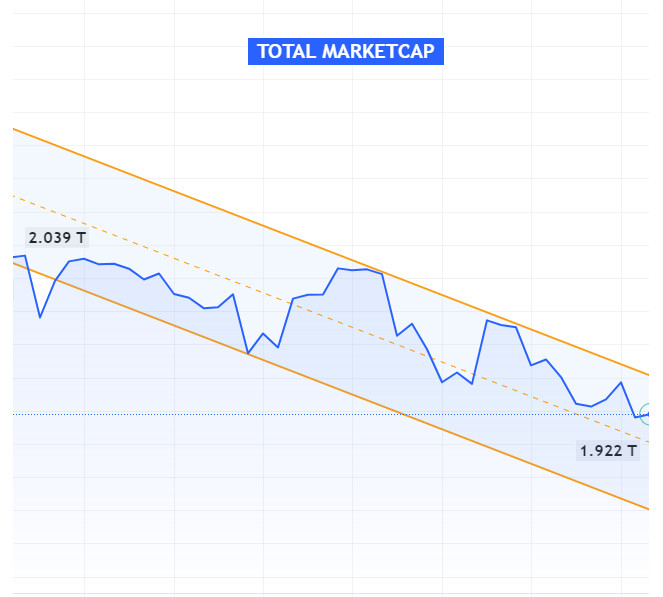
Last week, significant fluctuations were observed in the cryptocurrency market and the market capitalization dropped sharply to $2.039 trillion. This week, the market capitalization continued to fall further, from $2.039 trillion to $1.922 trillion. This continued decline indicates a further weakening of the market and a continued decline in investor confidence.
Increased Sales Pressure
A continued decline in market capitalization may indicate panic selling or large-scale selling by investors. Such selling could push the market capitalization down even further.
Falling Liquidity
Such a drop in market capitalization may also signal liquidity problems or a reduction in trading volume. This could cause prices to fluctuate further and increase volatility.
Market Recovery Expectation
When the market capitalization falls, investors usually wait for a new support level to form. If the market fails to find support at a certain level, the decline may deepen. However, if new support levels are found, this may indicate that the market can rebound.
Weekly Crypto Market Breakdown
Source: Coin Marketcap
“MarketDistribution Image to be Added”
Bitcoin Performance
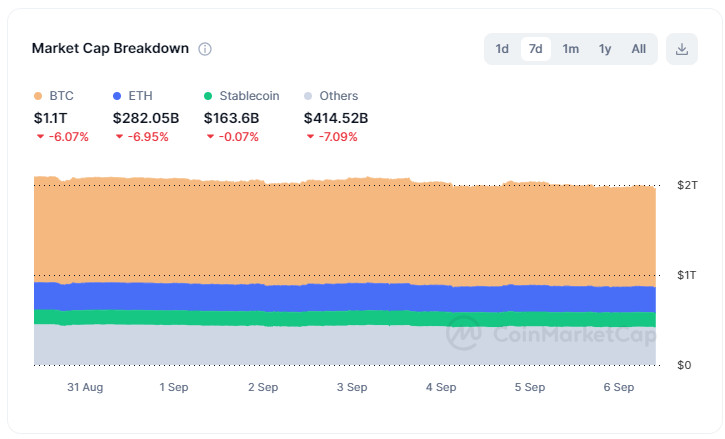
This week, Bitcoin’s market capitalization decreased by 6.07% to $1.100 trillion. Bitcoin’s recent depreciation may be due to the impact of ETFs on institutional investors.
Ethereum Performance
Ethereum lost 6.95% of its value on a weekly basis and its market capitalization fell to $163.6 billion. Ethereum’s weekly depreciation can be attributed to the poor performance of ETFs and the risk aversion of institutional investors. The negative impact of ETFs on Ethereum could lead to a more pronounced drop in Ethereum’s value
Stablecoin Performance
Stablecoins have remained almost flat against other assets, falling by 0.07% this week. The fact that stablecoins have remained almost flat suggests that they offer a stable haven against the market’s volatility and that investors are risk averse.
Altcoin Performance
Altcoins lost 7.09% on a weekly basis, bringing their total market capitalization to $414.52 billion. The significant depreciation in altcoins reveals that they carry higher risk compared to Bitcoin and Ethereum and are more affected by market uncertainty.
Bitcoin Supply Distribution
Source: Glassnode
Price Comparison
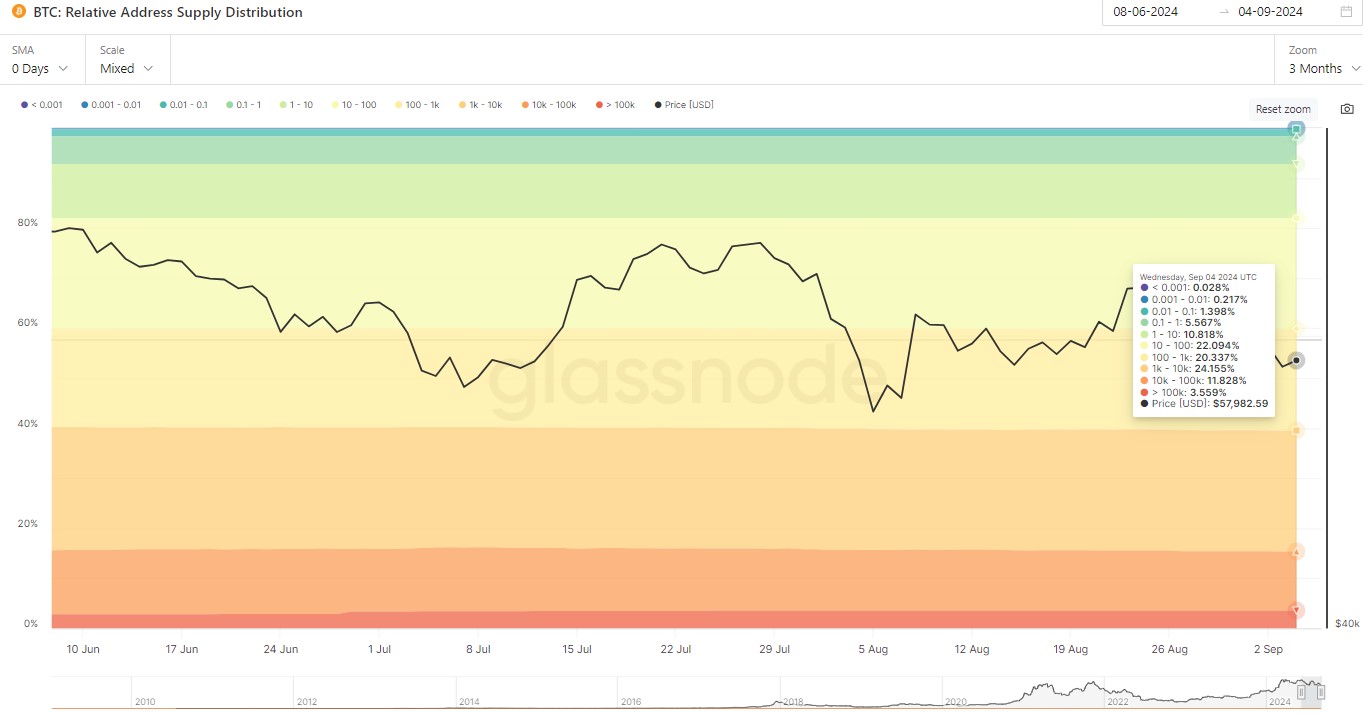
- August 31, 2024 Price: $58,971.65
- September 6, 2024 Price: $56,163.85
Price Decline: A decrease of approximately 4.75% was observed. The price difference between these two dates suggests that the market has depreciated in the short term and potentially some investors are selling.
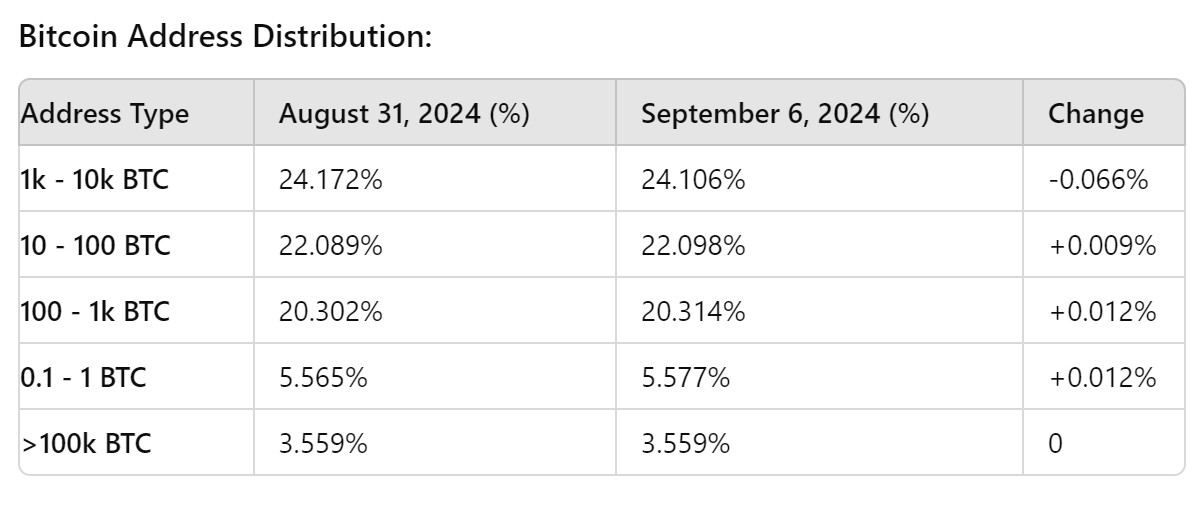 Detailed Analysis:
Large Addresses (>100k BTC): Addresses holding more than
100k BTC remained unchanged (3.559%). This suggests that the biggest whales are holding their positions or not making any significant moves.
Mid-Level Addresses (1k – 10k BTC): Addresses holding
1k – 10k BTC saw a slight decrease (from 24.172% to 24.106%). This may indicate that some large traders reduced their holdings or took profits.
10 – 100 BTC Addresses: There is a very small increase in
this category (22.089% to 22.098%). This suggests that smaller whales or high net worth individuals are entering the market and buying.
100 – 1k BTC Addresses: There was a similarly small increase in addresses holding medium-sized assets (from 20,302% to 20,314%). This indicates that investors in this segment continue to show interest in the market.
Small Addresses (0.1 – 1 BTC)
There was also an increase among small investors (from 5.565% to 5.577%). This shows that retail investors’ interest in Bitcoin is still high and they continue to buy slowly.
Conclusion and Evaluation
- Price Decline: The price decline of 4.75% may indicate profit-taking or selling, especially by some large and mid-level investors.
- Big Whales The lack of movement in whales holding more than 100k BTC may suggest that they are holding on to their long-term positions.
- Medium and Small Investors: While limited purchases continue among mid-cap investors, purchases by smaller investors are also noteworthy. This suggests that retail and small whales continue to accumulate BTC.
In general, small and medium-sized investors continue to show interest in Bitcoin at a time when large investors are taking profits in the market. The price decline indicates that these segments continue to participate despite the volatile nature of the market.
Bitcoin Options Breakdown
Amberdata Data
Option Curve: Bitcoin’s seven-day options curve fell to three-week lows.
This suggests that investors are expecting a deeper drop in Bitcoin price following NVDA’s sales and are prepared for possible market movements.
Coinglass Data
Maximum Pain Point: According to data from Coinglass, Bitcoin’s maximum pain point is set at $59,000.
Traders’ focus on these key price levels suggests that significant market movements may occur and that these levels may have an impact on market dynamics.
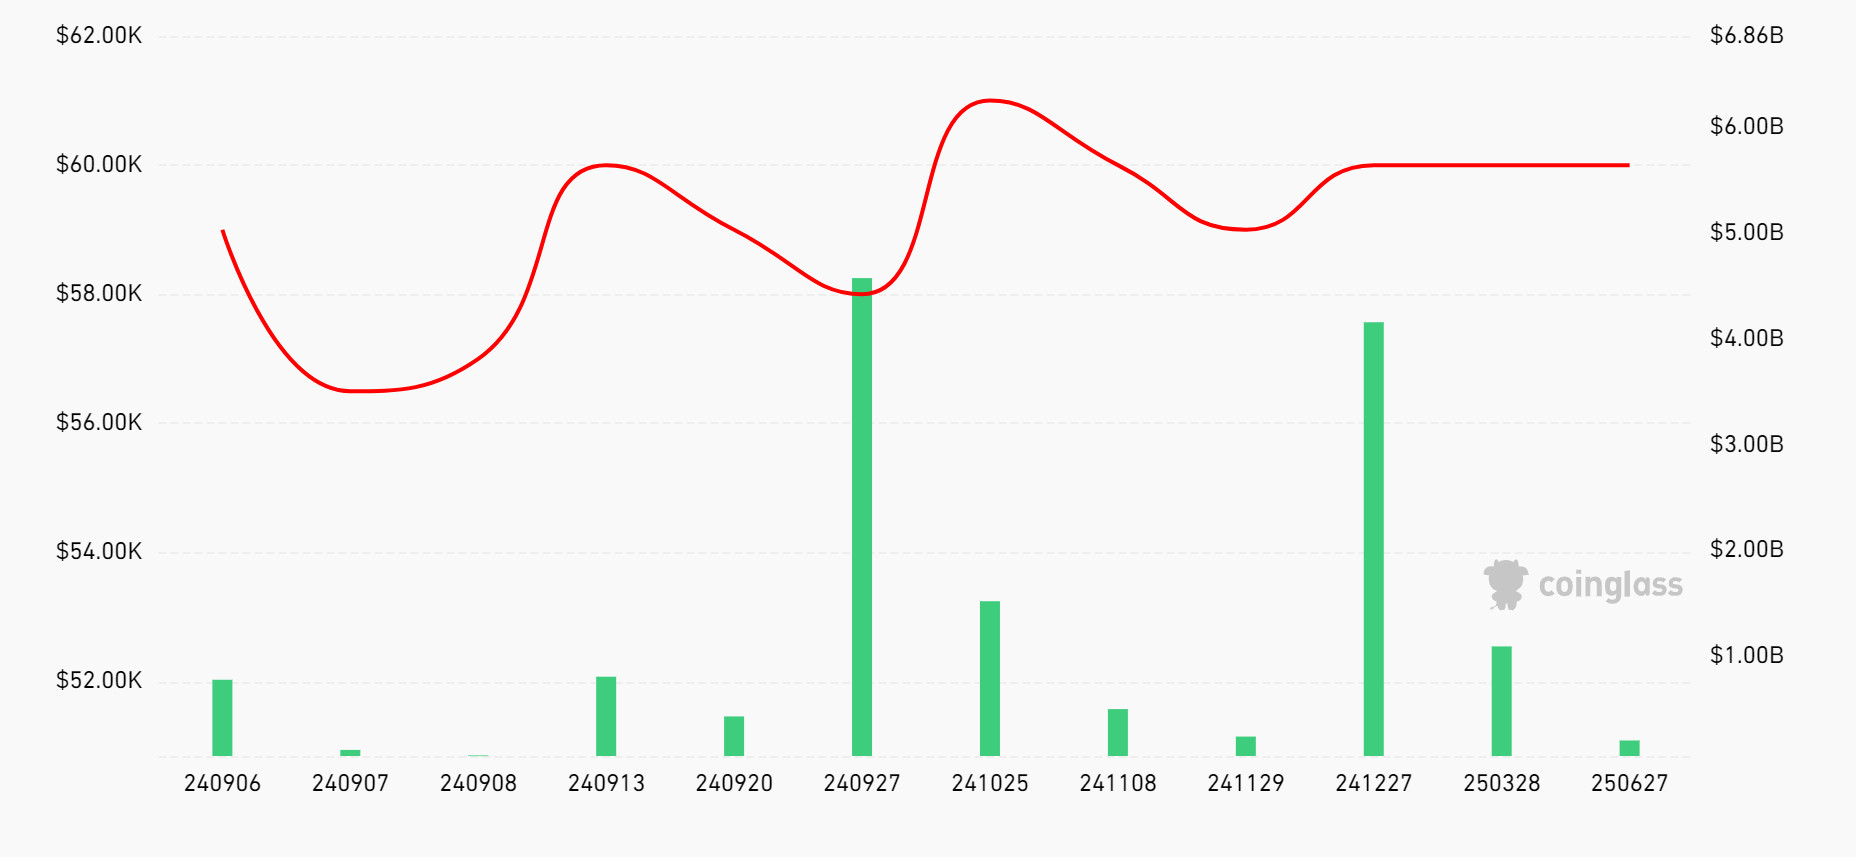
Source: Coinglass
Deribit Data
Option Expiry: According to Deribit’s latest data, approximately $780 million worth of Bitcoin (BTC) options will expire on September 6.
Call/Sell Ratio: The bid/ask spread for these options is set at 1.29.
A call/put ratio of 1.29 indicates that investors prefer to buy put options rather than calls, suggesting a possible selling pressure in the markets.
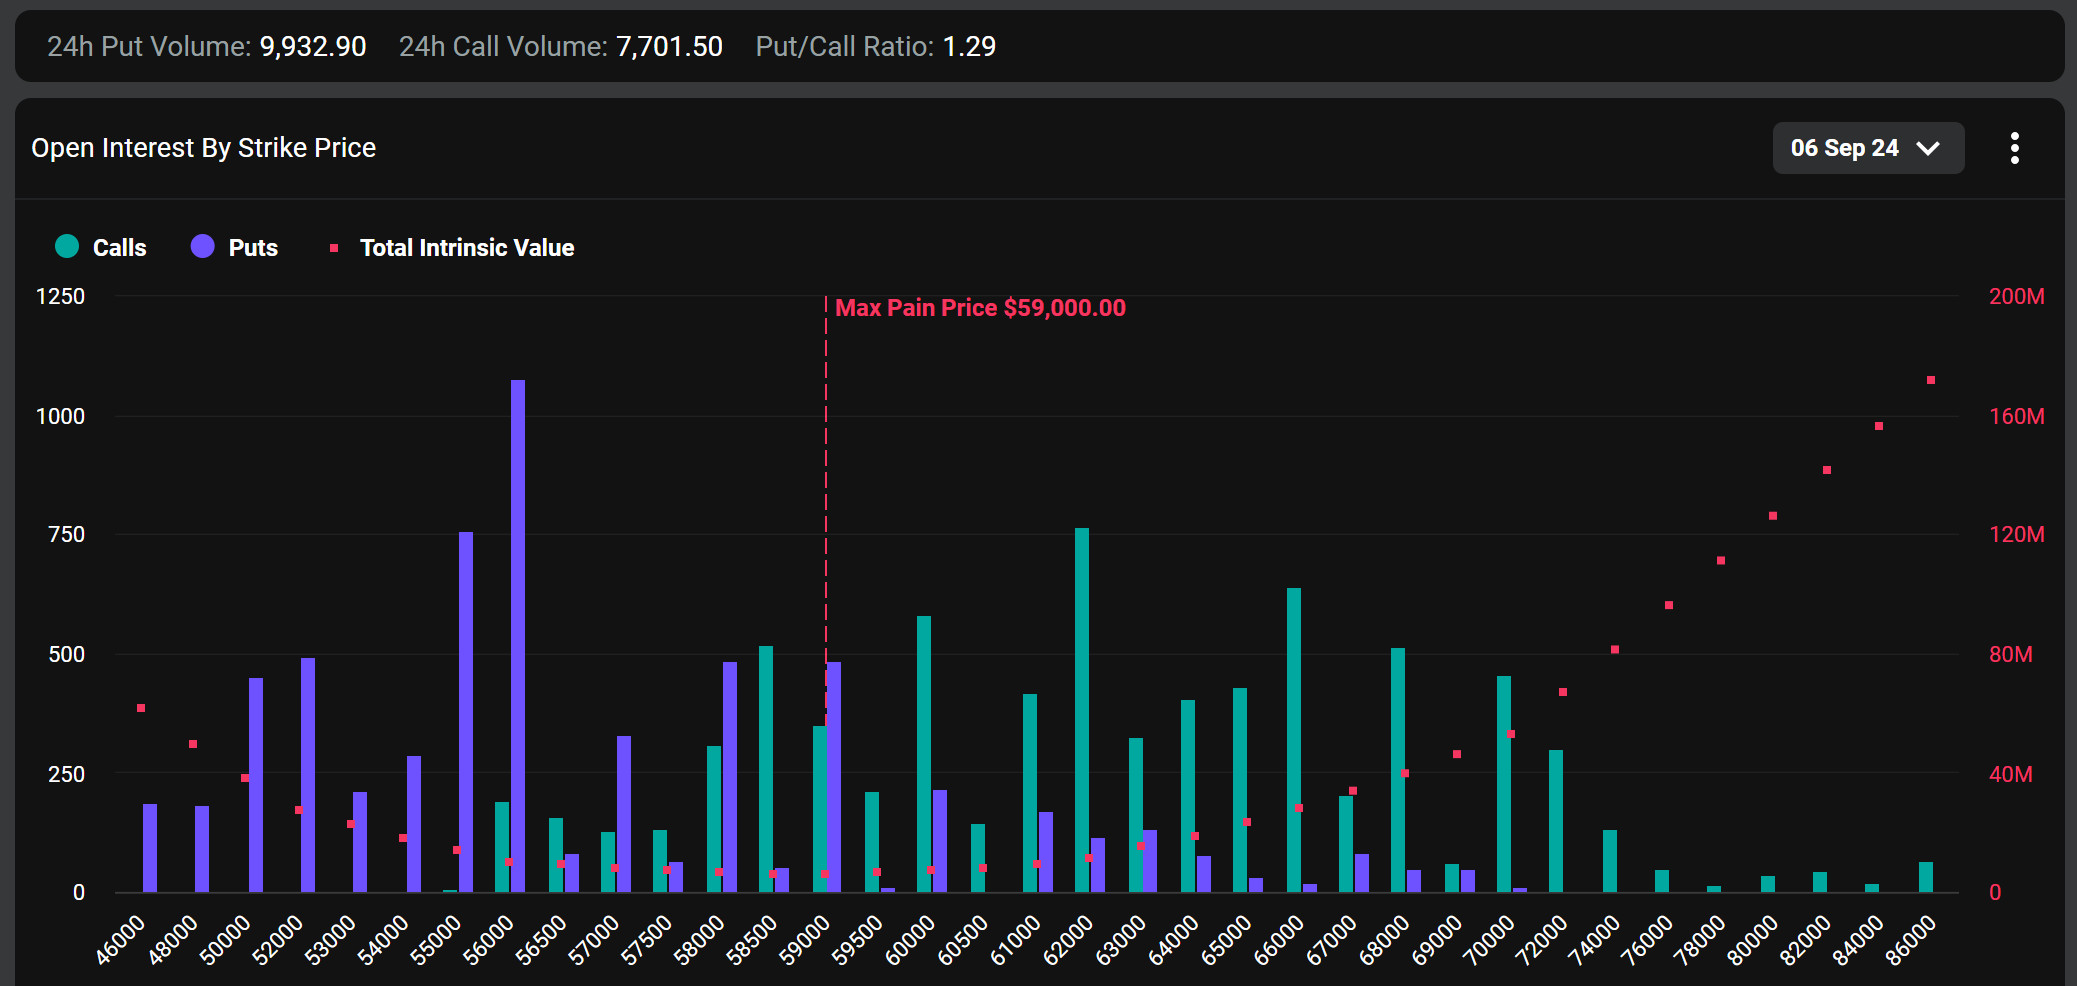
Source: Deribit
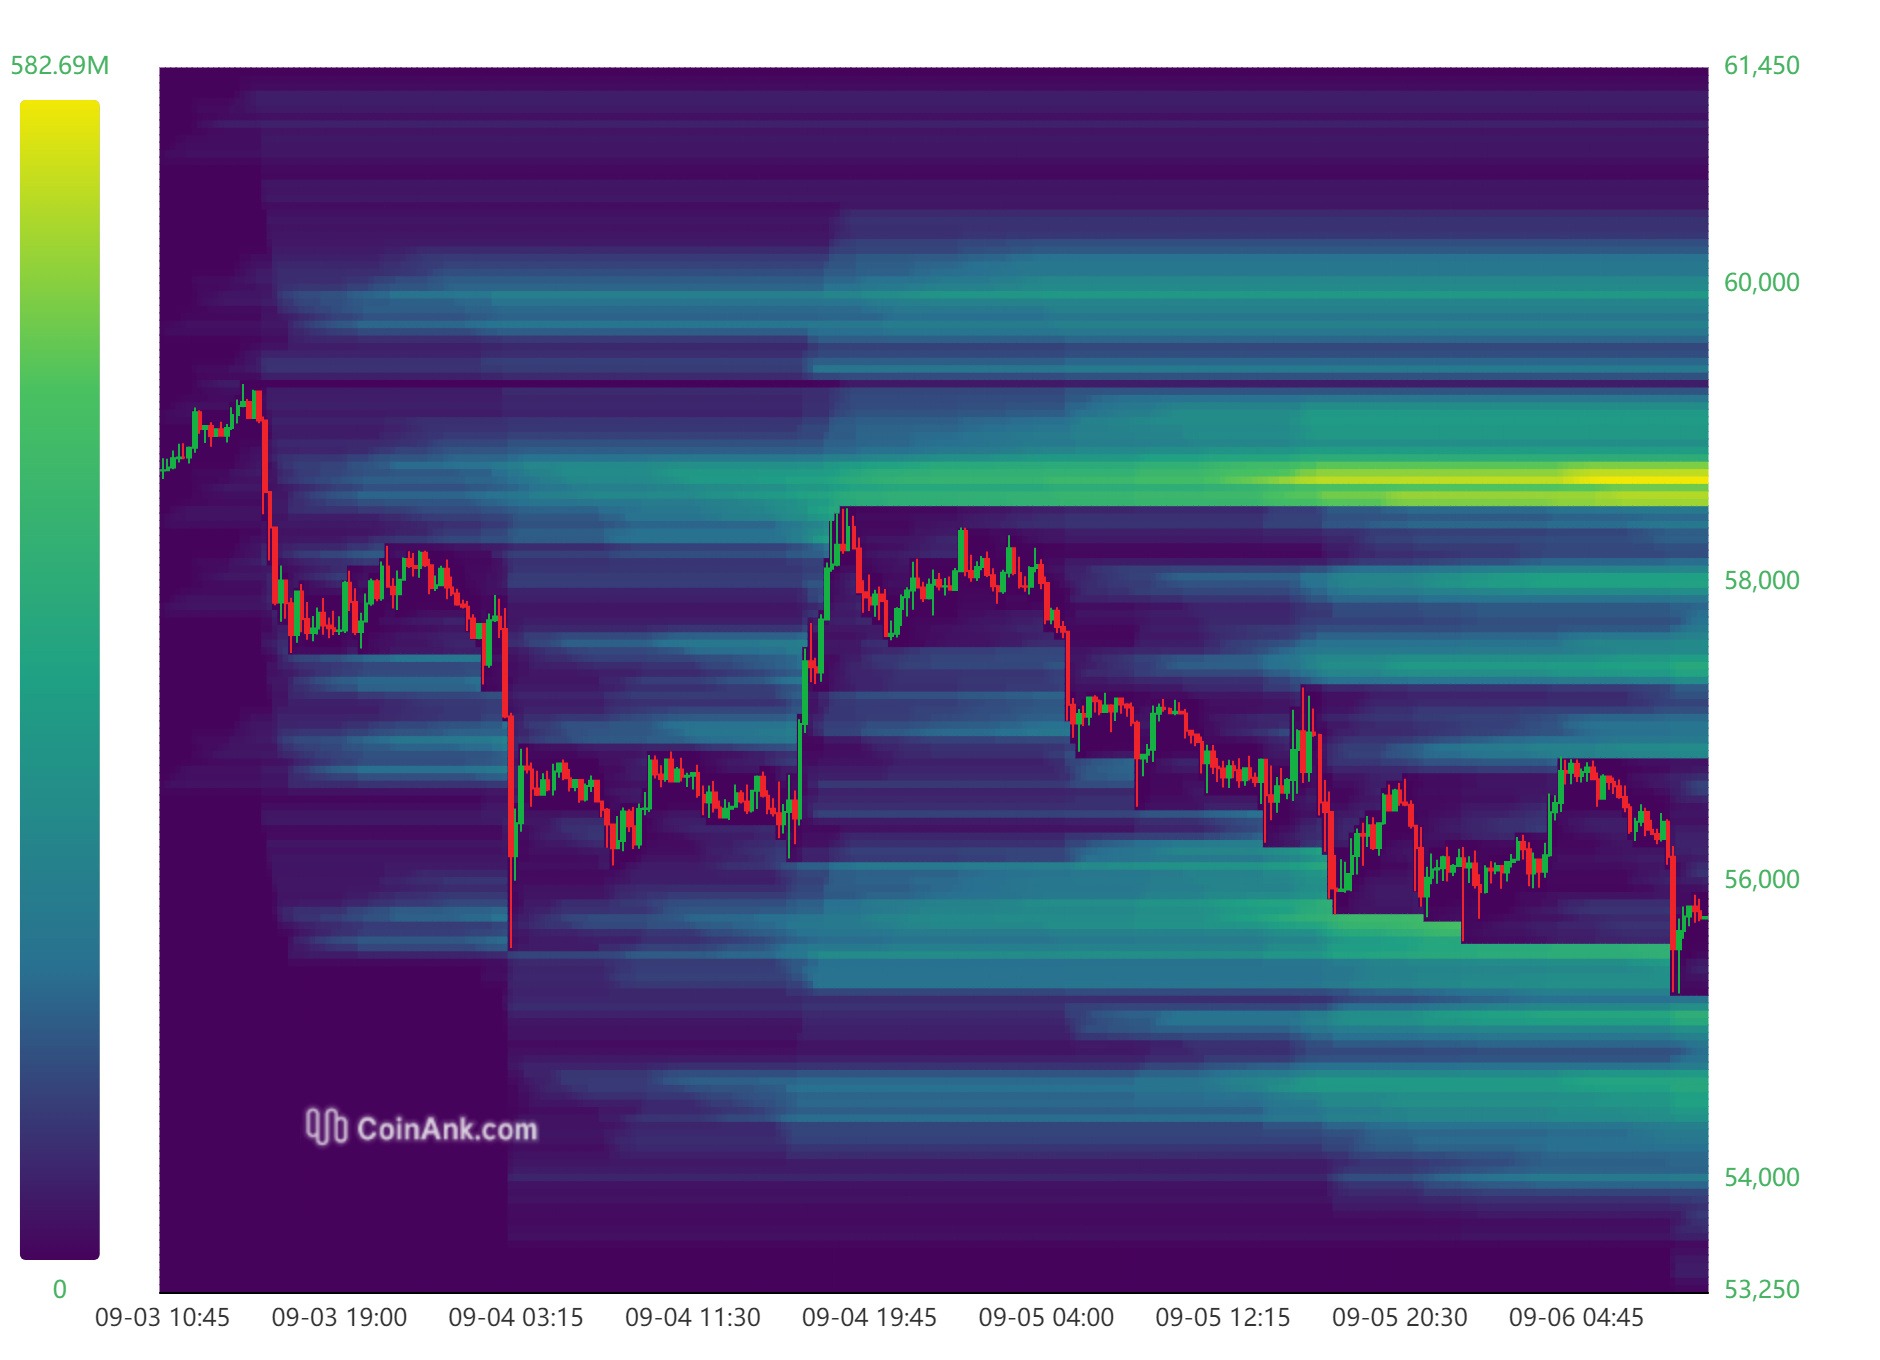
Bitcoin Liquidation Chart
Source: CoinAnk
Weekly Liquidation Summary (September 2 – 5)
- Total Long Liquidation: $95.37 million
- Total Short Liquidation: $50.63 million
Liquidation Areas and Developments
Situation at the beginning of the week
- Liquidation Range: Between 55,600 and 57,600
At the beginning of the week, the area between 55,600 and 57,600 was cleared and long positions were liquidated.
Next Ascension
- Liquidation Range: Between 58,300 and 58,500
With the subsequent rise, it is seen that short transactions, especially between 58,300 and 58,500, reached the liquidation value.
Available Liquidation Areas
- Short Positions: Between 58,500 and 58,800
At the moment, there is a significant liquidation area between 58,500 and 58,800 for short trades and may want to clear the area in this price range in the coming period. - Long Positions: 54,600 to 55,600
For long transactions, liquidations seem to have accumulated between 54,600 and 55,600. These levels can be seen with the downward movement of the price and long transactions may be liquidated.
Bitcoin Spot ETF

Source: SosoValue
General Status
Negative Net Inflow Series
After an 8-day positive streak, net inflows in spot BTC ETFs have turned negative since August 27. This has been evident with negative net inflows for the last 7 days.
Featured Situation
- Blackrock IBIT ETF
The lack of net inflows in the Blackrock IBIT ETF, which has a large share in the positive streak, is noteworthy. This stands out as an important development in the overall ETF market.
Recent Performance
- Outflow Amount: Between September 02-05, Spot BTC ETFs saw outflows totaling $536.1 million.
- BTC Price: In the same period, the Bitcoin price depreciated by 1.96%.
Conclusion and Analysis
Negative Net Inflows
The persistent negative net inflows in spot BTC ETFs suggest that investors are wary of uncertainties and negativity in the Bitcoin market.
Price Impact
Despite the large amount of outflows, the relatively small decline in the price of Bitcoin may indicate that market dynamics and investor psychology have not fully priced in these outflows, or that prices are influenced by broader market conditions.
WHAT’S LEFT BEHIND
Donald Trump
Trump announced that he aims to make the US the world center of cryptocurrency and Bitcoin.
Striking picture in Bitcoin!
If the Bitcoin price falls below $55,000, large long positions may be liquidated.
“Arthur Hayes ‘$50K in Bitcoin is Back on the Table'”
Arthur Hayes stated that Federal Reserve policies could push Bitcoin prices.Arthur Hayes evaluated the worst case scenario where Bitcoin could fall to $ 50,000.
Bitcoin ETFs
Bitcoin ETFs experienced the highest outflows in four months due to economic data in the US.
BlackRock!
BlackRock became the world’s largest institutional Bitcoin holder with 357,000 BTC.
Elon Musk Acquitted in Dogecoin Case
Elon Musk has been cleared of charges in the Dogecoin manipulation case.
Years of anticipation coming true for Cardano?
Cardano has launched the Chang update, where governance will be handed over to the ADA community.
Attention XRP Community: Ripple Announces New Partnership
Ripple has formed a new partnership with Futureverse in artificial intelligence and the metaverse.
Nvidia’s Anti-Dumping Pressure
US regulations on Nvidia have created uncertainty in the crypto market.
BoJ Interest Rate Hike Decision
The Bank of Japan rate hike put negative pressure on Bitcoin.
Former Mt. Gox CEO
Mark Karpeles, former CEO of Mt. Gox’s former CEO Mark Karpeles will launch a new transparency-focused crypto exchange in Europe.
Kamala Harris
Kamala Harris allegedly accepts cryptocurrency donations through Coinbase Commerce. Coinbase clarified that Kamala Harris does not accept crypto donations directly.
New Development on the Ripple-SEC Front!
Ripple requested a postponement of the $ 125 million fine.
Russian President Putin Speaks About Bitcoin (BTC) Mining!
Putin stated that Russia is one of the world leaders in crypto mining.
HIGHLIGHTS OF THE WEEK
Good data-good market, bad data-bad market equation
In recent weeks, price movements in global markets have been driven by changes in expectations for the US economy and the Federal Reserve’s monetary policy actions. A few macro data releases have brought recession concerns back to the agenda, while the FED’s interest rate cut course has been discussed more loudly. We should not expect markets to lose focus on the FED and the US economy next week or even until the Federal Open Market Committee (FOMC) meeting on September 18. Moreover, this may continue for a longer period of time.
The fact that the PMI data for the US manufacturing sector has remained below the 50 threshold level for the last five months has once again pushed the markets into recession fears, as it did in early August. The equation of “good data-good market” and “bad data-bad market” guided prices after each macro indicator. However, in the immediate aftermath of Friday’s lower-than-expected non-farm payrolls (NFP) data, the markets’ first reaction was to move into assets considered to be relatively risky. In other words, the markets had complex reactions to the data and this may continue in the new week. In the aftermath of the NFP data, we saw that the probability of a 50 basis point rate cut by the FED in September increased a bit more. In this respect, the next macro indicators will continue to be remarkable.
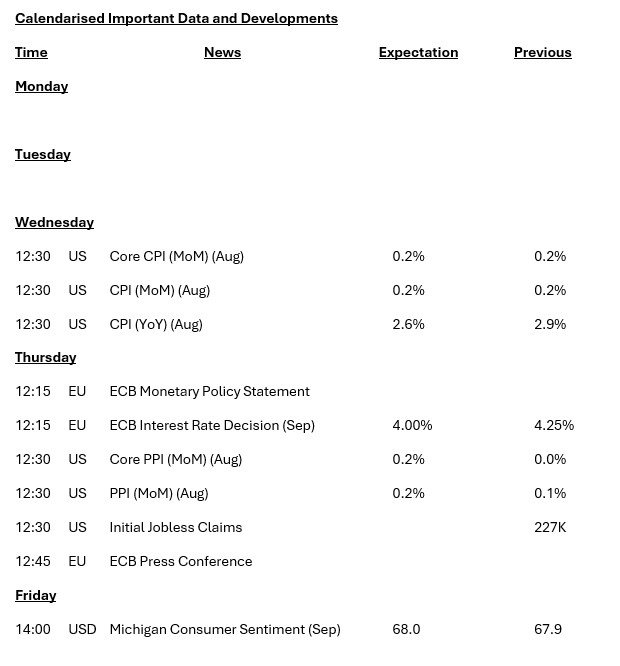
Inflation week in the US
The most important macro indicator for the coming week will be the US inflation data for August. Although the focus has shifted from inflation to employment after FED Chair Powell’s speech at Jackson Hole, the dose of the rise in prices is still of great importance.
In July, the core CPI in the US signaled an increase of 0.2%. Prices are expected to rise by this magnitude in August as well. Considering that the pricing behavior in the market is shifting towards the FED’s interest rate decisions (from recession concerns), we can say that an inflation data set that will be below expectations may have a positive impact on digital currencies by strengthening the expectation that the FED will increase the possibility of interest rate cuts with larger steps. Conversely, higher-than-expected inflation data is more likely to have a negative impact.
TECHNICAL ANALYSIS
BTC/USDT
Bitcoin weekly performance! We left behind a bearish week in Bitcoin, where volatility increased, and the price was stuck in a narrow band range. If we summarize the events that had an impact on Bitcoin, D. Trump’s promise to make the US a crypto center was an important development, although it did not gain a movement on the rise. Regulations on Nvidia, ETF exits of institutional investors and BoJ interest rate hike decisions have gone down in history as negative developments for Bitcoin. Today, non-farm payrolls data and unemployment rates, which are among the macroeconomic developments on the US side in the evening hours, may have a significant impact on the FED interest rate policy and the search for direction in Bitcoin can be determined. On the BTC 1-day technical analysis chart, we see that the 55,250 level, which is the fibo support point caused by whale sales during the day, was tested. With the loss of this level, we see the 50,650 point, which sees a support level in the “gap” zone, the area where support and resistance points are weak. Our technical indicator RSI, on the other hand, is moving in the oversold zone on our daily chart, and if the direction turns upwards, 58,800 appears as resistance.
Supports 55,250 – 50,650 – 48,800
Resistances 58,800 – 61,200 – 63,850
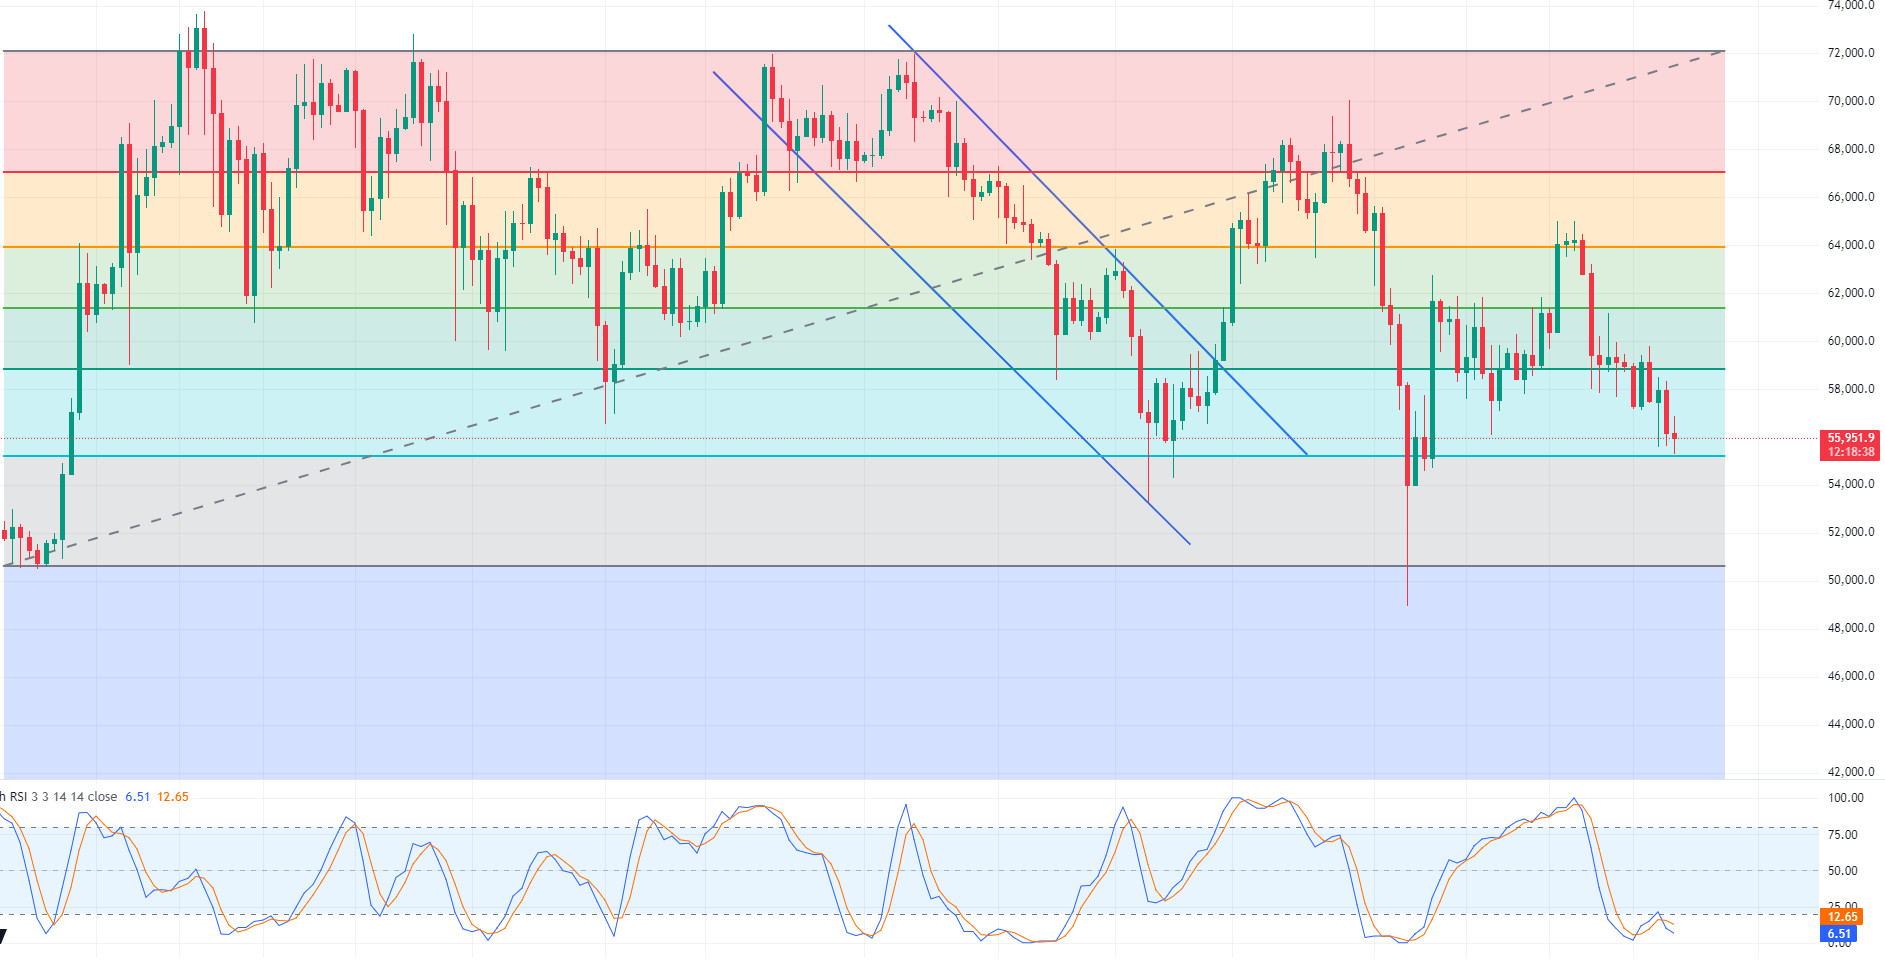
ETH/USDT
One of the most notable events of the week in Ethereum has been the surge in prices of old Ethereum NFT collections. Compared to recent weeks when Etherum’s in-network transactions came to a standstill, this event has become even more important. On the Ethereum side, the drop in gwei prices may seem positive, but it’s also inflationary and had a very negative impact on a product that was already under pressure to sell. The sales of the Ethereum Foundation and a few whales seem to be feeding the negative trend by affecting investor psychology, even if it does not affect it volumetrically.
On the technical side, weakness is once again evident on the daily timeframe. The only positive is that momentum is heading up with the last candle. On the
CVD futures and spot side, it is clearly seen that there is seller pressure from both channels. With the break of the 2,300 – 2,315 zone, the search for new lows may be realized. A break of the 2,567 level could end the downtrend and start a positive trend to 2,925 levels.
Supports 2,315 – 2,093 – 1,931
Resistances 2,567 – 2,726 – 2,925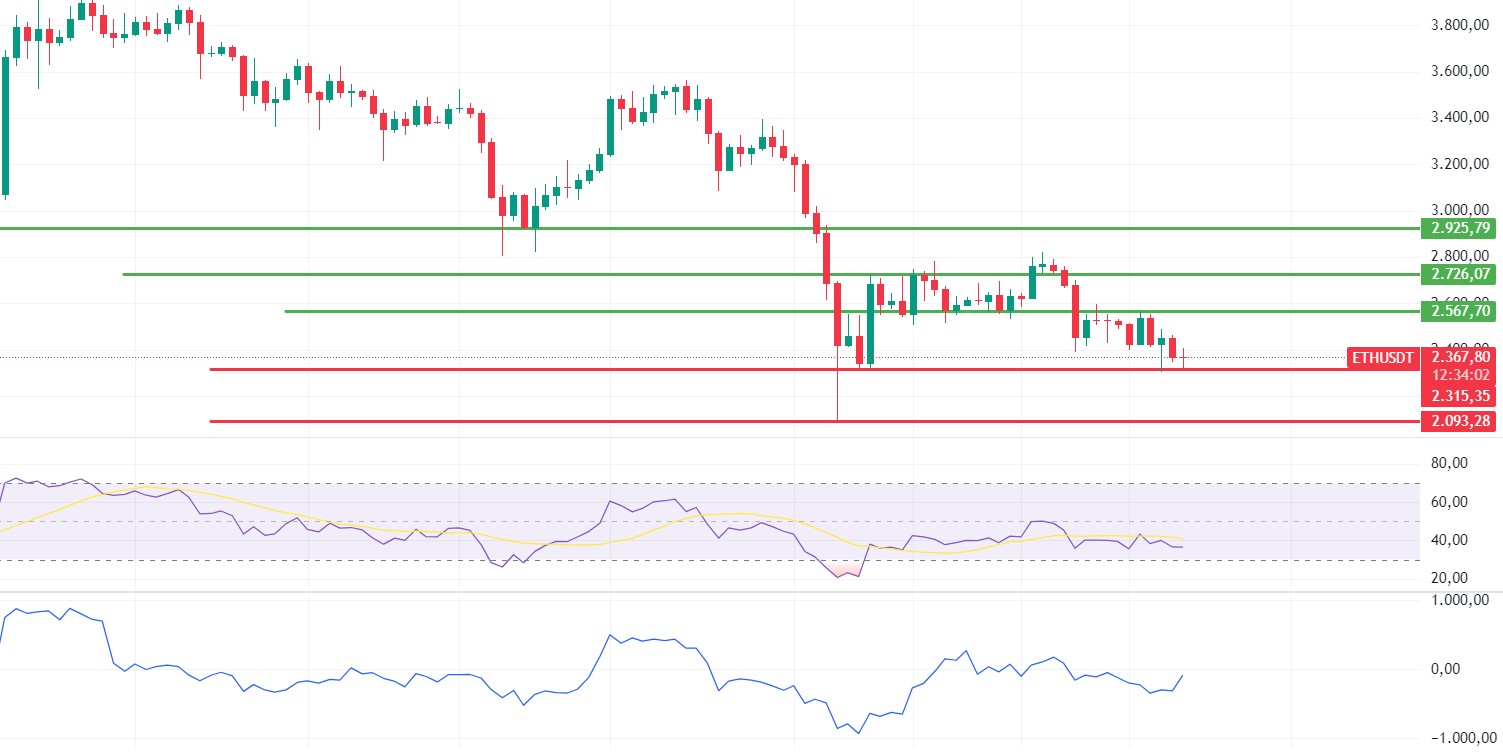
LINK/USDT
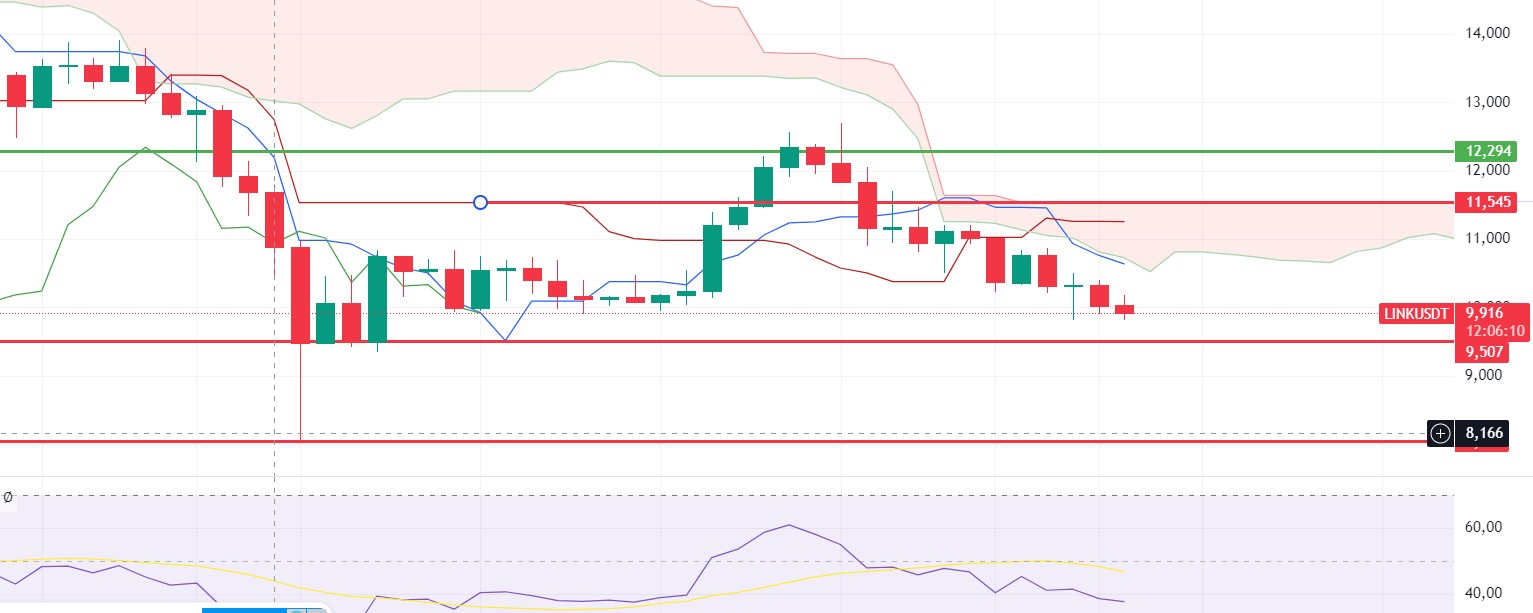
The selling pressure on LINK is increasing day by day as Ethereum is bleeding. The 9.50 level stands out as the main support level. In the 1-day timeframe, as a result of the sell signal from ichimoku, there may be a retracement to these levels in the coming week. Closures below it may cause retracements down to $ 8 levels. The 11.54 level of kumo cloud resistance is the main resistance. With the voluminous break of this level, it can be said that the downtrend has ended, and uptrends can begin.
Supports 9.50 – 8.00 – 7.45
Resistances 11.54 – 12.30 – 14.7
SOL/USDT
In the current week SOL has decreased by 8.65%. According to Lookonchain data, a whale or institution sold 139,532 SOLs worth $19.5 million on a centralized exchange at a loss of $5.5 million. In the Solana ecosystem, Pump.fun became the fastest growing app in terms of revenue in the history of the crypto economy. It generated $100 million in 217 days. On the other hand, the price has struggled to rise as a large whale or institutional entity has consistently sold large amounts of SOL throughout the year. This year, the total amount sold since January 1 amounted to 695,000 ($99.5 million). Volmex Finance introduced the first implicit volatility index for Solana’s SOL token. The crypto derivatives protocol unveiled its new innovation on Tuesday as a way to measure expected price fluctuations in terms of market capitalization. A global centralized exchange announced it will launch SOL Staking in September. Next week, the probability of a US interest rate cut of 50 basis points may increase. In addition, the consumer price index from the US is among the data to be followed. From a technical point of view, the price continues to accumulate in the range of 188.99 – 127.17 since April 4. It is currently showing a slight upward trend again at the support point of the band. Our support band seems to be 127.17 – 133.51. If there is a reaction from here, our first resistance point will be 152.32. In the event of a possible negative situation from the USA or a continuation of whale sales in the ecosystem, 127.17 – 121.20 levels can be followed in the retreat.
Supports 127.17 – 121.20 – 118.07
Resistances 133.51 – 152.32 – 161.63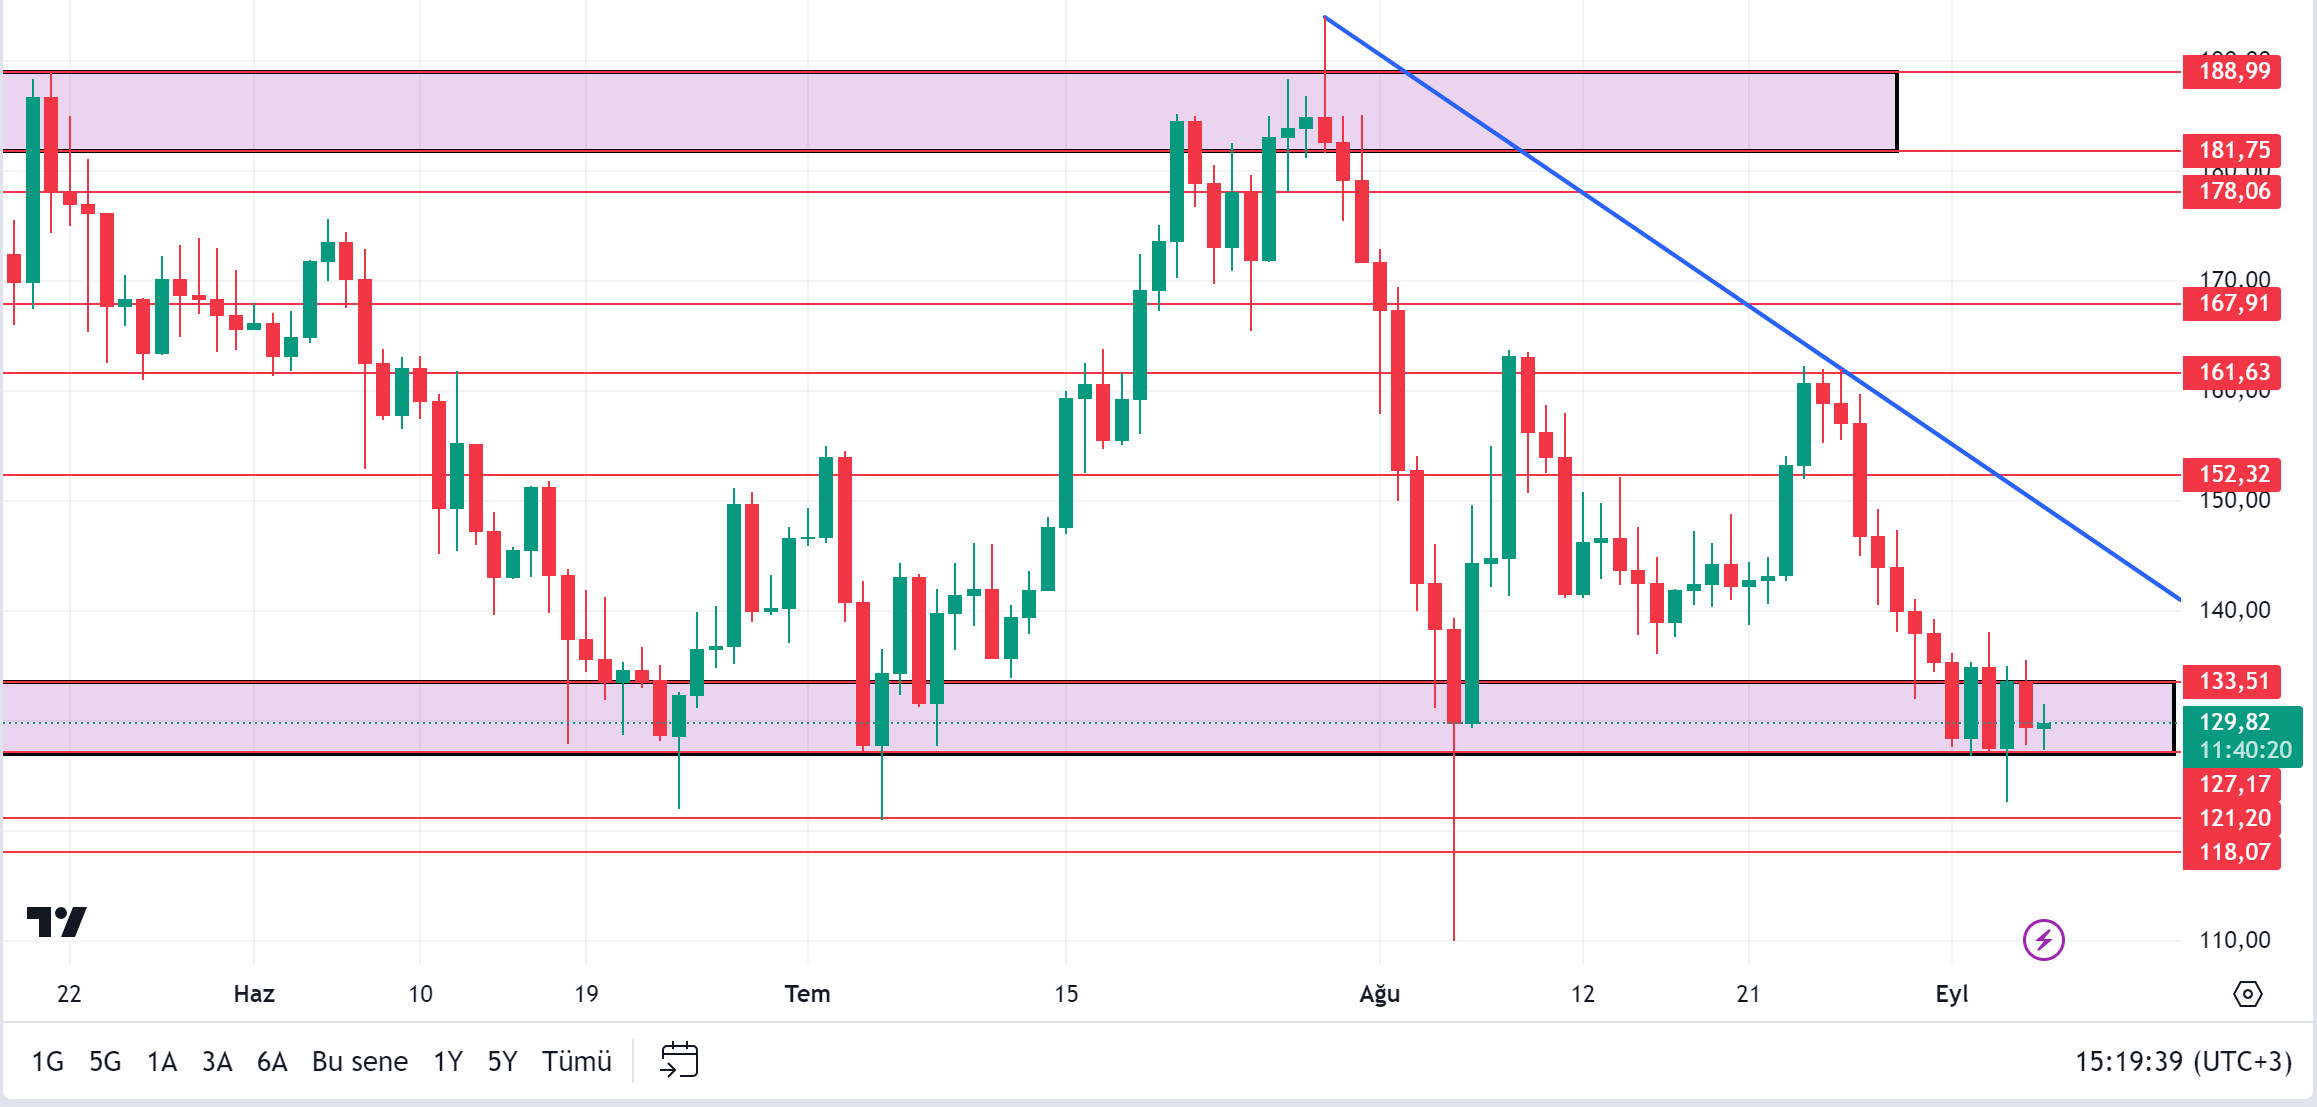
ADA/USDT
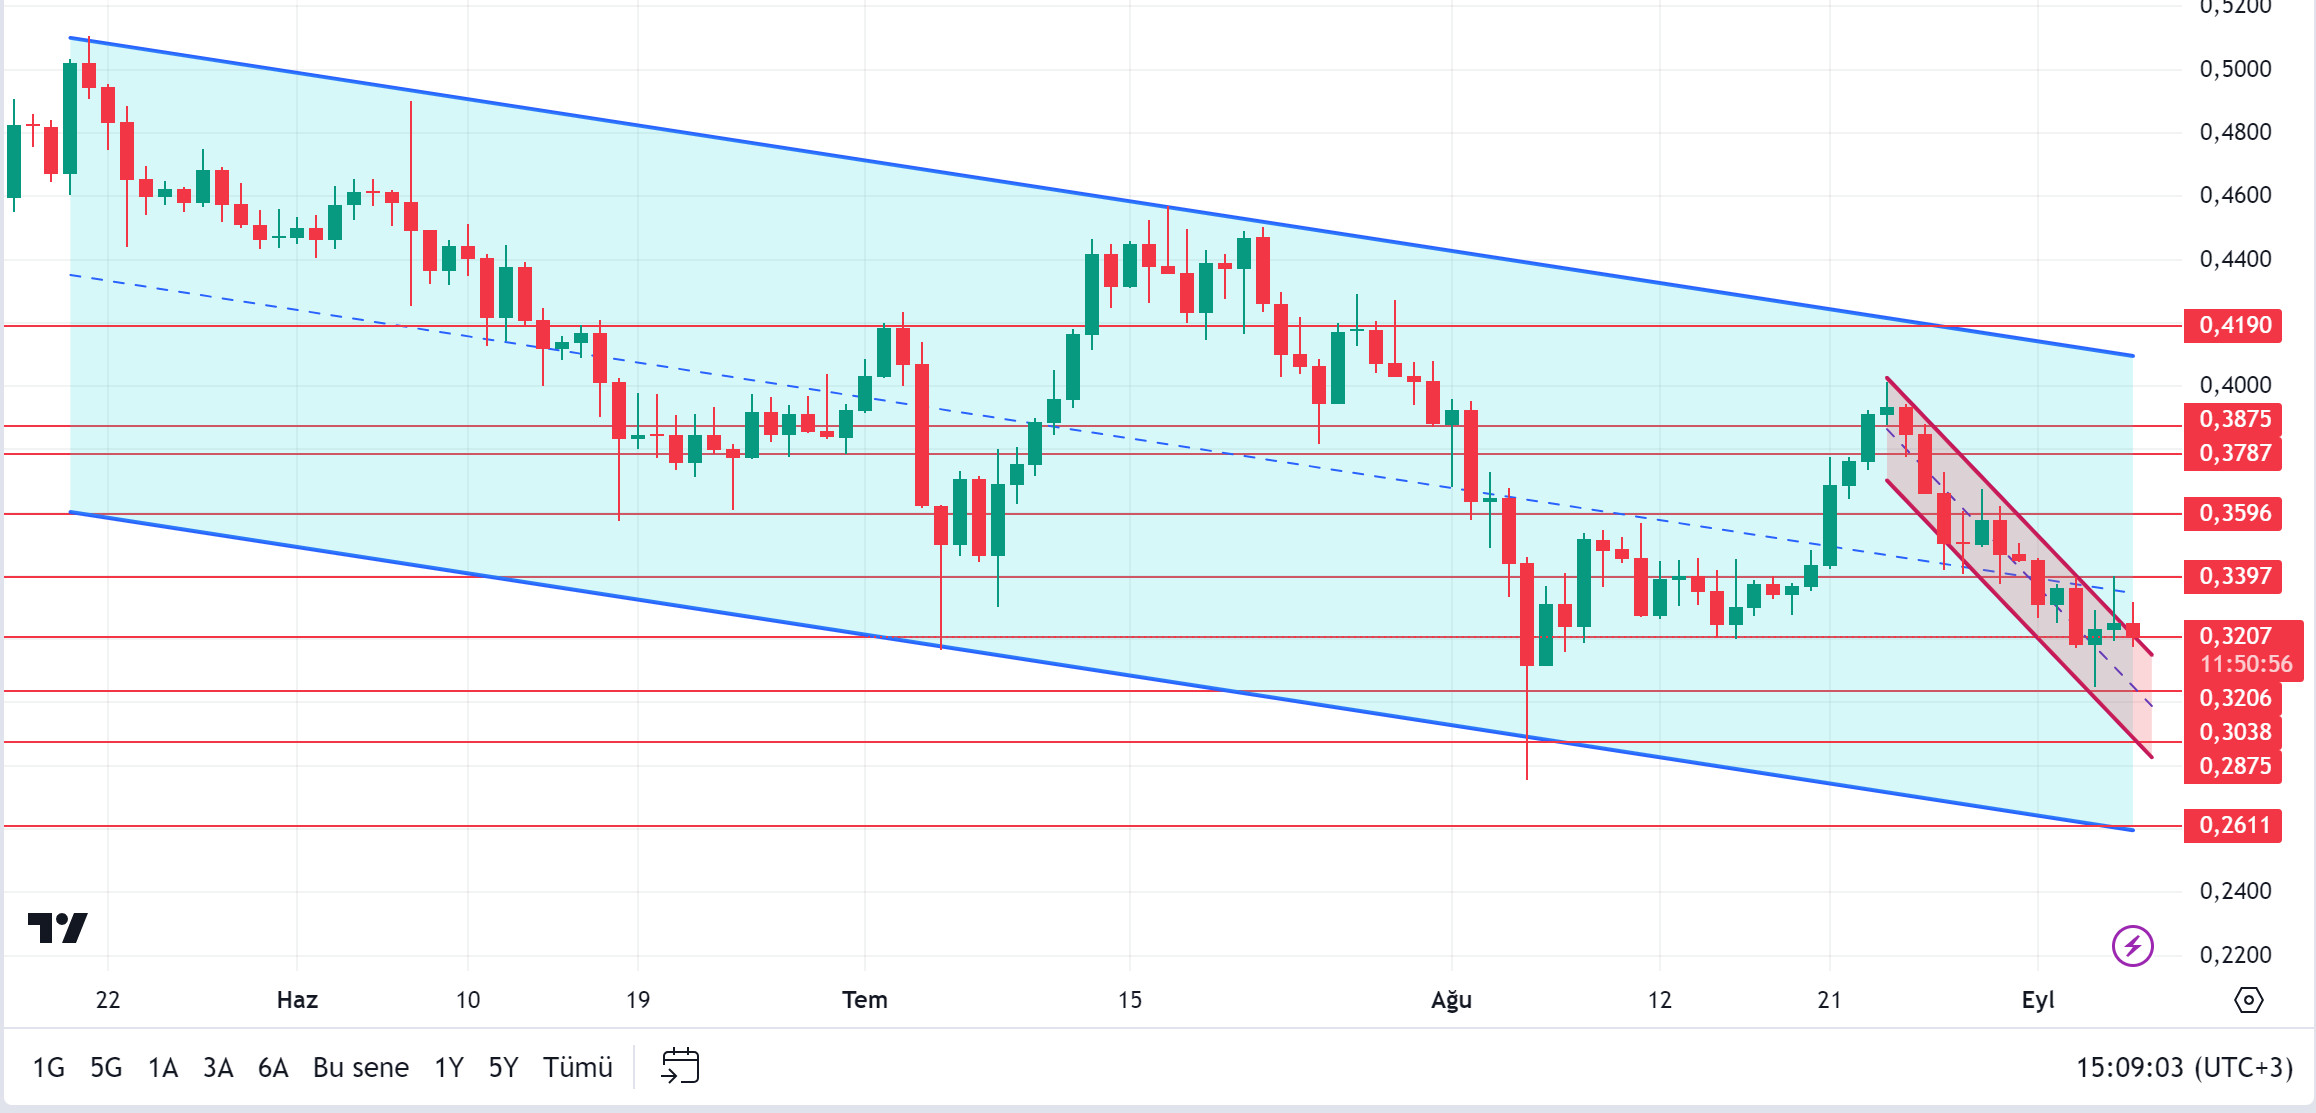
ADA fell by 7.93% this week. This was caused by macro economic data and BTC movements. On the other hand, Cardano’s chang hard fork went live and a major shift towards decentralized governance has begun. The first phase is expected to be activated and full governance is expected within 90 days. CEO Charles Hoskinson claimed to have surpassed Bitcoin in decentralization. Tuur Demeester, one of Bitcoin’s most ardent defenders, targeted Cardano in response. Demeester pointed out that Cardano’s dominance has declined dramatically over the past three years. On the other hand, Cardano officially launched the Chang Hard Fork, unlocking approximately $500 million worth of Sovereign Wealth Funds in ADA. This is equivalent to approximately 1.5 billion ADA tokens. In addition to all this, the probability of a US interest rate cut of 50 basis points may increase next week. In addition, the consumer price index from the US is among the data to be followed. In technical terms, the downward trend continues. Although the successful passage of the update was pregnant with short-term rises, the general situation of the market prevented the ADA from rising. If the next macroeconomic indicators are positive, if the falling trend is broken upwards, 0.3397 – 0.3596 levels can work as resistance. In case of negative news or uncertainty from the macroeconomic side, 0.3206 – 0.3038 levels can be followed as support levels.
Supports 0.3206 – 0.3038 – 0.2875
Resistances 0.3397 – 0.3596 – 0.3787
AVAX/USDT
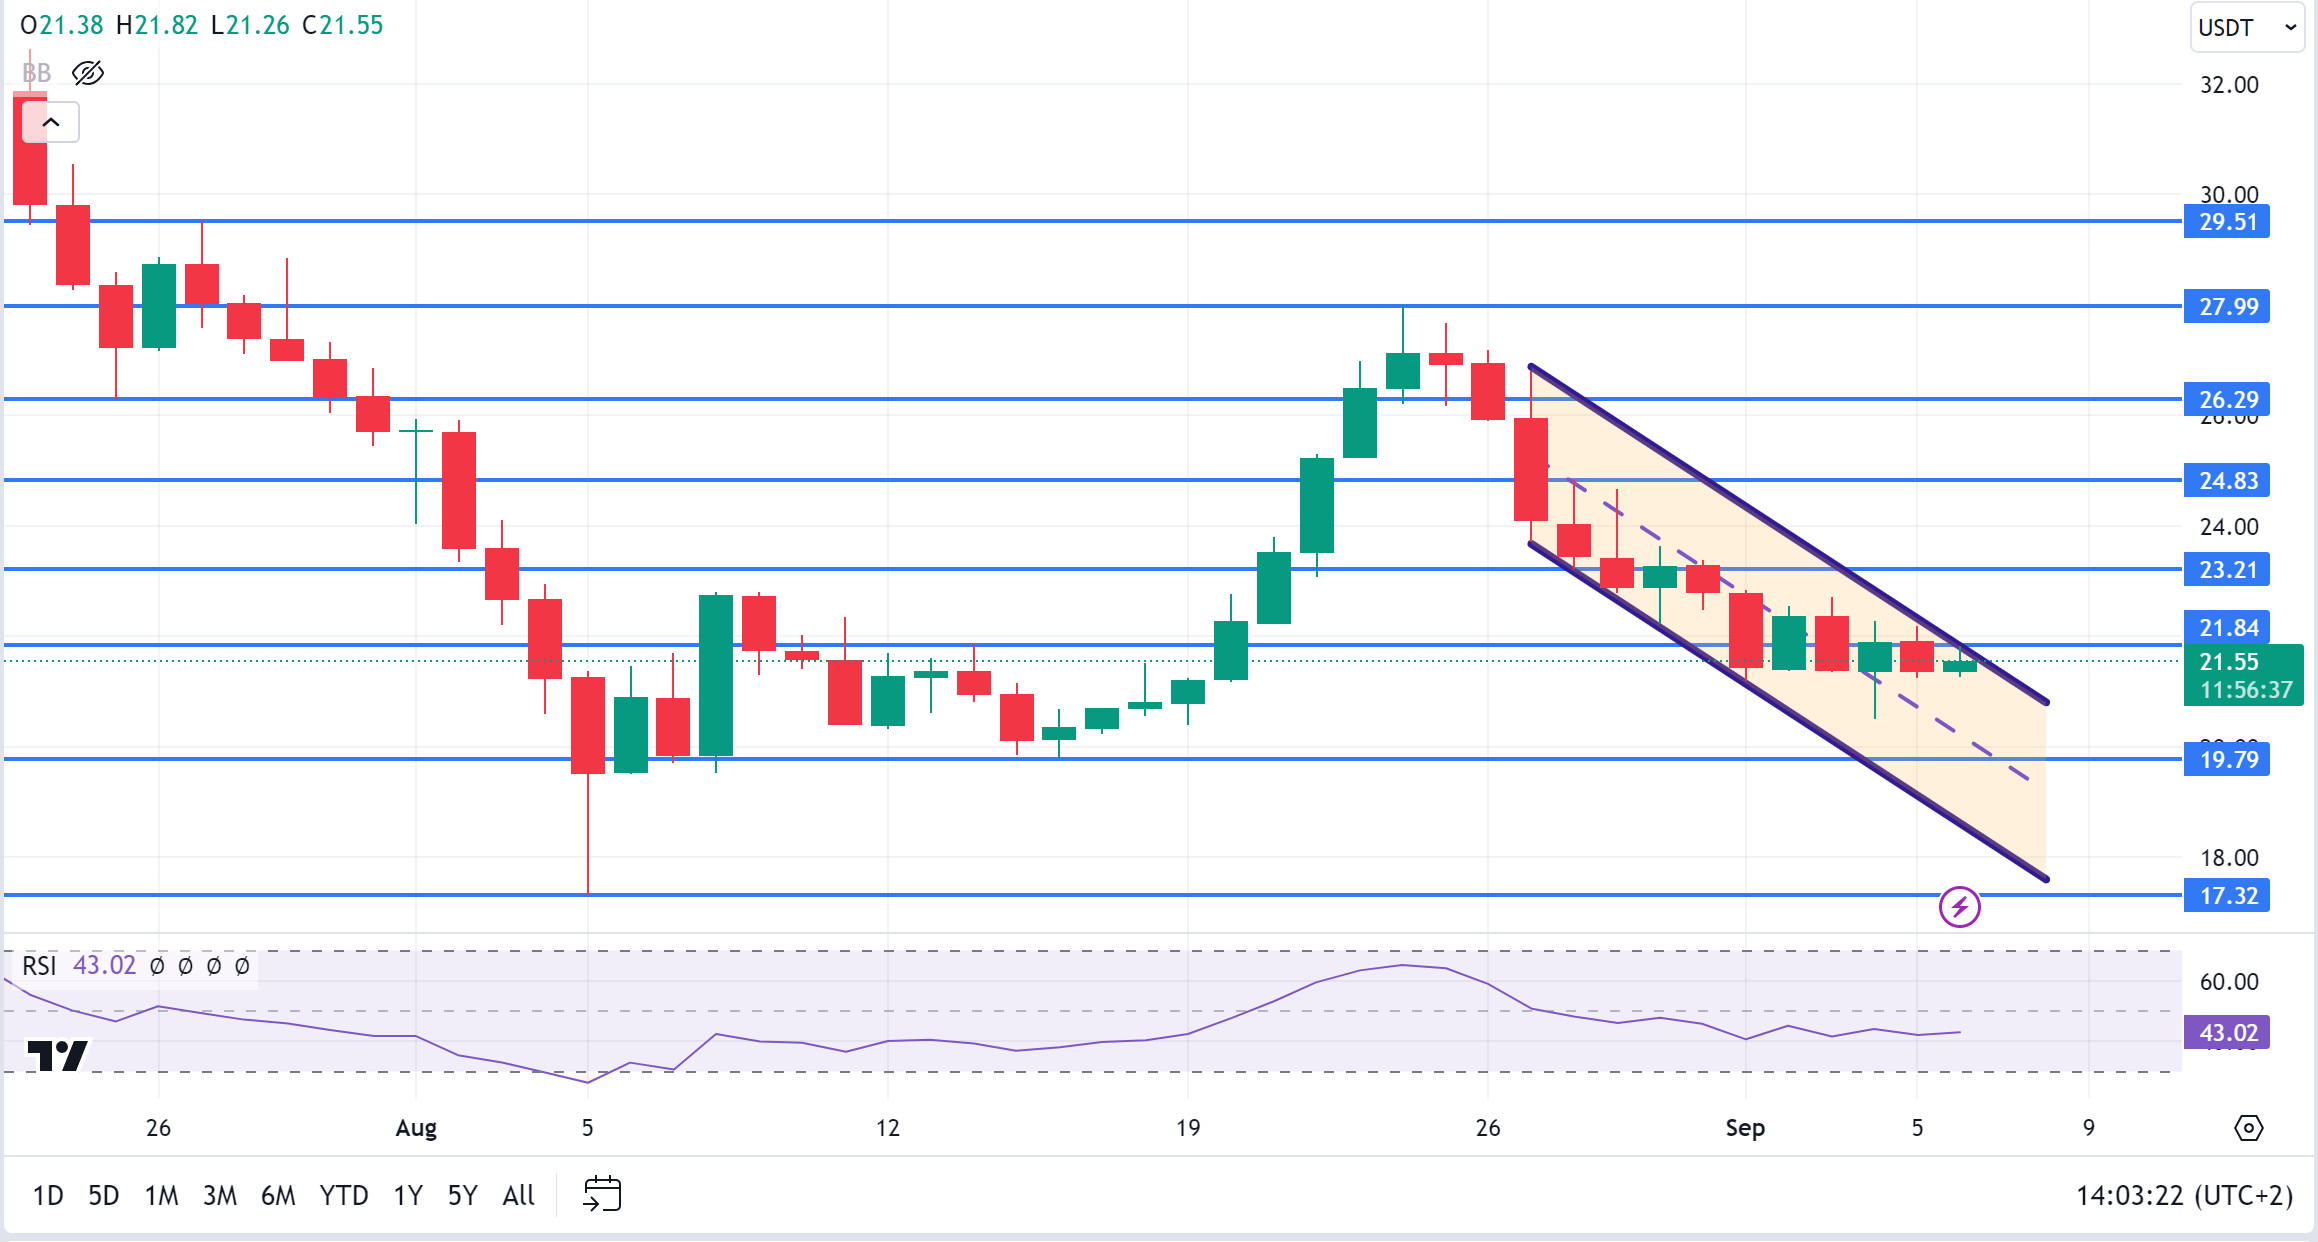
AVAX, which started the week at 21.42, made a very limited rise throughout the week and is currently trading at 21.55. It will determine the direction depending on the US non-farm employment and unemployment rate data to be announced today.
The US consumer price index, producer price index and unemployment claims will be released next week and these data will affect AVAX along with the market. High volatility may occur in the market during and after the data release.
AVAX, which continues its movement within the falling channel on the daily chart, may break the upper band of the channel upwards with the positive perception of the upcoming data by the market. In such a case, it may test 23.21 and 24.83 resistances. With the reaction from the upper band of the channel and selling pressure, it may fall to the lower band of the channel and test the supports of 19.79 and 17.32. On the daily chart, the desire to rise may continue as long as there is no candle closure below 17.32 support. The decline may deepen with the candle closure below this support.
Supports 19.79 – 17.32 – 15.56
Resistances 21.84 – 23.21 – 24.83
TRX/USDT
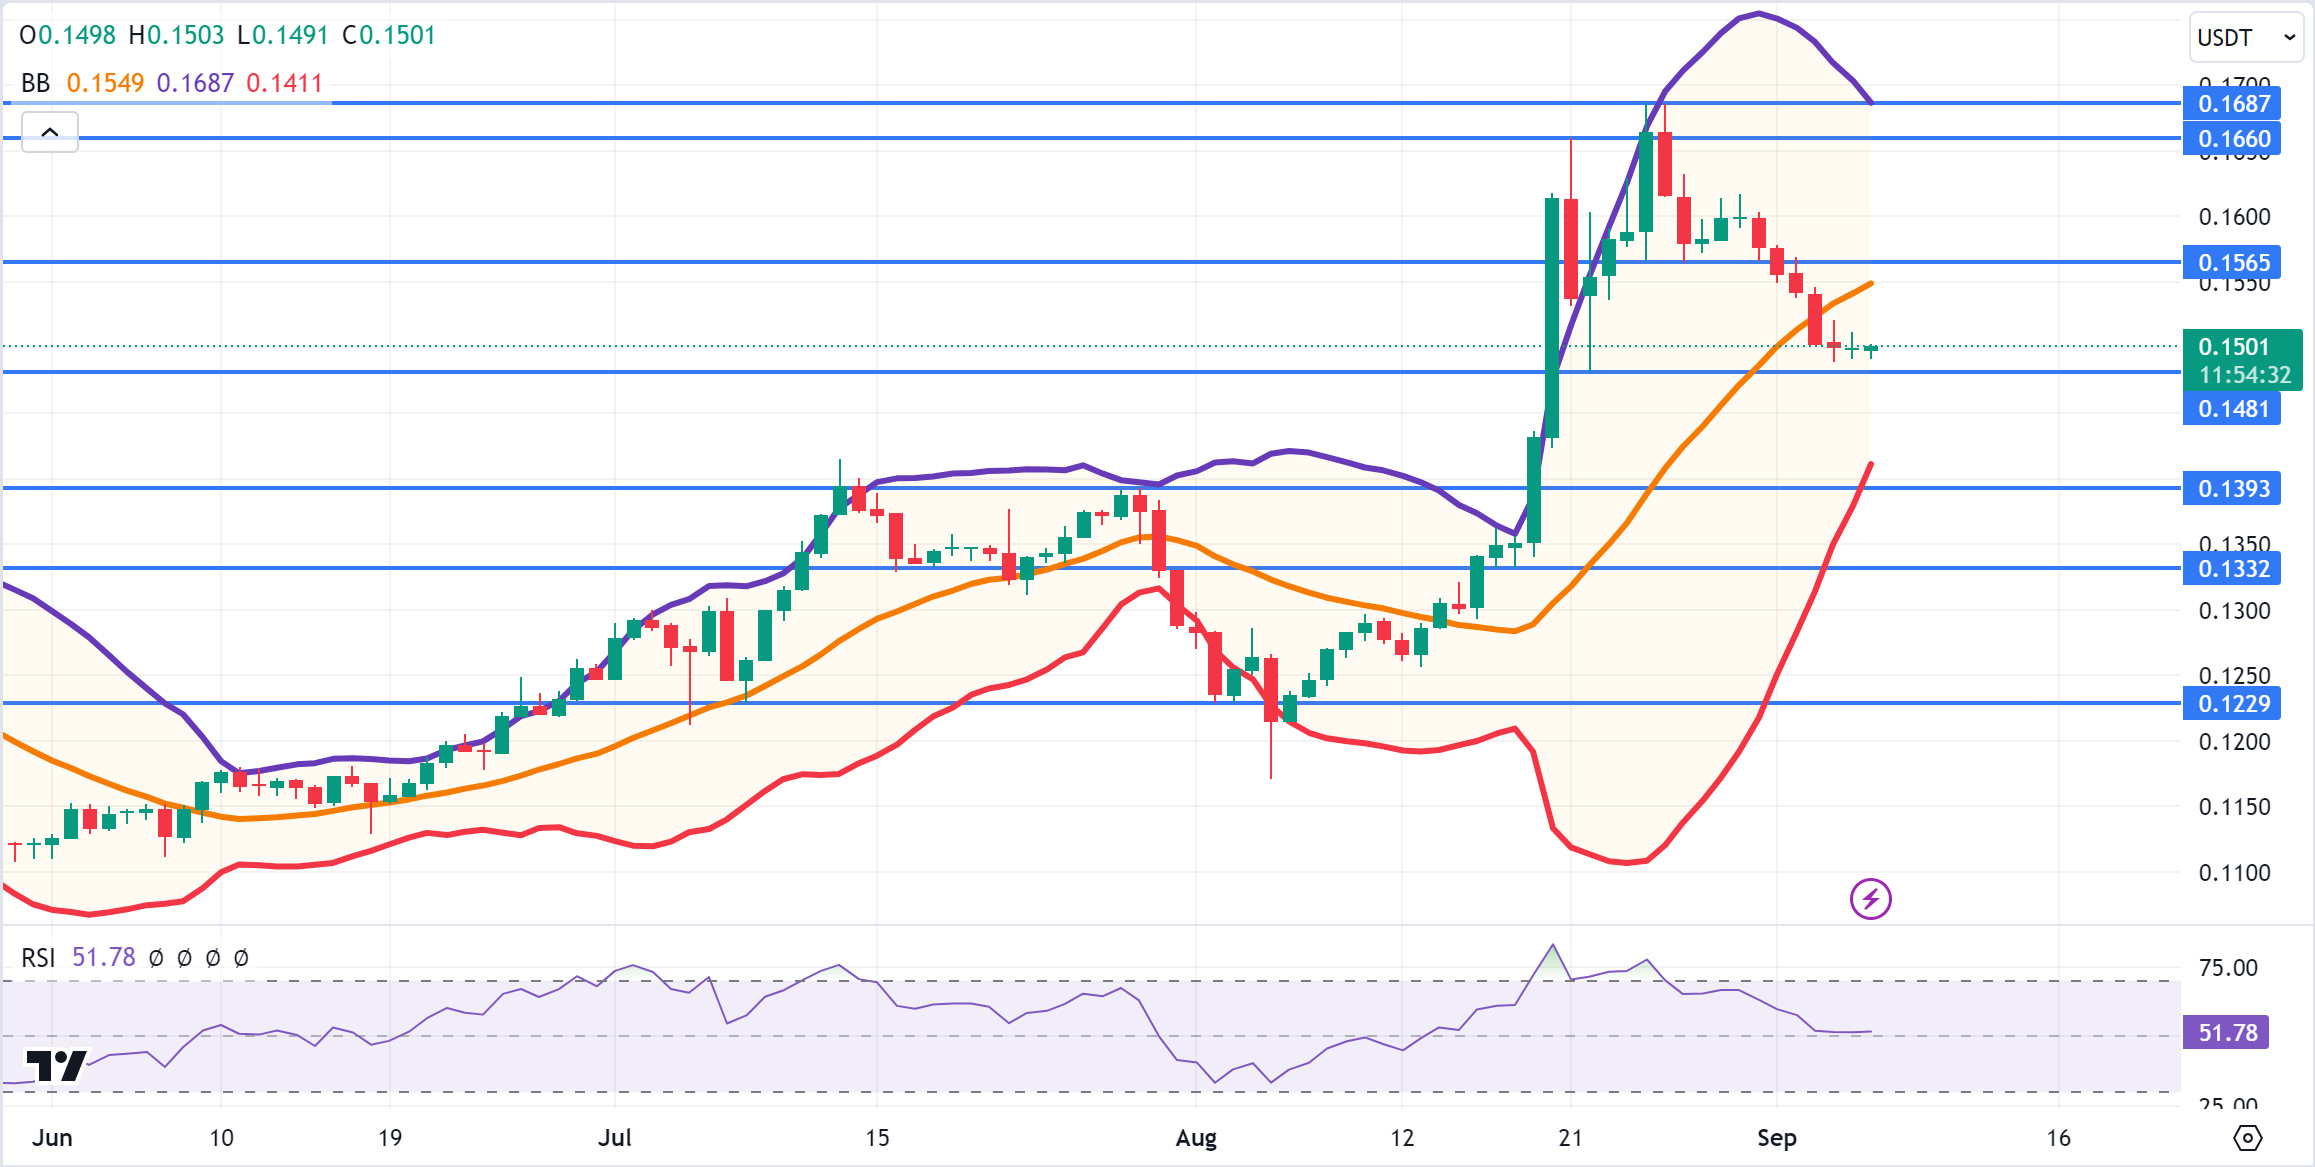
TRX, which started the week at 0.1557, fell about 3.5% during the week and is currently trading at 0.1501.
The US consumer price index, producer price index and unemployment claims will be released next week and we will be closely monitoring these data. These data will have an impact on the market and the data to be released in line with expectations may have a positive impact.
TRX, which is currently priced just below the Bollinger middle band, may move to the upper band with the low inflation data to be announced next week. In such a case, it may test the 0.1660 and 0.1687 resistances. If it cannot break the 0.1565 resistance upwards, it may fall back to the lower Bollinger band with the reaction from here. In this case, it may test 0.1481 and 0.1393 supports. As long as it stays above 0.1229 support on the daily chart, the bullish appetite will continue. If this support is broken, sales may increase.
Supports: 0.1481 – 0.1393 – 0.1332
Resistances: 0.1565 – 0.1660 – 0.1687
XRP/USDT
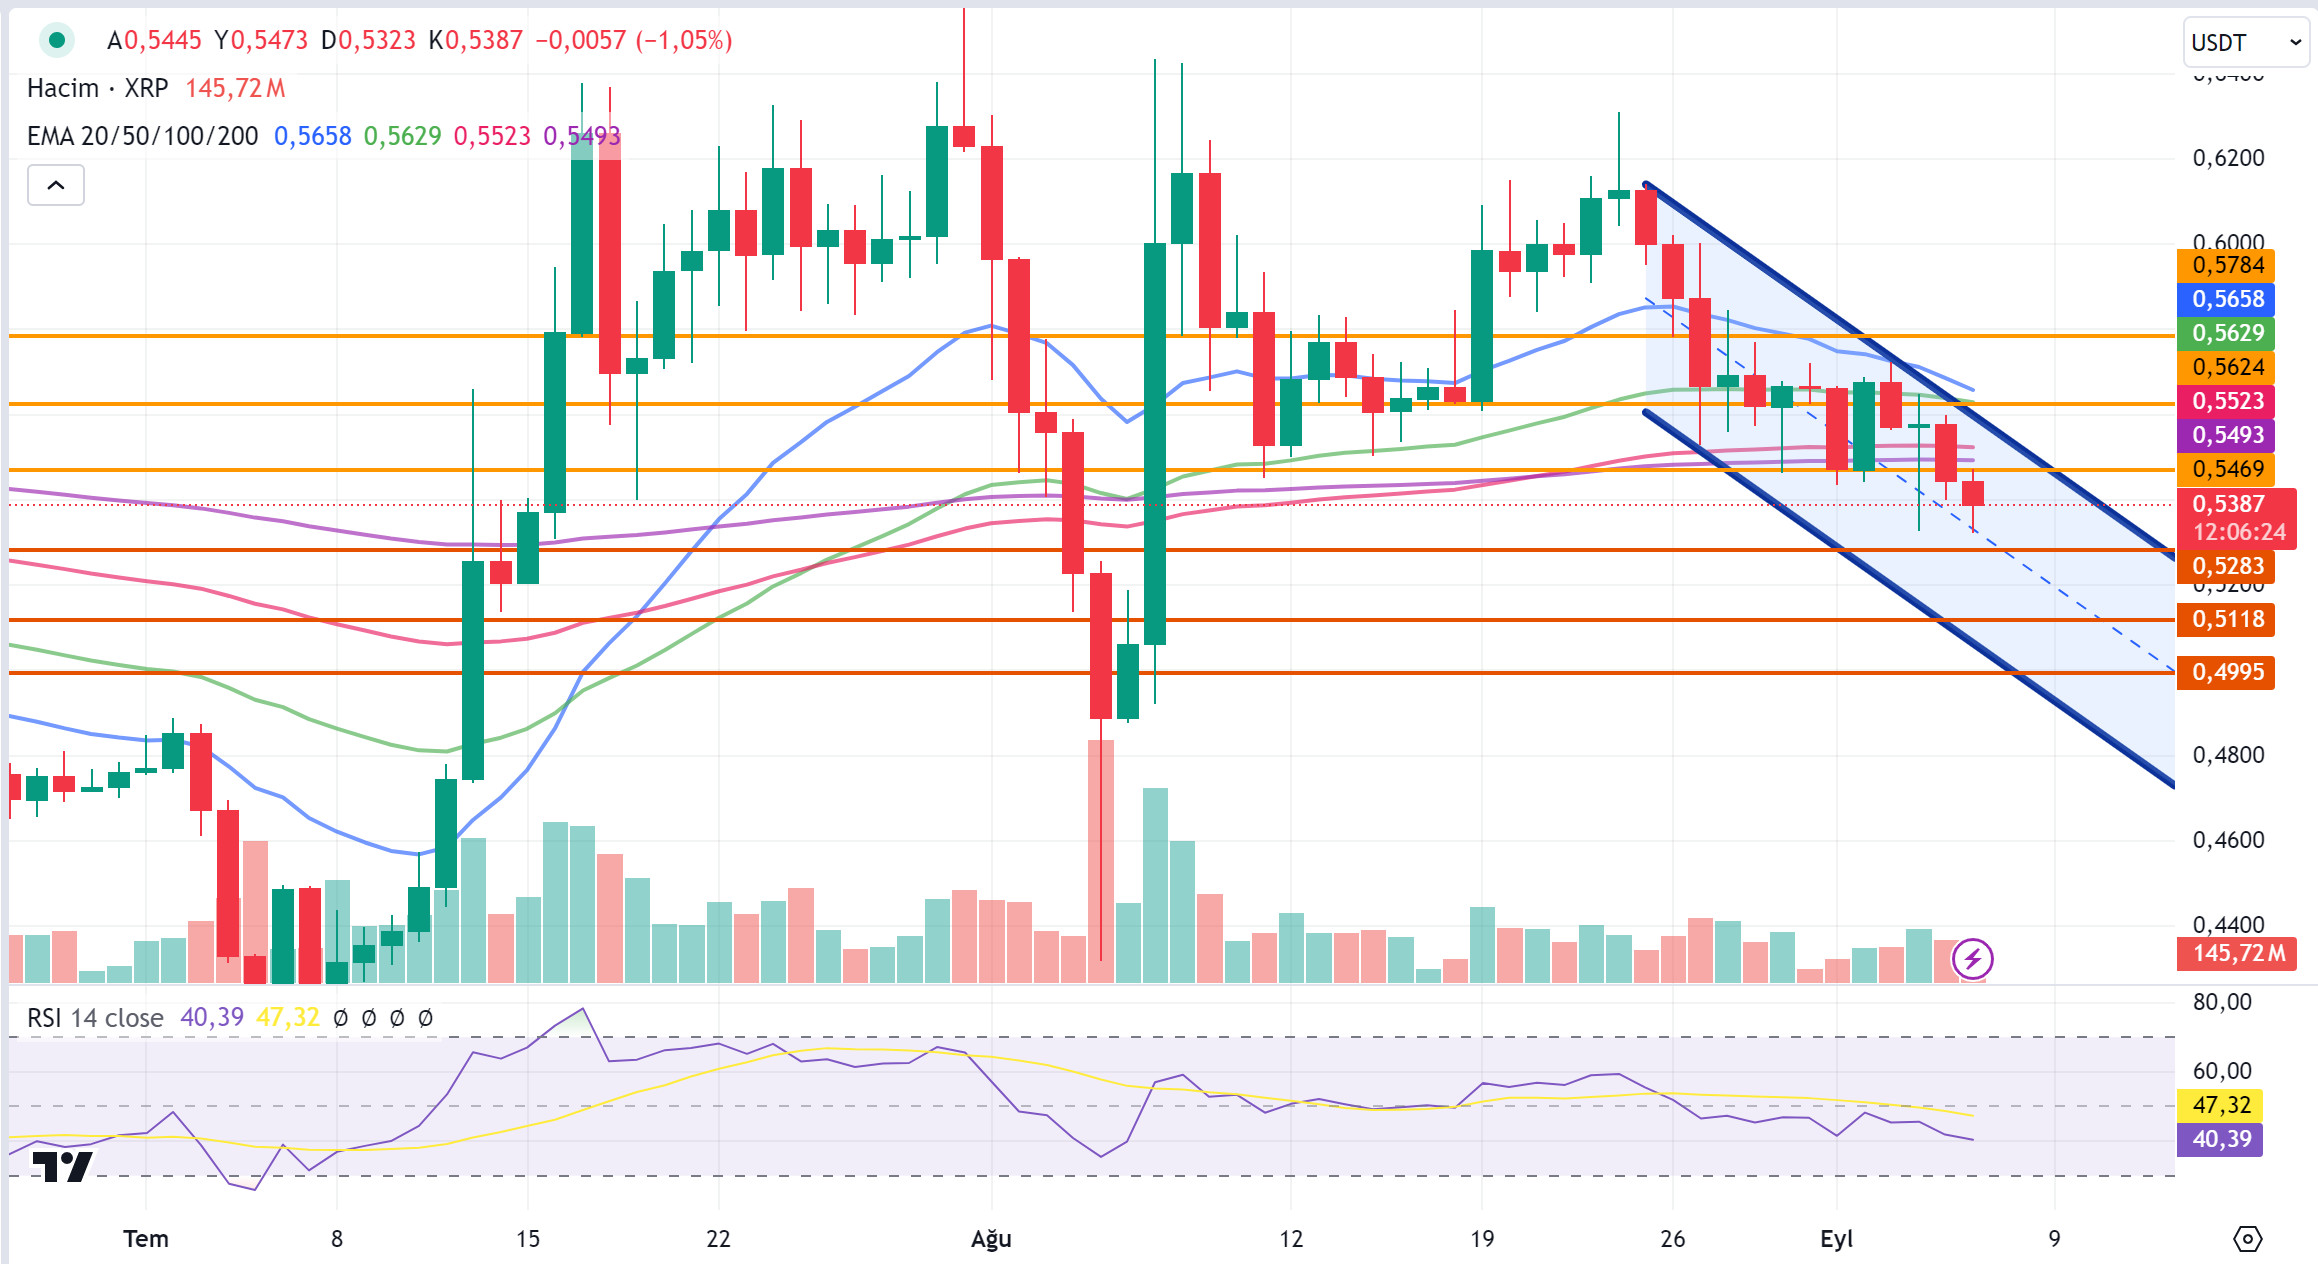
XRP, which fell sharply from 0.5996 to 0.5468 last week, started this week with a rise and rose to 0.5723, then fell with the reaction at this level and continues to be traded at 0.5387 with a weekly loss of about 2%.
With the decline in demand across the crypto market, high volatility and the effect of the decline in stock markets on the crypto market after the Bank of Japan governor stated that the possibility of an interest rate hike due to inflation in the coming period is high, XRP continued to lose value in the downtrend.
US economic data to be released today is important for XRP, which continues to decline after falling below the EMA100 (Maroon Color) and EMA200 (Purple Color) in daily analysis. If the US Non-Farm Payrolls (Aug) and Unemployment Rate (Aug) data, which are important for the crypto market in general, fail to meet the expectations of the crypto market, a decline in XRP may occur and test the support levels of 0.5283-0.5118-0.4995. If the US economic data is positive for the crypto market, XRP may test the resistance levels of 0.5469-0.5624-0.5784. After the release of the data, volatility may occur in the crypto markets.
Supports 0.5283 – 0.5118 – 0.4995
Resistances 0.5469 – 0.5624 – 0.5784
DOGE/USDT
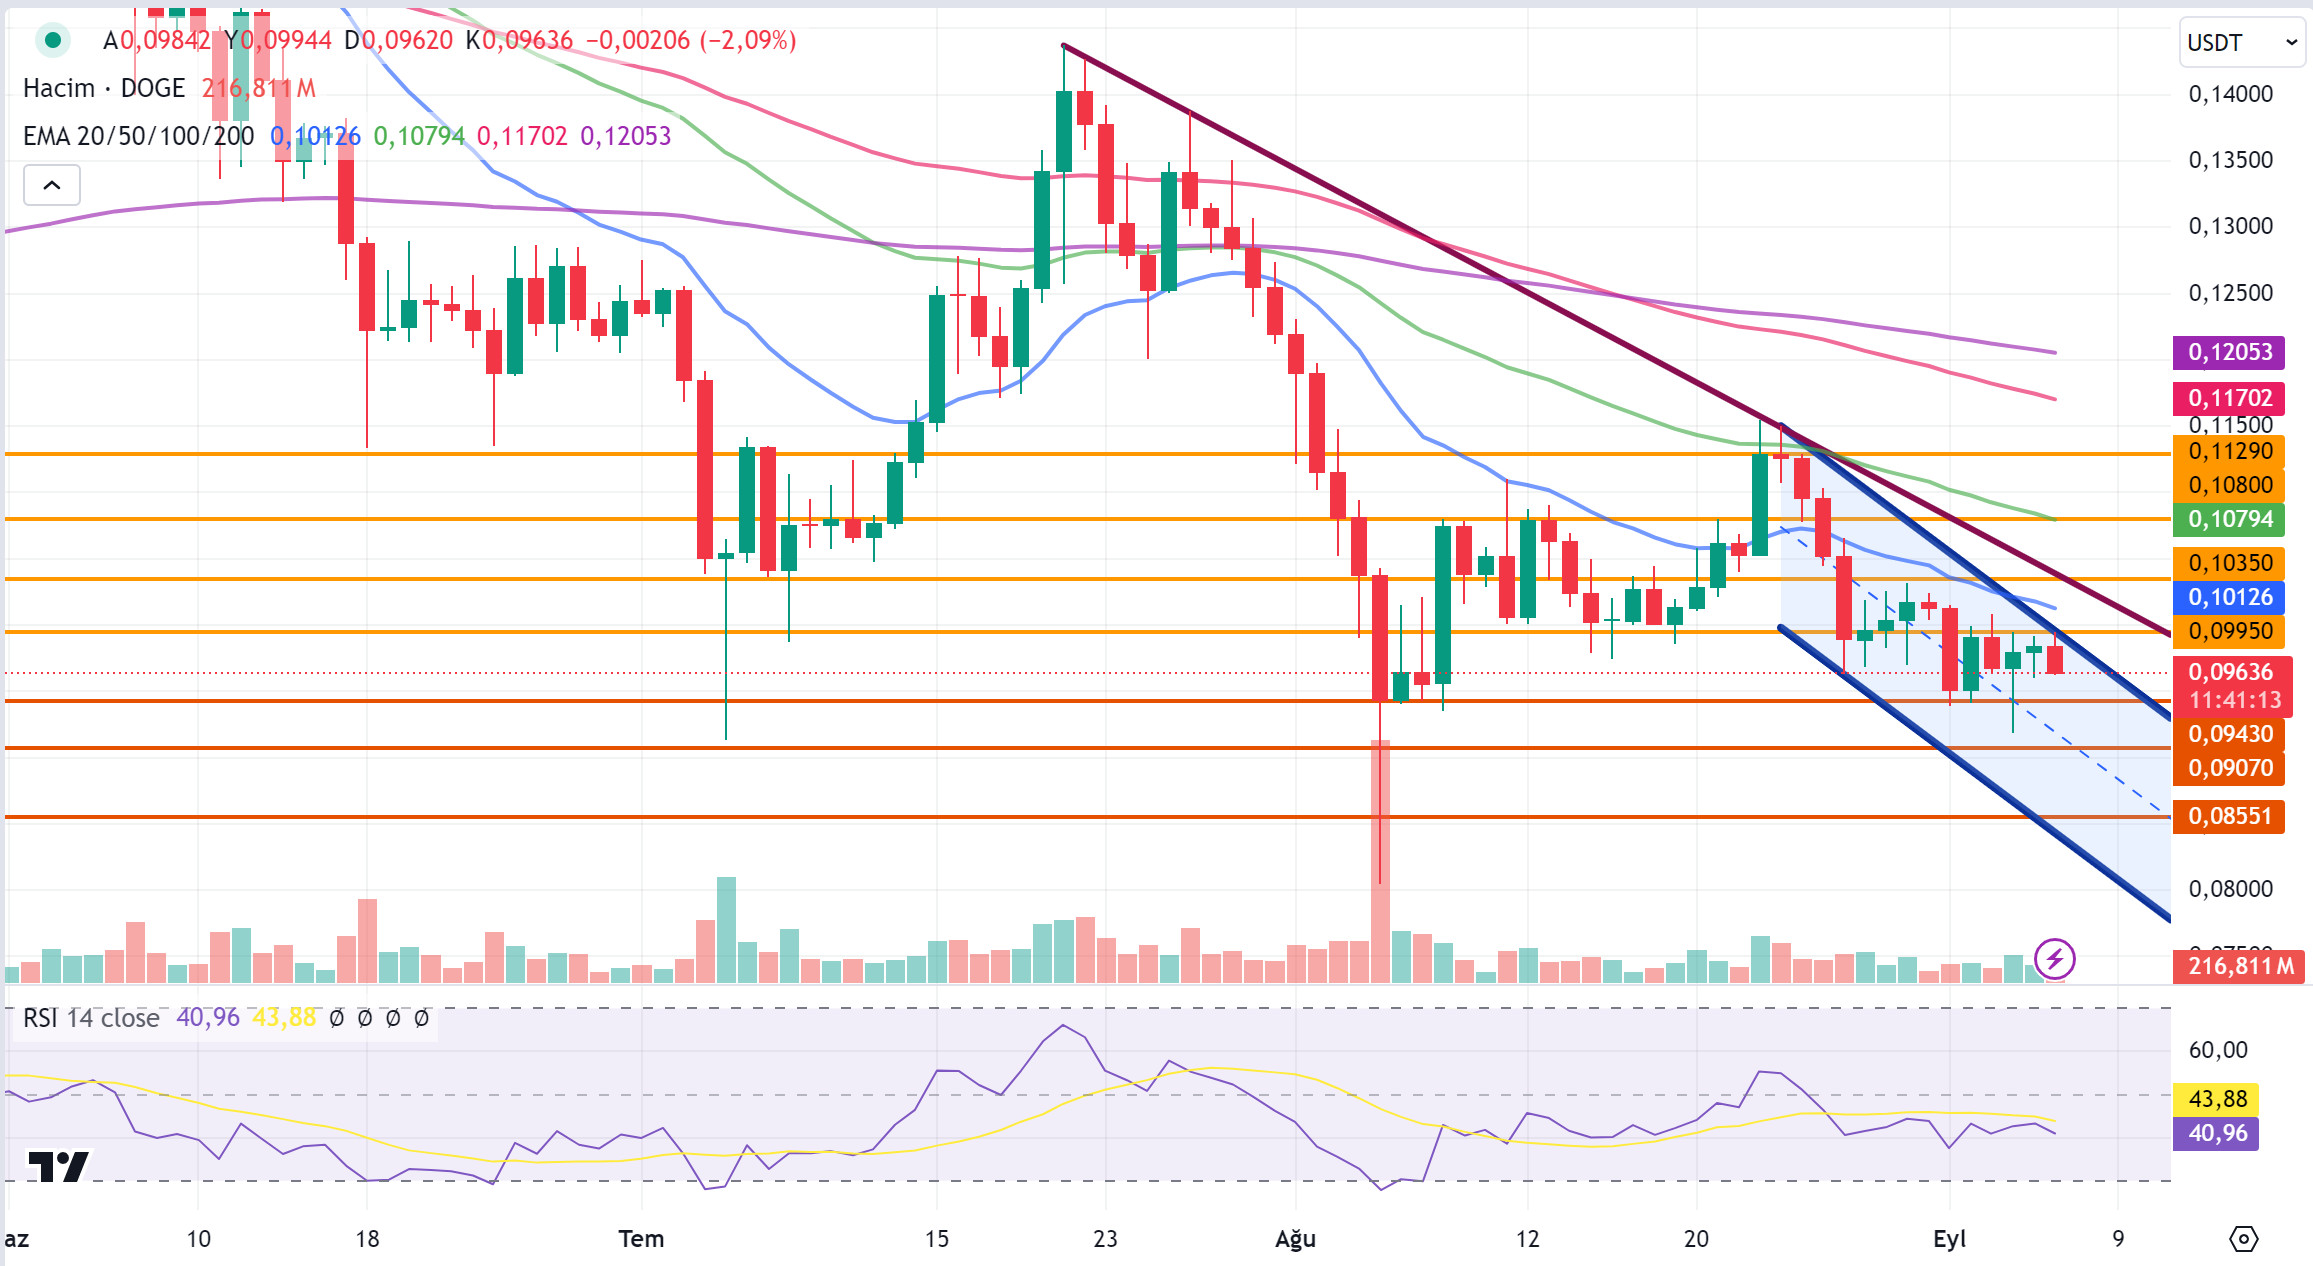
DOGE, which opened this week at 0.0950 with a depreciation of approximately 13.25% last week, rose to 0.0963 with a 1.4% increase in value this week. In daily analysis, the economic data to be announced by the US today is important for DOGE, which moves in a horizontal band after the rise on the first day of the new week after a sharp decline on the closing day of last week.
Non-Farm Employment (Aug) and Unemployment Rate (Aug) data to be announced by the US are critical for the crypto market in general, and the idea that there will be volatility across the crypto market after the data is announced is predominant in the market. In this process, if the economic data to be announced by the US is positive for the crypto market, DOGE, which is expected to rise with the market, may test the resistance levels of 0.0995-0.1035-0.1080. Otherwise, DOGE, which is expected to continue its downtrend if the data is negative for the markets, may test the support levels of 0.0943-0.0907-0.0855.
Supports 0.0943 – 0.0907 – 0.0855
Resistances 0.0995 – 0.1035 – 0.1080
DOT/USDT
This week, Polkadot Hackathon 2024 attracted a lot of interest; 279 developers formed 69 teams and 34 projects were submitted. Polkadot will showcase its innovations in areas such as gaming, DeFi and decentralized governance at the Token 2049 event in Singapore on September 18-19. In addition, the Polkadot-compatible Spend crypto debit card, launched in partnership with Mastercard and Mercuryo, has made crypto assets more accessible for everyday spending.
When we examine the DOT chart, we see that the RSI is positive while the price is negative. With this positive compatibility, we can say that buyer pressure is increasing on MACD. In the positive scenario, if the price moves above the 4.226 support band and provides persistence, its next target may be 4.918 resistance. In the negative scenario, we see that sellers are more dominant on the CMF (Chaikin Money Flow) oscillator. If the price moves below the 4.226 support band, a retracement towards 3.713 levels may be seen.
Supports 4,226 – 3,713 – 3,551
Resistances 4.918 – 5.889 – 6.684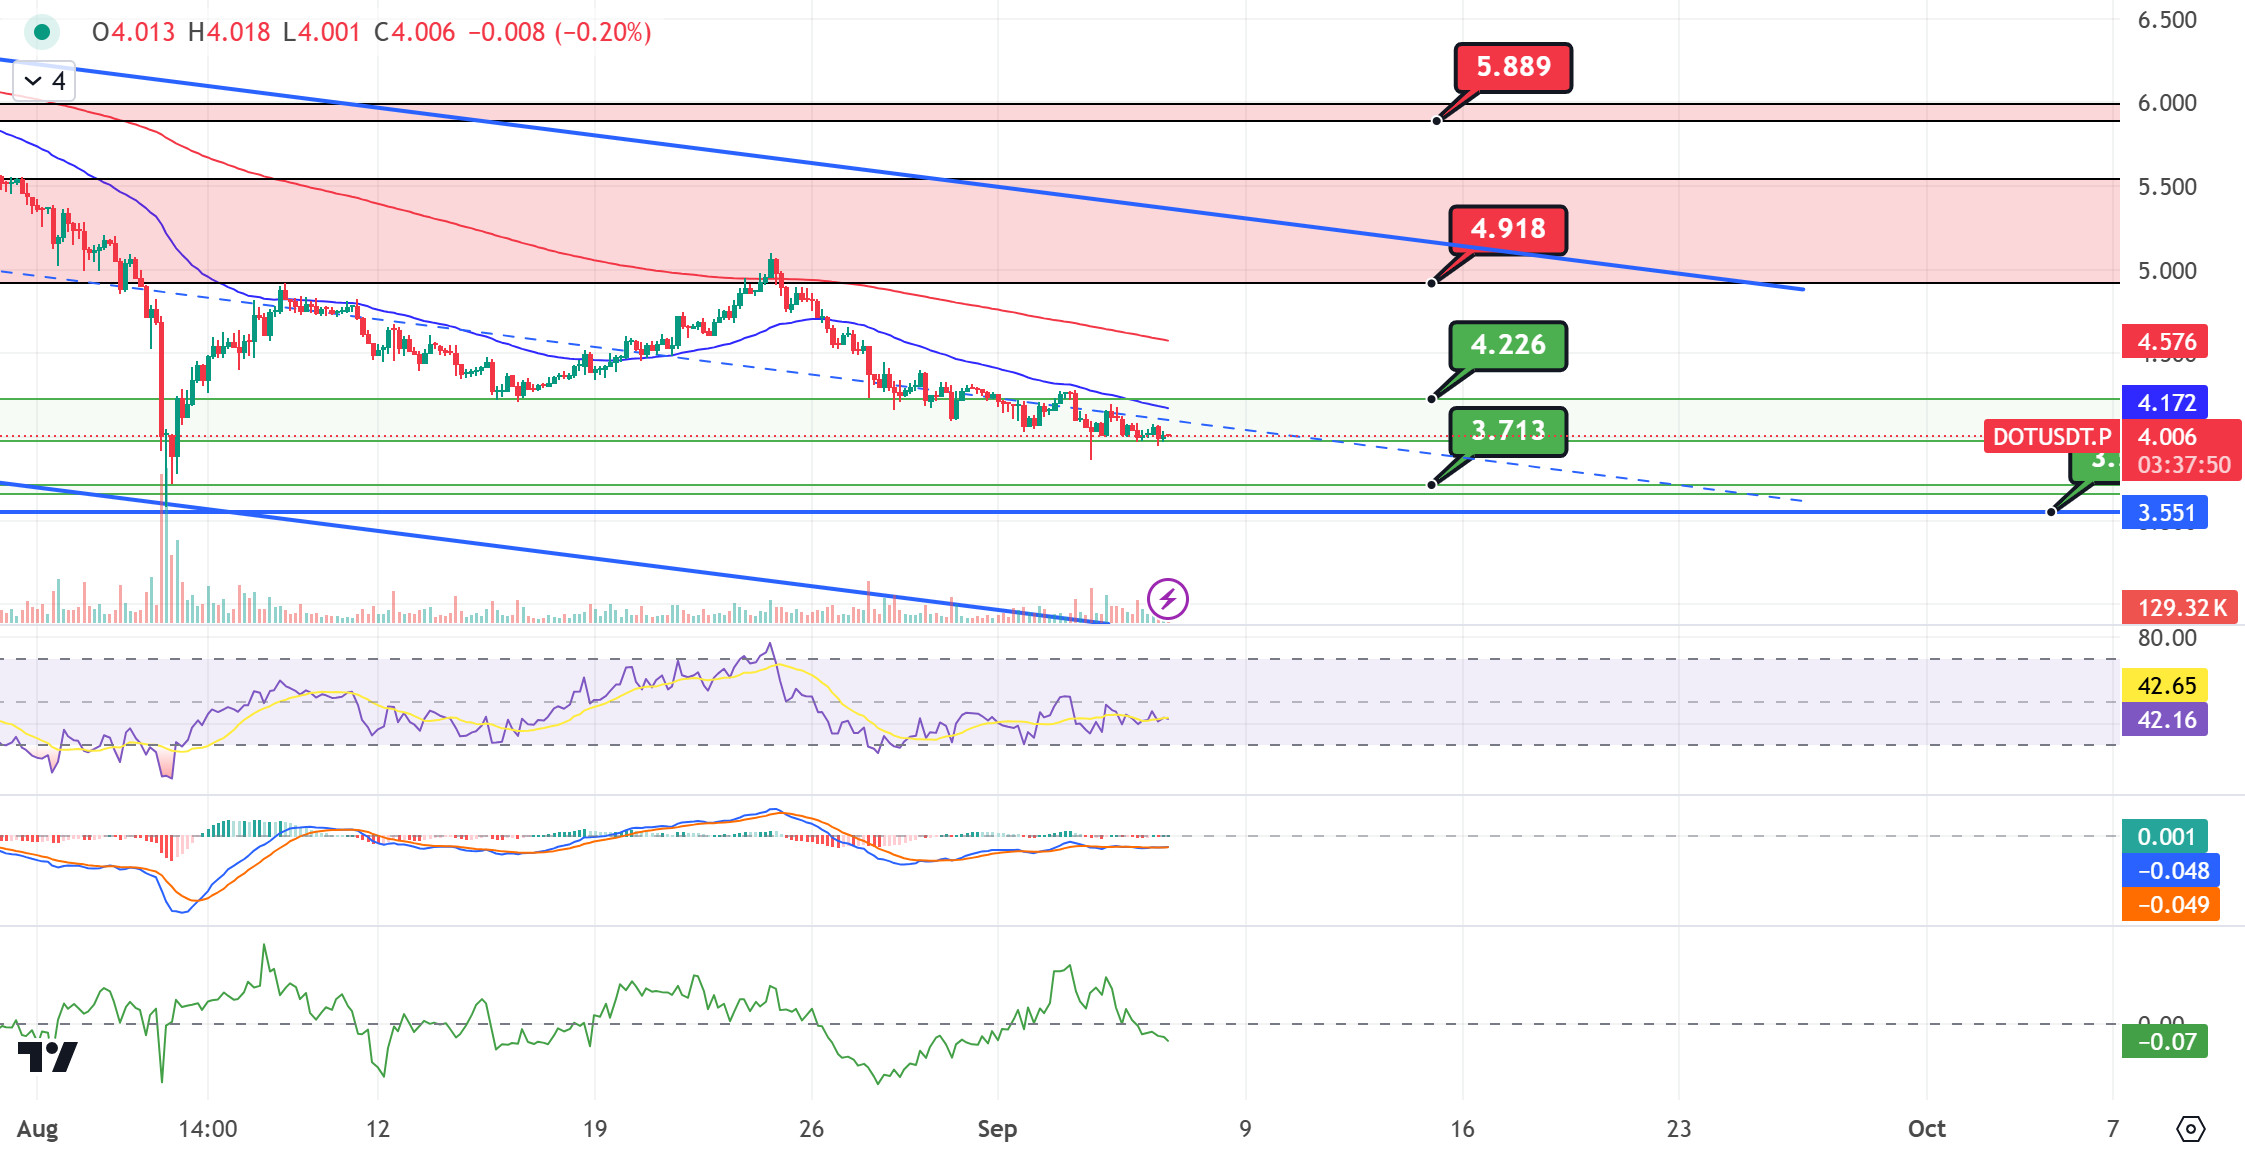
SHIB/USDT
This week, Shiba Inu (SHIB) has been marked by large investor activity, while price action has seen pullbacks. Shiba Inu released its new game “Agent Shiboshi” on the iOS platform, but the community criticizes the game’s lack of focus on the token burning mechanism. Also, the community is voting on how to handle SHIB burning and the donation from Welly’s fast food chain. The Shiba Inu team aims to support the long-term growth of the ecosystem by introducing a new DevPortal that will streamline the dApp process for developers.
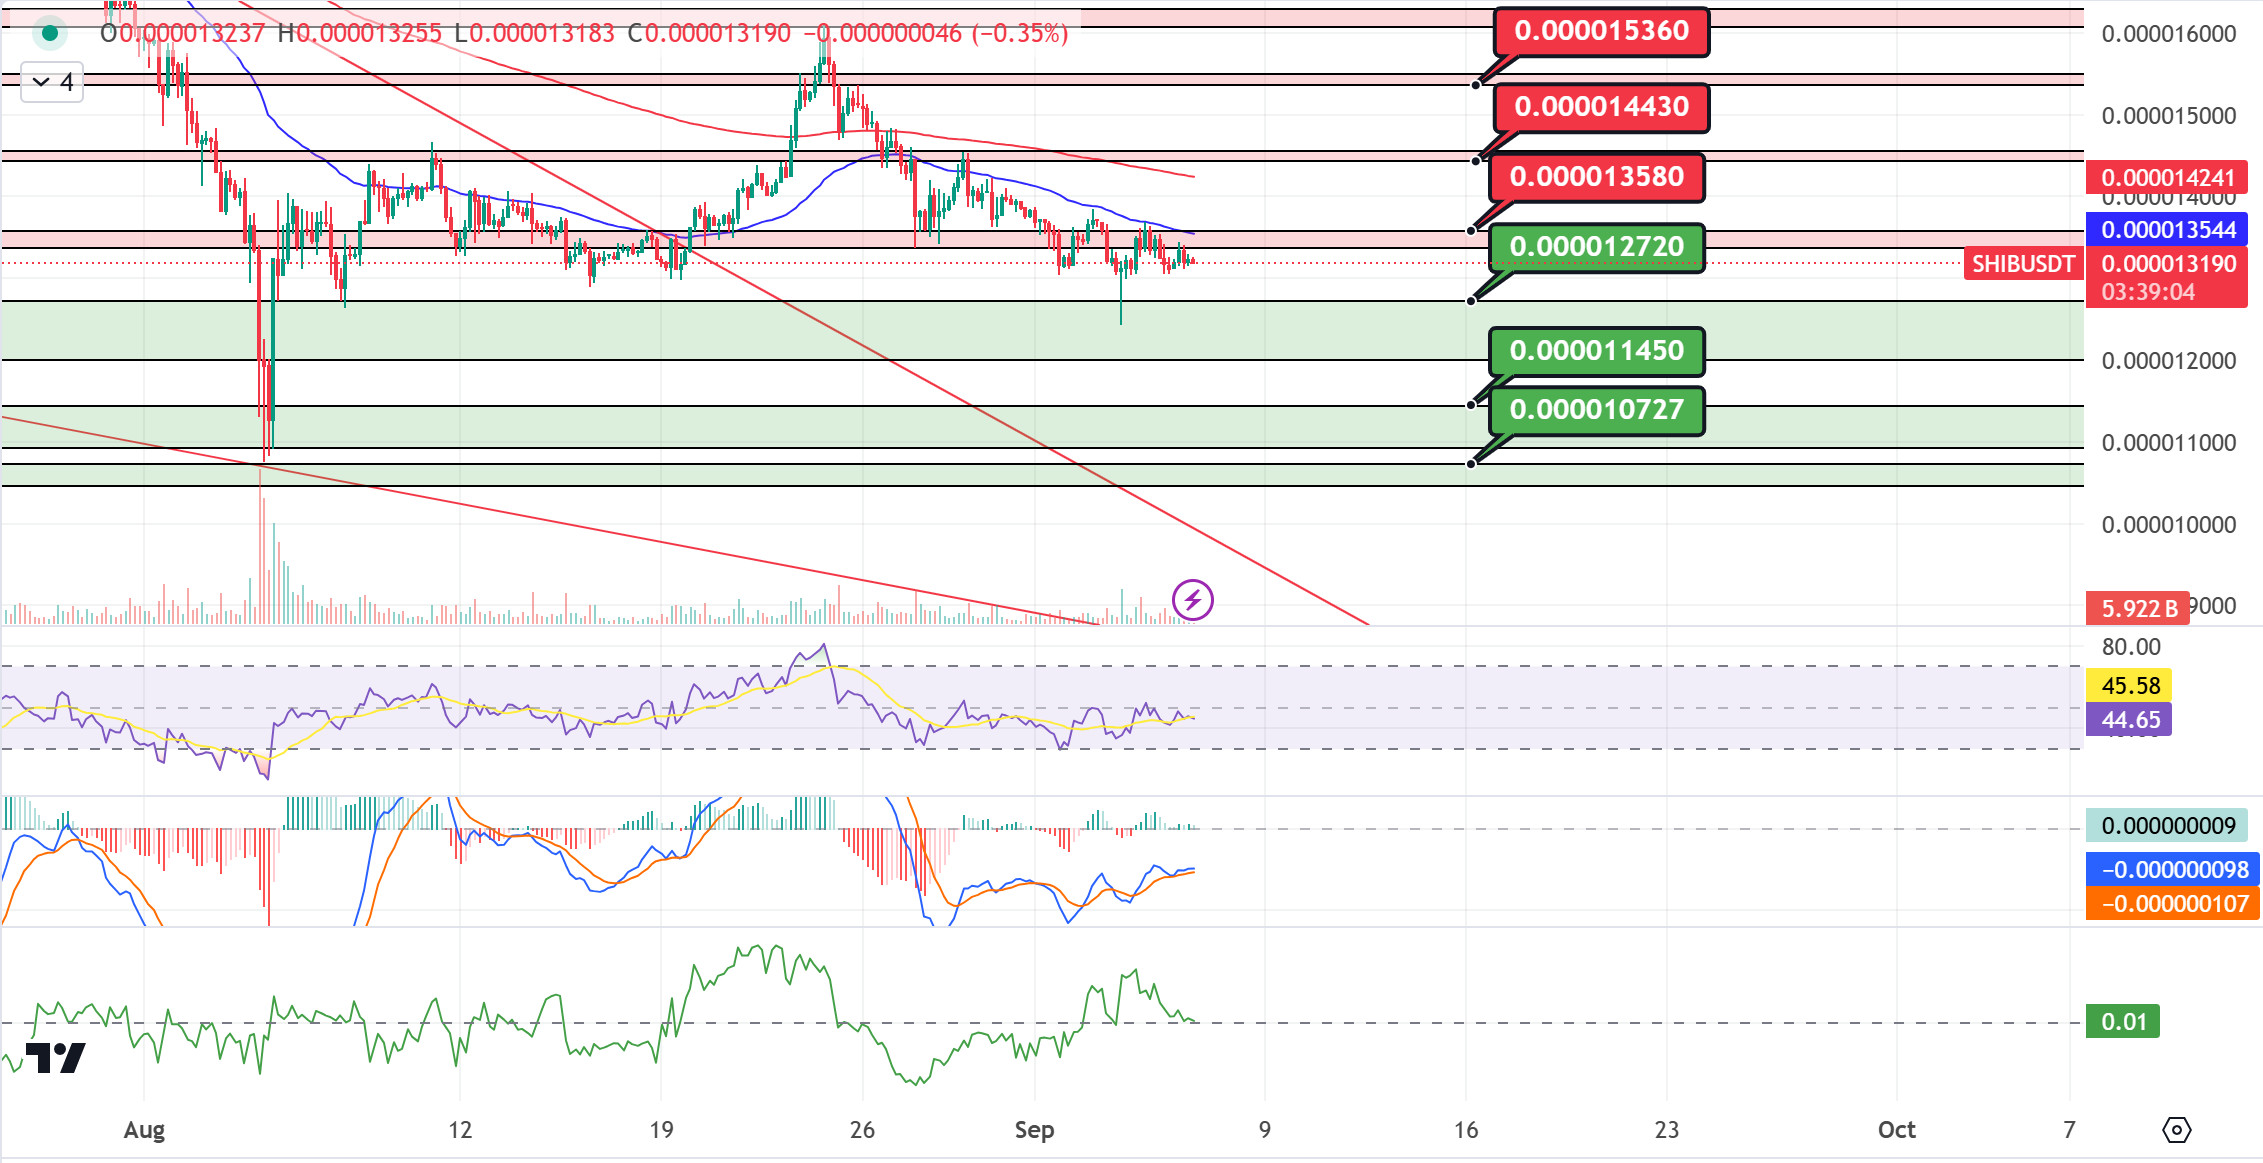
Analyzing the SHIB chart, we can see that the price has retreated compared to last week. The price broke the 0.00001358 support level downwards. When we examine the MACD and CMF (Chaikin Money Flow) oscillators, we can say that the buying pressure increased. In this context, if the price breaks the selling pressure at 0.00001358, a movement towards 0.00001443 levels can be seen. On the other hand, in the negative scenario, the price may be expected to react from 0.00001272 levels.
Supports 0.00001072 – 0.00001272 – 0.00001145
Resistances 0.00001358 – 0.00001443 – 0.00001536
DARKEX RESEARCH DEPARTMENT CURRENT STUDIES
*In addition to the daily bulletins, special reports prepared by the Research Department will be shared in this section.
INFORMATION
The calendar is based on UTC (Coordinated Universal Time) time zone. The calendar content on the relevant page is obtained from reliable data providers. The news in the calendar content, the date and time of the announcement of the news, possible changes in the previous, expectations and announced figures are made by the data provider institutions.
Darkex cannot be held responsible for possible changes arising from similar situations. You can also check the Darkex Calendar page or the economic calendar section in the daily reports for possible changes in the content and timing of data releases.
LEGAL NOTICE
The investment information, comments and recommendations contained in this document do not constitute investment advisory services. Investment advisory services are provided by authorized institutions on a personal basis, taking into account the risk and return preferences of individuals. The comments and recommendations contained in this document are of a general type. These recommendations may not be suitable for your financial situation and risk and return preferences. Therefore, making an investment decision based solely on the information contained in this document may not result in resu


