
Fear & Greed Index
Source: Alternative
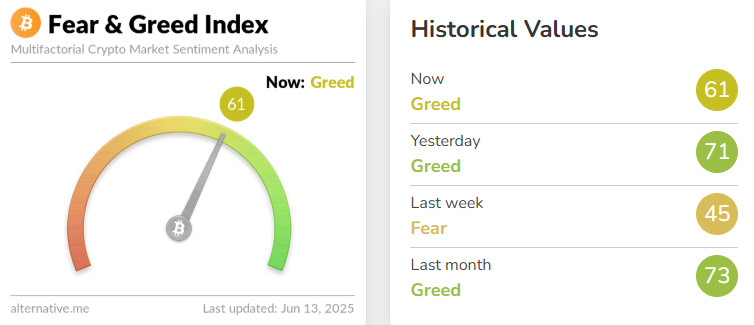
Change in Fear and Greed Value: +16
Last Week’s Level: 45
This Week’s Level: 61
The Fear and Greed Index rose from 45 to 61 this week, indicating a significant recovery in market sentiment. Lower-than-expected inflation data in the US boosted risk appetite by reinforcing expectations of monetary policy easing. CPI came in at 2.4% yoy and 0.1% mom, while PPI was realized below expectations. In addition to macroeconomic developments, the tariff agreement between the US and China reduced global trade uncertainty and supported market sentiment. These factors were effective in the rise in the index. On the institutional side, Strategy’s 1,045 BTC and GameStop’s 4,710 BTC purchases revealed that market confidence continued among institutional investors. At the end of the week, Israel’s airstrike on Iran and the state of emergency declared in the country had a negative impact on the markets by increasing the perception of geopolitical risk. Despite this, the Fear and Greed Index rose from 45 to 61, indicating a recovery in market sentiment.
Fund Flows
Source: CoinShares
Overview
The crypto market has been volatile this week. Macroeconomic uncertainties and regulatory news increased volatility. War tensions in the Middle East and customs uncertainties between China and the US affected Bitcoin. After the tension between Trump and Elon Musk, optimistic calls from both sides created optimism.
Fund Outflows
Bitcoin (BTC)
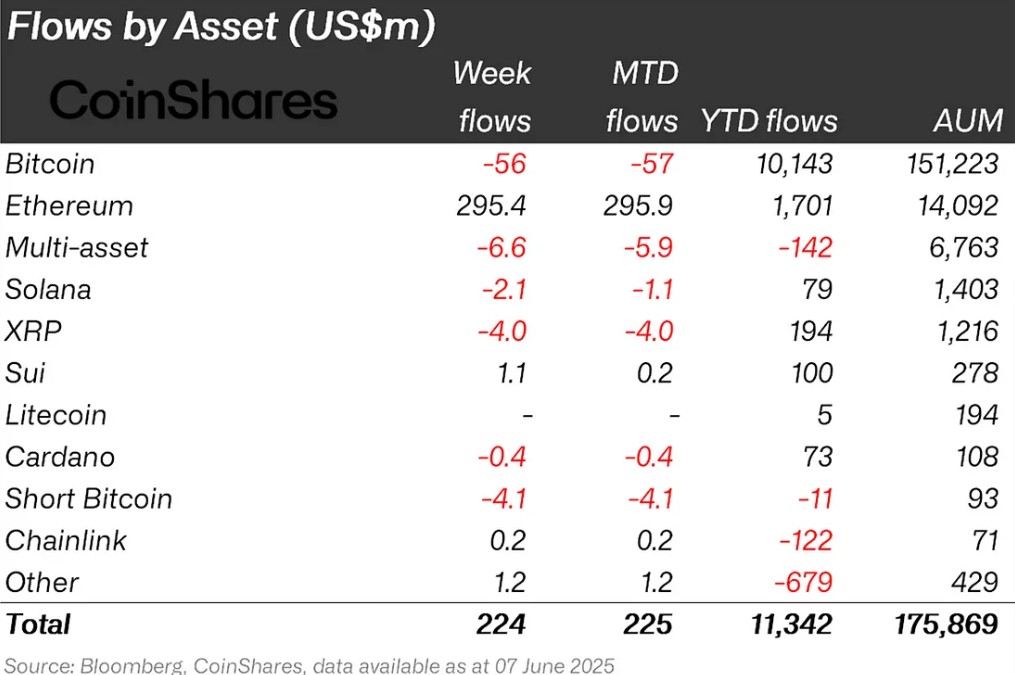
With all these developments, Bitcoin also declined after approaching the ATH level and this situation brought fund outflows. Bitcoin fund outflows are at $56 million this week.
Multi-asset: Despite the ETF data in terms of the general mood of the market, there are also outflows in the multi-asset group.
Short Bitcoin: Short Bitcoin positions totaled $4.1 million in outflows against ATH expectations. With the recent decline, this situation can be expected to reverse in liquidation data.
Ripple (XRP): The lawsuit between Ripple and the SEC could change the course of fund flows in the coming days. This week, XRP is on the fund outflow list with $4 million.
Solana (SOL): SG Forge announced it will issue dollar stablecoins on the Solana network. SEC requested an update on spot ETF documents. Although the probability of approval increased, there was an outflow of $2.1 million from Solana.
Cardano (ADA): Charles Hoskinson announced a new Bitcoin DeFi protocol called “Cardinal”. Despite this, the general market sentiment turned negative, leading to a $0.4 million outflow from ADA.
Fund Inputs:
Ethereum (ETH): Spot ETFs in the rest of the report showed a strong performance with institutional interest. A total of $295.4 million flowed into Ethereum this week.
SUI: Vulnerability closed after Cetus attack. Announced partnership with Real Vision. These developments brought in 1.1 million dollars to SUI.
Chainlink (LINK): Chainlink completes cross-chain delivery test with JPMorgan and Ondo Finance. Cooperation with Chainlink was announced in the Hong Kong CBDC pilot. These developments brought LINK $0.2 million in inflows.
Other: Altcoins, on the other hand, saw upward attacks on a project and sectoral basis from time to time. These attacks brought an inflow of 1.2 million dollars in fund flow data.
Total MarketCap
Source : Tradingview
“Totalmarketcap – named image to be added”
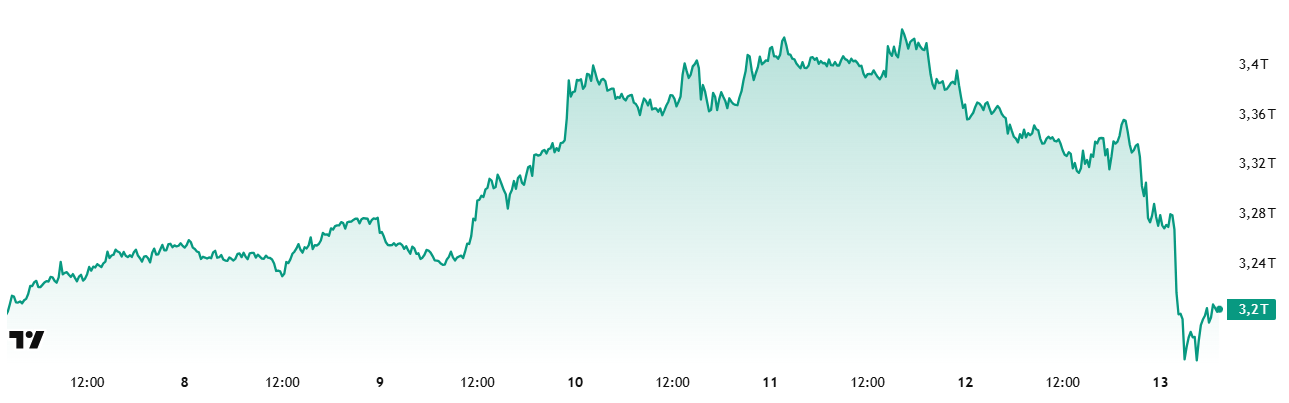
- Last Week Market Capitalization :26 trillion Dollars
- Market Capitalization This Week:20 Trillion Dollars
The cryptocurrency market lost 1.53% this week with a meltdown of $49.68 billion. This brought the total market capitalization down to $3.20 trillion. This was the latest in a series of three consecutive weekly declines. Although this move may seem like a short-term correction from a technical point of view, the Israeli-Iranian tensions had a serious impact on the market. The course of this tension in the coming period stands out as one of the most critical factors that will continue to have an impact on the market.
Total 2
Total 2 started the new week with a market capitalization of 1.15 trillion dollars and lost 25.4 billion dollars, down 2.20%. With this movement, it fell to $ 1.13 trillion. Total 2, which experienced a higher decline compared to Total Market’s overall decline rate, shows that the retreat in altcoins is more severe compared to Bitcoin. In short, there was more bloodshed on the altcoin side.
Total 3
Total 3, which started the week at $ 850.59 billion, retreated by 2.98% to $ 825.22 billion with a loss of $ 25.37 billion on a weekly basis.
Bitcoin Dominance
Source: Tradingview
Bitcoin Dominance
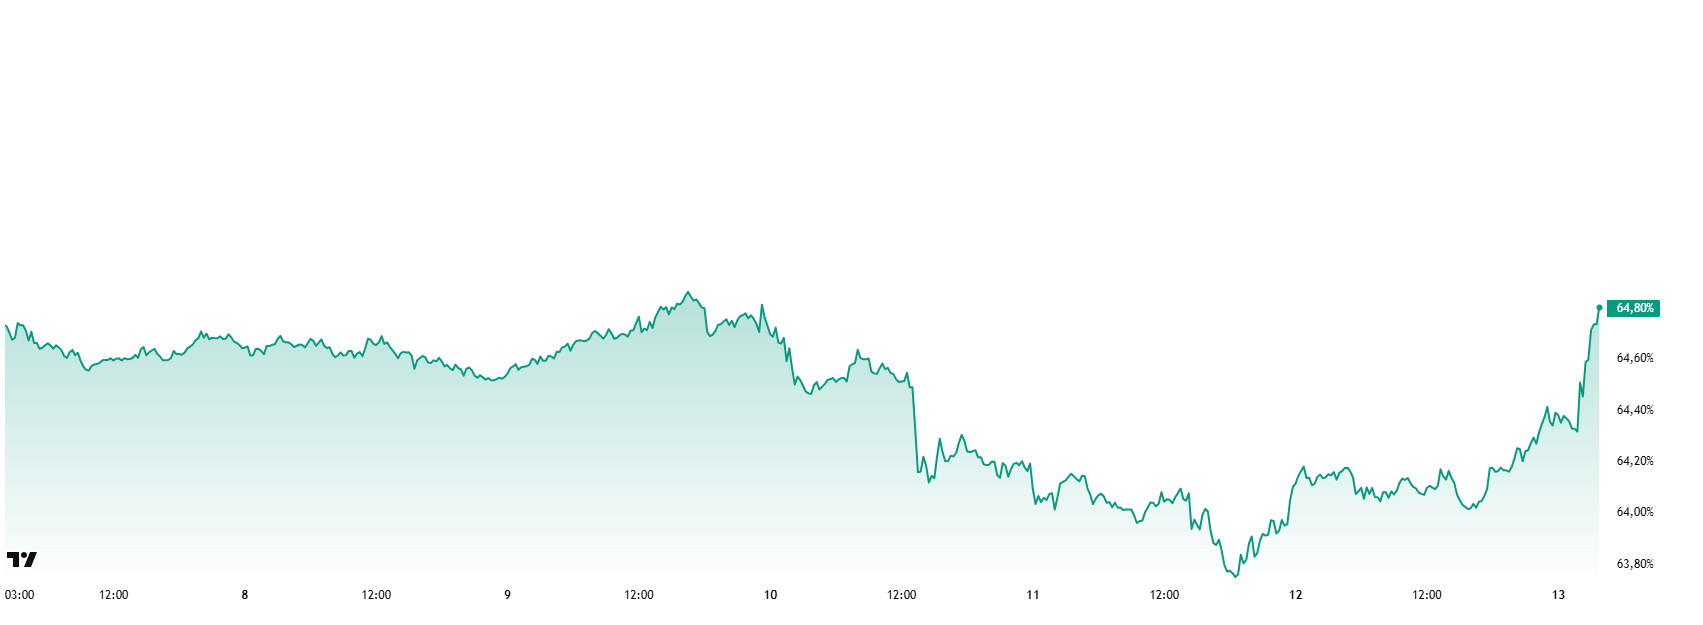
Bitcoin dominance, which started the week at 64.57%, retreated towards the middle of the week and fell to 63.76%. After this correction, the dominance, which entered the recovery process, is currently at 64.80%.
1,045 shares of Bitcoin were bought by Strategy and 118 shares were bought by KULR Technology this week.
Data on Bitcoin spot ETFs show a total net inflow of $1.07 billion to date.
Towards the end of the week, Israel’s airstrikes against Iran brought geopolitical risks back to the agenda, which increased the selling pressure on risky assets.
Many altcoins, especially Ethereum, performed strongly in the Bitcoin parity in the first part of the week, leading to an increase in altcoin dominance. However, tensions in the Middle East led to selling pressure across the market. While this pressure affected altcoins more, Bitcoin, which is seen as a relatively safer haven, experienced a more limited depreciation in this process. This led to a sharp rise in Bitcoin dominance.
Continued institutional buying, strong net inflows into spot ETFs, and increased risk aversion due to geopolitical risks led to a rebalancing of capital back towards Bitcoin. In this context, given the cautious stance of market participants and the weakening risk appetite, Bitcoin dominance is expected to follow a horizontal-volatile course in the range of 64%-66% next week.
Ethereum Dominance
Source: Tradingview
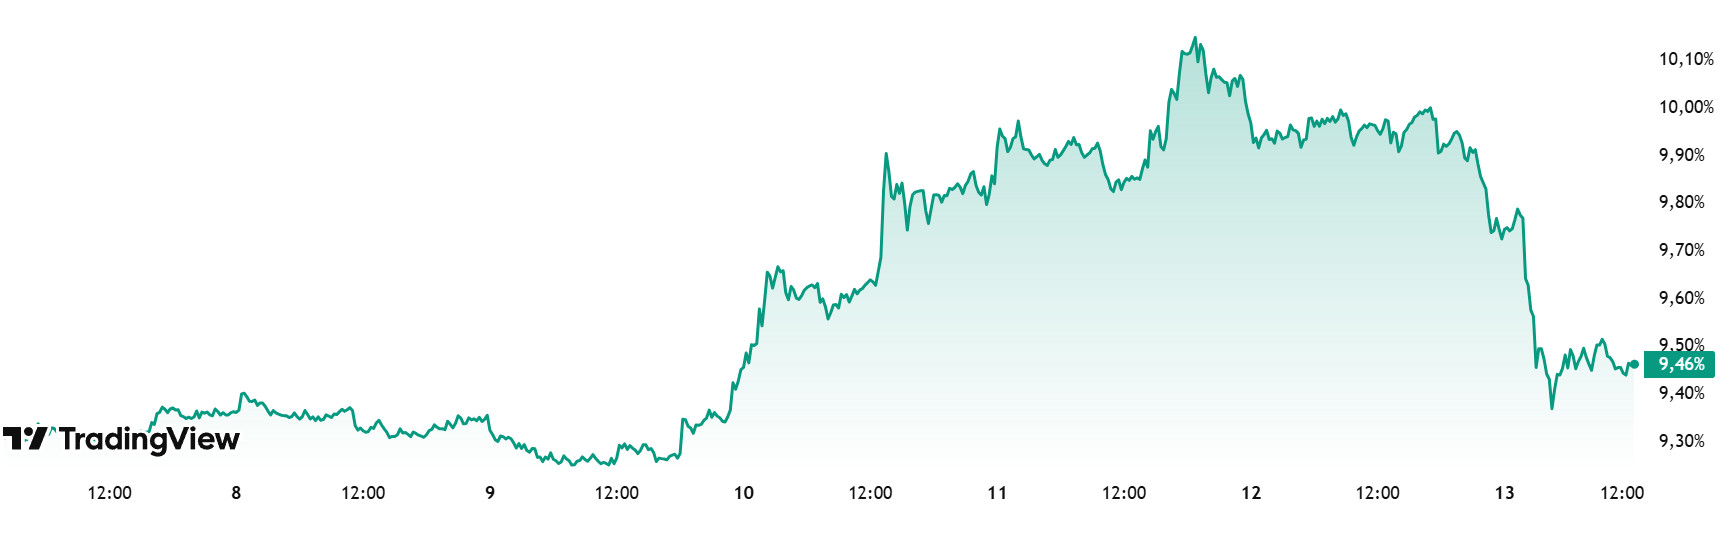
Weekly Change
- Last Week’s Level: 9.31%
- This Week’s Level: 9.46%
Ethereum dominance continued its upward trend, which started at around 7% as of April, and reached up to 10% as of the current week. However, the dominance, which could not exceed these levels, has generally followed a horizontal course in the last five weeks. In the current week, positive movements were recorded.
In this context, Ethereum dominance ended last week at 9.31% and is currently trading at 9.46%.
In the same period, Bitcoin dominance, similar to Ethereum, displayed a positive outlook and showed an upward trend.
On the other hand, Glassnode data revealed that the implied volatility of Ethereum’s short-term options rose sharply in the middle of the week. Along with this volatility increase, Ethereum dominance has also seen accelerated and positive movements.
Bitcoin Spot ETF
Source: SosoValue
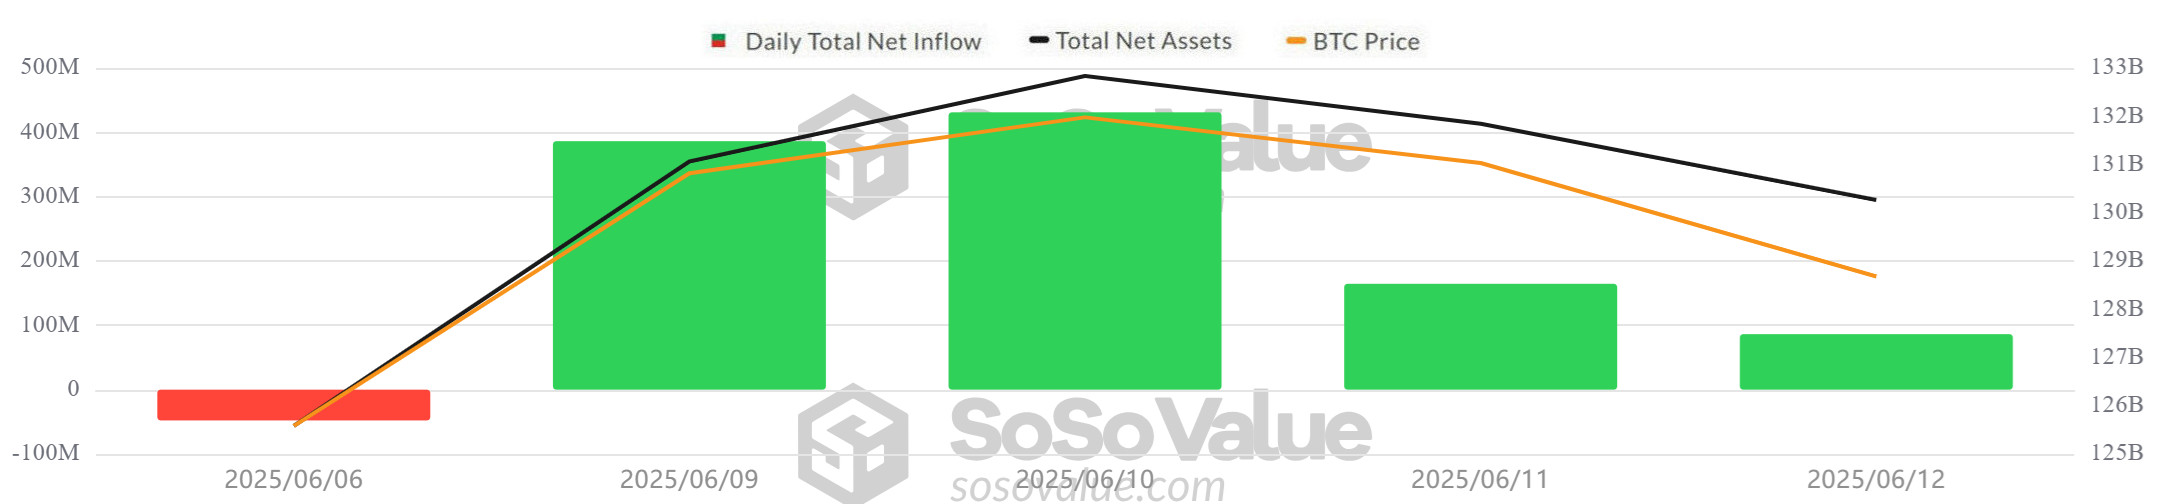
NetFlow Status: Spot Bitcoin ETFs saw a total net inflow of $1.02 billion between June 06-12, 2025. The highest daily inflow of the week was $431.2 million on June 10. While BlackRock’s IBIT ETF featured strong inflows totaling $746.4 million, the $197.2 million outflow from the Fidelity FBTC ETF on June 12 was noteworthy.
Bitcoin Price: Bitcoin, which opened at $ 101,508 on June 6, closed at $ 105,671 on June 12. In this process, it gained 4.1% in total. The strongest daily rise took place on June 9 with an increase of 4.28%. After the rise exceeding the $ 110,000 level, there was a retreat of about 4% with the sales on June 11-12 and fell below the $ 106,000 level.
Cumulative Net Inflows: The total cumulative net inflows of spot Bitcoin ETFs rose to $45.29 billion as of the 356th trading day.
| DATE | COIN | Open | Close | Change % | ETF Flow (mil$) |
|---|---|---|---|---|---|
| 06-Jun-25 | BTC | 101,508 | 104,288 | 2.74% | -47.8 |
| 09-Jun-25 | 105,734 | 110,263 | 4.28% | 386.2 | |
| 10-Jun-25 | 110,263 | 110,274 | 0.01% | 431.2 | |
| 11-Jun-25 | 110,274 | 108,645 | -1.48% | 164.6 | |
| 12-Jun-25 | 108,645 | 105,671 | -2.74% | 86.3 | |
| Total for 06 – 12 Jun 25 | 4.10% | 1020.5 |
Institutional investor interest in Spot Bitcoin ETFs between June 06-12, 2025 has strengthened again. Especially after the negative flows in the previous period, there was a significant recovery in this period. Despite a limited outflow on June 6, ETFs experienced uninterrupted inflows in the following four trading days, bringing the positive flow streak to four days. ETF inflows, which followed a parallel course with the rise in Bitcoin price, confirmed that institutional buying appetite continued. In the coming period, especially the course of geopolitical risks and the clarification of macroeconomic developments will continue to be decisive in terms of the continuity of demand for Spot Bitcoin ETFs.
Ethereum spot ETF
Source: SosoValue
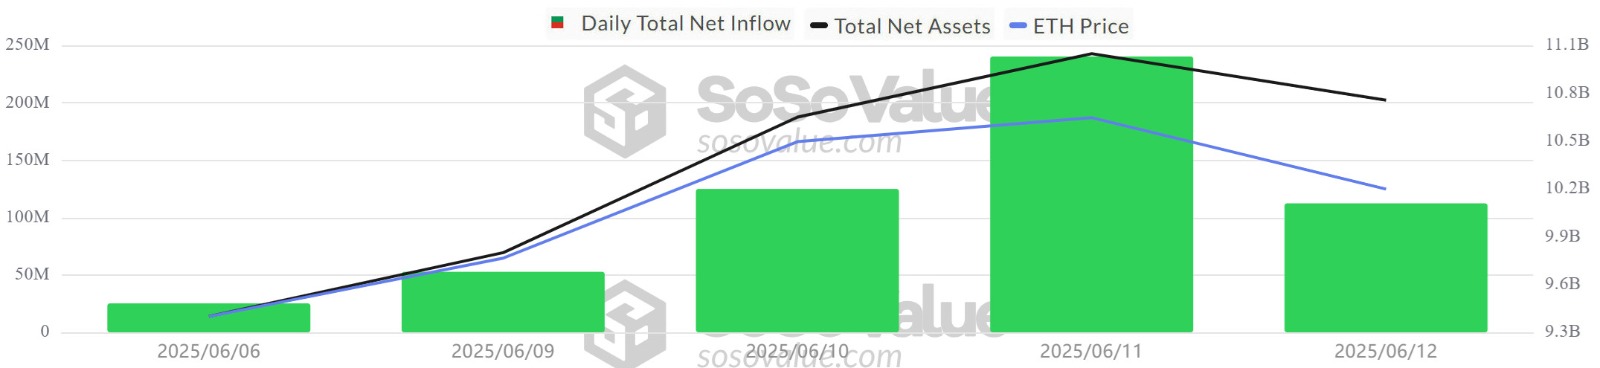
Between June 06 and June 12, 2025, Spot Ethereum ETFs saw a total net inflow of $555.6 million. The highest inflow day of the week was recorded on June 11 with $240.3 million. In this process, BlackRock’s ETHA ETF stood out with a strong inflow of $ 396.8 million. The total cumulative net inflow of Spot Ethereum ETFs at the end of the 224th trading day rose to $3.875 billion. The positive net flow series continued in this period and increased to 13 trading days in total.
| DATE | COIN | Open | Close | Change % | ETF Flow (mil$) |
|---|---|---|---|---|---|
| 06-Jun-25 | ETH | 2,414 | 2,476 | 2.57% | 25.3 |
| 09-Jun-25 | 2,509 | 2,680 | 6.82% | 52.7 | |
| 10-Jun-25 | 2,680 | 2,816 | 5.07% | 125 | |
| 11-Jun-25 | 2,816 | 2,771 | -1.60% | 240.3 | |
| 12-Jun-25 | 2,771 | 2,642 | -4.66% | 112.3 | |
| Total for 06 – 12 Jun 25 | 9.44% | 555.6 |
From June 06 to June 12, 2025, institutional interest in the Spot Ethereum ETF market remained strong. The first part of the week saw sharp gains in the Ethereum price, with the price rising by around 15% between June 6-10. On June 11-12, the market and the Ethereum price retreated. The uninterrupted positive flow on the ETF side during this period showed that institutional investors maintained their confidence in Ethereum despite short-term price fluctuations. In the coming period, especially the course of geopolitical risks and the clarification of macroeconomic developments will continue to be decisive in terms of the continuity of demand for Spot Ethereum ETFs.
Bitcoin Options Distribution
Source: Laevitas
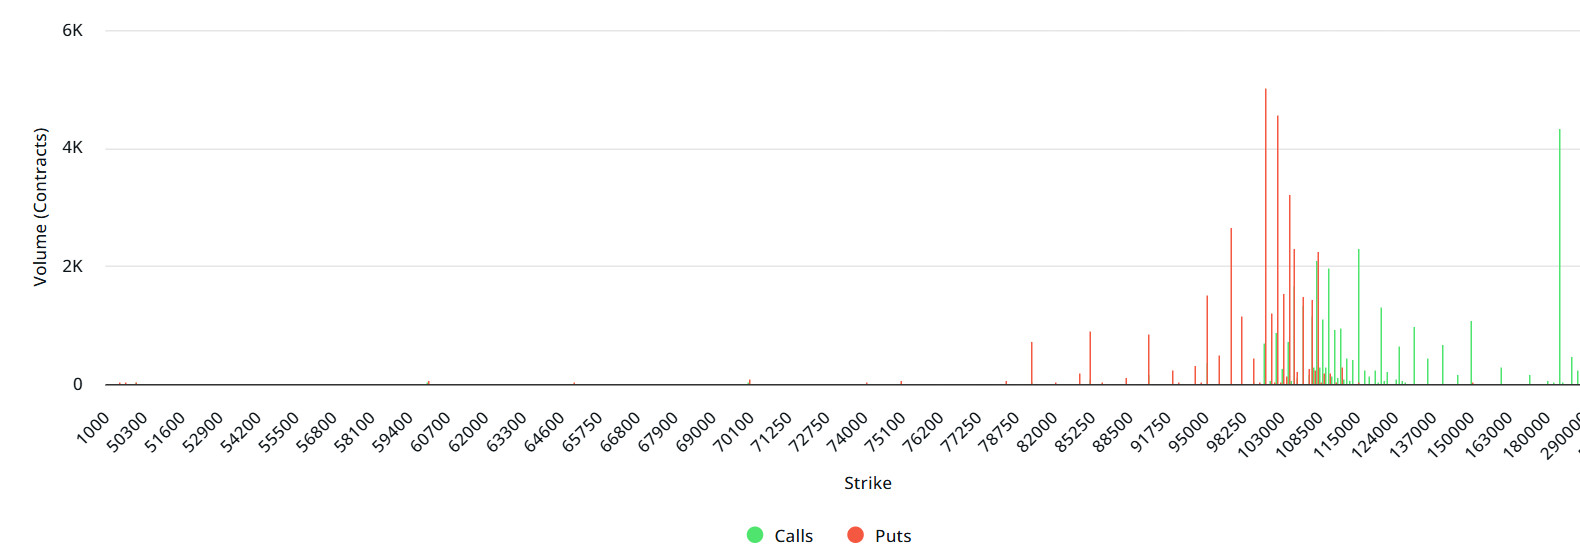
BTC: Notional: 3.04B | Put/Call: 0.95 | Max Pain: $107K
Laevitas Data: When we examine the chart, it is seen that put options are concentrated in the band of 95,000 – 105,000 dollars. Call options are concentrated between the levels of 108,000 – 130,000 dollars and the concentration decreases towards the upper levels. At the same time, the level of approximately 97,000 dollars is seen as support and the level of 107,000 dollars as resistance. On the other hand, there are 5.10K put options at the $ 100,000 level, where there is a peak and there is a decrease in put volume after this level. However, it is seen that 4.33K call option contracts peaked at the $ 200,000 level. When we look at the options market, we see that call and put contracts are in balance on a daily and weekly basis.
Deribit Data: Deribit data shows that BTC options contracts with a nominal value of approximately $3.04 billion expired today. At the same time, if we look at the risk conversion in the next 1-week period according to the data in the last 24 hours, put options are the dominant side in hedging more than call options in the 24-hour period. This indicates that the expectation of a decline is increasing. When we look at the expected volatility, it is above the realized volatility. This indicates that call option fees are expensive. On the other hand, the positive spread value shows that investors are acting appetite. Skew values suggest that there is selling pressure today and next week.
Option Expiration:
Put/Call Ratio and Maximum Pain Point: In the last 7 days data from Laevitas, the number of call options decreased by 43% to 67.35K compared to last week. In contrast, the number of put options decreased by 9% to 64.89K compared to last week. The put/call ratio for options was set at 0.95. This indicates that call options are more in demand among investors than put options. Bitcoin’s maximum pain point is seen at $107,000. It can be predicted that BTC is priced at $104,300 and if it does not break the pain point of $107,000 upwards, the declines will continue. In the coming period, there are 5.02K call and 7.71K put options at the time of writing.
Ethereum Options Distribution
Source: Laevitas
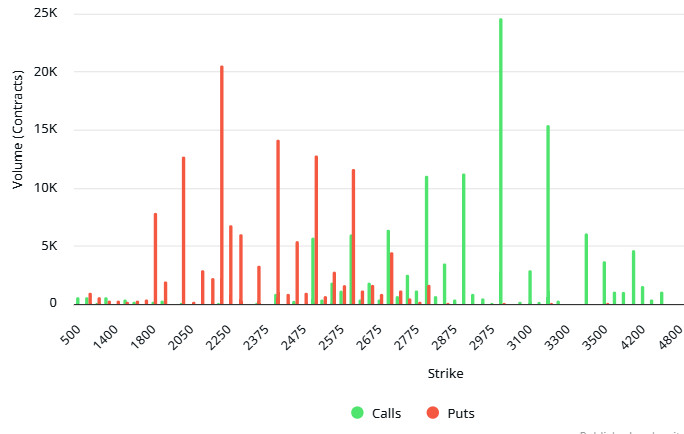
ETH: 686.93M notional | Put/Call: 1.20 | Max Pain: $2,700
Laevitas Data: Looking at the chart, put options are concentrated between $2,050 and $2,500. The highest volume of put contracts is around 21K at the $2,200 level. This indicates that option market participants see the $2,200 level as a strong support. On the other hand, there is a total volume of about 40K call options at the $2,900 and $3,100 levels. These levels stand out as a possible resistance zone, especially due to the high volume seen at $3,100. When we look at the general outlook, there is a noticeable call option activity at 3,300 and 3,500 levels. However, the volume in these areas may be due to relatively low premium options, which means that investors are opening positions with high price expectations at low cost.
Deribit Data: ATM volatility ratios are hovering around 82.76% and 71.79% on June 14 and June 15, respectively. These ratios indicate that the perception of short-term uncertainty in the market is high. Similarly, 25 Delta Butterfly (BF) data are at 3.6 and 1.85, suggesting that volatility premiums for both upside and downside price movements have increased. The 28.39% increase in volume, especially in June 14 call options, suggests that investors are expecting a short-term rebound.
Option Expiration:
Ethereum options with a notional value of $686.93 million expire on June 13. The Max Pain level is calculated at $ 2,700, while the put/call ratio is at 1.20.
Legal Notice
The investment information, comments and recommendations contained in this document do not constitute investment advisory services. Investment advisory services are provided by authorized institutions on a personal basis, taking into account the risk and return preferences of individuals. The comments and recommendations contained in this document are of a general type. These recommendations may not be suitable for your financial situation and risk and return preferences. Therefore, making an investment decision based solely on the information contained in this document may not result in results that are in line with your expectations.