
Fear & Greed Index
Source:Alternative
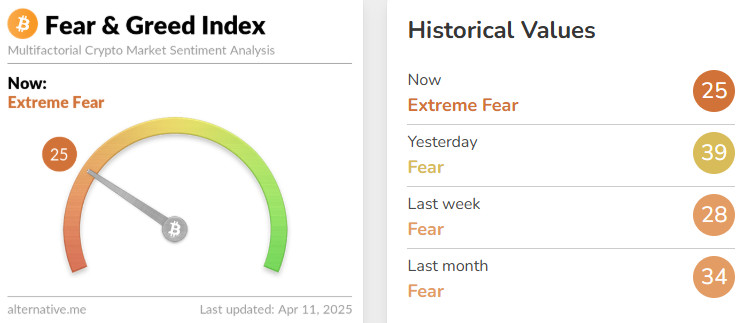
Change in Fear and Greed Value: -3
Last Week’s Level: 28
This Week’s Level: 25
This week, the index fell slightly to 25, maintaining its course in the fear zone. Trade wars are back at the center of the agenda. Trump’s decision to raise tariffs on China up to 145% and China’s retaliation raised concerns about the course of global trade. The sharp declines in Hong Kong and Singapore stock markets showed that confidence in Asian markets was shaken. With recession warnings from JPMorgan and BlackRock, investors remain cautious. Although expectations for a Fed rate cut have increased, inflation risk is at the forefront, feeding uncertainty. This weakened the appetite for risky assets and paved the way for further deterioration in market sentiment. In general, the simultaneous increase in geopolitical and economic risks continues to put pressure on the index.
Source: Coin Shares
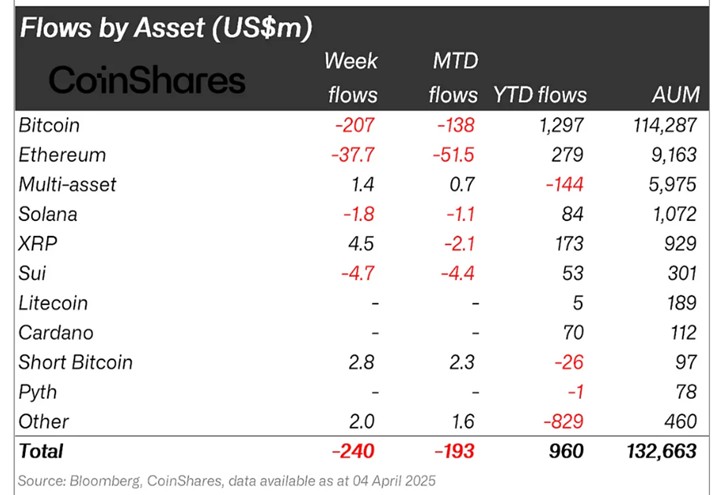
Overview: Digital asset investment products saw outflows of $240 million this week on news of US tariffs that threaten economic growth
Fund Inputs:
- Multi-asset: Bitcoin ETFs saw net outflows of $154.8 million and Ethereum ETFs saw net outflows of $38.8 million, with total digital assets seeing inflows of $1.4 million compared to last week.
- Ripple (XRP): Ripple and the US SEC filed a joint petition to halt their objections as they work to finalize a settlement. With this development, Ripple saw an entry of $4.5 million.
- Short Bitcoin: Inflows into short bitcoin positions totaled $2.8 million.
Fund Outflows
- Bitcoin (BTC): With China’s retaliatory statements against the tariffs imposed by the US and the negative impact of FED Chairman Powell’s speech, an outflow of 207 million dollars was seen last week.
- Ethereum (ETH): With China’s retaliatory statements, the ETH network saw a $37 million outflow as global markets sold off sharply.
- Solana (SOL): SEC accepts application for Fidelity Solana Fund. KAST launched the first M^0 Stablecoin on Solana. Despite this news, Solana saw a total outflow of $1.8 million amid macroeconomic uncertainties.
SUI: Canary, along with CBOE, negatively priced the news of SUI ETF filing along with the decline of altcoins. It saw a $4.7 million outflow on this news.
- Other: The re-ignition of global trade tensions has led to a significant reduction in investors’ risk appetite. For this reason, alt coins saw a $2 million outflow.
Total MarketCap
Source :Tradingview
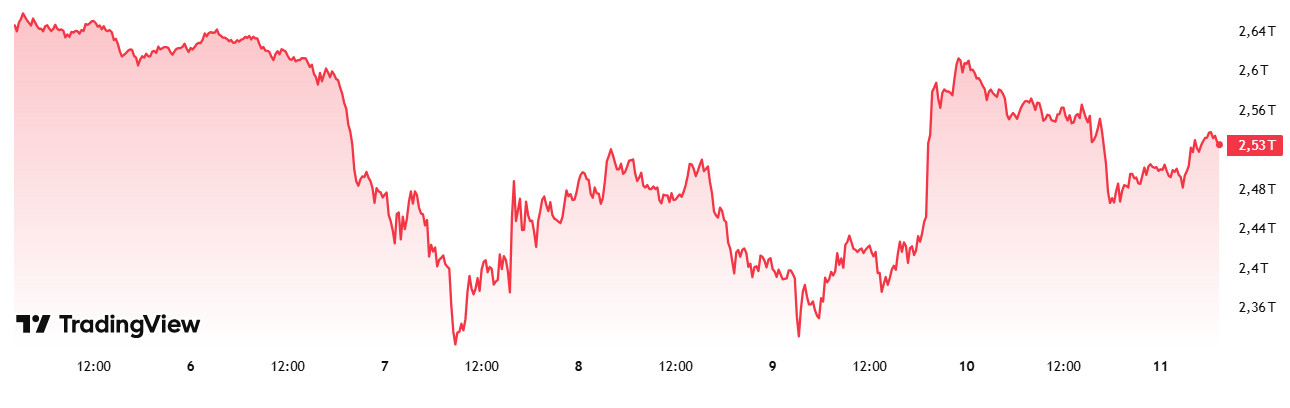
- Last Week Market Capitalization: 46 trillion Dollars
- This Week Market Capitalization: 53 trillion Dollars
Last week, the cryptocurrency market saw an outflow of approximately $169.46 billion, a decrease of 6.46% and the week closed negative. This week, the market saw an increase of $69.81 billion. This corresponds to an increase of 2.83% and the total market capitalization is currently at $2.53 trillion. However, the downward break of the critical threshold of $2.61 trillion as of last week’s close indicates that the general downward trend in the markets may continue for a while.
Total 2
Total 2, which closed last week with a 9.21% loss in value, started the new week with a market capitalization of $ 901.19 billion. Total 2, which fell to $ 693.54 billion during the week, then recovered to $ 929.52 billion. Overall, there was an increase of $ 28.42 billion on a weekly basis.
Total 3
Total 3, which lost $ 64.08 billion last week and fell by 8.27%, started this week at $ 710.55 billion. During the week, there was an increase of 31.65 billion dollars, an increase of 4.44%.
While the cryptocurrency market was generally positive this week, there was a total capital inflow of $69.81 billion. While $41.39 billion (59%) of this inflow was directed towards Bitcoin, there was an outflow of $3.23 billion on the Ethereum side. Other altcoins recorded an average growth of $31.62 billion. Although the current market outlook presents an optimistic picture in the short term, it is important for investors to act cautiously as long as they remain below critical levels.
Bitcoin Dominance
Bitcoin Dominance
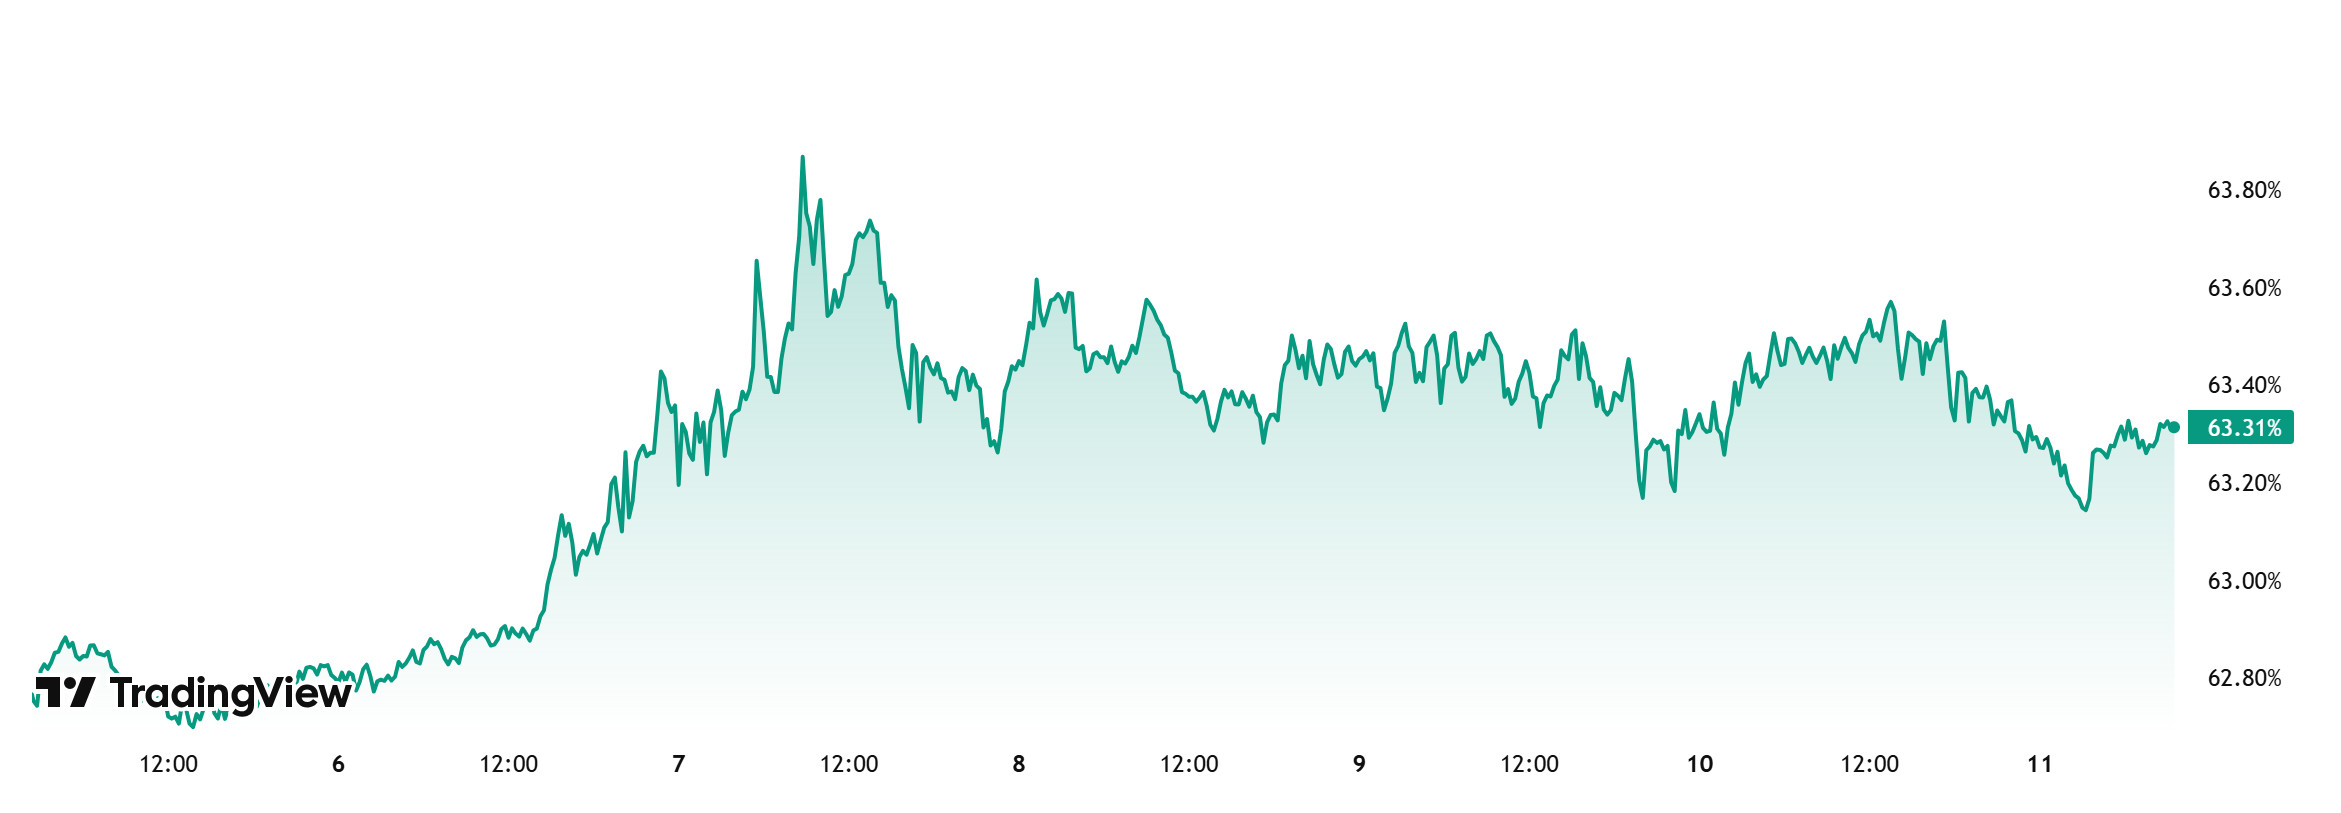
BTC dominance, which started the week at 63.32%, rose throughout the week to 64.00% and is currently at 63.31%.
This week, US President Trump made some changes regarding tariffs. Accordingly, he decided to pause tariffs on all countries except China for 90 days and to reduce reciprocal tariffs to 10%. In addition, the White House reported that tariffs on China have increased to 145% with the latest increase. When we analyzed Bitcoin spot ETFs, it was seen that there were money outflows throughout this week.
US President Trump’s decision to pause tariffs for 90 days with a policy open to negotiations on tariffs may cause some increase in the buying appetite of institutional and ETF investors. If the buying effect of positive news remains limited, the selling pressure on Bitcoin can be expected to be less than the market in general. In light of these developments, we can expect BTC dominance to rise to 64% – 65% in the new week.
Ethereum Dominance
Source: Tradingview
Weekly Change:
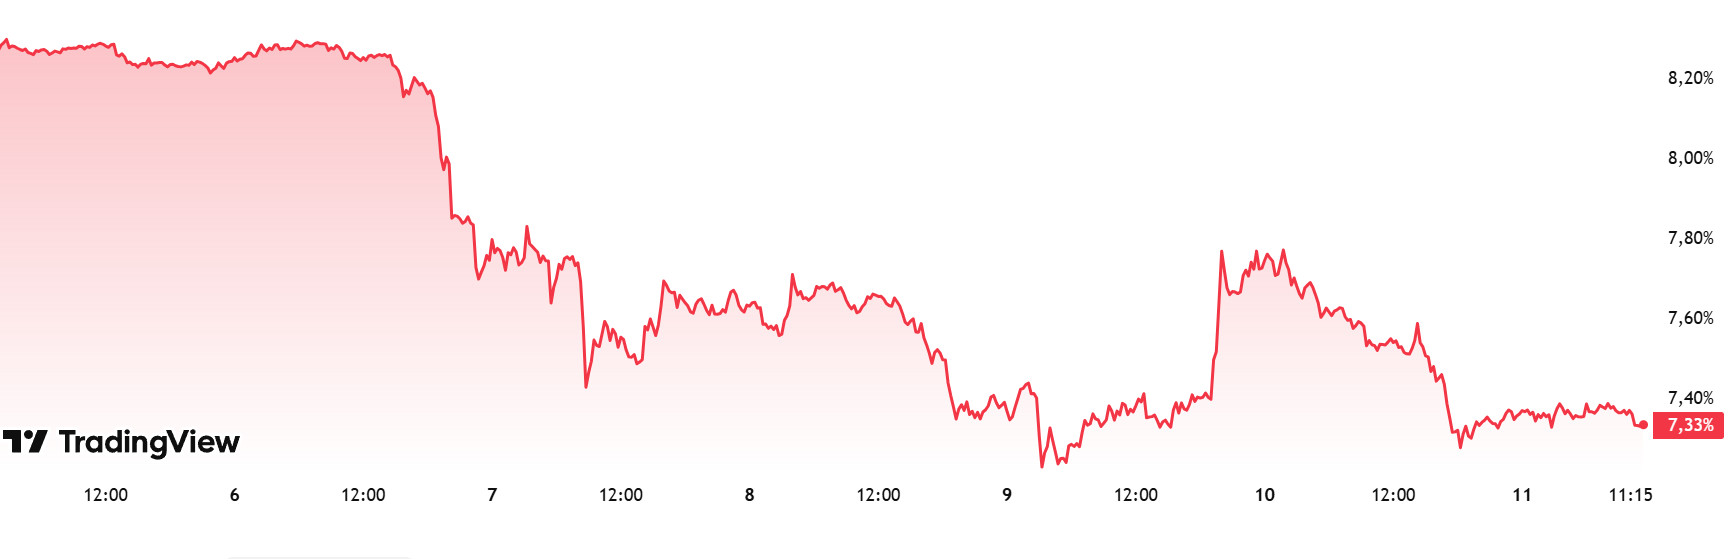
- Last Week’s Level: 7.76%
- This Week’s Level: 7.33%
After rising to a high of 8.88% in the week commencing March 17, 2025, Ethereum dominance resumed its downtrend amid selling pressure encountered in this region. Over the last three-week period, this pressure has continued significantly and the Ethereum dominance has approached its historical lows with the recent pullbacks. In addition, a total net outflow of $51.2 million from Spot Ethereum ETFs between April 04- 10, 2025 contributed to the continuation of the negative outlook on a weekly basis.
On the other hand, the US Securities and Exchange Commission’s (SEC) approval of options trading for Ethereum spot ETFs (BlackRock’s iShares Ethereum Trust and Bitwise, Grayscale Ethereum Trust and Grayscale Ethereum Mini Trust) can be considered an important development for institutional investors.
In addition, Bitcoin dominance was also negative during the same period, but as of the last week, Ethereum dominance showed a positive trend in contrast.
In this context, Ethereum dominance ended last week at 7.76% and is hovering around 7.33% as of the current week.
Bitcoin Spot ETF
Source: SosoValue
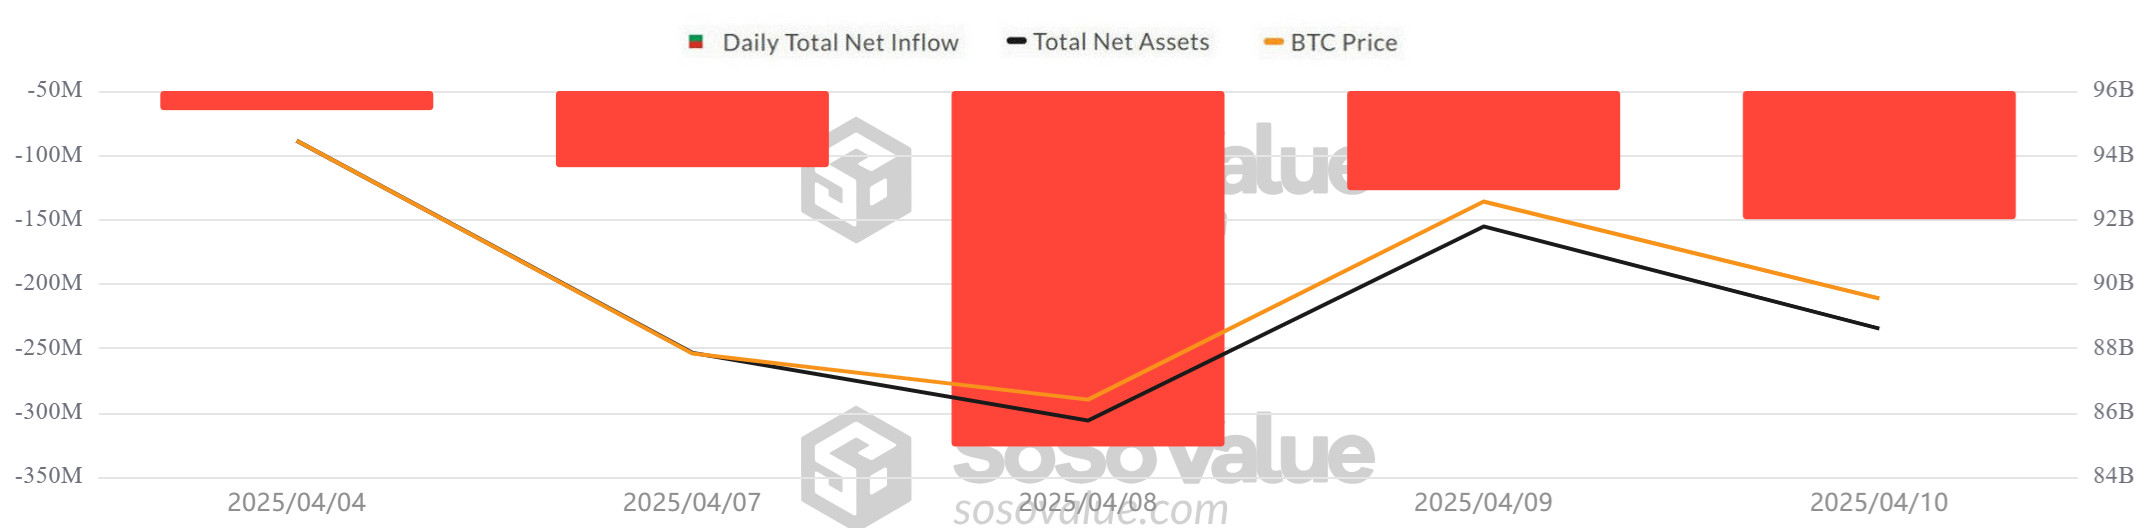
Netflow Status: Spot Bitcoin ETFs had a total net outflow of $771.8 million between April 04-10, 2025. During this period, the negative net flow series reached the 6th day. On a weekly basis, BlackRock IBIT ETF with a net outflow of $ 342.6 million, Grayscale GBTC ETF with a net outflow of $ 186.1 million and Fidelity FBTC ETF with a net outflow of $ 74.6 million were among the notable ETFs.
Bitcoin Price: Bitcoin, which opened at $83,213 between April 04-10, 2025, fell 4.33% to close at $79,607 on April 10. The sharpest decline in this process occurred on April 08, and the BTC price fell by 3.59% to $ 76,322. The strongest recovery was seen on April 09, rising 8.25% to $82,615.
Cumulative Net Inflows: The total cumulative net inflows of spot Bitcoin ETFs fell to $35.46 billion at the end of the 313th trading day.
| DATE | COIN | Open Price | Close Price | Change % Price | ETF Flow (mil$) |
|---|---|---|---|---|---|
| 04-Apr-25 | BTC | 83,213 | 83,889 | 0.81% | -64.9 |
| 07-Apr-25 | BTC | 78,430 | 79,163 | 0.93% | -103.9 |
| 08-Apr-25 | BTC | 79,163 | 76,322 | -3.59% | -326.3 |
| 09-Apr-25 | BTC | 76,322 | 82,615 | 8.25% | -127.2 |
| 10-Apr-25 | BTC | 82,615 | 79,607 | -3.64% | -149.5 |
| Total for 04 – 10 Apr 25 | -4.33% | -771.8 | |||
Between April 04-10, 2025, the crypto market experienced high volatility due to geopolitical and macroeconomic developments. China’s retaliatory statements against the new tariffs imposed by the US caused investors to move away from risky assets. At the same time, FED Chairman Powell’s statements created additional uncertainty in the markets and increased selling pressure. These developments negatively affected not only Bitcoin ETFs but also other digital assets, especially Ethereum ETFs. This process, which was characterized by intense macro risks, once again showed that market participants act with fragile sensitivity. It is predicted that developments stemming from customs tariffs and central bank policies will bring about two-way pricing in the short term and Bitcoin ETF flows will fluctuate in parallel.
Ethereum spot ETF
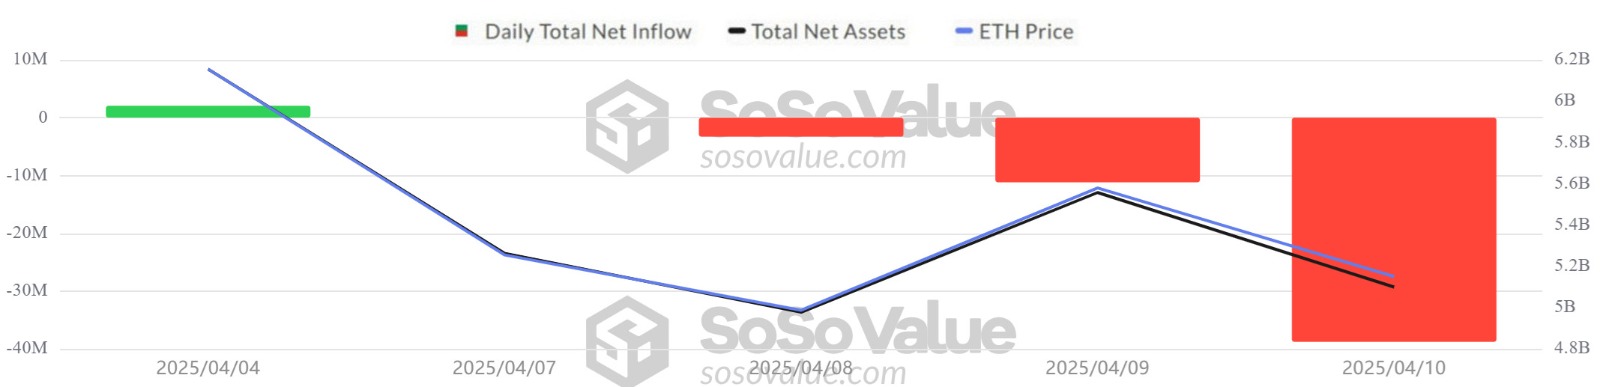
Between April 04 – 10, 2025, one of the most important developments affecting the markets was China’s retaliatory statements against the tariffs imposed by the US and the negative impact of FED Chairman Powell’s speech. China’s retaliatory statements led to a sharp sell-off in global markets. This led to a sharp pullback in the ETH price and outflows from Spot Ethereum ETFs.
Bitcoin Options Breakdown
 Source: Laevitas
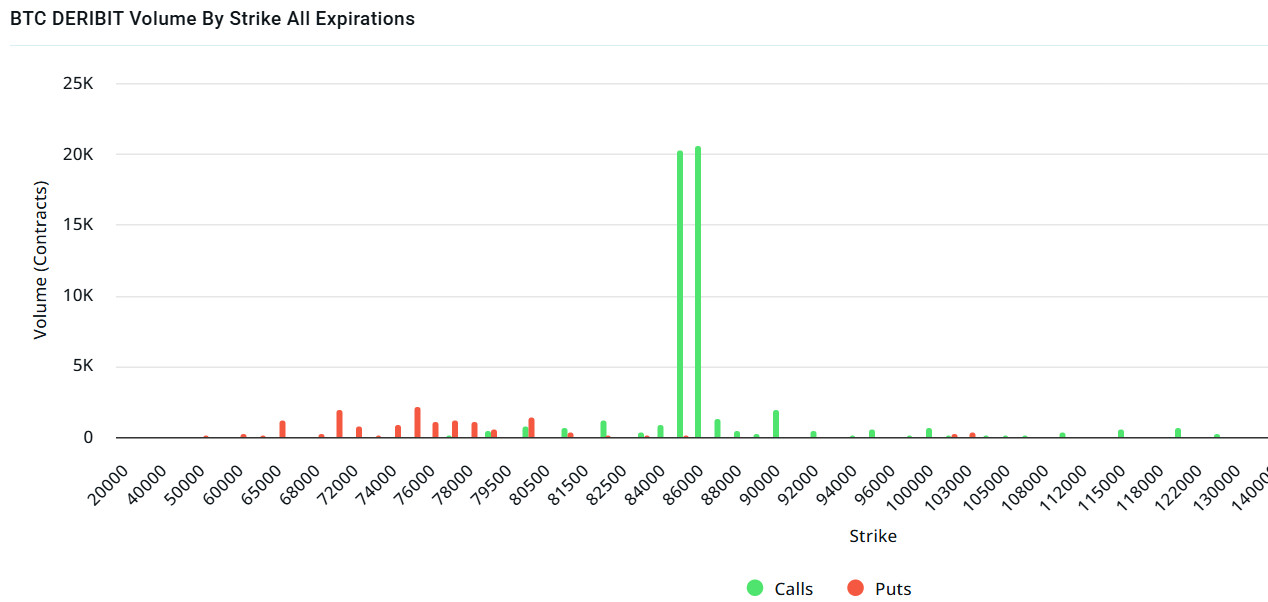
BTC: $2.32B notional | Put/Call: 0.97 | Max Pain: $82K
Deribit Data: Deribit data shows that BTC options contracts with a notional value of approximately $2.32 billion expired today. At the same time, according to the data in the last 24 hours, if we look at the risk conversion in the next 1 week, put options are the dominant side in hedging more than call options. This indicates that the investor’s need to hedge against the decline has increased. When we look at the expected volatility, the fact that it is below the realized volatility is a bearish signal, but it shows us that call contract fees are cheap, whereas the contract fees of put options are above normal. At the same time, when we look at the term structure data, it shows us that volatility may move excessively during the option expiration.
Laevitas Data: When we examine the chart, we see that put options are concentrated in the $ 75,000 – $ 80,000 band. Call options are concentrated between $ 82,000 – $ 90,000 and the concentration decreases towards the upper levels. At the same time, the level of about $ 80,000 is seen as support and the level of $ 90,000 as resistance. On the other hand, there are 3.71K put options at the $ 75,000 level, where there is a peak and there is a decrease in put volume after this level. However, there are huge call option contracts with 19.2K at $85,000 and 21.56K at $86,000. When we look at the options market, we see that call contracts are dominant on a daily and weekly basis.
Option Expiration
Put/Call Ratio and Maximum Pain Point: In the last 7 days of data from Laevitas, the number of call options increased by 107% compared to last week to 174.67K. In contrast, the number of put options increased by 24% to 129.02K. The put/call ratio for options was set at 0.33. This shows that call options are more dominant among traders. Bitcoin’s maximum pain point is seen at $80,000 at the time of writing. It can be predicted that BTC is priced at $81,284 and if it does not break the pain point of $80,000 downwards, the rises will continue. In the coming period, there are 42.70K call and 3.K put options at the time of writing.
Ethereum Options Distribution
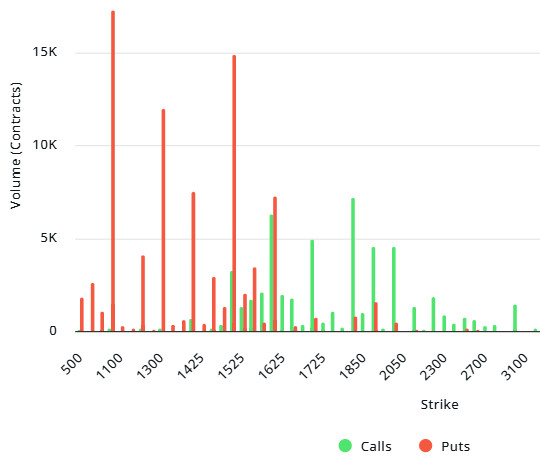
Source: Laevitas
ETH: $270M notional | Put/Call: 0.91 | Max Pain: $1,750
Laevitas Data: When we examine the chart, it is seen that Put options are concentrated in the band between $ 1,100 – $ 1,525. It is noteworthy that the Put volume peaked at the $1,100 level, where there were approximately 17K contracts. However, it is observed that Put volume is also high at the $1,300 and $1,425 levels, with around 12K and 9K contracts, respectively. This suggests that the $1,100 – $1,425 area is seen as a strong support area. On the other hand, we see that Call options are concentrated between $1,625 and $1,850. Especially at the $1.850 level, Call volume reaches the highest point and there are about 7K contracts here. This indicates that the $1.850 level may work as an important resistance. In the current situation, the fact that Put options have a higher volume compared to Call options shows that selling pressure is more dominant in the market. It will be critical in the short term, especially whether the $1,100 – $1,425 levels can be maintained.
Deribit Data: The ATM volatility rate in the market is at 90.47, down 1.11% on a daily basis. This level is still quite high, meaning there is a lot of uncertainty and expectation of movement across the market. The fact that volatility remains so high despite the decline suggests that traders are still bracing for big price moves. 25Δ Risk Reversal (RR) is highly negative at -14.68. The RR shifting to negative indicates that investors are showing more demand for puts and are looking to hedge downside risks. It also worsened by 3.92% on a daily basis. In other words, we can say that the “fear of decline” has increased a little more. 25Δ Butterfly Spread (BF) is at 4.3 and increased by 1.25% on a daily basis. The increase in the BF shows that investors do not expect an extremely large directional breakout and think that the movement may be within a certain band. In other words, volatility is high, but the direction is not clear.
Option Expiration
Ethereum options with a notional value of $270 million expired on April 11. The maximum pain point (Max Pain) was realized at $ 1,750, while the put/call ratio was 0.91.
Legal Notice
The investment information, comments and recommendations contained in this document do not constitute investment advisory services. Investment advisory services are provided by authorized institutions on a personal basis, taking into account the risk and return preferences of individuals. The comments and recommendations contained in this document are of a general type. These recommendations may not be suitable for your financial situation and risk and return preferences. Therefore, making an investment decision based solely on the information contained in this document may not result in results that are in line with your expectations.
