
Monthly Report – September
What Awaits Us?
U.S Macroeconomic Data
Non-Farm Payrolls Data (NFP) – 05 September
This data, which shows the employment strength in the US economy, will play a key role in the FED’s assessment of the direction of the interest rate path.
Consumer Price Index (CPI) – September 11
Consumer inflation data for August will shape the inflation expectations of the markets.
FOMC Meeting – September 17
The US Federal Reserve’s (FED) critical interest rate decision will be highly anticipated.
Personal Consumption Expenditures (PCE) – September 26
PCE data, which stands out as the FED’s inflation indicator, will be announced.
Crypto Insights
| Market Overview | Current Value | Change (30d) |
|---|---|---|
| Bitcoin Price | $110,160 | -6.99% 📉 |
| Ethereum Price | $4,394 | +14.73% 📈 |
| Bitcoin Dominance | 58.18% | -3.18% 📉 |
| Ethereum Dominance | 14.28% | +2.32% 📈 |
| Tether Dominance | 4.27% | -11.82% 📉 |
| Total Market Cap | $3.73 T | -1.87% 📉 |
| Fear and Greed Index | Greed (48) | Greed (72) |
| Altcoin Season Index | 20 / 100 | 44 / 100 |
| Crypto ETFs Net Flow | $355.30 M | — |
| Open Interest – Perpetuals | $898.04 B | — |
| Open Interest – Futures | $3.97 B | — |
*Prepared on 29.08.2025 at 13:00 pm. (UTC)
Metrics – Summary of the August
Flow by Asset
| Asset | Week 1 | Week 2 | Week 3 | Week 4 | Net Total $ (m) |
| Bitcoin (BTC) | -404 | 265 | 552 | -1,030 | 7,941.0 |
| Ethereum (ETH) | 133.9 | 269.8 | 2,963.1 | -440 | 3,764.0 |
| XRP (Ripple) | 31.3 | 18.4 | 125.9 | -5.2 | 58.4 |
| Solana (SOL) | 8.8 | 21.6 | 176.5 | 211.2 | 158.6 |
| Litecoin (LTC) | -0.2 | 0.1 | – | – | – |
| Cardano (ADA) | 1.3 | 0.4 | 0.8 | 0.3 | 1.9 |
| SUI | -0.8 | -3.0 | 3.5 | 9.3 | 15.8 |
| Other’s | 9.3 | 6.3 | 7.6 | -0.5 | 7.1 |
Interest in digital assets reached remarkable heights in July. Total monthly inflows amounted to $12 billion, with a general uptrend in the crypto market. Bitcoin showed that it has regained investors’ confidence with a net inflow of $7,941.0 billion. Ethereum made a big leap and saw inflows of $3.764.0 billion, cementing its position as the leading altcoin. Ripple (XRP) was one of the notable altcoins with an inflow of $58.4 million. While investments in Solana continued to increase, Litecoin remained weak in terms of investor interest. Cardano (ADA), on the other hand, showed a decline in investor interest with only $1.9 million in inflows. However, other altcoins added to the diversity of the market, with inflows totaling $7.1 million.
Total Market Cap
The cryptocurrency market recorded a 1.27% increase in total market capitalization this month, with growth of nearly $64 billion. With this increase, the market capitalization reached $3.8 trillion. During the month, the value surpassed an all-time high of $4.17 trillion and a new peak was recorded. In contrast, the monthly low was 3.56 trillion dollars. This data shows that the market moved within a wide band of about $0.5 trillion during the month. While this volatility highlights the high volatility of the market, it also underlines the increase in investors’ risk appetite and the strengthening of market confidence.
Spot ETF
August was a period of net outflows for Spot Bitcoin ETFs. While a strong inflow of $6 billion was recorded in July, August saw net outflows totaling $801.4 million. This showed that institutional demand weakened in the summer months. There were 7 consecutive days of positive net inflows between August 06-14, during which the Bitcoin price surpassed the $124,000 level and recorded a new ATH. However, immediately afterwards, a 6-day series of negative net flows between August 15-22 caused the price to fall as low as $112,000. Thus, the strong positive correlation between Spot Bitcoin ETF flows and Bitcoin price was once again clearly evident. On a fund basis, BlackRock IBIT ETF stood out with net inflows of $618.6 million, while outflows from Fidelity, ARK and Grayscale funds caused the overall picture to turn negative. On the price side, Bitcoin opened at $115,764 at the beginning of the month and closed at $111,262 as of August 27, down 3.89%. Money coming out of funds was one of the main drivers of the selling pressure on the price. Overall, August 2025 was a period of positive momentum and selling pressure for Spot Bitcoin ETFs. If this trend continues in September, the slowdown in institutional inflows could make it difficult for the Bitcoin price to recover.
For spot Ethereum ETFs, August 2025 was a month of record highs and new highs. The month saw strong net inflows totaling $3.99 billion. This figure showed that institutional demand for Ethereum in the ETF market continued unabated. In particular, $1.018 billion on August 11 and $729.1 million on August 13, the largest daily inflows since launch. Six of the 10 largest net inflows for Spot Ethereum ETFs to date occurred in August, revealing that Ethereum has taken center stage in the market. On a fund-by-fund basis, BlackRock ETHA ETF was the clear leader with net inflows of $3.31 billion. Fidelity FETH ETF also stood out with a net inflow of $577.7 million. The overall outlook revealed that flows remained largely positive. On the price side, Ethereum opened at $3,698 at the beginning of the month and closed at $4,506 on August 27. In this process, a 21.85% increase in value was recorded. During this rise, Ethereum surpassed $4,880 on August 22 and $4,950 on August 24, breaking and renewing the ATH level that it has not broken since November 2021. Overall, August 2025 was a period of strong institutional demand for Spot Ethereum ETFs, supported by record highs, while the price moved to new highs. The synchronized rise in Ethereum’s price and fund flows signals a new era in the market. If this momentum is maintained, we could see that records are just the beginning, both in terms of institutional demand and market price.
Options Data
In the Bitcoin options market, approximately $11.98 billion worth of BTC contracts will expire in the last week of this month, totaling $30.46 billion. Call options were concentrated in the $118,000-$120,000 band with a total of 621.36 thousand expiry transactions, while put options were in the $109,000-$111,000 range with 533.47 thousand expiry transactions. With a put/call ratio of 0.99, the maximum pain point will be realized at an average of $ 115,600.
When we look at the Skew ratio in the coming period, it is positive next week. This shows us that selling pressure may occur and there is a pessimistic mood. In the next month, the positive outlook continues. This shows us that there is a negative expectation in the price of BTC. The highest open interest volume in monthly BTC options is concentrated at the $115,000 level for call options. This level can be considered as important support and resistance points in the market. On the other hand, Implied Volatility (IV) is lower than Realized Volatility (RV). This shows us that the price of these contracts is priced lower than it should be. When we look at the 24-hour Risk reversal, we can say that there is a balanced risk-taking next month and a slight decrease in volume.
Crypto Side – September
Bitcoin August Performance: From Record Peak to Hard Correction
August saw both a historic achievement and a remarkable pullback for Bitcoin. In the first days of the month, the price reached a new all-time high (ATH) of $124,474. However, increasing profit realizations and decreasing buyer appetite in the markets after this peak caused the price to gradually retreat. With selling pressure accelerating, especially in the second half of the month, Bitcoin fell as low as $108,000 and closed August with a cautious outlook.
Compared to historical data, it can be said that the weak and volatile structure of August is also evident this year. Since 2013, August months, which have posted a limited return of 1.75% on average, have often witnessed periods of correction or consolidation. The sharp retreat this year also confirmed this structure. The weak August performance observed especially in the post-2020 period became even more pronounced with the post-peak sales this year.
From a technical point of view, the correction in August after the strong rally in July shows that the market has entered a balancing process from the overbought zone. This process reveals that the long-term structure is intact, but caution should be exercised in the short term. Especially the $110,000 region has become a critical threshold, while the lack of permanent movements above this level strengthens the possibility that the price may make deeper corrections.
In this period when the impact of macroeconomic and geopolitical developments on the market has increased, price movements are not limited to technical data. Economic data from the US, interest rate policies of central banks and geopolitical uncertainties have been decisive on the direction of the market. This complexity caused investors to remain cautious, leading to increased volatility.
The overall outlook suggests that August did not disrupt the long-term uptrend but created a short-term fatigue in the market. In this context, in order for the price’s recovery efforts to gain strength in September, it is critical to realize permanent movements above the $ 114,000-116,000 band. In the opposite scenario, the $105,000-107,000 range may be tested as a new support zone.
Market Pulse
FOMC’s Critical Bend…….
A critical September awaits global markets. Bitcoin, which started August poorly and then managed to rise to record highs, may be entering a period of high volatility and increased uncertainty as it prepares to close the eighth month of the year with losses again. In an environment where the adoption rate of digital assets by traditional investors is increasing, investors will focus more on the pricing of the US Federal Reserve’s (FED) next move in September, where political, geopolitical and macro uncertainties will come to the fore. In this respect, we will be looking at some US data, which have surprised us recently, and the critical September decisions of the Federal Open Market Committee (FOMC).
September 5 – US Employment Data
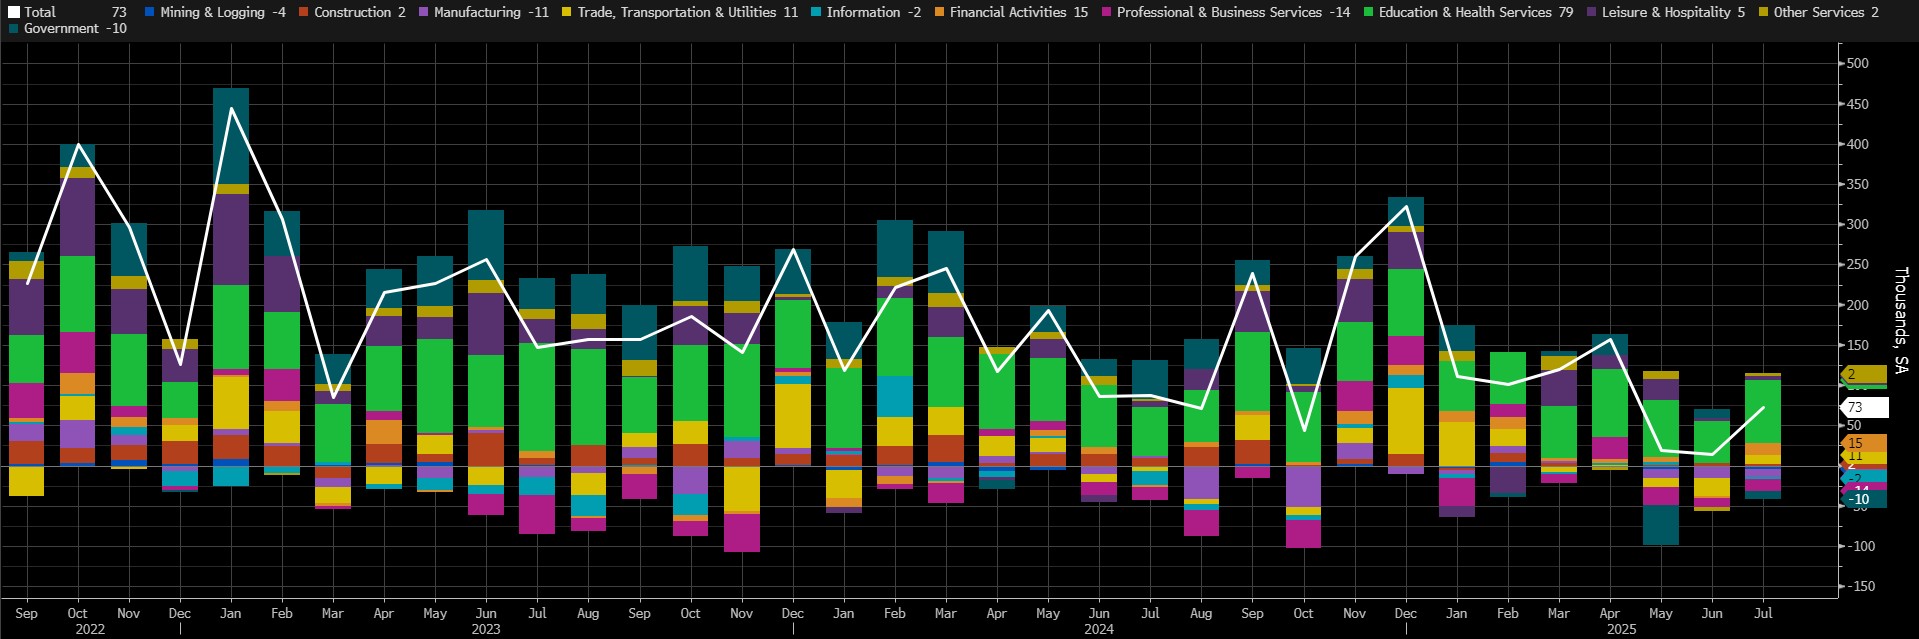
One of the most surprising macro indicators of recent years was the US Non-Farm Payroll Change (NFP) data for July, released on August 1. The US economy was expected to have employed over a hundred thousand Americans in the non-farm sectors in July. However, this data was announced as 73 thousand. Of course, this was not the surprising point.
The Bureau of Labor Statistics (BLS) made one of the deepest downward revisions in history (-258k) to the previously announced figures for the previous two months, revealing that the labor market in the world’s largest economy may not be as tight and strong as previously thought. This data caused the US Federal Reserve (FED) to change its stance on interest rates, leading to a redistribution of cards in financial markets. On September 5, the new NFP for August will be released, which will be of critical importance ahead of the Federal Open Market Committee (FOMC) meeting on September 17.
Source: Bloomberg
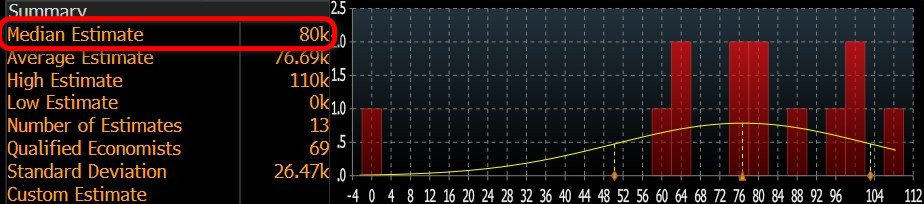
Our forecast for the highly sensitive NFP data is that the US economy in the non-farm sectors in August will be higher than market expectations. At the time of writing, although the number of forecasts entered is small, we see that the consensus (median forecast) in the Bloomberg survey is more pessimistic, around 80 thousand (This expectation figure may change later with the entry of new forecasts and surveys).
Source: Bloomberg
We believe that if the NFP data for August is slightly below expectations, this will be priced as a metric that may create an expectation that the FED may act more boldly to cut interest rates, thus increasing risk appetite and having a positive impact on financial instruments, including digital assets. We think that a slightly higher-than-expected data may have a similar but opposite effect . On the other hand, a much lower-than-expected figure could lead to a perception that the risk of a recession in the US economy has re-emerged . In this case, risk appetite may be suppressed and cryptocurrencies may lose value. Therefore, we underline that we think it will be important for traders to know this difference.
September 11 – US Consumer Price Index: CPI
One of the important macro indicators that may provide information on the timing of the US Federal Reserve’s (FED) interest rate cut will be the August inflation, Consumer Price Index (CPI) change. In the current difficult conjuncture, CPI data, which may give a sign of the course, will be closely monitored as it may have an impact on pricing behavior.
Source: Bloomberg
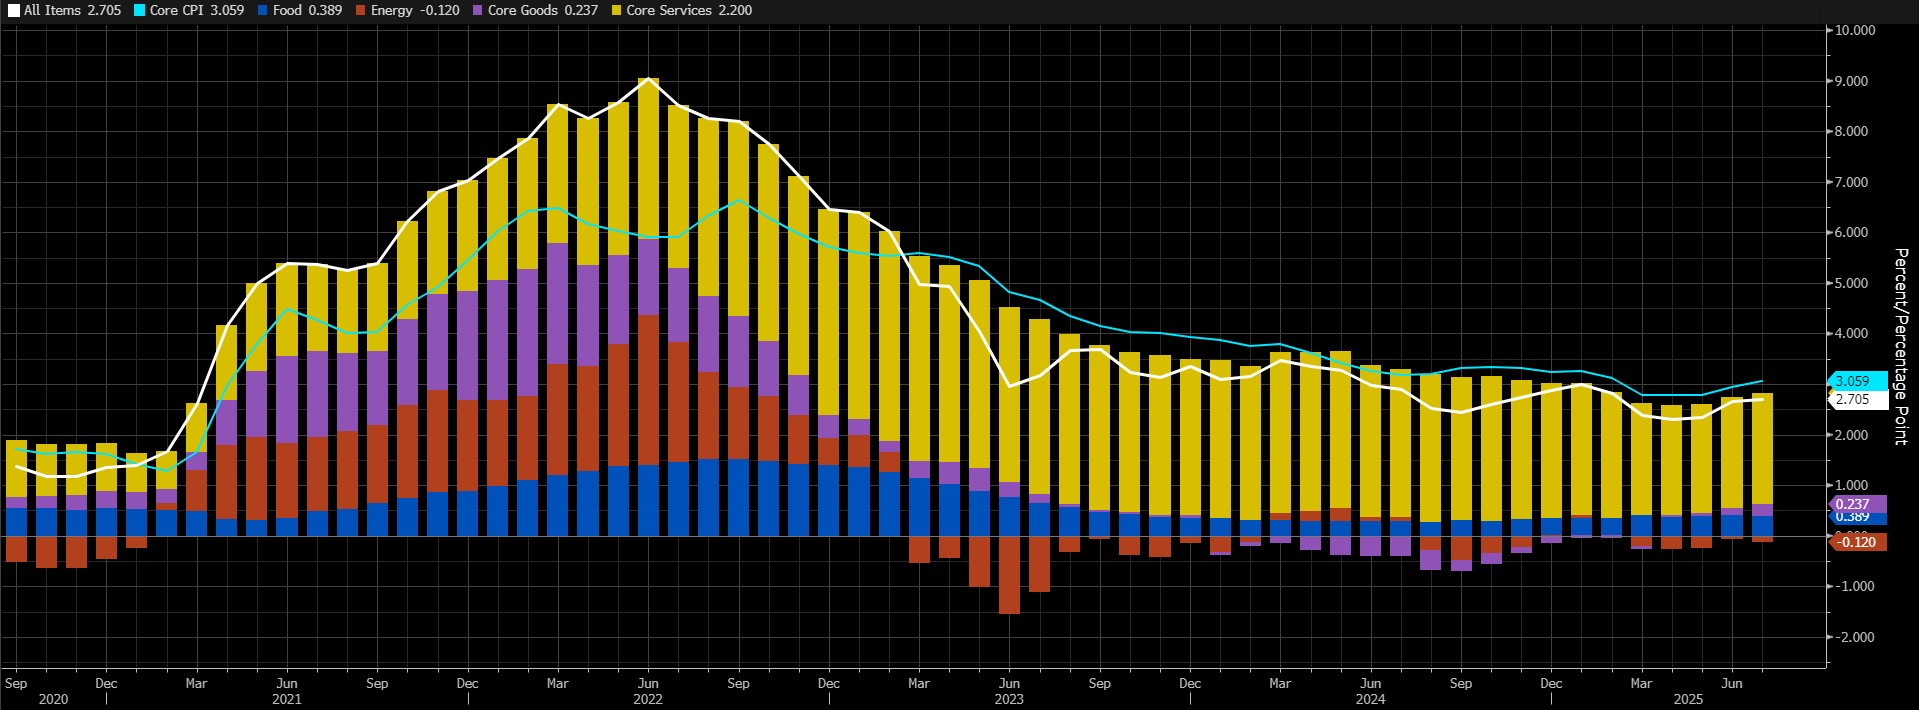
The annual inflation rate in the US stood at 2.7% in July 2025, unchanged from June and below forecasts of 2.8%. On a monthly basis, CPI rose by 0.2%, in line with expectations and just below the 0.3% increase in June, the strongest since January. Core inflation excluding food and energy rose to a five-month high of 3.1% from 2.9% in June, above forecasts of 3%. Monthly core CPI rose by 0.3% as expected after 0.2%, the sharpest rise in six months.
A lower-than-expected CPI reading could mean that the Fed will be more likely to cut interest rates, which could have a positive impact on digital assets. A higher-than-expected number would reinforce expectations that the FED will not rush into another rate cut, potentially adding pressure.
September 17 – FOMC Statement
The most critical issue for global markets in September will undoubtedly be the outcome of the Federal Open Market Committee (FOMC) meeting of the US Federal Reserve. As Donald Trump’s pressure on the FED is increasing and the latest employment data came as a nasty surprise, it is highly anticipated whether the FOMC will decide to cut interest rates. In the coming period, the FED’s decisions, which will be decisive in the tightness of financial markets, will be closely related to all markets.
US President Donald Trump’s pressure on the Fed to cut interest rates is now much clearer, and this pressure (developments regarding Fed Governor Cook) is increasing. The President is demanding a cut in interest rates. Until the messages he gave in his speech after Jackson Hole, FED Chairman Powell had taken a very firm stance against these pressures, but after the employment data released on August 1, Powell gave signs that a cut in the policy rate may be possible in his speech on August 22, pointing to weak employment indicators.
The Bureau of Labor Statistics made the largest backward revision since Covid-19, which we saw the effects of in 2020, and caused doubts about the strength of the labor market to strengthen. We can say that the main reason why Powell signaled a rate cut at the September 16-17 meeting and the markets priced in this direction was the non-farm payrolls data, which came in well below the forecasts.
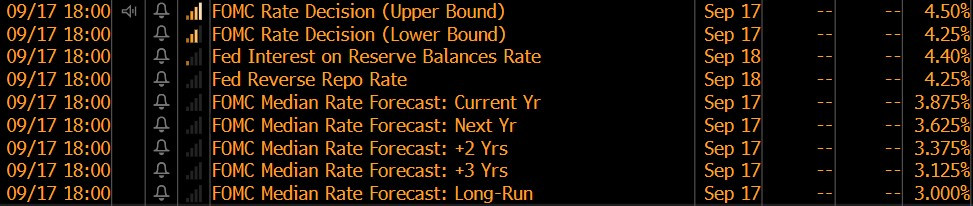
At the July 29-30 FOMC meeting, FED Governors Michelle Bowman and Christopher Waller voted against the decision to keep interest rates unchanged and argued that the effects of tariffs on inflation would remain limited. The September 17 meeting promises to be more contentious and challenging than before. However, judging from the pricing, markets are almost certain that the FOMC will cut the policy rate by 25 basis points at this meeting. In fact, expectations that the next two meetings may take decisions in the same direction are priced at a level that is too important to be ignored.
Decision Day
- Will interest rates be cut as expected
On the evening of September 17, let us briefly summarize the process that awaits us. First of all, markets will focus on whether the Fed cuts its policy rate or not. As mentioned above, according to the CME FedWatch Tool, markets are expecting a 25 basis point cut at the time of writing (employment and inflation data to be released before the FOMC meeting may change expectations).
Source: Bloomberg
If the FED cuts interest rates by 25 basis points as expected, we do not expect markets to price in this decision. If it leaves it unchanged, we may see a reaction where the dollar appreciates, risk appetite decreases and assets that are considered relatively risky, including crypto assets, lose value. On the other hand, in another surprise scenario, if the FED cuts interest rates by 50 basis points, we may see a positive reflection on digital assets.
- Economic Projections and Dot Plot Chart:
In four of its nine meetings during the year, the FOMC publishes forecasts on some economic indicators and how the policy rate may change in the coming periods. The meeting on September 16-17 will be one of them. Therefore, these documents, which will be published at the same time as the interest rate decision, will be other important information that will affect prices.
In the latest projections, FOMC officials revised down their growth forecasts for the US economy and slightly revised up their inflation forecasts. Changes in their forecasts for these macro indicators will be closely monitored and, in particular, possible revisions to the PCE price index (the indicator used by the Fed to monitor inflation) will provide information about the path of interest rate cuts. A strong upward revision may mean that the FED will not be too hasty in cutting interest rates in the coming period, while a downward revision may mean relatively faster rate cuts. We see this data as unlikely to be revised downwards.
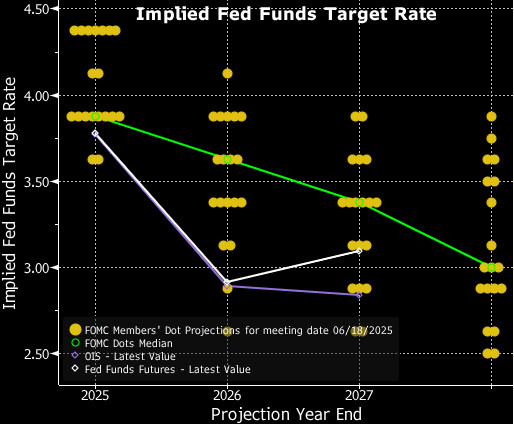
Source: Bloomberg
In the same document, there will be a table known as the “dot plot”, which shows the FOMC members’ forecasts for changes in the policy rate. In the image above, you can see the average expected rates based on the dot plot published at the last meeting in June. Here, too, a general downward revision could complete the weak dollar-demand for digital assets equation. Although unlikely, an upward revision could have the opposite effect.
- FED Chair Powell’s Presentation
Half an hour after the FOMC statement, policy rate decision, economic projections and dot plot table are released, eyes will turn to Chairman Powell’s press conference. Powell will first explain the decisions and the rationale behind them from behind the lectern, and then he will take questions from the press. Volatility in prices may increase in this part.
There will be a lot to talk about (Cook’s dismissal, Trump’s pressure on the Fed to cut interest rates, central bank independence…). Of course, the importance of the Chairman’s speech will depend on the shape of the decisions we have described above. However, after Powell’s speech at Jackson Hole, the messages he will give about how the interest rate cut path will be shaped in the coming periods will be critical. If Powell gives a message that strong rate cuts can be made for the rest of the year and beyond, we think this will have a positive impact on digital assets. In the opposite case, there may be pressure. It should be added here that Powell’s term expires in May 2026, and it is clear that Trump will not nominate Powell again. Therefore, it would be more accurate to evaluate what Powell said with this projection and investment horizon.
September 26 – FED’s Favourite Inflation Indicator PCE
Markets will be closely watching the Personal Consumption Expenditures (PCE) data for August for clues on whether a rate cut will be decided at the Federal Open Market Committee (FOMC) meeting in September. This indicator is known as the preferred gauge for FOMC officials to monitor changes in inflation.
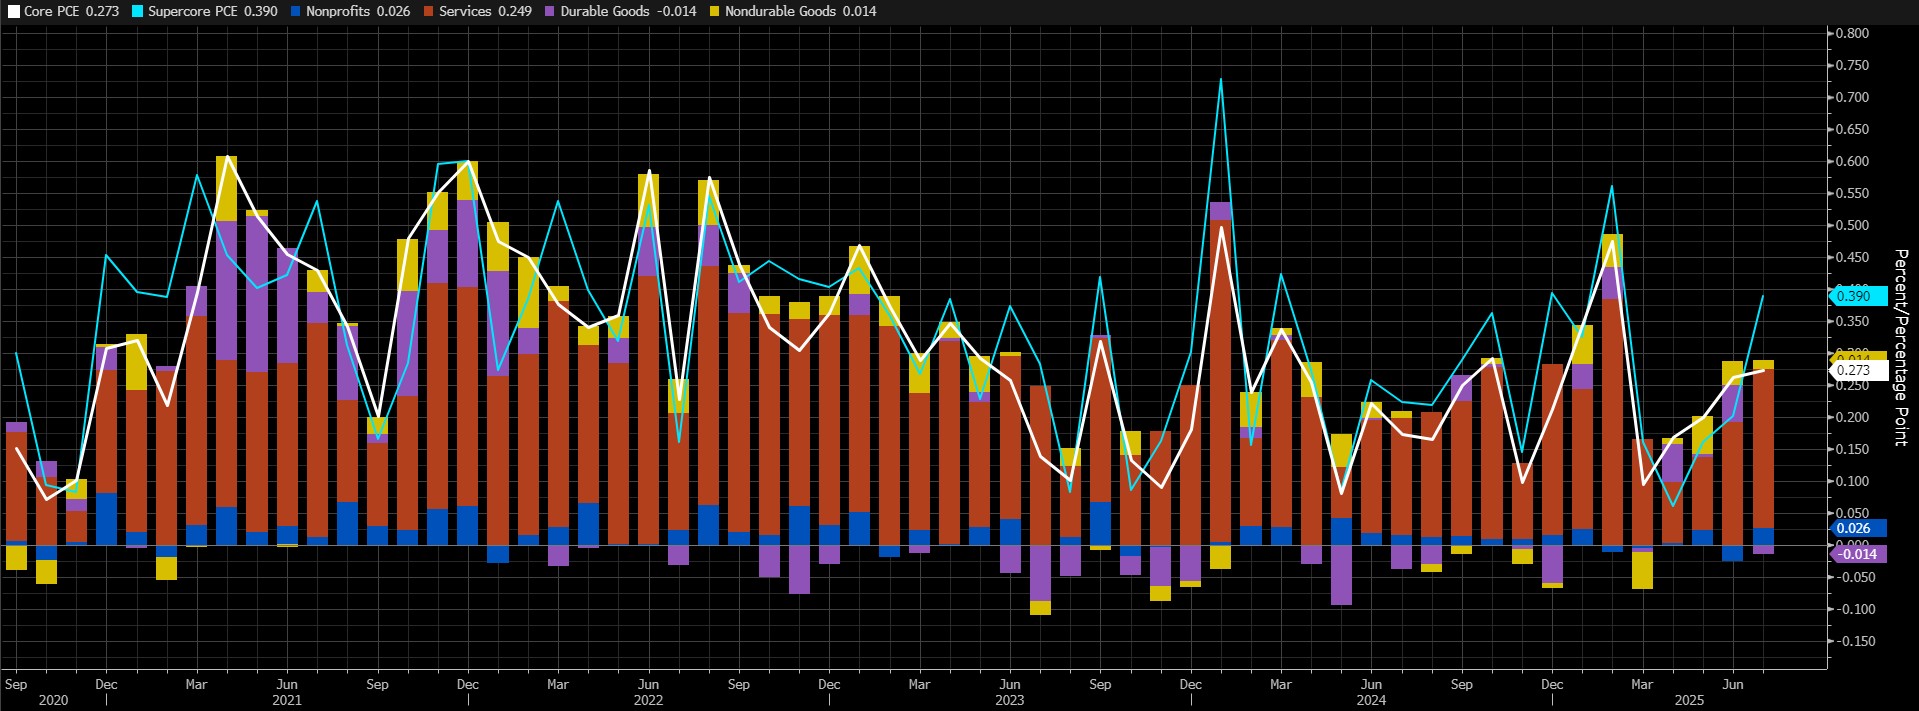
Source: Bloomberg
According to the latest data, core PCE increased by 0.3% mom in July. On an annual basis, core PCE increased by 2.9%. We can say that we continue to feel the Trump effect in this data. Our expectation is that the core PCE data will increase by around 0.23% in August.
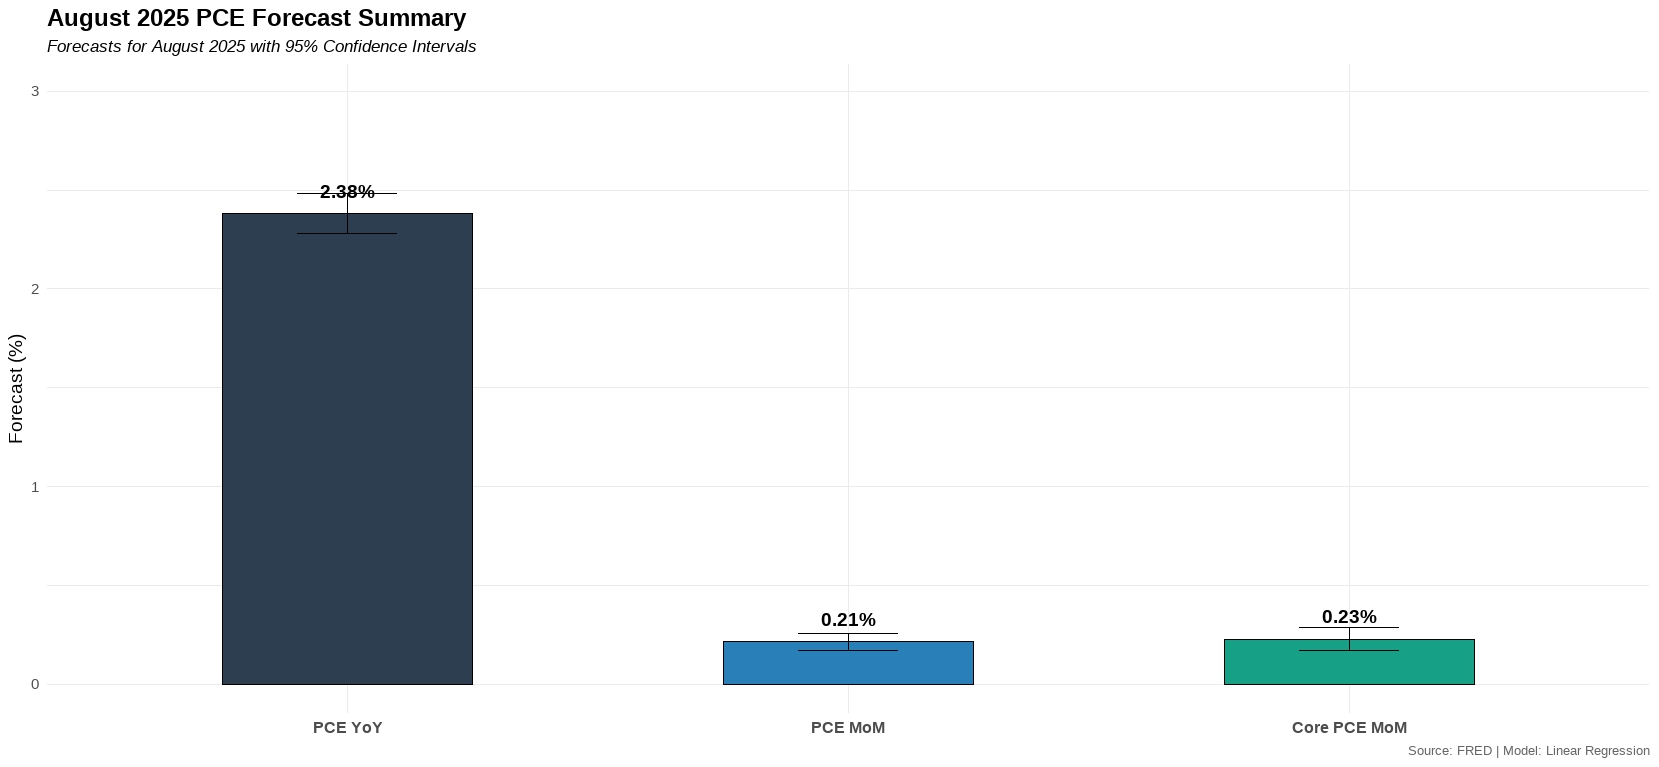
Source: Darkex Research
A higher-than-expected data may support expectations that the FED will maintain its cautious stance on interest rate cuts, reducing risk appetite and putting pressure on digital assets. A lower-than-expected data may pave the way for value gains with the opposite effect.
*General Information About Forecasts
In addition to the general market expectations, the forecasts shared in this report are based on econometric modeling tools developed by our research department. Different structures were considered for each indicator, and appropriate regression models were constructed in line with data frequency (monthly/quarterly), leading economic indicators and data history.
The basic approach in all models is to interpret historical relationships based on data and to produce forecasts that have predictive power with current data. The performance of the models used is measured by standard metrics such as mean absolute error (MAE) and is regularly re-evaluated and improved. While the outputs of the models guide our economic analysis, they also aim to contribute to strategic decision-making processes for our investors and business partners. Data is sourced directly from the FRED (Federal Reserve Economic Data) platform in an up-to-date and automated manner, so that every forecast is based on the latest economic data. As the research department, we are also working on artificial intelligence-based modelling methods (e.g. Random Forest, Lasso/Ridge regressions, ensemble models) in order to improve forecast accuracy and react more sensitively to market dynamics. The macroeconomic context should be taken into account in the interpretation of model outputs, and it should be kept in mind that there may be deviations in forecast performance due to economic shocks, policy changes and unforeseen external factors. With this monthly updated working set, we aim to provide a more transparent, consistent and data-driven basis for monitoring the macroeconomic outlook and strengthening decision support processes.
Legal Notice
The investment information, comments and recommendations contained in this document do not constitute investment advisory services. Investment advisory services are provided by authorized institutions on a personal basis, taking into account the risk and return preferences of individuals. The comments and recommendations contained in this document are of a general type. These recommendations may not be suitable for your financial situation and risk and return preferences. Therefore, making an investment decision based solely on the information contained in this document may not result in results that are in line with your expectations.