BTC/USDT
Bitcoin’s weekly performance! We left behind a week of heightened geopolitical tensions with Iran’s missile attack against Israel. Bitcoin, which was in the middle of the tensions, tested below the 60,000 level despite the optimistic October data, causing a liquidation of 550 million dollars. Critical non-farm employment data released by the US exceeded expectations, relieving the market to some extent and preventing the decline from deepening and starting a new upward movement. In addition, optimistic weather messages in the market continue to come from China, where crypto trading is banned, as bans are being questioned. With this news, the interest of institutional investors in Bitcoin has been increasing in Asia recently. More concrete developments in this direction in the coming days, the fact that presidential candidate D. Trump is again ahead in the polls during the US election process and the continuation of soft interest rate cuts by the FED may be among the developments that reinforce the optimistic atmosphere in Bitcoin.
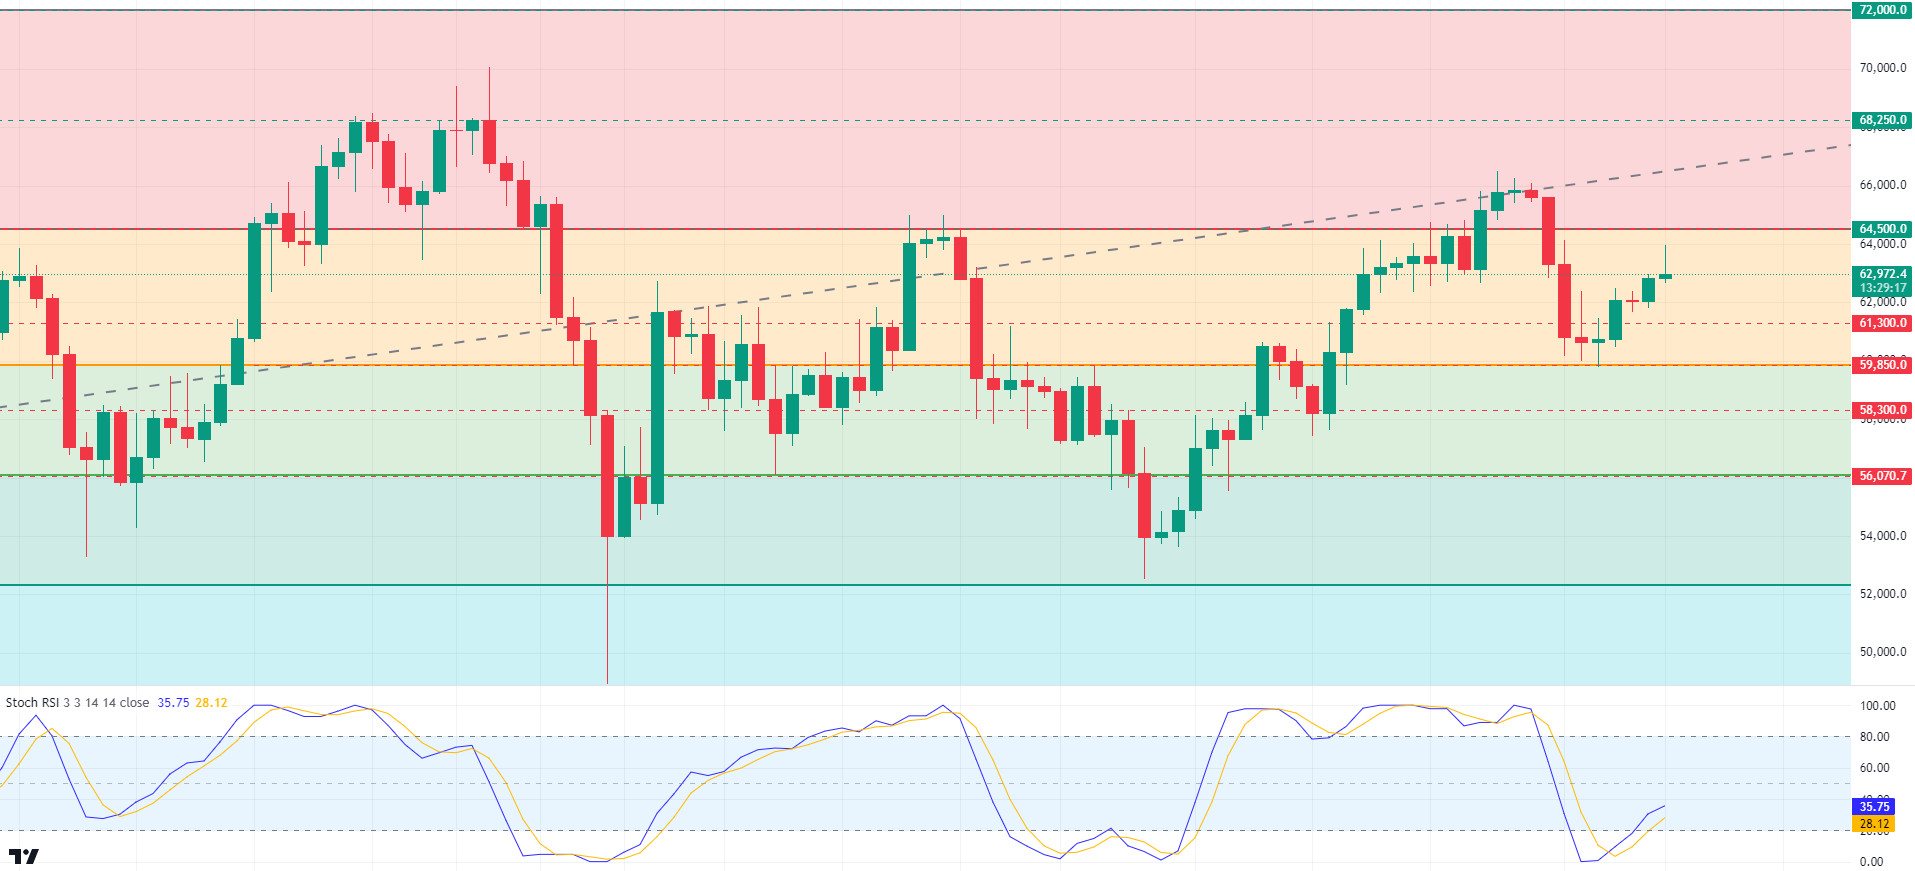
When we take a look at BTC’s technical analysis in the daily chart period, we see that the price, which tested the fibonnaci support level of 59,850, did not close daily below it and turned its direction up again. With the RSI, our technical indicator, turning its direction upwards, the resistance level that will meet us in the continuation of the upward momentum is 64,500 and with the crossing of this level, our technical band range can extend up to 68,250. In a possible retreat that will occur with the increasing tension on the Iranian and Israeli front, 61,300 and then 59,850 levels appear as the support level again.
Supports 61,300 – 59,850 – 56,000
Resistances 64,500 – 68,250 – 72,000
 ETH/USDT
When Dune data is monitored this week, TVL increases on Ethena and Scroll draw attention. Especially on the Scroll side, the increase in ETH added to liquidity pools is important. Another noteworthy issue is the large increase in the number of wallets holding 1000 or more ETH. We see that medium-sized institutional investors and whales are investing in Ethereum by increasing their risk appetite in the market, which has fallen with the Israeli-Iranian tension.
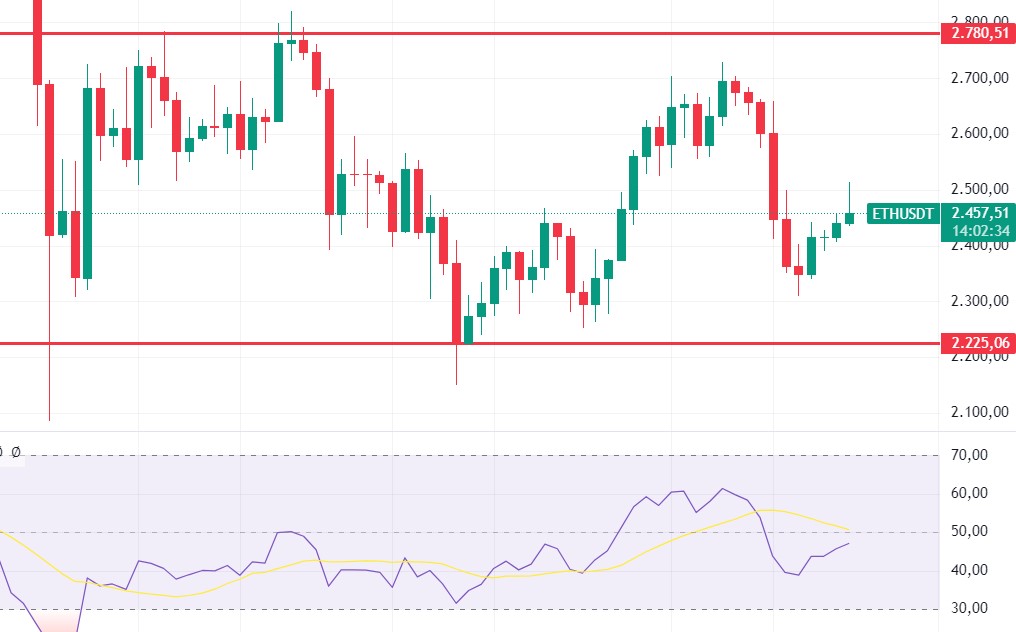
Technically, it is seen that Ethereum, which rose to the resistance of 2,510, which is also the
0.618 fib level
with the weekly close, corrected by rejecting from this region. RSI maintains its positive outlook. On the Ichimoku indicator, tenkan and kijun levels seem to be close to giving a sell signal on the daily timeframe. In the short term, deep declines to 2,225 levels can be seen with closures below 2,400. For the continuity of the rise, it seems important to maintain above 2,400. Above the 2,510 level, rises to 2,600 and then 2,780 levels can be seen quickly.
In summary, although it is likely to experience some retracements in the short term with the war risks, it can be said that positive trends may start in
the medium and long term based on onchain data.
Supports 2,400 – 2,225 – 2,022
Resistances 2,510 – 2,600 – 2,780
LINK/USDT
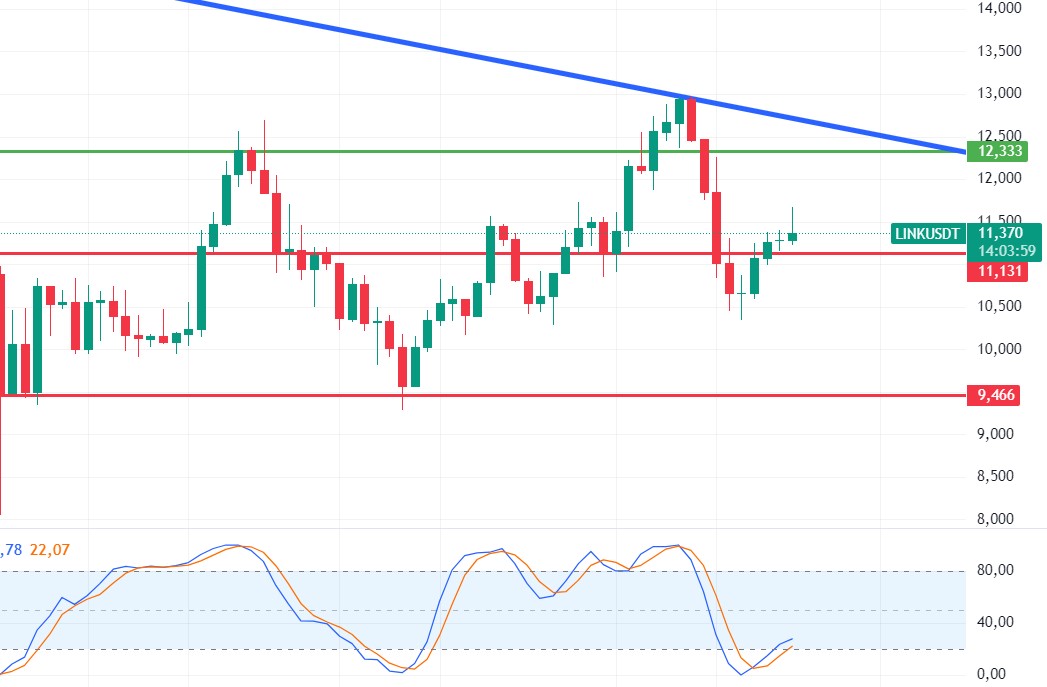
There is a slightly positive outlook for LINK, which has risen above the 11.13 resistance with the mobility of the markets. The trend line drawn in blue on the chart seems to be the most important resistance. It can be said that it is possible to see sharp rises by exceeding this level. CMF Stochastic RSI and RSI are positive on the daily. The tenkan and kijun levels that LINK rejected from the kumo cloud can quickly price above the 11.66 level towards the blue trend line. The loss of the 11.13 level may start a downtrend towards 9.46 levels again. However, in addition to all these, it can be expected to exhibit horizontal movements for a while with both the uncertainties in the market and the war news.
Supports 11.13 – 10.52 – 9.46
Resistances 12.34 – 13.84 – 14.76
SOL/USDT
Last week, Iran fired a missile at Israel, exacerbating the already tense situation in the Middle East. Cryptocurrencies are completely in the red. This caused the total volume of cryptocurrencies to fall by about 3.22% to $2.14 trillion. SOL reacted to this drop by falling 5.22%.
Another important development last week was Powell’s speech. Fed Chairman Powell: “The Fed is not in a hurry to cut interest rates and will act according to the data. If the economy develops as expected, there will be two more rate cuts of 25 basis points this year.” Last week, the ADP non-farm payrolls change from the US came in above expectations and strengthened the dollar. Another data, the non-manufacturing purchasing managers index, was recorded as 54.9, above the expected 51.7. This increase is a positive sign, as a value above 50 indicates that the non-manufacturing sector is expanding in general. The other important data, the unemployment rate, fell to 4.1. Non-farm payrolls, the most important data, increased by 254,000, making a 50 basis point rate cut difficult. According to the data from CME, the 25 basis point rate cut rate was 90.5% after the data was announced.
In the Solana ecosystem, Solana founder Yakovenko criticized the US government for failing to create local blockchain jobs. Yakovenko blames US policies for the relocation of Solana jobs overseas. The Solana co-founder expressed his disappointment with the US approach to crypto regulations. On the other hand, Solayerlabs, in partnership with OpenEdenLabs, launched sUSD, the first yielding USD on Solana, offering US Treasury Bill interest and restructuring features. At the same time, former NSA whistleblower Edward Snowden openly criticized the Solana blockchain network for its centralization. Speaking via video link at the Token2049 conference, Snowden expressed doubts about Solana’s operational model, describing it as a system that is open to manipulation by nation states and bad actors due to its centralized structure, stating that meme tokens are only used for fraud. The response came from Mert Mumtaz, CEO of Helius Labs and an ardent supporter of Solana. Rejecting Snowden’s allegations, Mumtaz emphasized the resilience of the network and challenged skeptics to prove how a centralized structure could abuse the Solana system, asking critics to provide concrete evidence. This demonstrated the prevailing belief among Solana supporters that fears of centralization are exaggerated and unfounded.
Another news in the ecosystem was that Pump.fun continued its sales. 122,250 SOL, or $18.9 million worth of sales, may create short-term selling pressure. This week, the first of the issues we need to follow is the course of tension in the Middle East. However, the consumer price index from the US is of great importance.
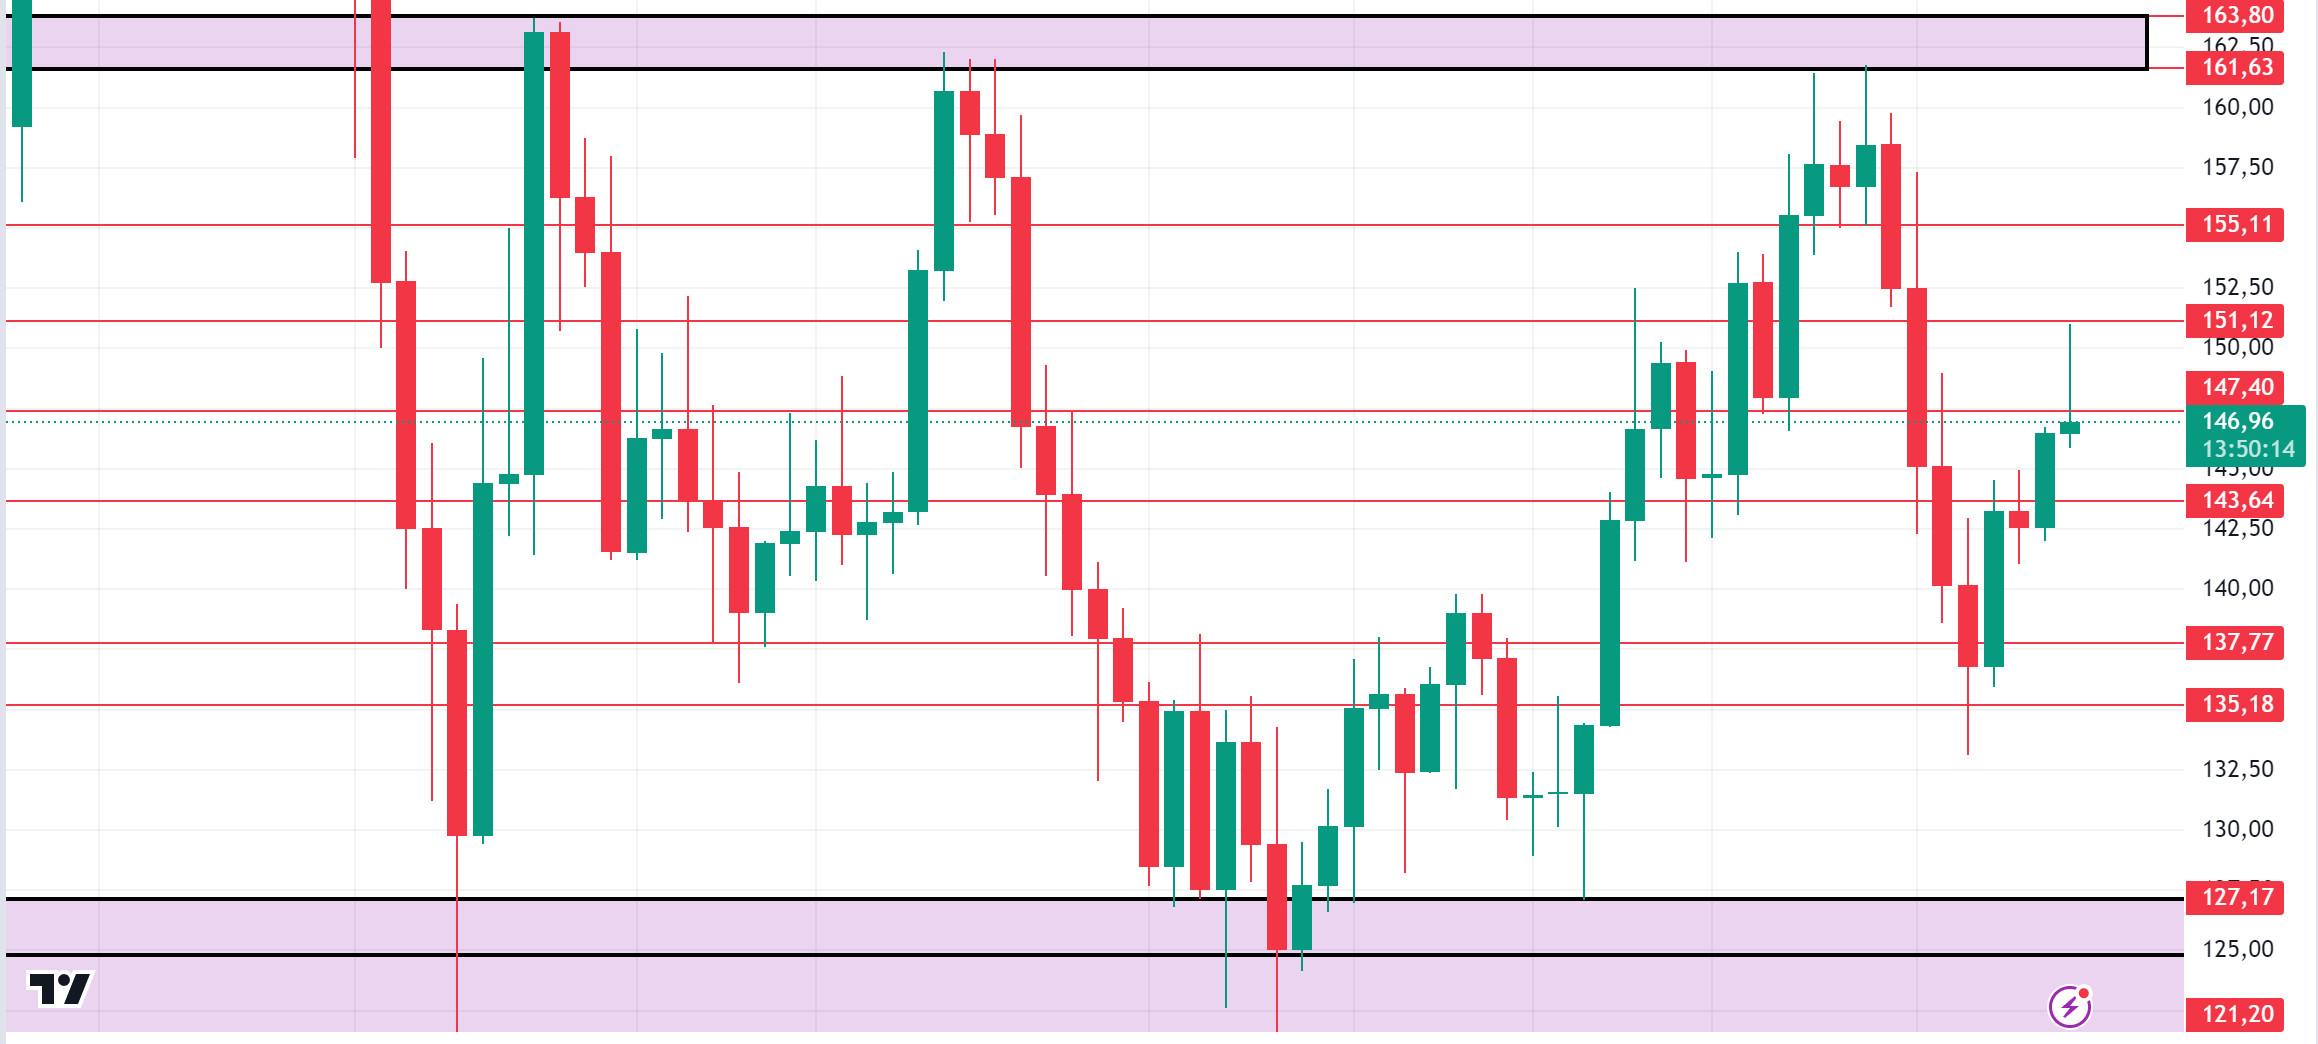
Technically speaking, the FED’s interest rate cut seems to help the token break the consolidation it has maintained since about April. When we look at the SOL chart, it has been consolidating between 121.20 – 163.80 since August 2. The floor and ceiling levels in the consolidated area can be important places to take a position. If the positive results in macroeconomic data and positive developments in the ecosystem continue, the first resistance levels seem to be 161.63 – 163.80. Profit sales due to the rise of BTC will also affect SOL. However, if the political and macroeconomic data coming this week are negative for cryptocurrencies, 135.18 – 127.17 levels can be followed and a buying point can be determined.
Supports 143.64 – 137.77 – 135.18
Resistances 151.12 – 155.11 – 161.63
ADA/USDT
Last week, Iran fired a missile at Israel, exacerbating the already tense situation in the Middle East. Cryptocurrencies are completely in the red. This caused the total volume of cryptocurrencies to fall by about 3.22% to $2.14 trillion. SOL reacted to this drop by falling 5.22%.
Another important development last week was Powell’s speech. Fed Chairman Powell: “The Fed is not in a hurry to cut interest rates and will act according to the data. If the economy develops as expected, there will be two more rate cuts of 25 basis points this year.” Last week, the ADP non-farm payrolls change from the US came in above expectations and strengthened the dollar. Another data, the non-manufacturing purchasing managers index, was recorded as 54.9, above the expected 51.7. This increase is a positive sign, as a value above 50 indicates that the non-manufacturing sector is expanding in general. The other important data, the unemployment rate, fell to 4.1. Non-farm payrolls, the most important data, increased by 254,000, making a 50 basis point rate cut difficult. According to the data from CME, the 25 basis point rate cut rate was 90.5% after the data was announced.
In the Cardano ecosystem, the test network for the privacy protocol Midnight Network was launched. The new development brought Cardano back to the agenda in the blockchain world. The Midnight Protocol aims to legalize privacy on the Cardano network. It was designed especially for organizations and developers who want to maintain blockchain transparency. According to data from Santiment, the profit and loss indicator shows that investors aim to hold ADA in the long term. However, data from Artemis shows that the number of daily active addresses has generally declined since September 7. It remains to be seen whether this will be reflected as a sell on ADA. According to Token unlocks, approximately 18.53 million ADA tokens were unlocked last week, representing 0.5% of the total ADA supply. In another development, Vladimir Kalnitsky, a developer who played an important role, announced his departure from the project. Kalnitsky said he gained experience in Cardano’s PureScript ecosystem but has now lost interest in functional programming, especially Haskell. Looking at the chart, ADA has lost about 7.44% since last week.
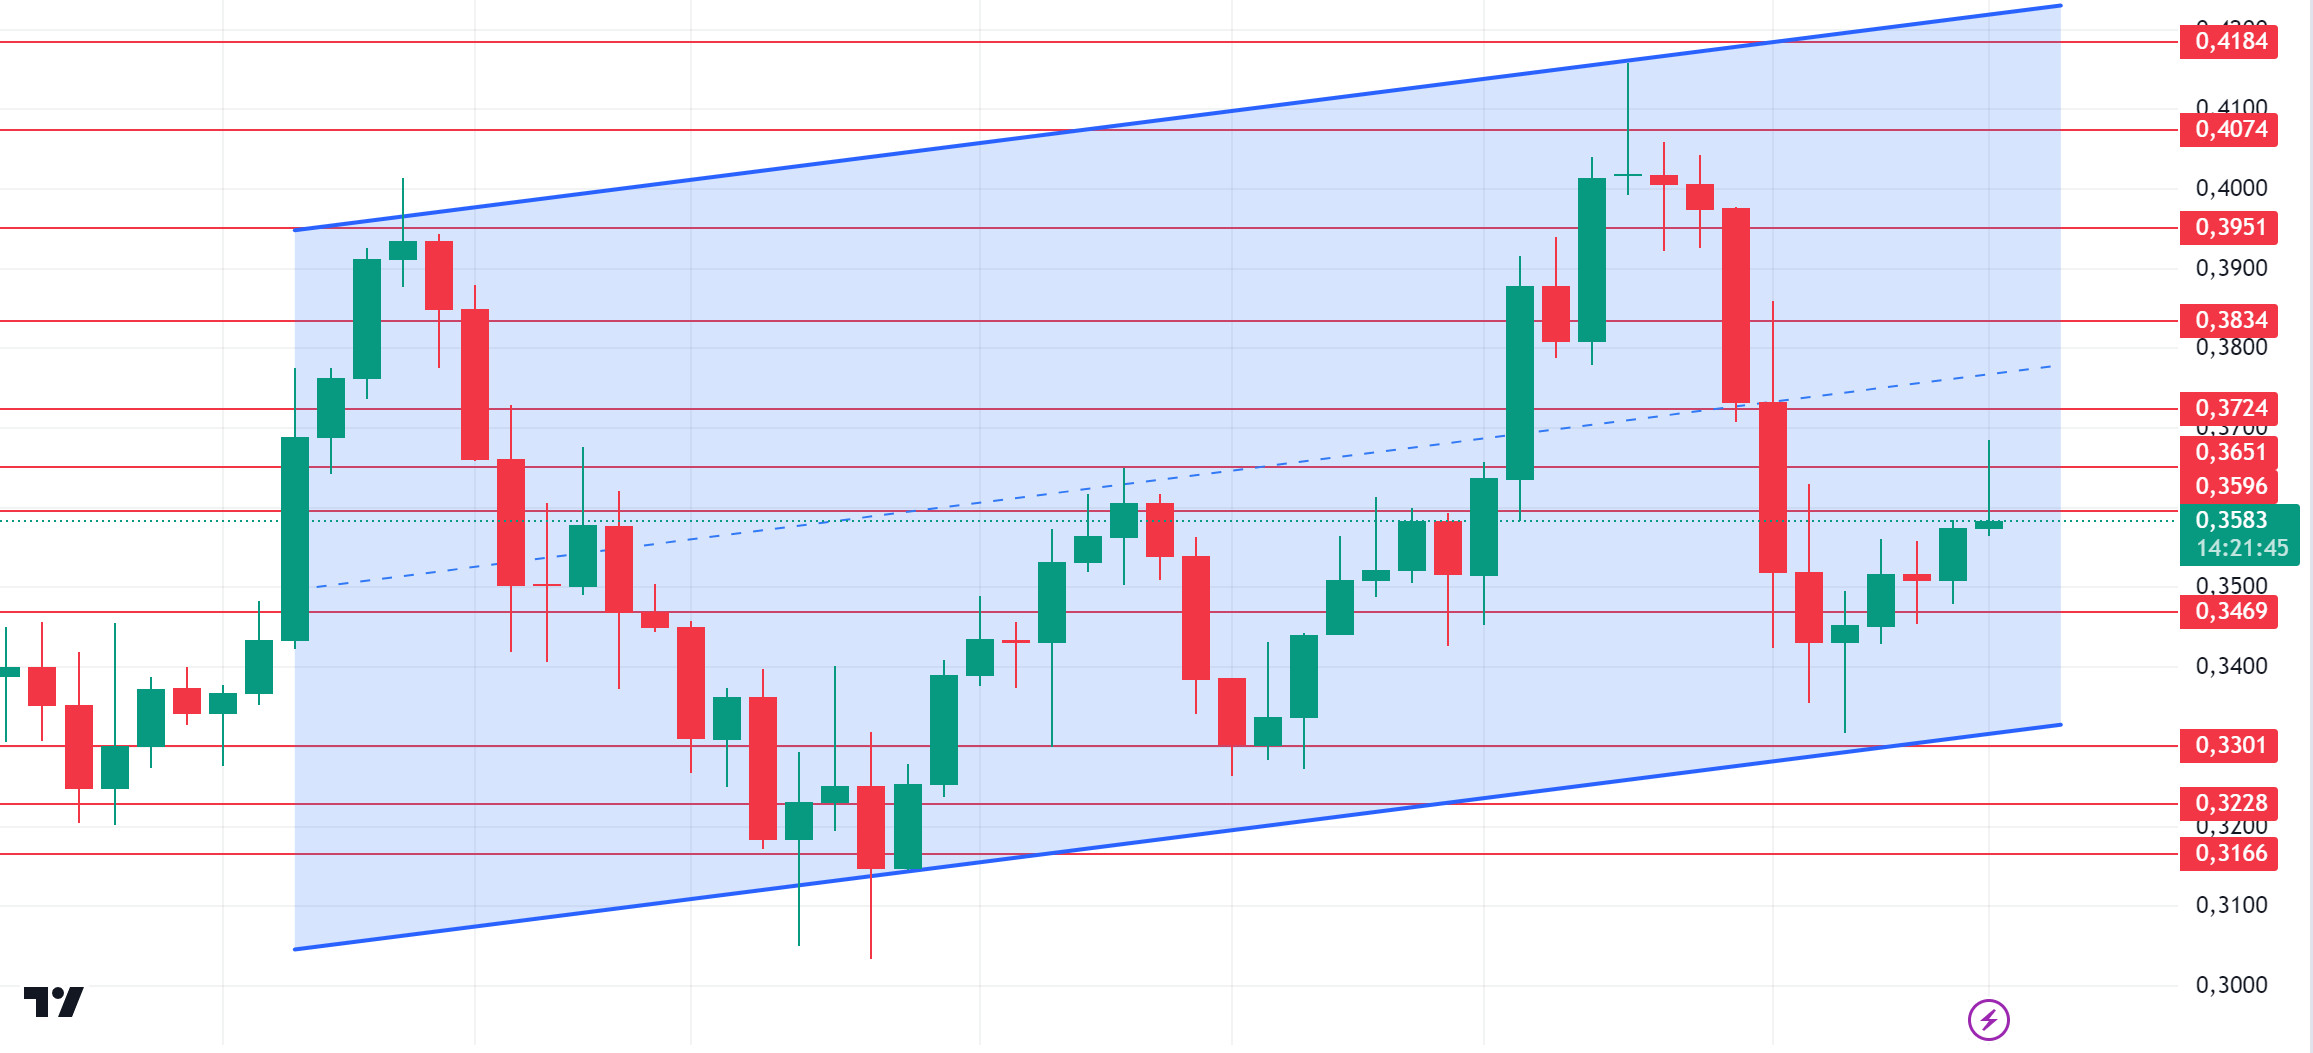
Since August 24, ADA, which has been accumulating since August 24, may break out of this cycle if the overall market moves positively. If the uptrend starts, we can identify the 0.3724 – 0.3834 levels as a strong resistance. In case of possible macroeconomic conditions and negative developments in the Cardano ecosystem, it can be priced up to 0.3301 – 0.3228 levels.
Supports 0.3469 – 0.3301 – 0.3228
Resistances 0.3596 – 0.3651 – 0.3724
AVAX/USDT
AVAX, which started the previous week at 29.04, fell by about 7% during the week due to the tension in the Middle East and closed the week at 26.94. This week, consumer price index, unemployment claims and producer price index data will be released in the US. The market will continue to look for direction according to these data and news from the Middle East. These data will affect AVAX along with the market. High volatility may occur in the market during and after the data release.
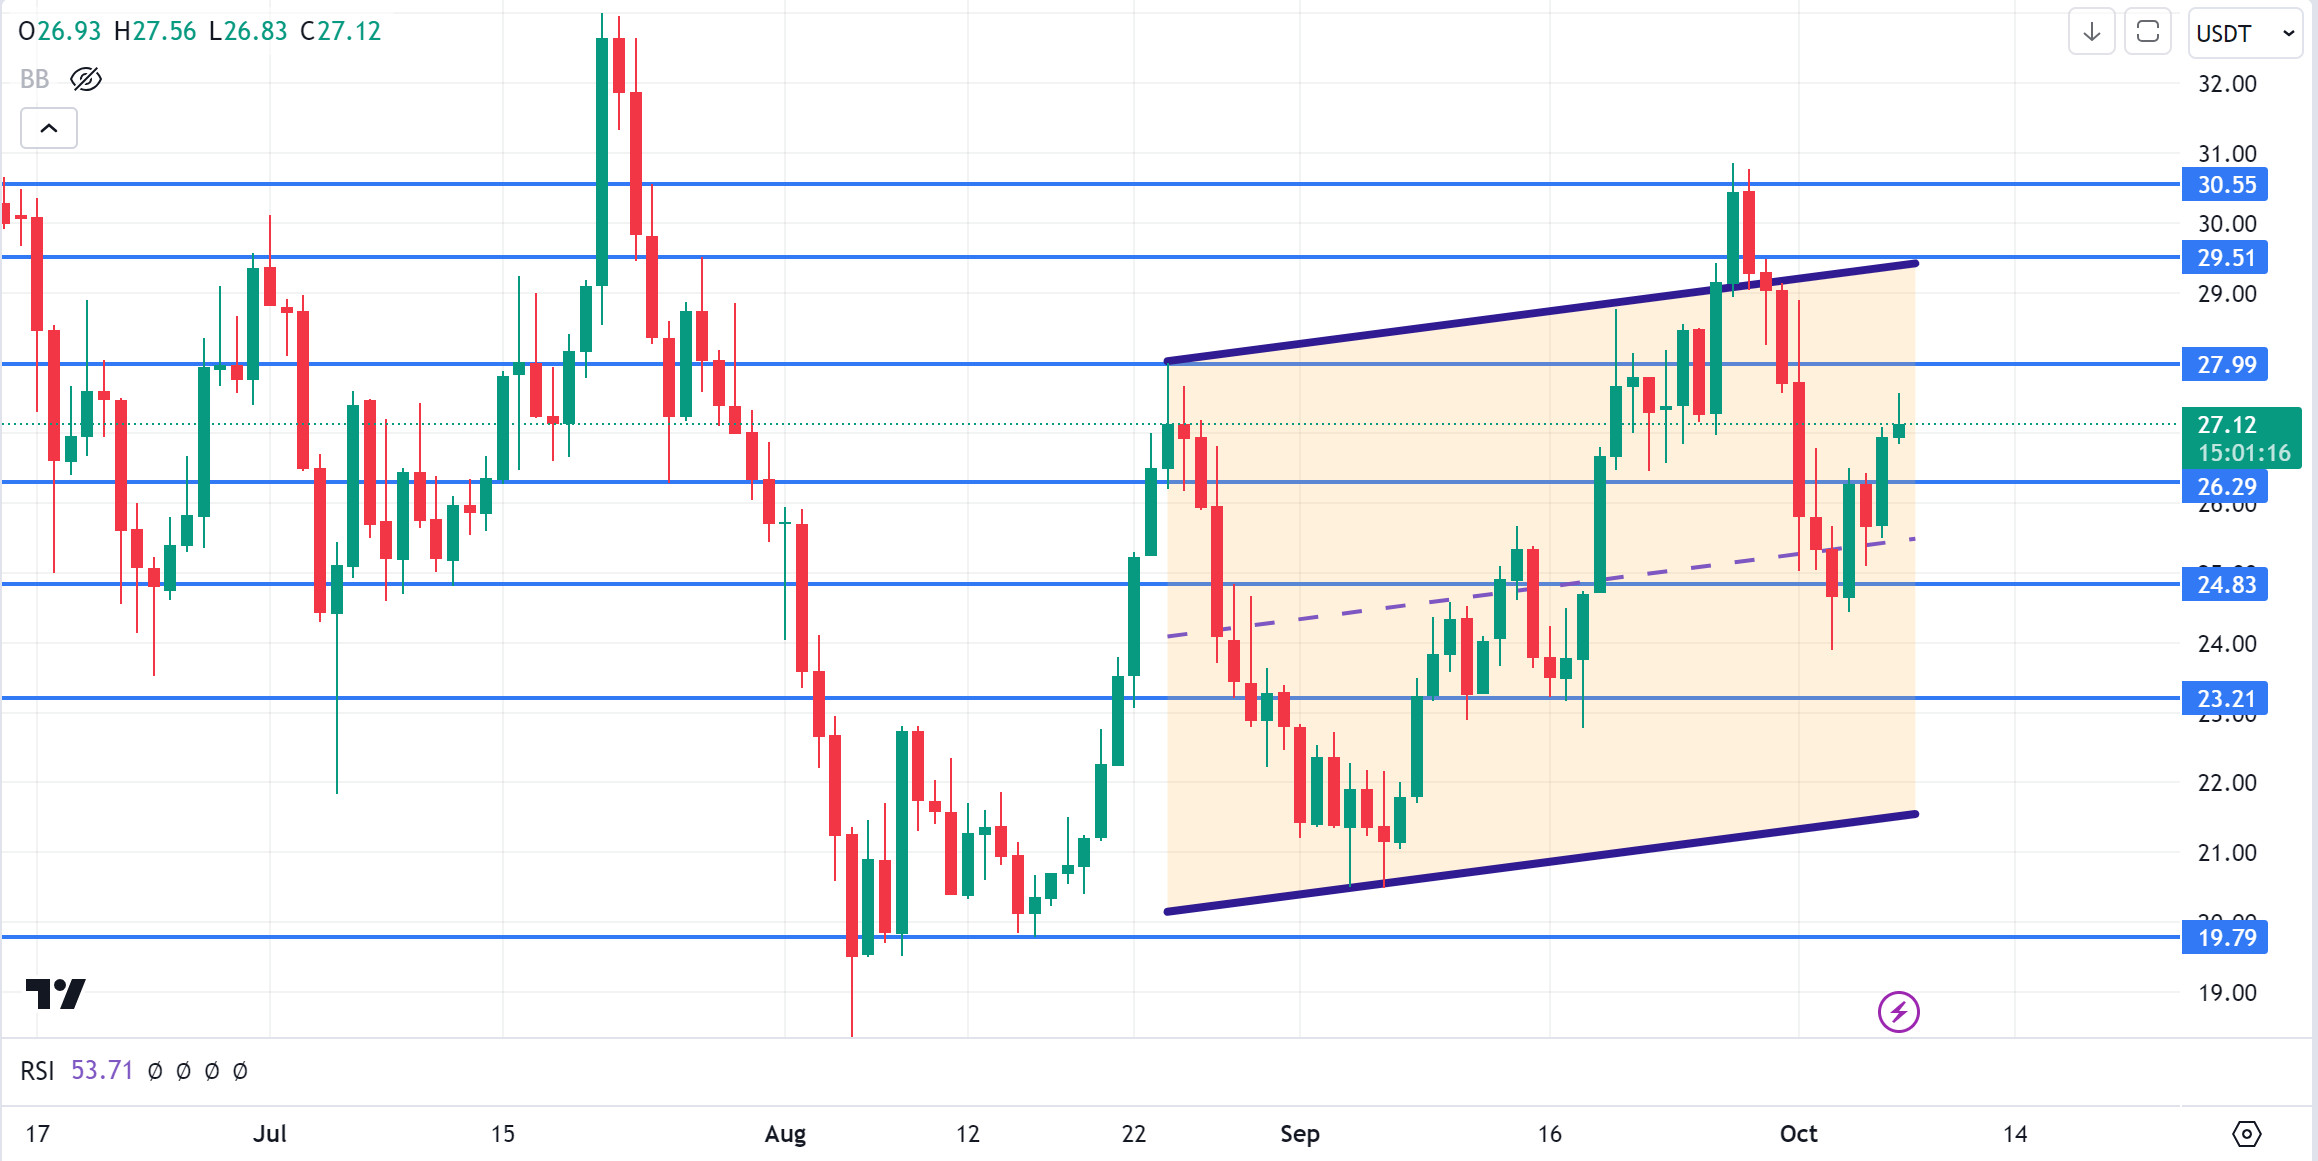
AVAX, which was trading at 27.12 at the time of writing this analysis and continues its movement within the rising channel on the daily chart, may move towards the upper band of the channel with the positive perception of the upcoming data by the market. In such a case, it may test the 27.99 and 29.51 resistances. Especially with the candle closure above 29.51 resistance, its rise may accelerate. With the reaction from the upper band of the channel and selling pressure, it may move towards the middle and lower band of the channel and test the 26.29 and 24.83 supports. As long as there is no candle closure below 19.79 support on the daily chart, the upward appetite may continue. The decline may deepen with the candle closure below this support.
Supports 26.29 – 24.83 – 23.21
Resistances 27.99 – 29.51 – 30.55
TRX/USDT
TRX, which started last week at 0.1565, fell about 1.5% during the week and closed the week at 0.1543.
This week, consumer price index, unemployment claims and producer price index data will be released in the US. These data are important to affect the market and the data to be announced in line with expectations may have a positive impact.
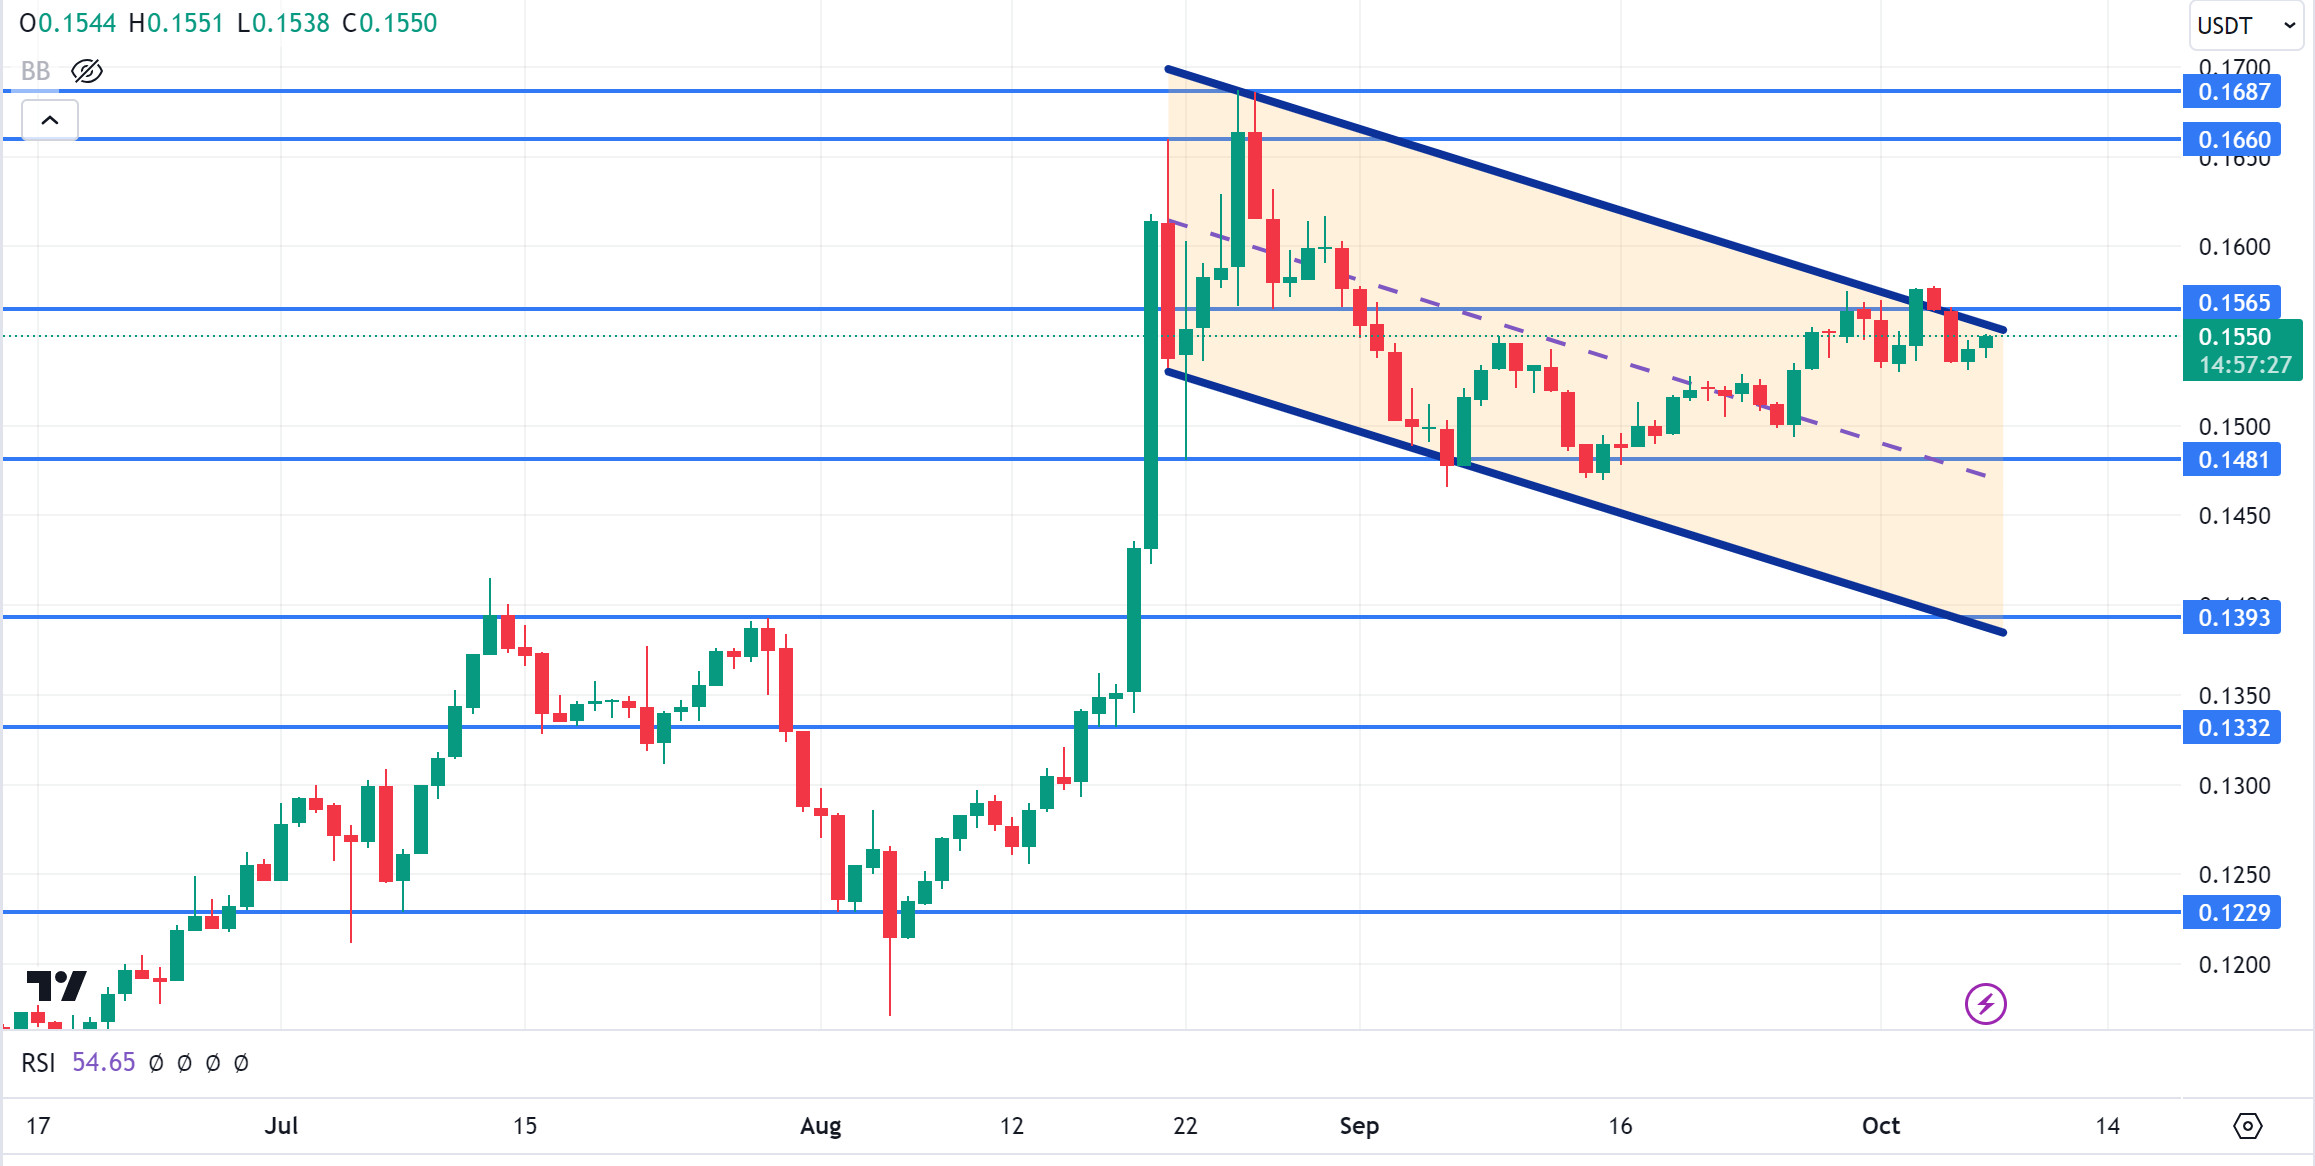
TRX, which was trading at 0.1550 at the time of writing this analysis and moving in a falling channel on the daily chart, is at the upper band of the channel. It can be expected to rise slightly from its current level and break the upper band of the channel. In such a case, it may test the 0.1565 and 0.1660 resistances. If it fails to break the upper band of the channel and declines with the selling pressure, it may want to test 0.1481 support. On the daily chart, the bullish demand may continue as long as it stays above 0.1229 support. If this support is broken, selling pressure may increase.
Supports 0.1481 – 0.1393 – 0.1332
Resistances 0.1565 – 0.1660 – 0.1687
XRP/USDT
Last week’s escalation of tensions in the Middle East and the SEC’s appeal against the court decision in the Ripple case, which is important for XRP, caused a sharp decline. After rising to 0.6650, XRP fell as low as 0.5066 due to the negativity experienced. XRP, which recovered with the subsequent purchases, continues to be traded in a horizontal band between 0.52 and 0.54 levels.
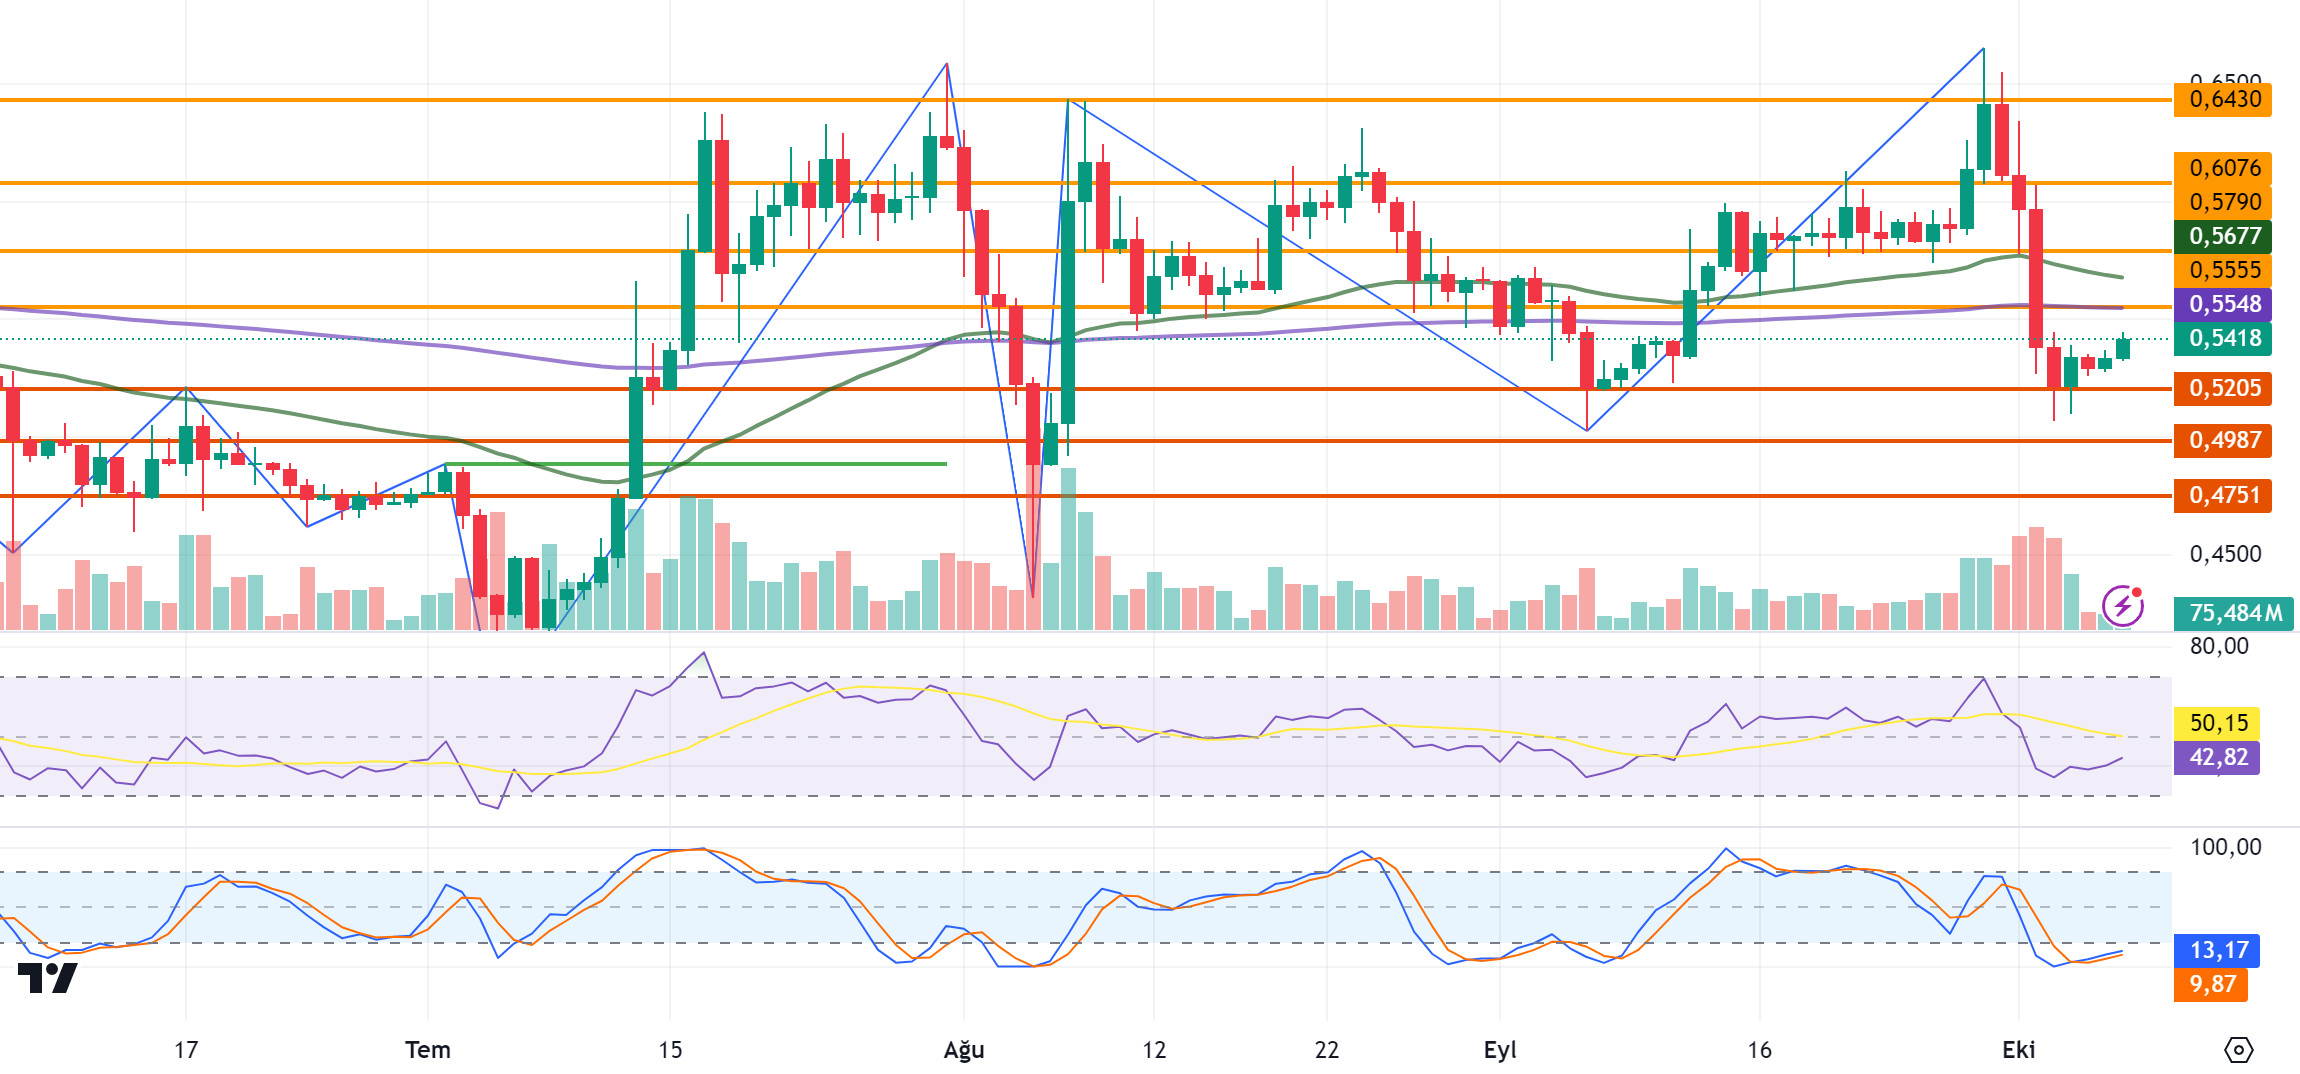
We are in October, a bullish month for the crypto market, and the crypto market is bullish after a period of negativity across the board. XRP also started the new week on a bullish note. If this momentum continues, XRP may test the resistance levels of 0.5555-0.5790-0.6076. Otherwise, it may test the 0.5205-0.4987-0.4751 support levels with a decline.
XRP may decline with possible sales at the EMA200 and 0.5555 resistance level in its rise and may offer a short trading opportunity. It may continue to rise by breaking the EMA200 level upwards or test the 0.50 support zone with its decline and may offer a long trading opportunity with possible purchases.
EMA50 (Green Line) – EMA200 (Purple Line)
Supports 0. 5205 – 0. 4987 – 0.4751
Resistances 0.5555 – 0. 5790 – 0.6076
DOGE/USDT
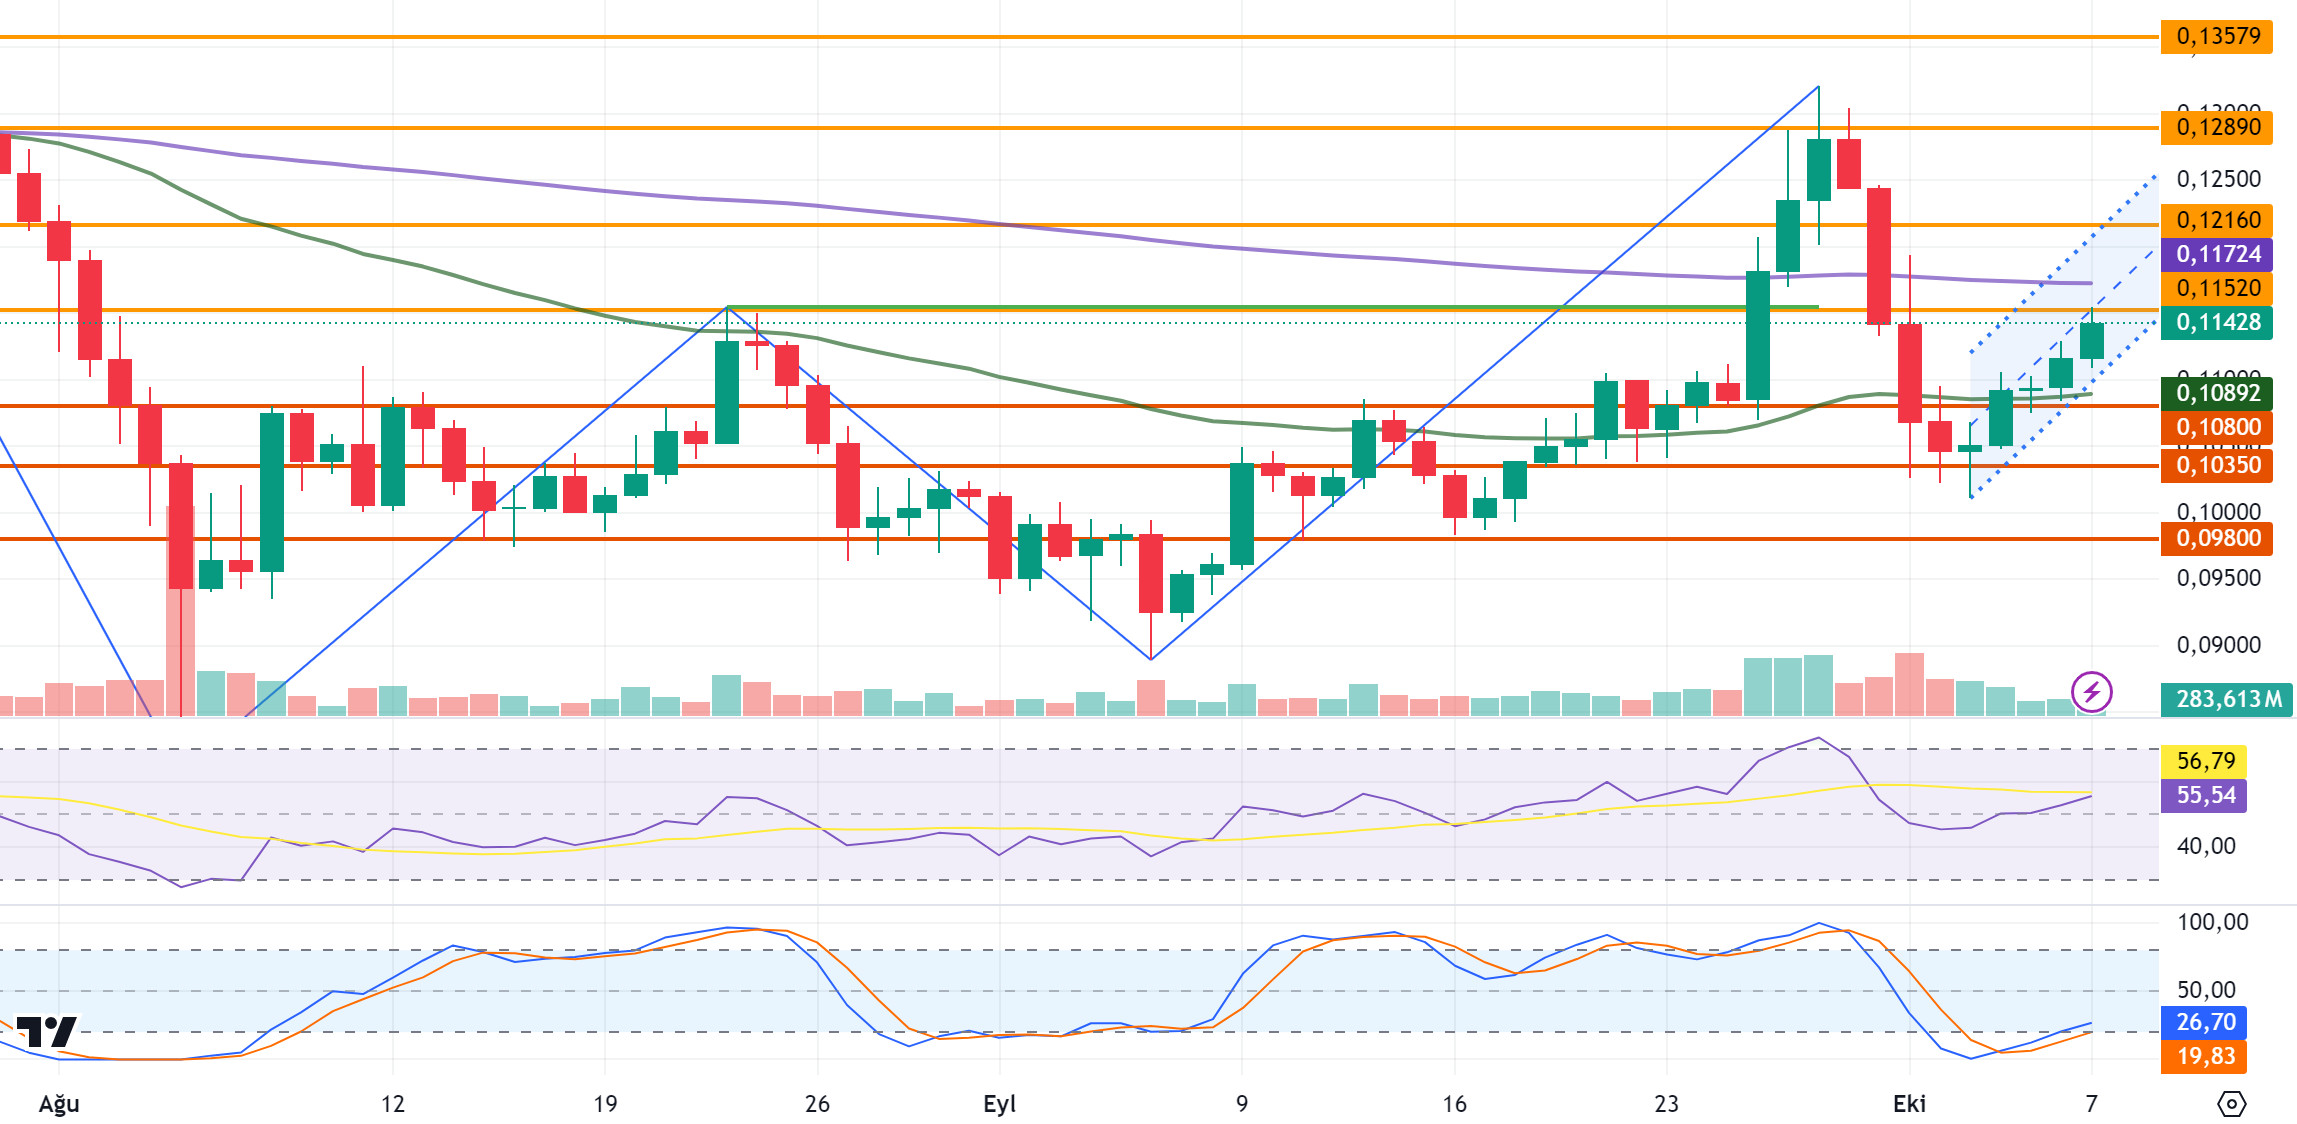
After Iran’s missile attack on Israel last week, tensions in the Middle East rose to the highest levels, and with the impact of these developments, sharp declines were seen across the crypto market. In this process, DOGE retreated to 0.1010 with sharp losses in this process, and then rose to 0.11 with the incoming purchases. On October 3, DOGE, which started to rise with the purchases after the decline it recorded on October 3, started the new week with an increase after 4 days of gains.
DOGE, which started the new week at 0.1115, continues to move within the rising channel. If the rise seen across the crypto market continues, DOGE may test the resistance levels of 0.1152-0.1216-0.1289. In case of negative developments on behalf of crypto assets, DOGE, which moves in parallel with the market, may replace the rise with a decline and test the support levels of 0.1080-0.1035-0.0980 with these losses.
DOGE may rise again with possible purchases at the EMA50 level in its decline and may offer a long trading opportunity. In its rise, it may decline with possible sales at the EMA200 level and may offer a short trading opportunity.
EMA50 (Green Line) – EMA200 (Purple Line)
Supports 0.1080 – 0.1035 – 0.0980
Resistances 0.1 152 – 0.1216 – 0.1289
DOT/USDT
Energy Web has launched the beta version of AutoGreenCharge, a mobile app that enables electric vehicle owners to charge with renewable energy. Secured by the Polkadot blockchain, the app allows users to reduce their impact on the environment by pairing every charge with clean energy. Integrated with popular vehicles such as Tesla, BMW and Mercedes, AutoGreenCharge can track energy consumption and environmental impact in real time. The launch of the app is seen as an important step in promoting the use of sustainable energy.
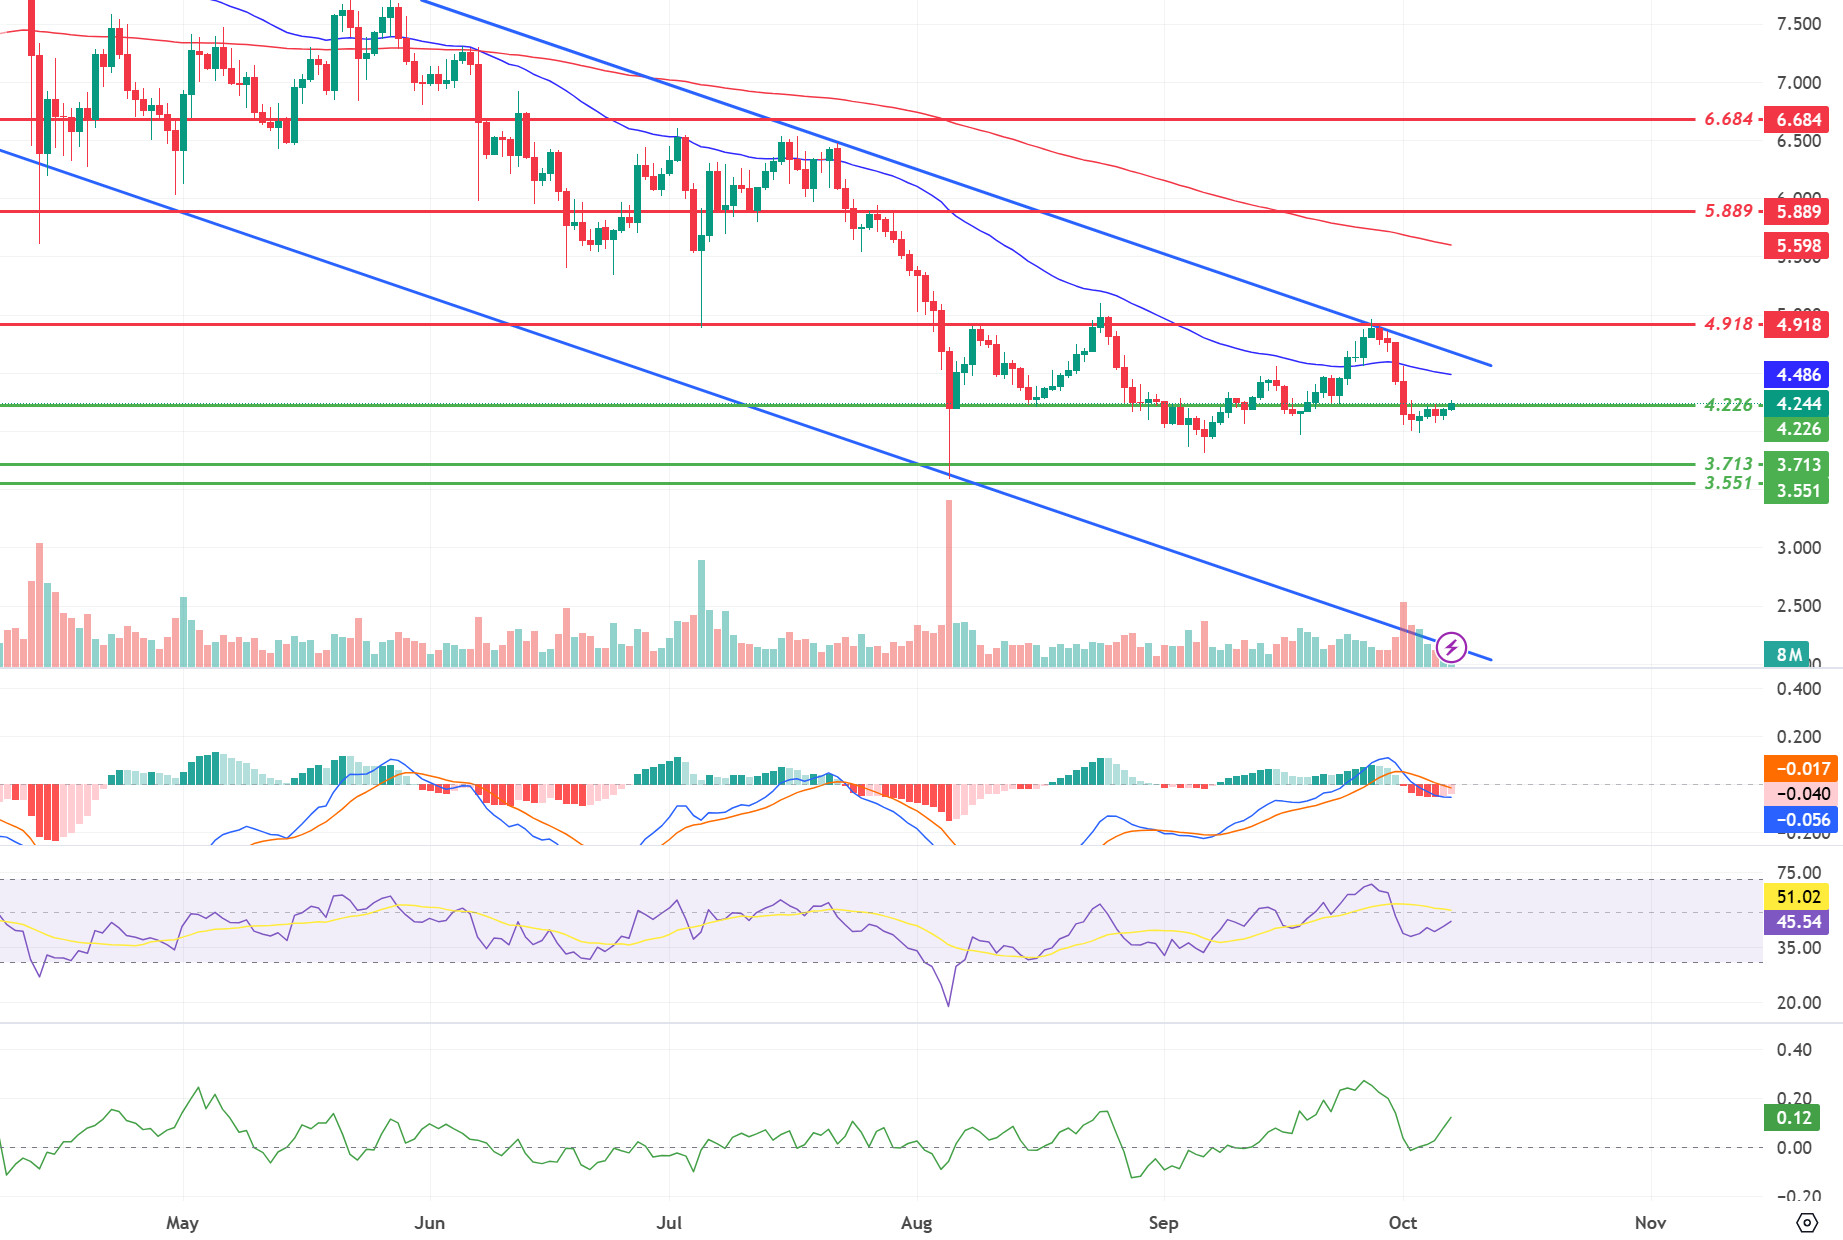
Rejected at 4.918, Polkadot (DOT) retreated to the support level of 4.226. According to the MACD oscillator, we see that the selling pressure has decreased compared to the previous day. Buyer pressure seems stronger according to the CMF oscillator. If the price breaks the falling channel upwards after maintaining above the 4.226 level, a rise towards 5.889 levels can be seen. On the other hand, if the selling pressure increases, the price may retreat towards 3,713 levels.
Supports 4,226 – 3,713 – 3,551
Resistances 4.918 – 5.889 – 6.684
SHIB/USDT
The Shiba Inu team has launched its new Web3 strategy game Shiboshi Rush on the Android platform, with an iOS version coming soon. Shiboshi Rush joins popular blockchain-based games in the Shiba Inu ecosystem such as Shiba Eternity and Agent Shiboshi. Shiba Inu leader Shytoshi Kusama has endorsed the ShibaCon event in Bangkok from November 5-15, which is eagerly anticipated by the SHIB community. In addition, the Shibarium layer-2 solution surpassed 7 million blocks, with a significant increase in the total number of transactions and wallet addresses. Despite the fluctuations in the SHIB price, the Shiba Inu team continues to expand the ecosystem with new projects and collaborations that will enhance data privacy.
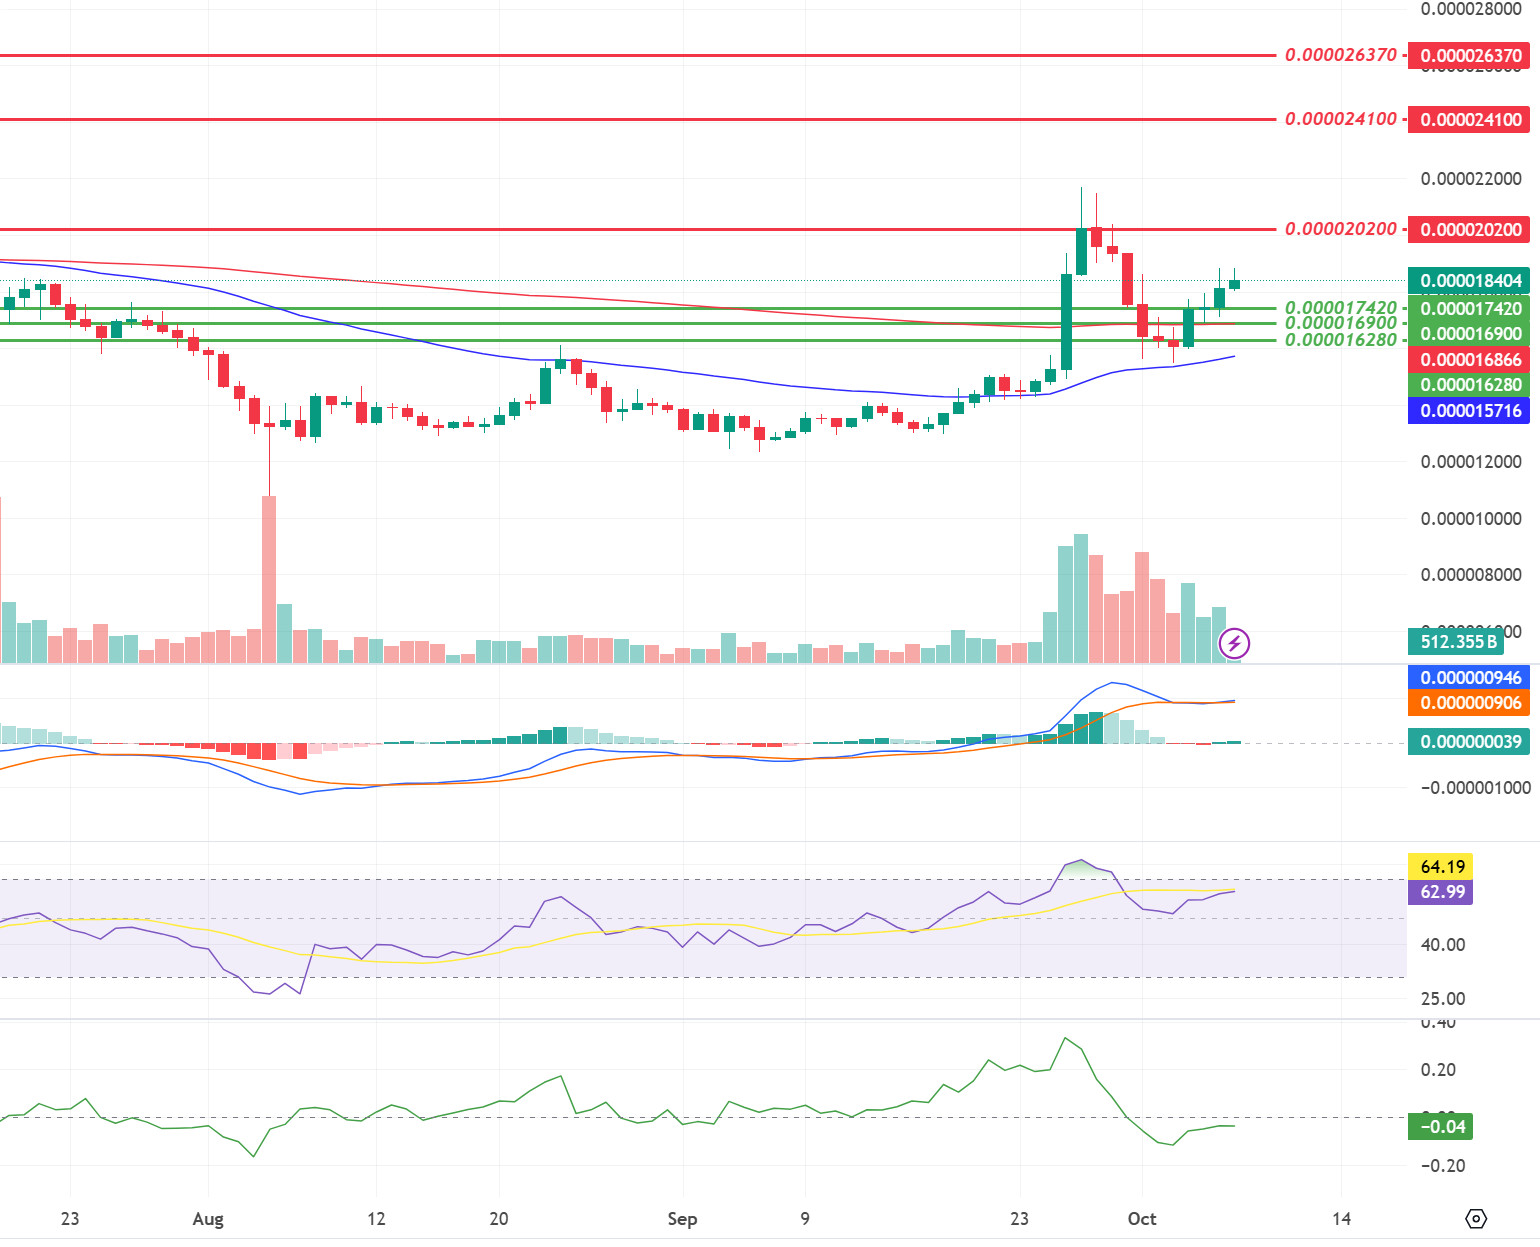
SHIB received a reaction from the 0.00001628 support level again. When we examine the MACD oscillator, we see that the buyer pressure increased compared to the previous day. If the EMA50 line breaks the EMA200 upwards, the price may retest the 0.00002020 level. According to the CMF oscillator, the seller pressure seems stronger. In the negative scenario, the price may retreat towards the 0.00001742 level.
Supports 0.00001742 – 0.00001690 – 0.00001628
Resistances 0.00002020 – 0.00002410 – 0.00002637
LEGAL NOTICE
The investment information, comments and recommendations contained in this document do not constitute investment advisory services. Investment advisory services are provided by authorized institutions on a personal basis, taking into account the risk and return preferences of individuals. The comments and recommendations contained in this document are of a general type. These recommendations may not be suitable for your financial situation and risk and return preferences. Therefore, making an investment decision based solely on the information contained in this document may not result in results that are in line with your expectations.


