
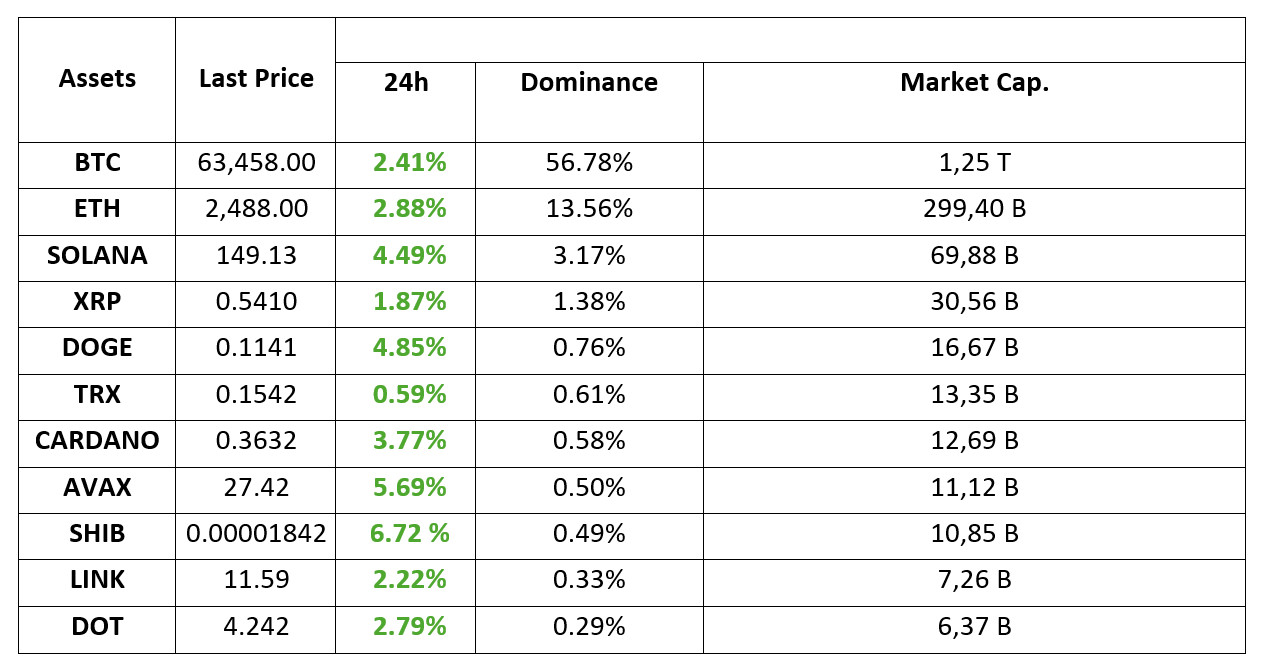
MARKET SUMMARY
Latest Situation in Crypto Assets
*Prepared on 10.7.2024 at 06:00 (UTC)
WHAT’S LEFT BEHIND
Bitcoin and Gold Could Benefit from Geopolitical Tensions and US Elections
JPMorgan (JPM) said in a research report that geopolitical tensions and the upcoming US presidential election will likely support a “debasement trade”, which will favor both bitcoin (BTC) and gold.
Can China Step Back From Cryptocurrency Ban?
Rumors that China could lift the cryptocurrency ban by the end of the year have started to be supported by positive signals. Stating that developments in the US have started to embrace cryptocurrencies, China’s former deputy finance minister Guangyao stated that China should also keep up with this trend.
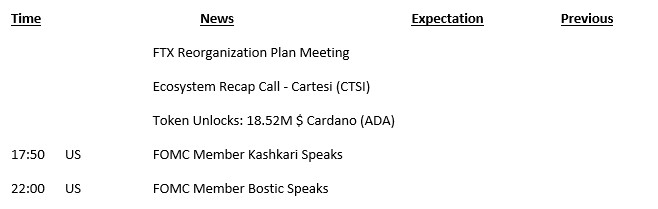
HIGHLIGHTS OF THE DAY
Important Economic Calender Data
INFORMATION:
*The calendar is based on UTC (Coordinated Universal Time) time zone. The economic calendar content on the relevant page is obtained from reliable news and data providers. The news in the economic calendar content, the date and time of the announcement of the news, possible changes in the previous, expectations and announced figures are made by the data provider institutions. Darkex cannot be held responsible for possible changes that may arise from similar situations.
MARKET COMPASS
The impact of the positive US employment data continues in global markets. Risk appetite revived after the data set released on Friday last week, which pointed to a much better picture for the US economy than market expectations. While stock market indices were on the rise, digital assets also had the opportunity to get rid of the pressure felt recently.
Investors are watching tensions between Iran and Israel, which remain high, while focusing on macro dynamics. Markets seem to be on hold for the time being on the news from the Middle East, but new news flows that could signal a further escalation in tensions could raise concerns in the markets again.
After the employment data, which is thought to be evidence that the US economy is in a “soft landing” situation, we saw a rise in BTC and major sub-coins. At the same time, the dollar index and stock market indices were also affected by this positive mood. On the other hand, according to the CME FedWatch Tool, it has become unlikely that the US Federal Reserve (FED) will cut interest rates by 50 basis points at its November meeting. According to this tool, markets are pricing in a 25 basis point rate cut with almost 96% probability. The expectation that the interest rate may remain unchanged is around 4%.
For now, there is no major reason why this positive mood should not continue, at least in a calmer tone and with intermediate corrections. A potential news flow that could increase geopolitical risks could be effective. Or macro indicators that will provide more information about the outlook for the US economy later in the week could change the game. Other than that, a pullback would not be surprising given the nature of the market after the recent rallies, as we try to envision the picture of the short-term outlook. For now, we can consider this potential pullback as a preliminary preparation for a new uptrend, unless something happens to disrupt the general mood. Later in the week, data on the FED’s course and the US economy (inflation) will be important.
TECHNICAL ANALYSIS
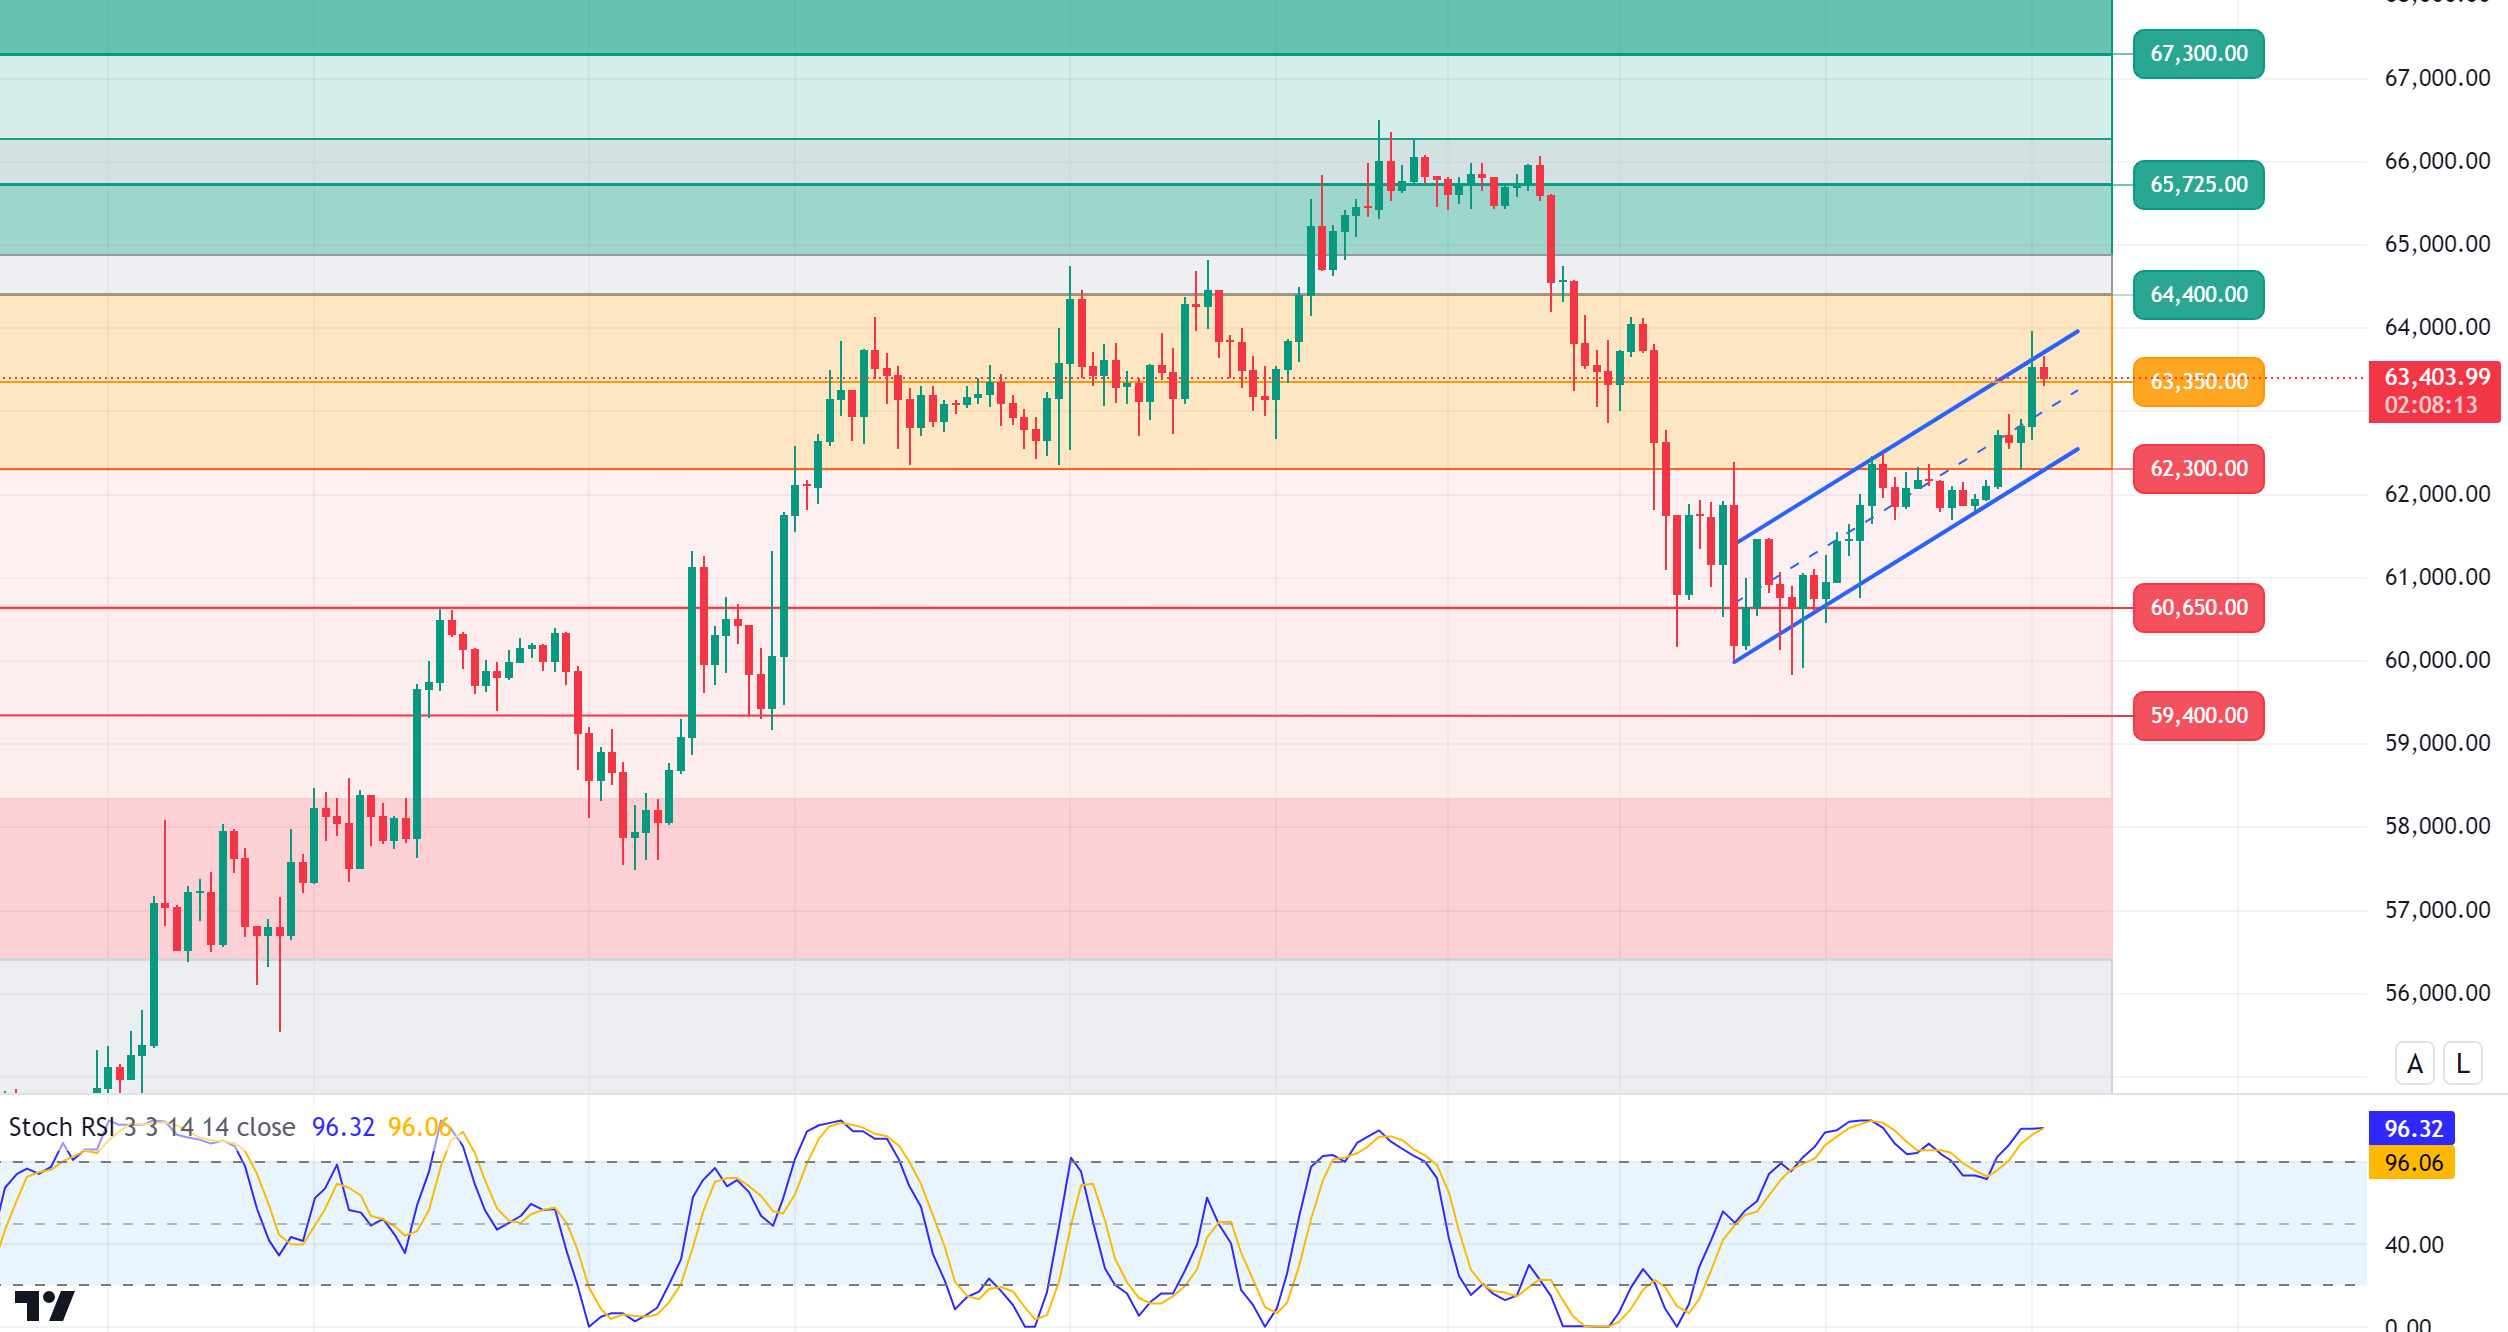
BTC/USDT
Attack from Bitcoin! Bitcoin, which fell below the 60,000-level last week with geopolitical tensions, started the new week above the 63,350 level again with the rises it recorded over the weekend. Behind the rise, crypto trading, which was banned in China in 2021, is said to be messages from political officials to lift the bans. In addition, as the interest of institutional investors continues on the Asian side, the end of three-day negative entries on the ETF side is another factor triggering the rise. The liquidation of “short” trades clustered between 63,000 and 64,000 levels in market dynamics may have kept the market’s desire to test these levels alive. In the BTC 4-hour technical analysis, the acceleration of the uptrend with the break of the 62,300-support point enabled it to test the 63,950 level. Facing sales in this region, BTC could not hold on and retreated and is currently pricing at 63,370. Persistence above the minor support level of 63,350 may bring upward momentum again. BTC, which forms an uptrend channel within the downtrend, may experience a pullback towards our lower trend line of 62,300 with the loss of the 63,300-support level.
Supports 62,300 – 60,650 – 59,400
Resistances 64,400 – 65,750 – 67,300
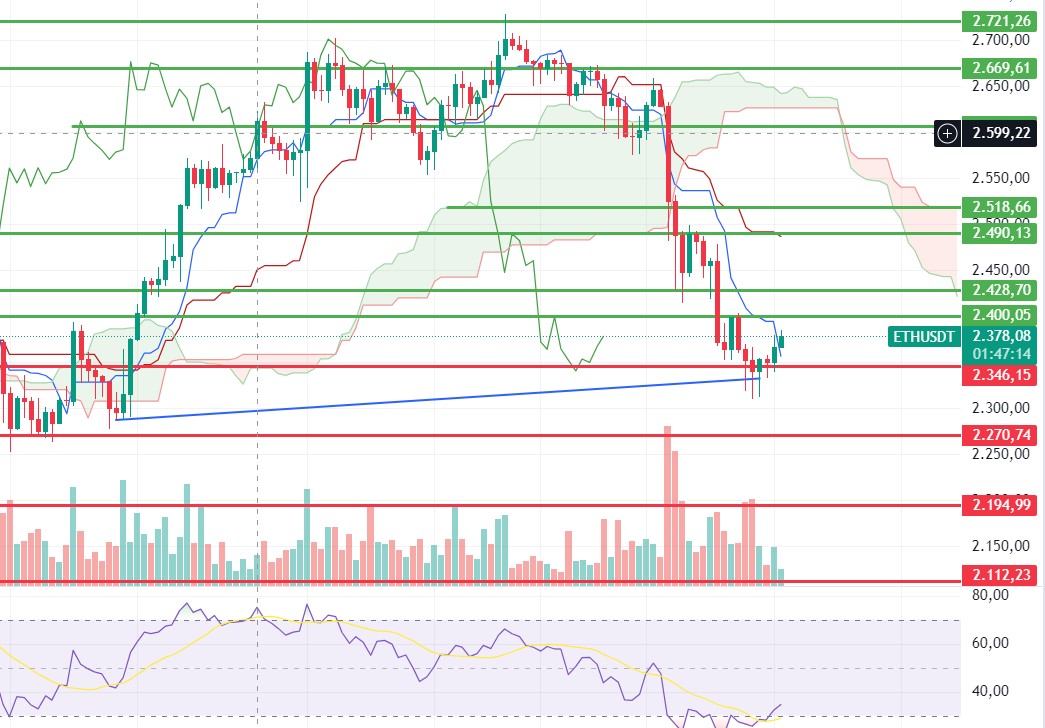
ETH/USDT
Ethereum rallied sharply above the 2,400 level overnight and into the weekend, reaching as high as 2,510. It took some reaction from this level and fell below 2,490 resistance. For Ethereum, which continues to price in the Kumo cloud, we may see stasis during the day. In order for the negative mismatch in the RSI to break down and the negative structure on CMF to correct, some retracement or regain the 2,640 level is required. The retracement seems possible up to 2.460 levels. Above the 2,518 level, we can see that the 2,640 level is exceeded with hard candles.
Also, looking at the CVDs, we see that the overnight rise was realized in a common way from spot and futures channels. It is seen that the correction movement comes from the sales on the spot side. In the light of this data, it can be said that the retracements may end at 2,460 levels. The break of this level may bring sharp declines to 2,400 levels again.
Supports 2,460 – 2,400 – 2,346
Resistances 2,490 – 2,518 – 2,571
LINK/USDT
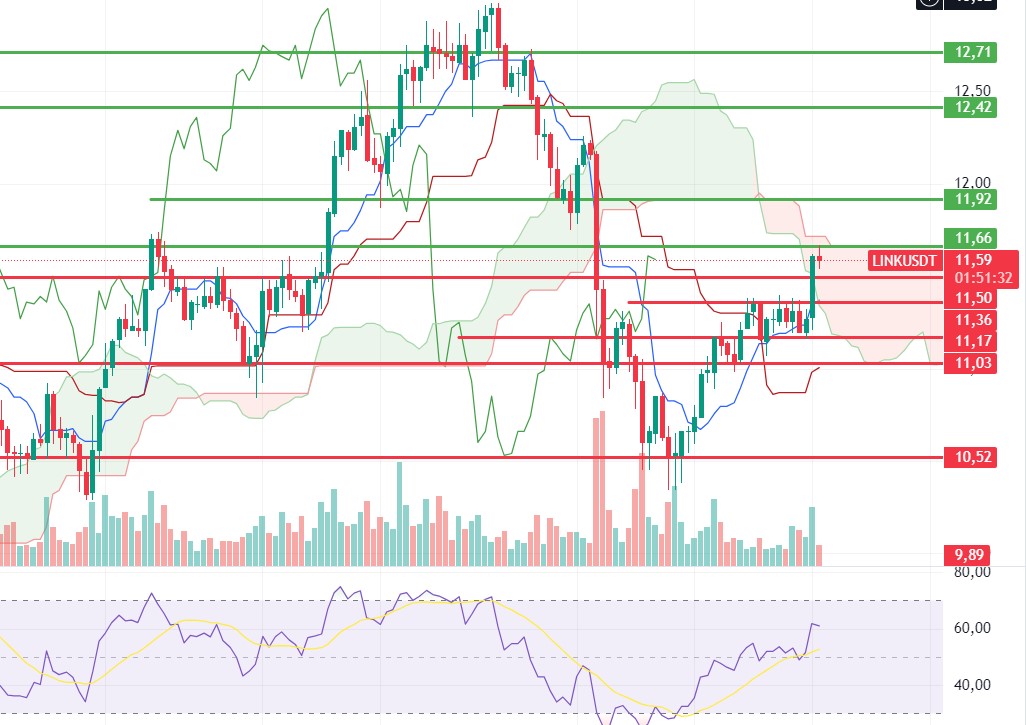
Surpassing the 11.36 level and rising to 11.66 kumo cloud resistance with a hard and voluminous candle, LINK has fallen to 11.55 with the reaction it received from this level. In addition to the turn signals on RSI and CMF, OBV and momentum continue their positive outlook. In this context, a horizontal movement between 11.66 – 11.50 levels can be expected during the day. The break of 11.66 level may bring movements towards 11.92 levels. A downside breaks of 11.50 may bring declines down to 11.36.
Supports 11.50 – 10.36 – 10.17
Resistances 11.66 – 11.92 – 12.42
SOL/USDT
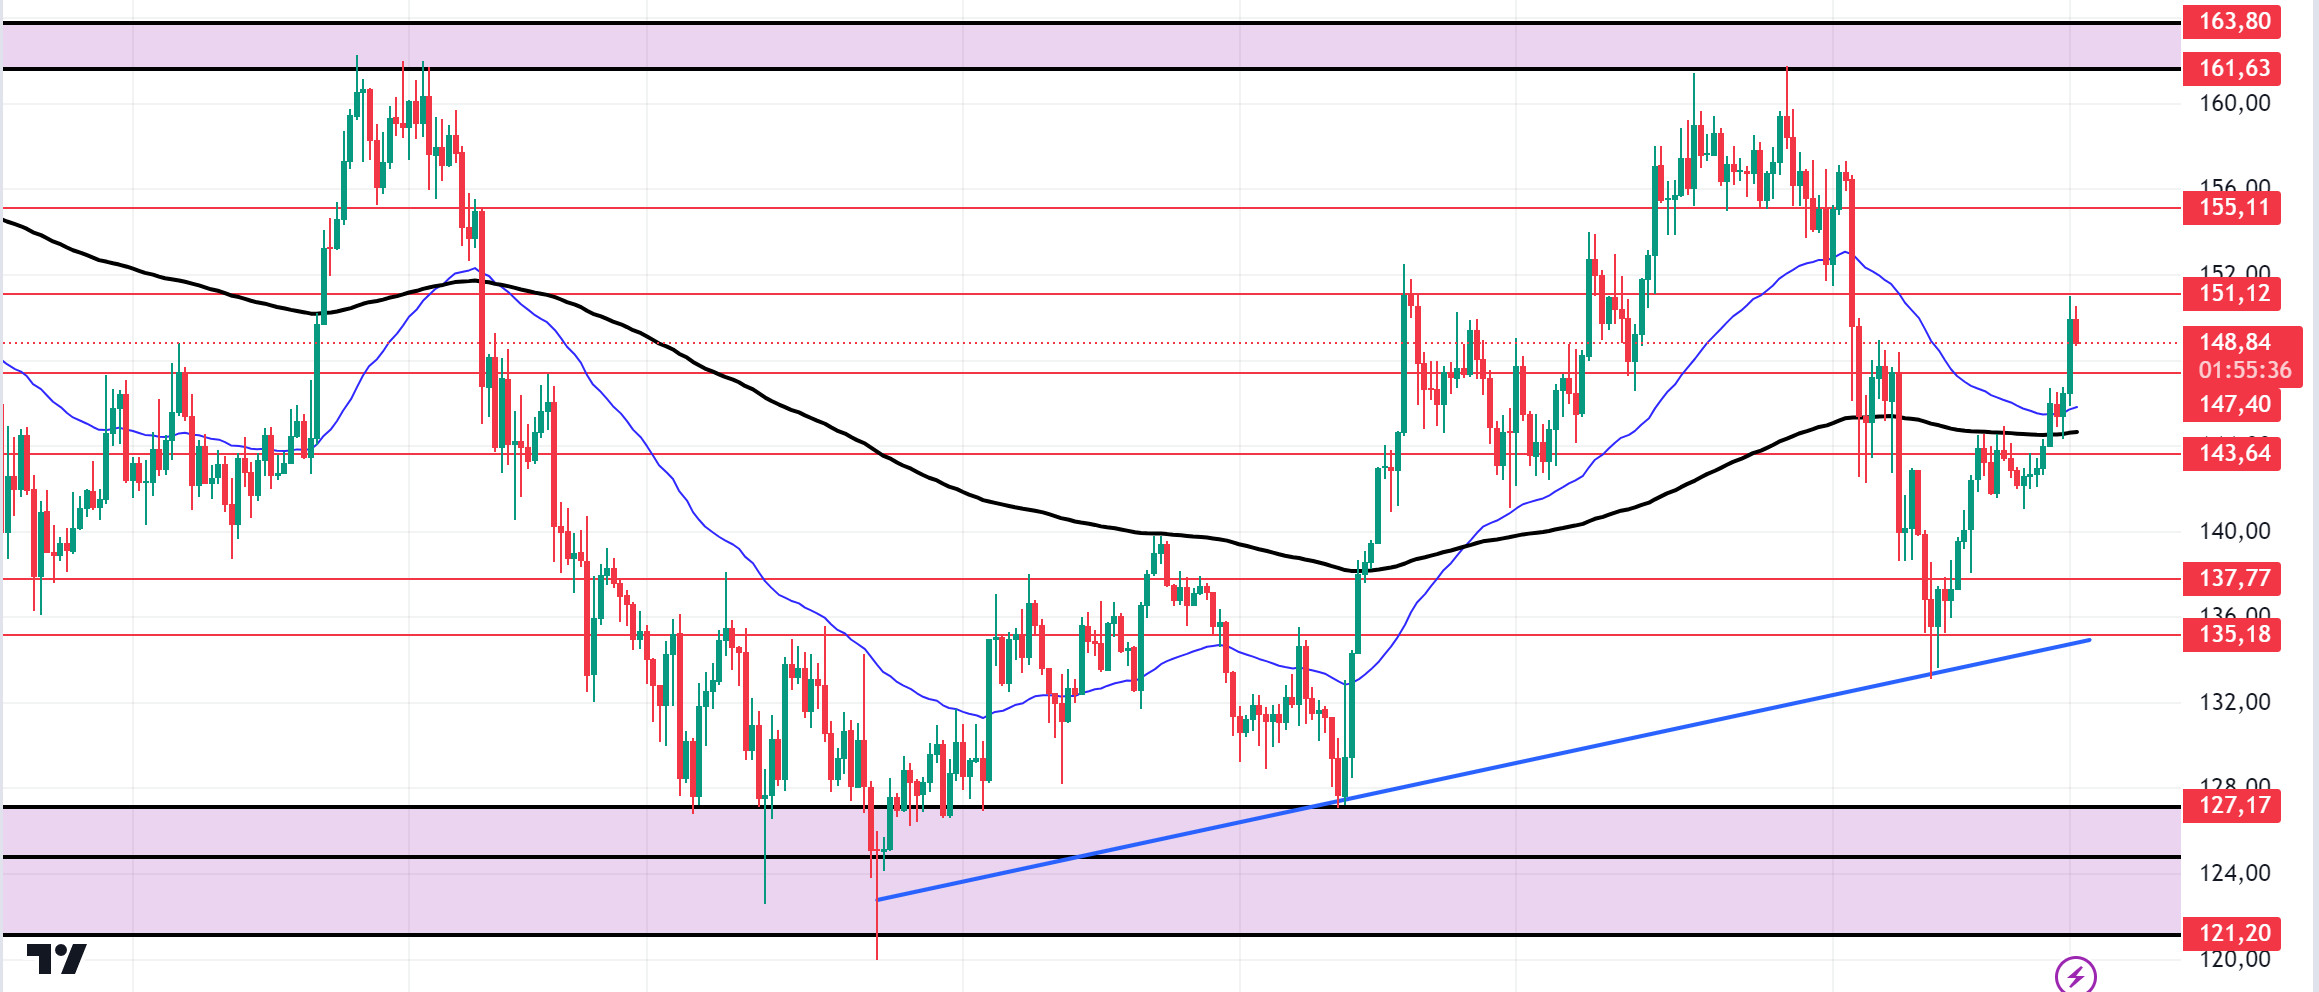
Tensions in the Middle East have eased slightly. As the US elections are approaching, data from Polymarket shows Trump with a 3% lead. In the Solana ecosystem, the volume in the last 24 hours has exceeded $ 1.6 billion. Technically, the price continues to accumulate in the 127.17 161.63 band since August 8. SOL seems to have recovered according to the previous hours. 151.12 resistance level tested here by working. On the 4-hour chart, the 50 EMA seems to have received support from the 200 EMA. Both macroeconomic conditions and the 151.12 level appear as a place of resistance in the rises driven by innovations in the Solana ecosystem. If it rises above this level, the rise may continue. In the sales that investors will make due to political and macroeconomic conditions, the support levels of 147.40 – 143.64 should be followed. If the price comes to these support levels, a potential bullish opportunity may arise.
Supports 147.40 – 143.64 – 137.77
Resistances 151.12 – 155.11 – 161.63
ADA/USDT
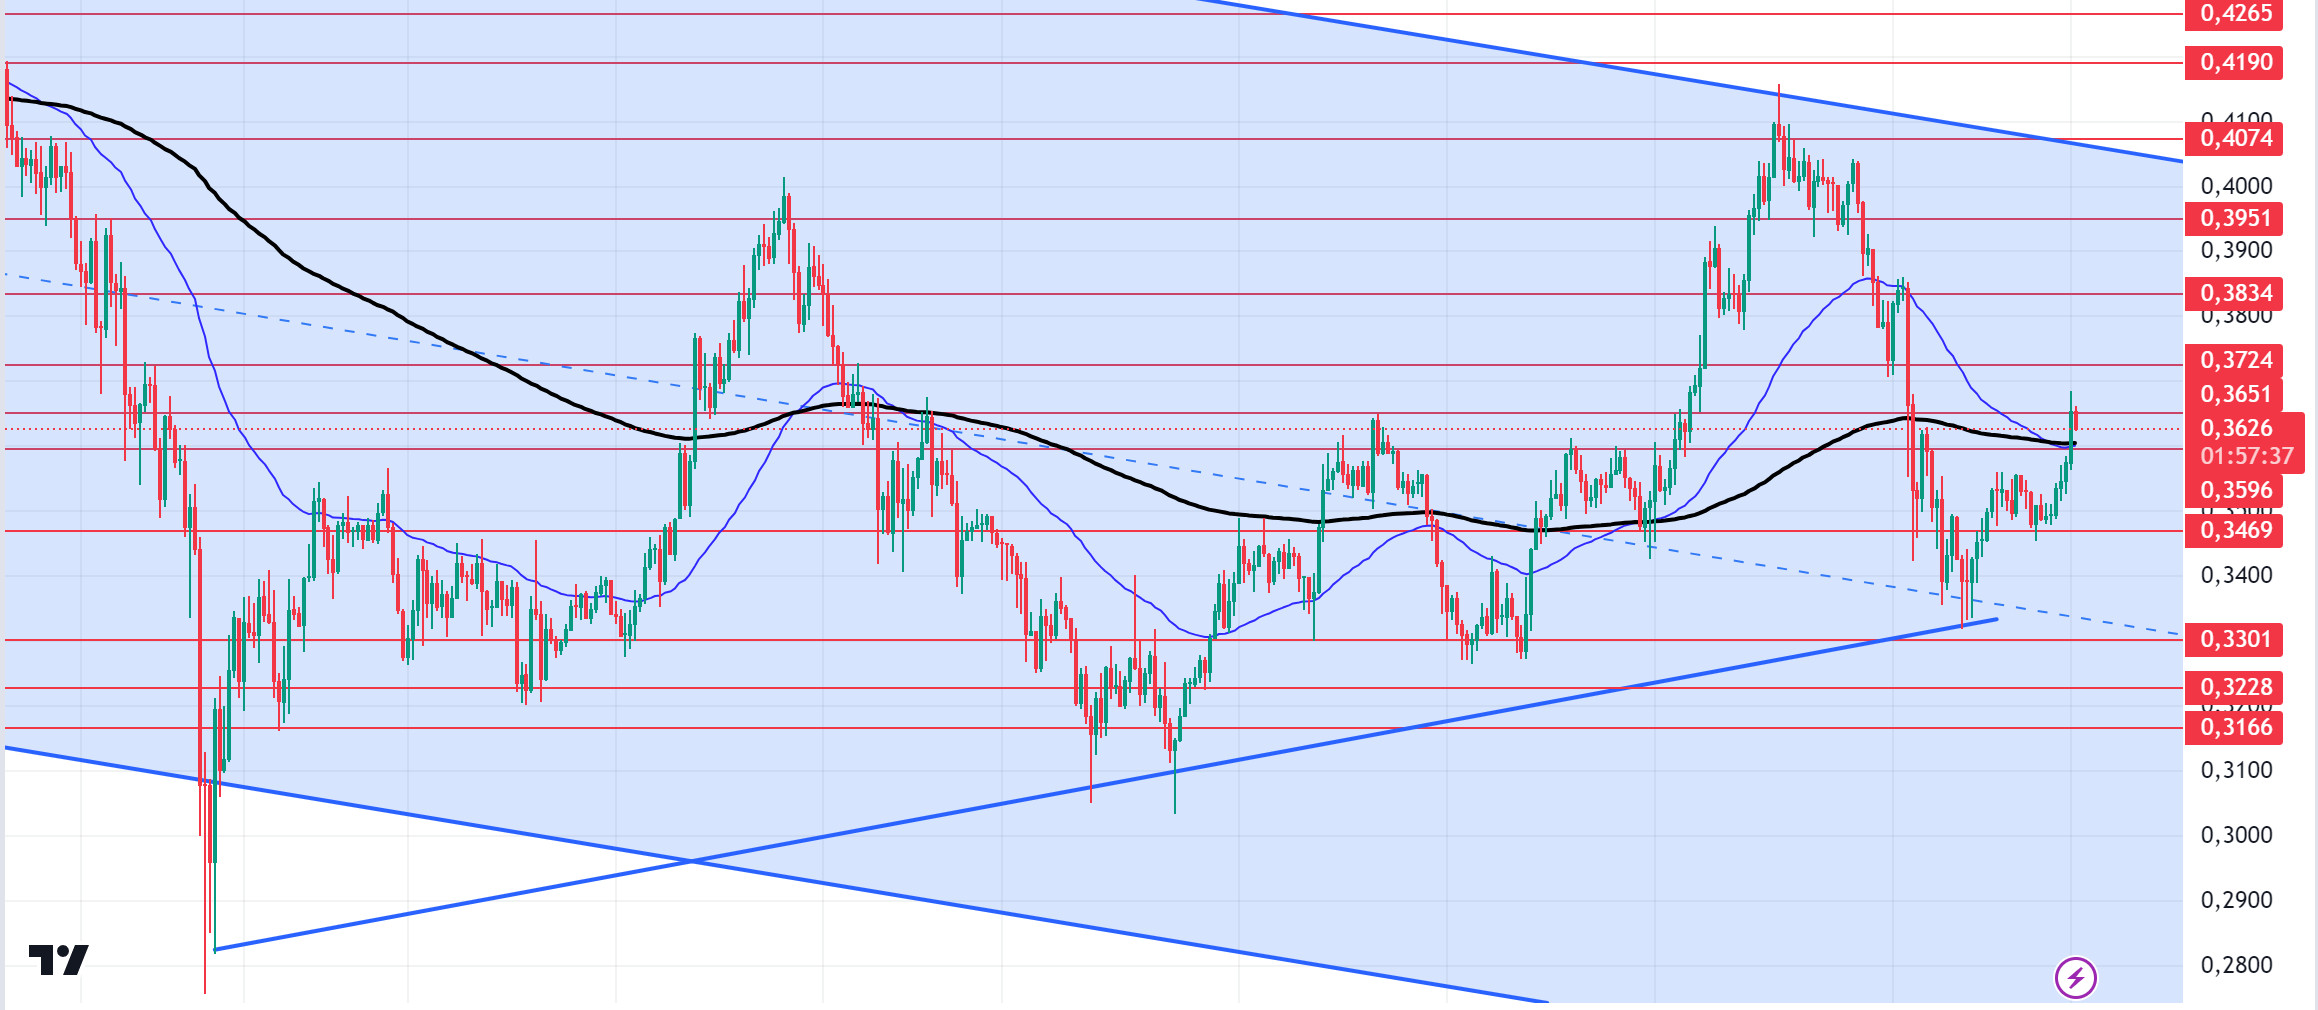
Tensions in the Middle East have eased slightly. As the US elections approach, data from Polymarket shows Trump with a 3% lead. In the Cardano ecosystem, the increase in whale activity indicates an increase in confidence and will likely continue to raise the price of ADA. Technically, the 50 EMA is supported by the 200 EMA. This could be a bullish sign. The 0.3596 level stands out as a strong support in the retracements that will be experienced with possible political and macroeconomic news. If the positive atmosphere in the ecosystem continues, 0.3651 – 0.3724 levels appear as a strong resistance.
Supports 0.3596 – 0.3469 – 0.3301
Resistances 0.3651 – 0.3724 – 0.3834
AVAX/USDT
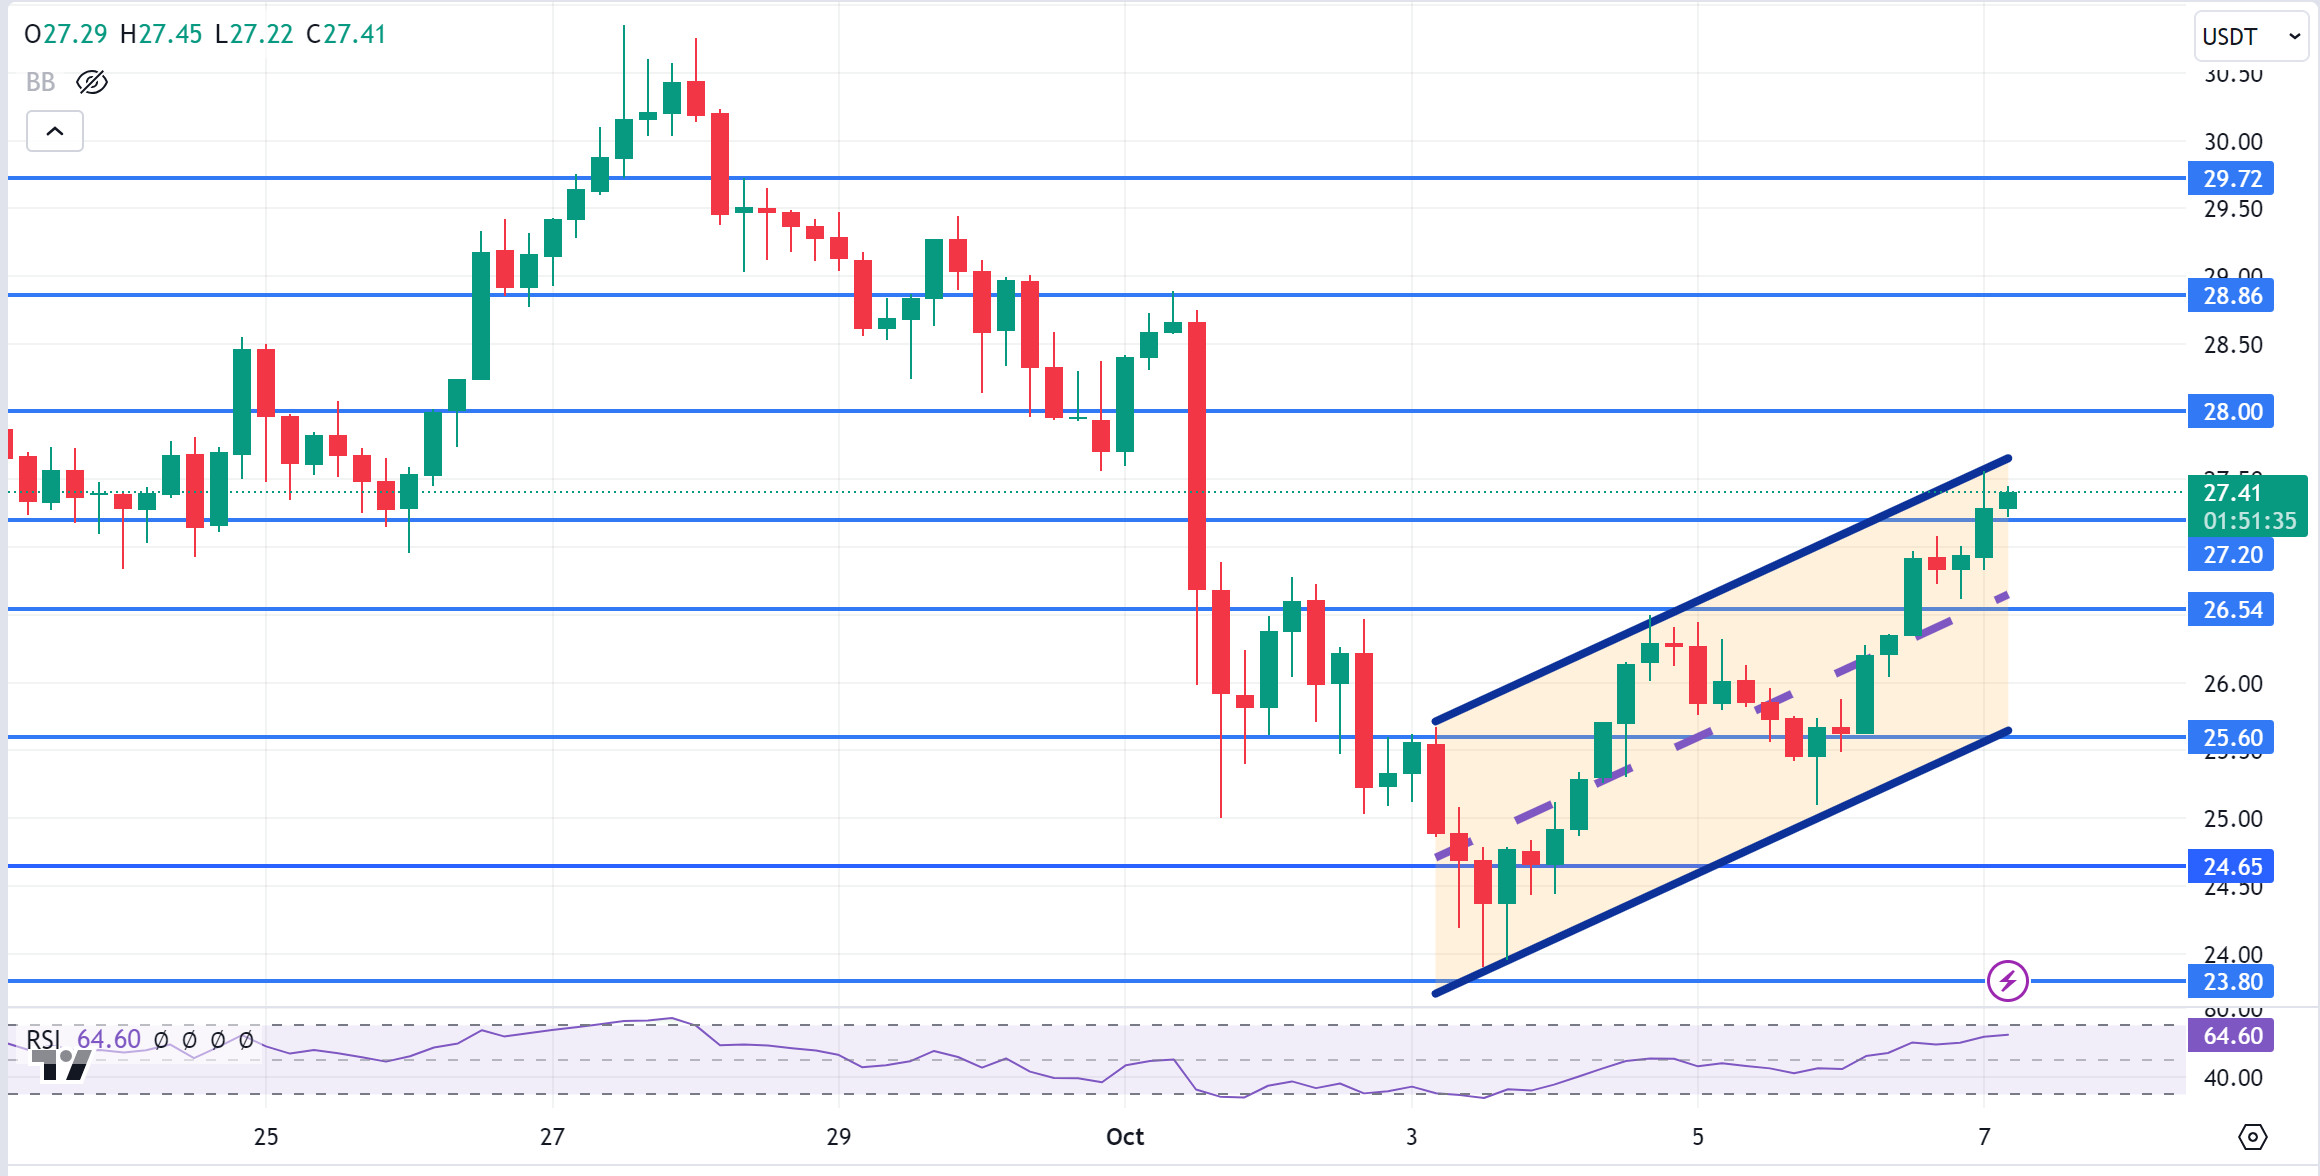
AVAX, which opened yesterday at 25.67, rose by about 5% during the day and closed the day at 26.94. There is no planned data coming from the US today. Therefore, it may be a day when price movement will be limited. News flows from the Middle East will be important for the market.
AVAX, currently trading at 27.41, is moving within the ascending channel on the 4-hour chart. It is in the upper band of the ascending channel and is very close to the overbought zone with RSI 64. Some decline can be expected from these levels. In such a case, it may move to the middle band of the channel and test the 26.54 support. In case of news that the tension in the Middle East is over, purchases may increase and test the 28.00 resistance. As long as it stays above 24.65 support during the day, the desire to rise may continue. With the break of 24.65 support, sales may increase.
Supports 27.20 – 26.54 – 25.60
Resistances 28.00 – 28.86 – 29.72
TRX/USDT
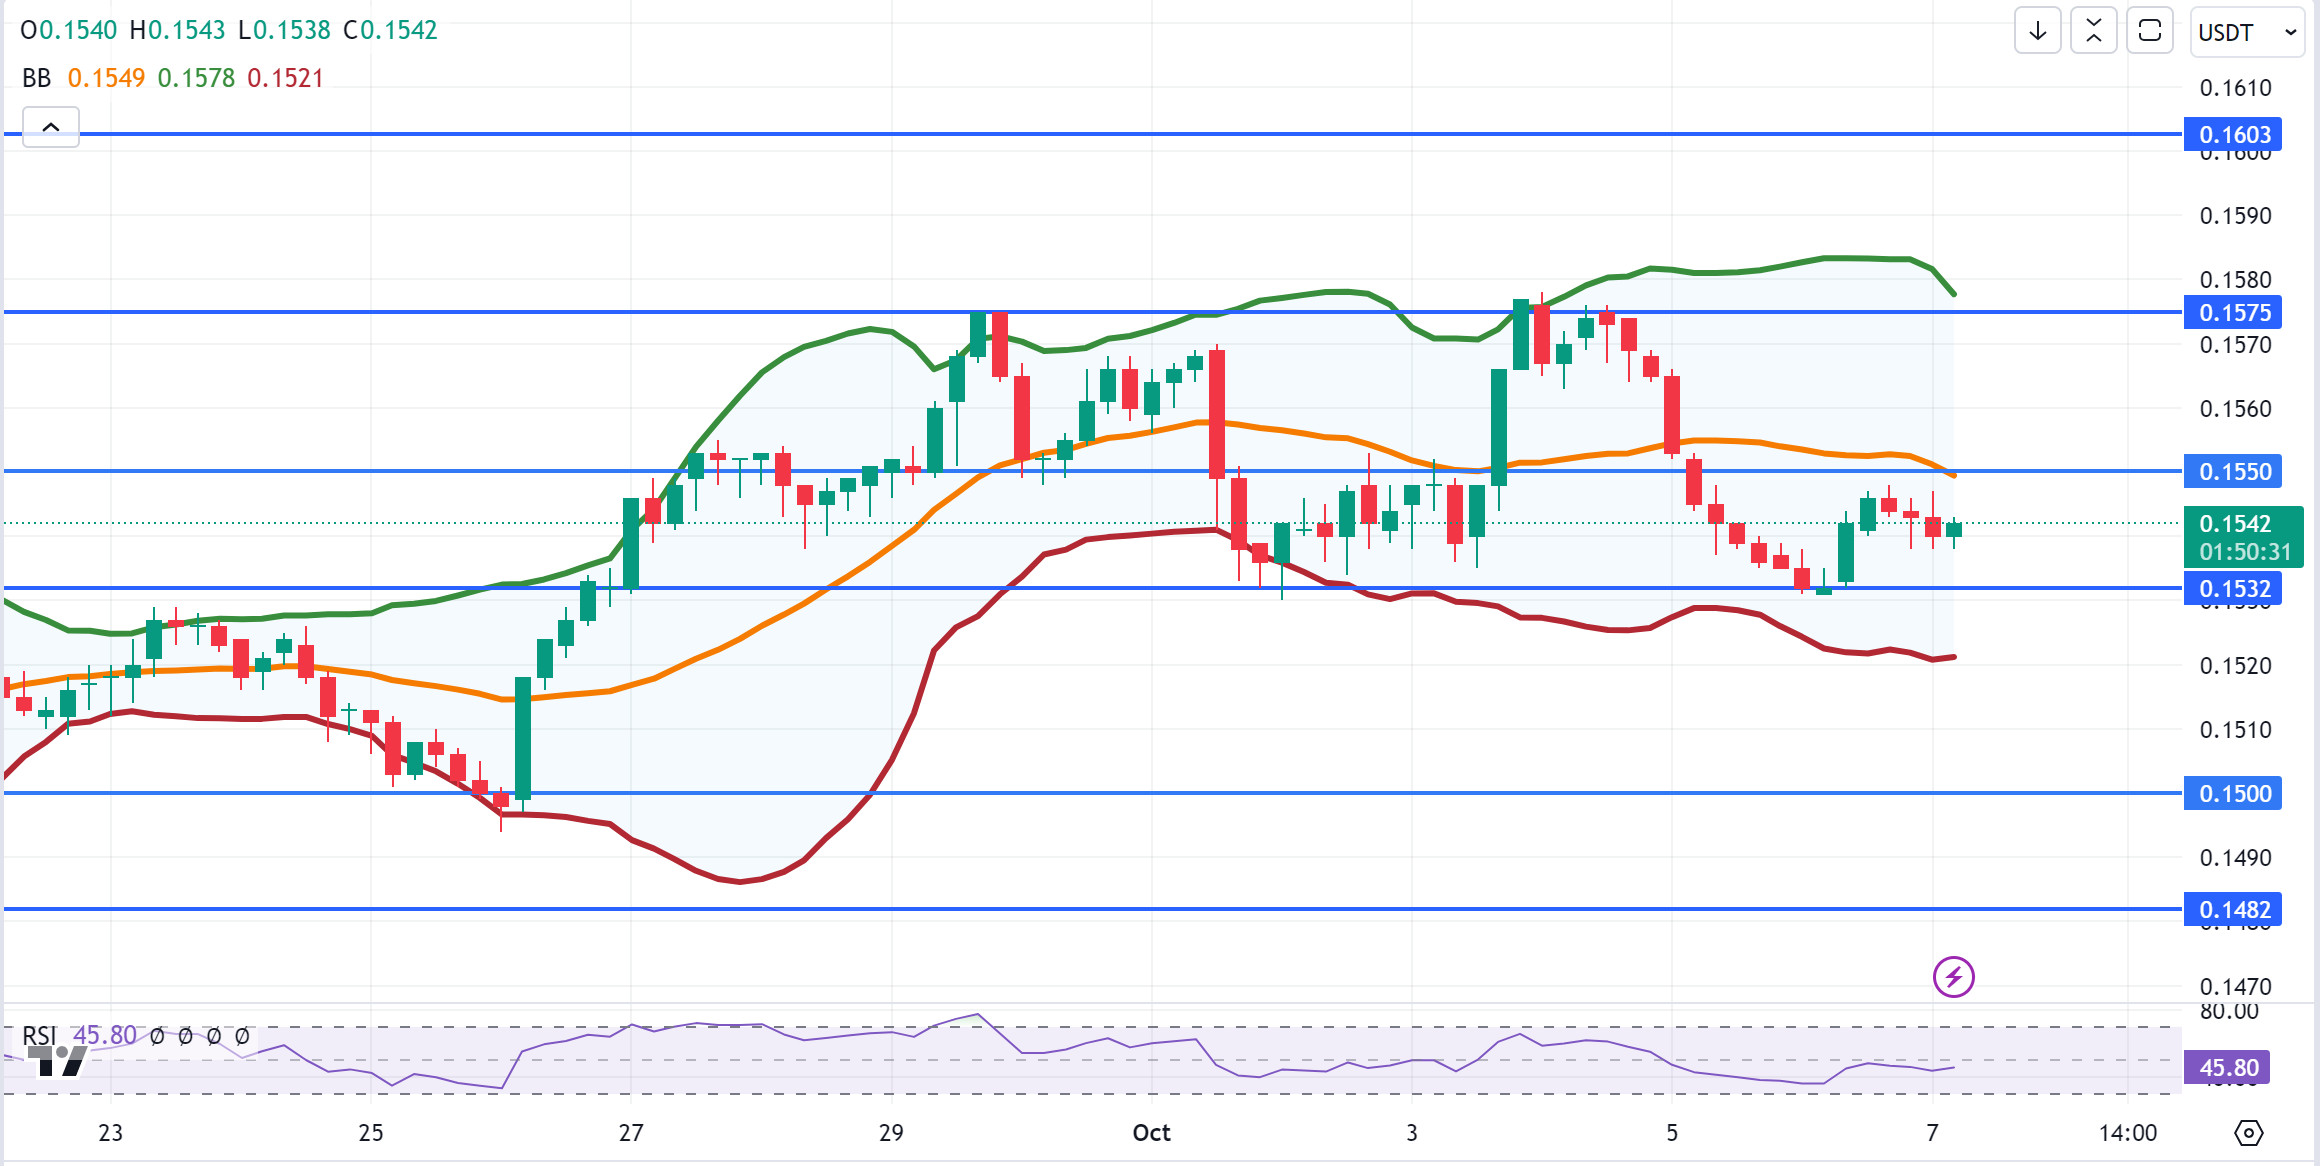
TRX, which started yesterday at 0.1535, rose 0.5% during the day and closed the day at 0.1543. There is no scheduled data expected to affect the market today. The market will be closely following the news flows regarding the tension in the Middle East. TRX, which is currently trading at 0.1542, is moving upwards towards the Bollinger middle band on the 4-hour chart and can be expected to rise a little more from its level with the RSI 45 value. In such a case, it may move to the Bollinger middle band and test the 0.1550 resistance. If the tension in the Middle East increases, it may test 0.1532 support with selling pressure. As long as TRX stays above 0.1482 support, the desire to rise may continue. If this support is broken downwards, sales can be expected to increase.
Supports 0.1532 – 0.1500 – 0.1482
Resistances 0.1550 – 0.1575 – 0.1603
XRP/USDT
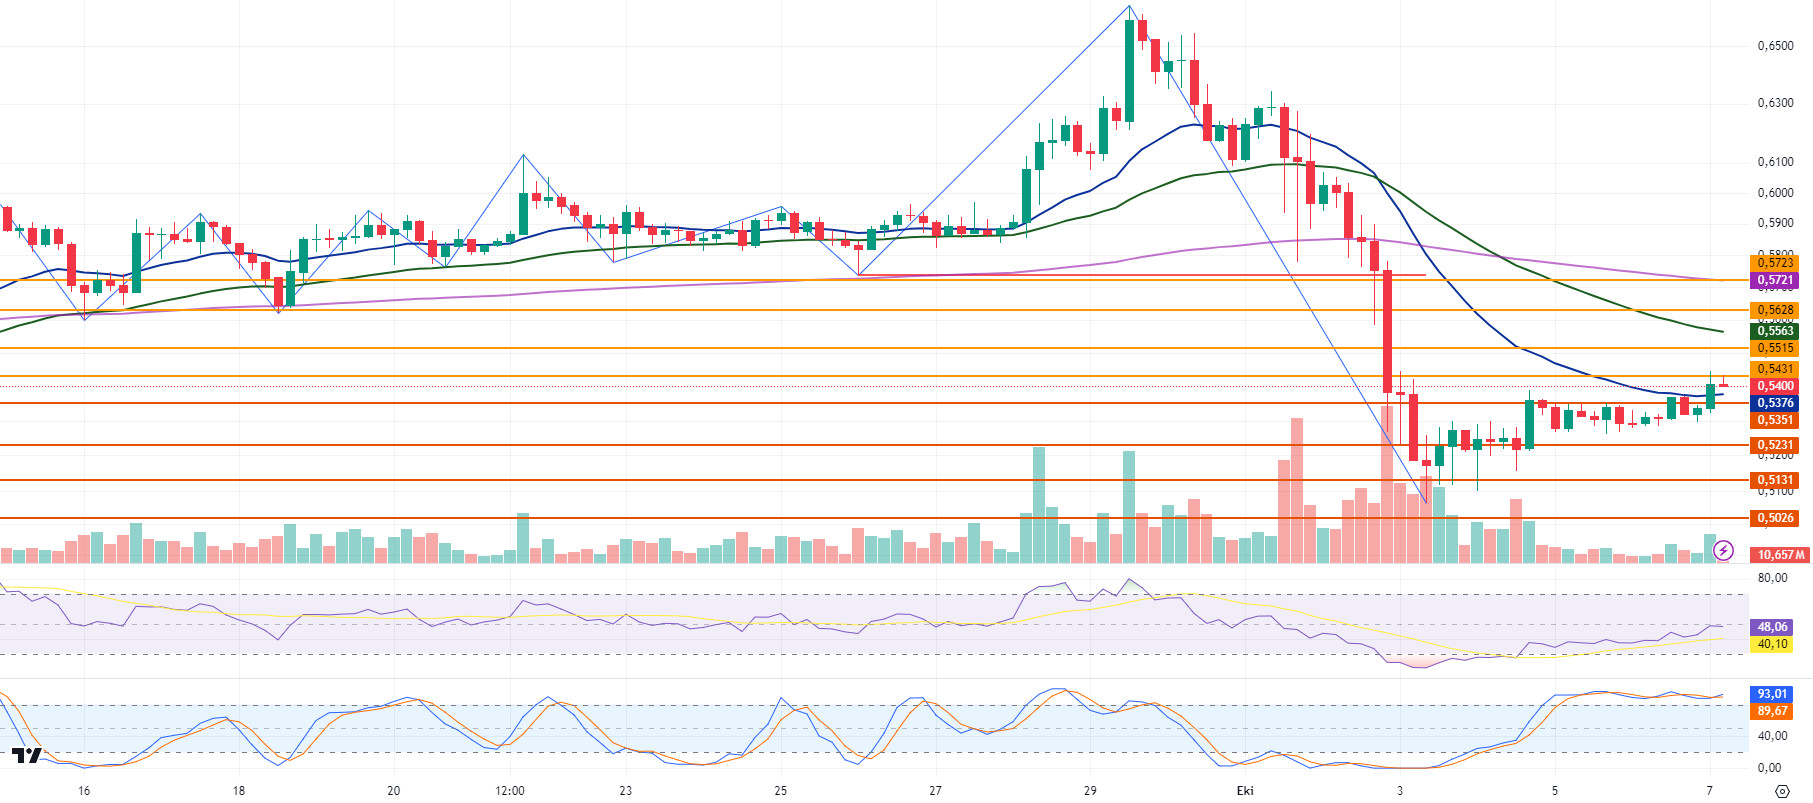
XRP, which was traded in a horizontal band over the weekend, closed yesterday at 0.5334. XRP, which started today with a rise in the 4-hour analysis, rose to 0.5444 on the opening candle and then declined with the sales. It is currently trading at 0.5400. In the 4-hour analysis, XRP, which fell with the sales at the EMA20 level in its rise yesterday, tested the 0.5431 resistance level after breaking the EMA20 level with its rise in the opening candle today. XRP, which declined by failing to break the resistance level after testing the resistance level in question, may test the 0.5431 resistance level again with its rise and if it breaks it may test the 0.5515-0.5628 resistance levels in the continuation of the rise. In case the rise gives way to a decline, XRP, with its decline, may test the support levels of 0.5231-0.5131 in the continuation of the decline by testing and breaking the EMA20 and 0.5351 support levels.
XRP may decline with possible sales at the EMA50 level in its rise and may offer a short trading opportunity. In its decline, it may offer a long trading opportunity with possible purchases at the EMA20 and 0.5351 support levels.
EMA20 (Blue Line) – EMA50 (Green Line) – EMA200 (Purple Line)
Supports 0. 5351 – 0.5231 – 0. 5131
Resistances 0.5431 – 0.5515 – 0.5628
DOGE/USDT
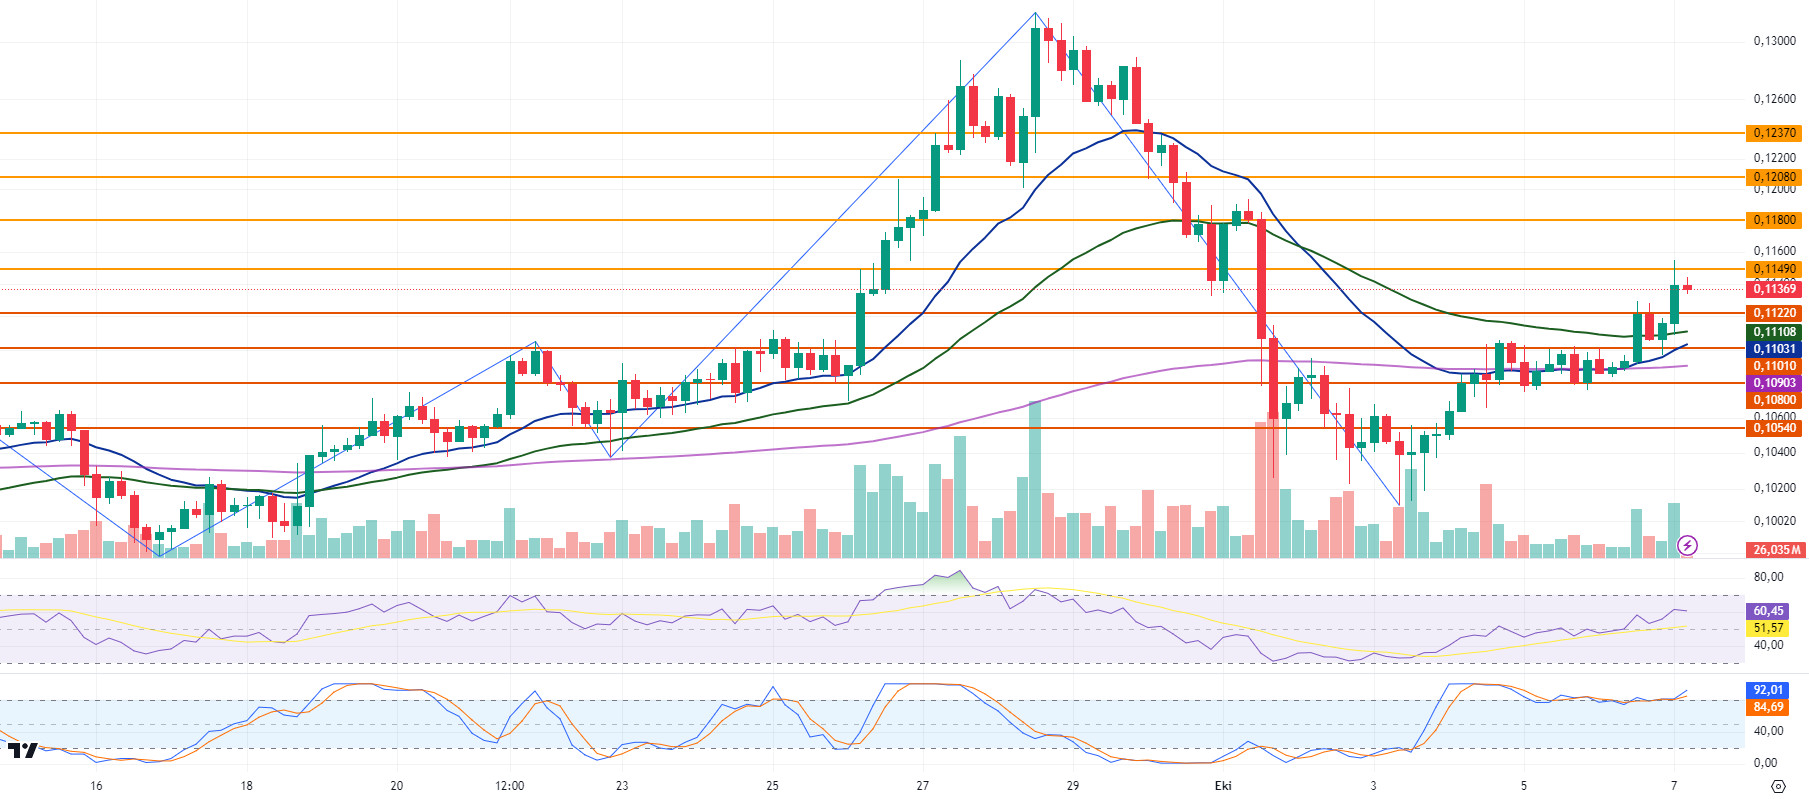
DOGE tested the 0.1122 level in its uptrend yesterday and declined after failing to break it. Yesterday, the daily close was realized at 0.1115. In the 4-hour analysis, DOGE, which started to rise with the purchases coming at the EMA50 level in its decline in the opening candle today, continued its rise by breaking the 0.1122 level. DOGE, which tested the resistance level of 0.1149 in its rise, fell with sales at this level and is currently trading at 0.1137.
DOGE, which declined with the tension in the Middle East, traded in a horizontal band between 0.1080 and 0.1100 levels, while rising yesterday and today. The rise seen across the crypto market is expected to continue and DOGE may test the resistance levels of 0.1149-0.1180-0.1208 with its rise. In case the rise is replaced by a decline with possible negative developments, DOGE may test 0.1122-0.1101-0.1080 support levels with its decline.
DOGE may decline on its rise with possible sales at 0.12 and may offer a short trading opportunity. In its decline, it may rise with possible purchases at EMA20 and 0.11 and may offer a long trading opportunity.
EMA20 (Blue Line) – EMA50 (Green Line) – EMA200 (Purple Line)
Supports 0.1122 – 0.1101 – 0.1080
Resistances 0.1149 – 0.1180 – 0.1208
DOT/USDT
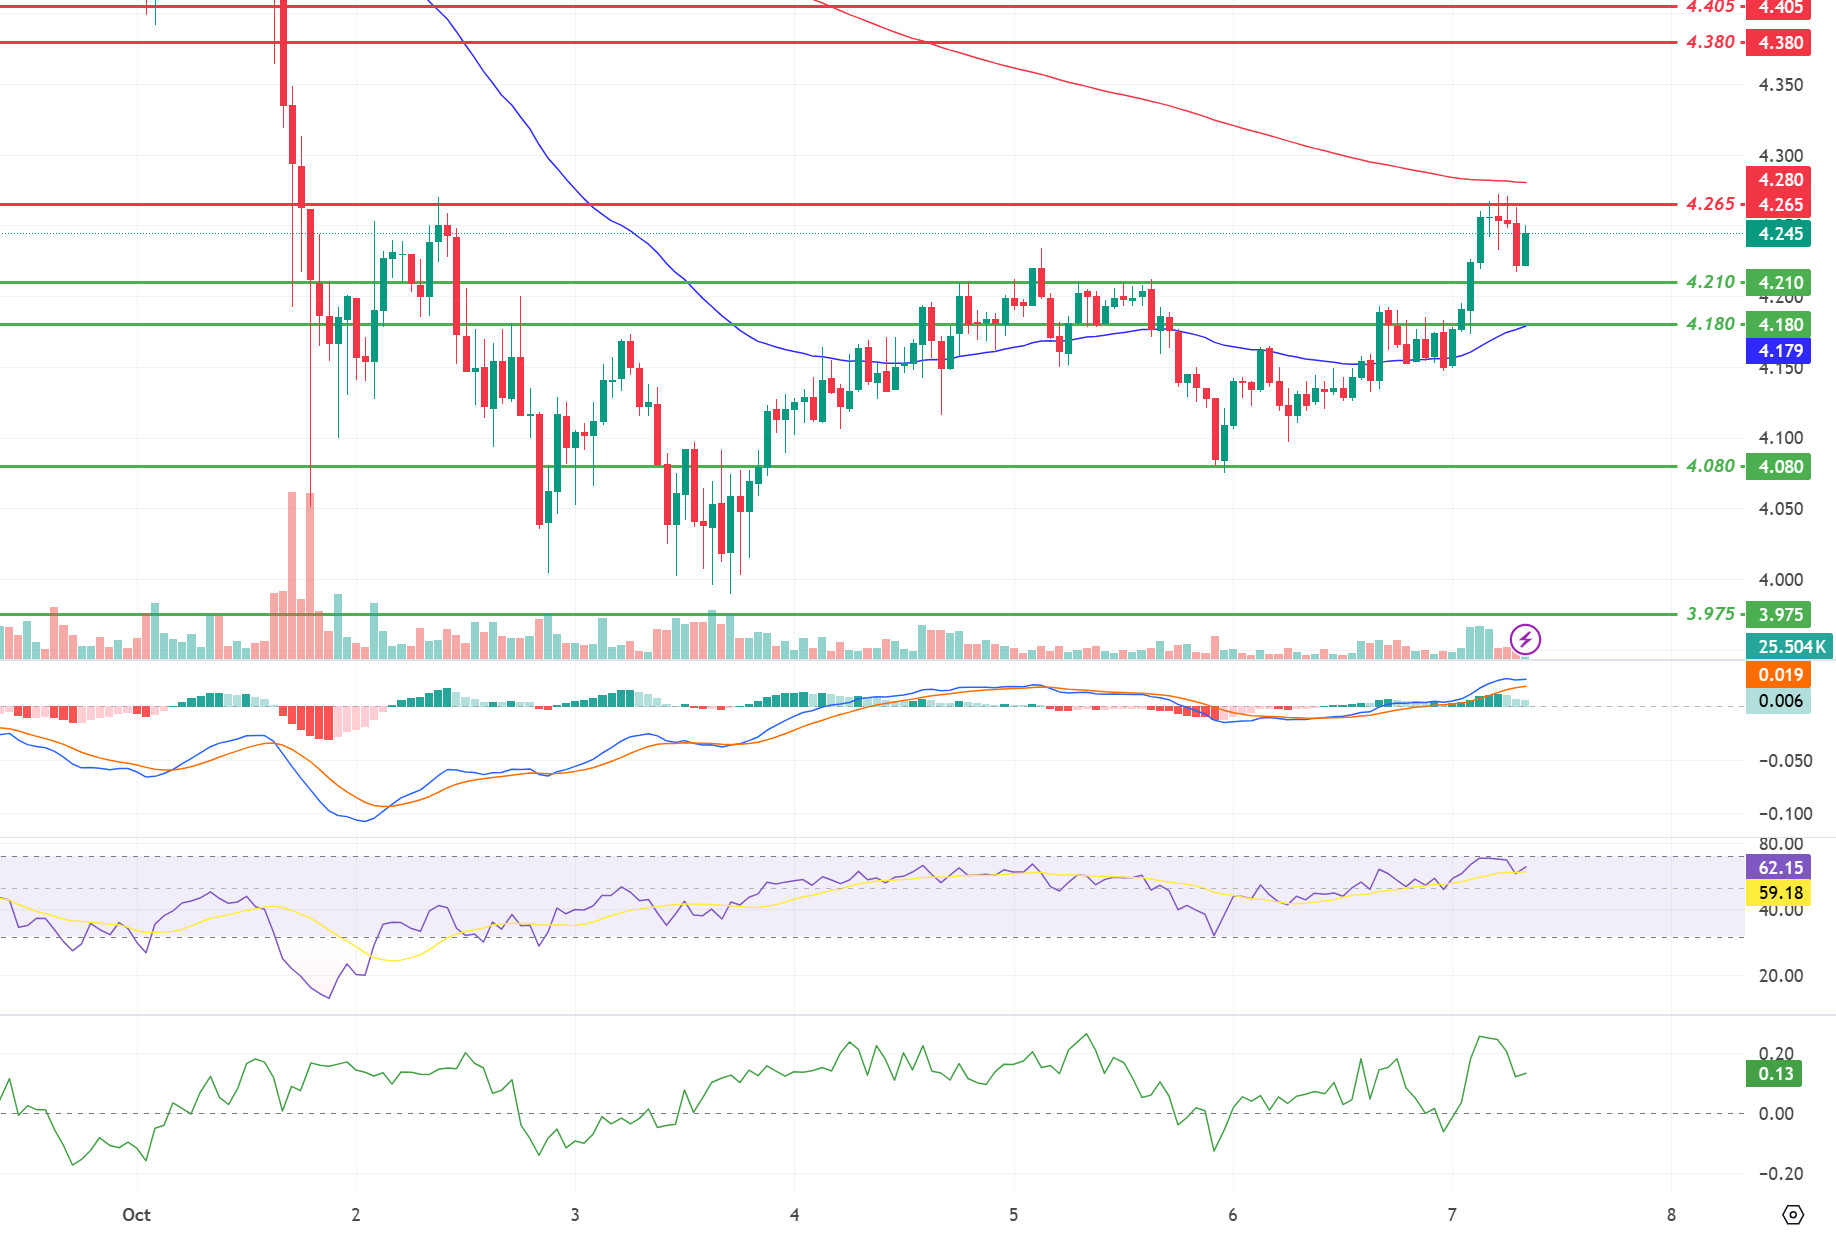
When we examine the Polkadot (DOT) chart, we see that the price is rejected from the 4.265 resistance level. According to the CMF oscillator, we can say that the buyer pressure is strong. If the EMA50 level breaks the EMA200 upwards, the price may move towards 4,380 levels. On the other hand, according to the MACD oscillator, the buyer pressure seems to have decreased compared to the previous hour. If the price wants to make a correction, the first support level seems to be 4,210 levels.
(Blue line: EMA50, Red line: EMA200)
Supports 4.210 – 4.180 – 4.080
Resistances 4.265 – 4.380 – 4.405
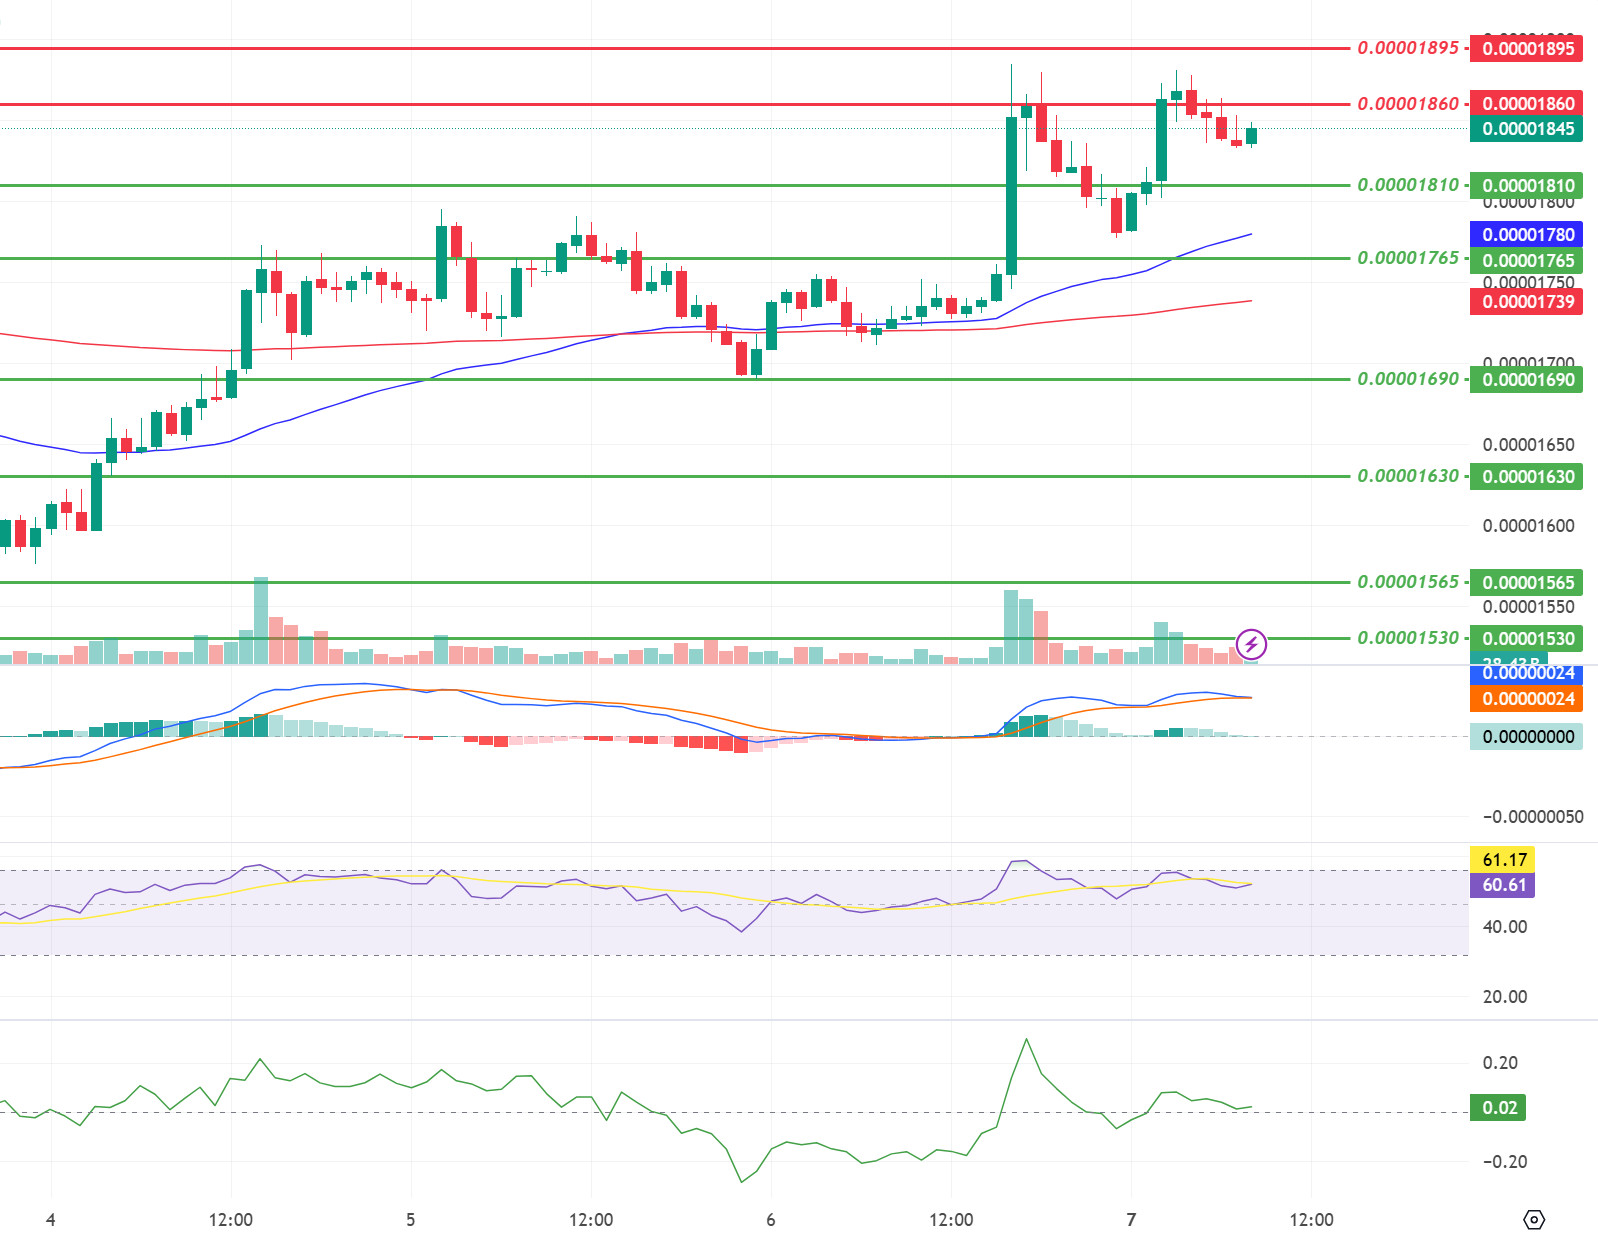
SHIB/USDT
When we examine the chart of Shiba Inu (SHIB), the price seems to be rejected from the 0.00001860 resistance level. According to MACD and CMF oscillators, we can say that the buyer pressure is decreasing. In the negative scenario, the price may retreat to 0.00001810 support levels. On the other hand, if the buyer pressure increases, the price may want to break the selling pressure at 0.00001860.
(Blue line: EMA50, Red line: EMA200)
Supports 0.00001810 – 0.00001765 – 0.00001690
Resistances 0.00001810 – 0.00001895 – 0.00001945
LEGAL NOTICE
The investment information, comments and recommendations contained herein do not constitute investment advice. Investment advisory services are provided individually by authorized institutions taking into account the risk and return preferences of individuals. The comments and recommendations contained herein are of a general nature. These recommendations may not be suitable for your financial situation and risk and return preferences. Therefore, making an investment decision based solely on the information contained herein may not produce results in line with your expectations.
