
Active Addresses
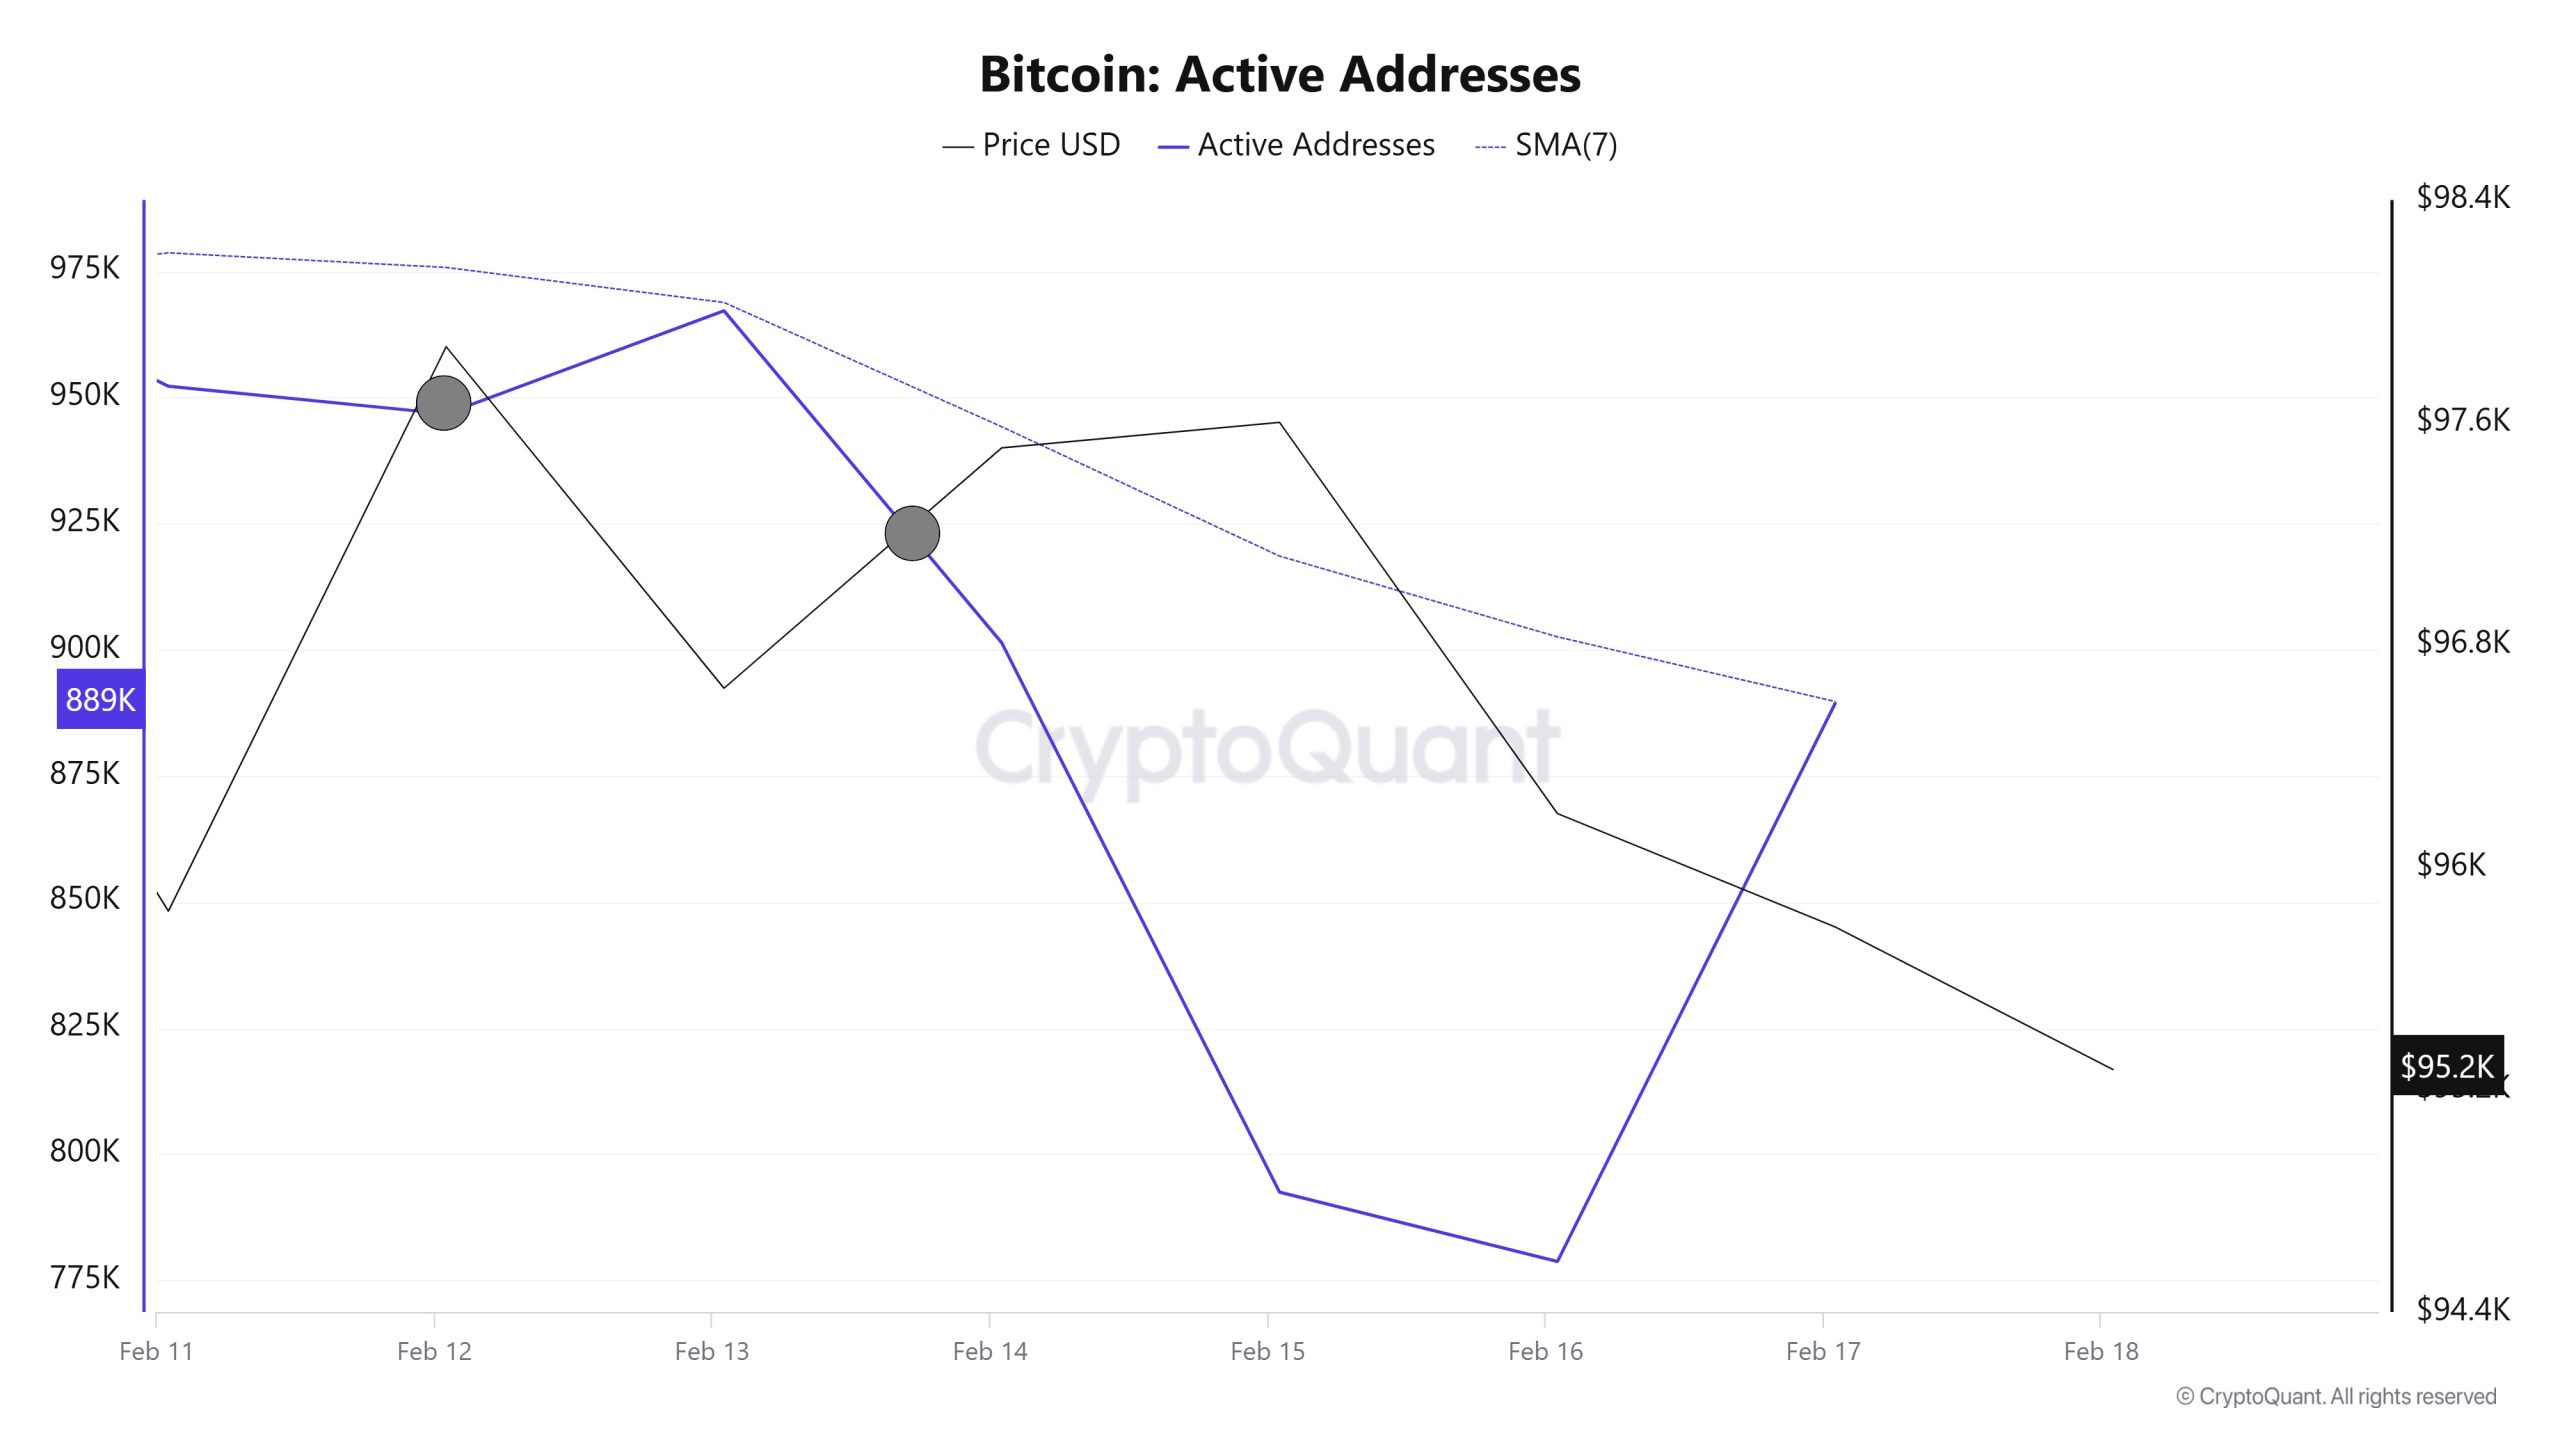
In the number of active addresses, there were 967,171 entries to exchanges between February 12 and February 18, 2025, this week. During this period, Bitcoin rose from 95,100 to 97,600. In the region marked on the chart, we see that Bitcoin purchases accelerated in the region where the price and the number of active addresses intersect. When we follow the 7-day simple moving average, we observe that the price follows a downward trend on the dates when these average cuts the price. This situation indicates that the Bitcoin price experienced entries at $ 97,000 and exits at $ 95,000.
Active Sending Addresses
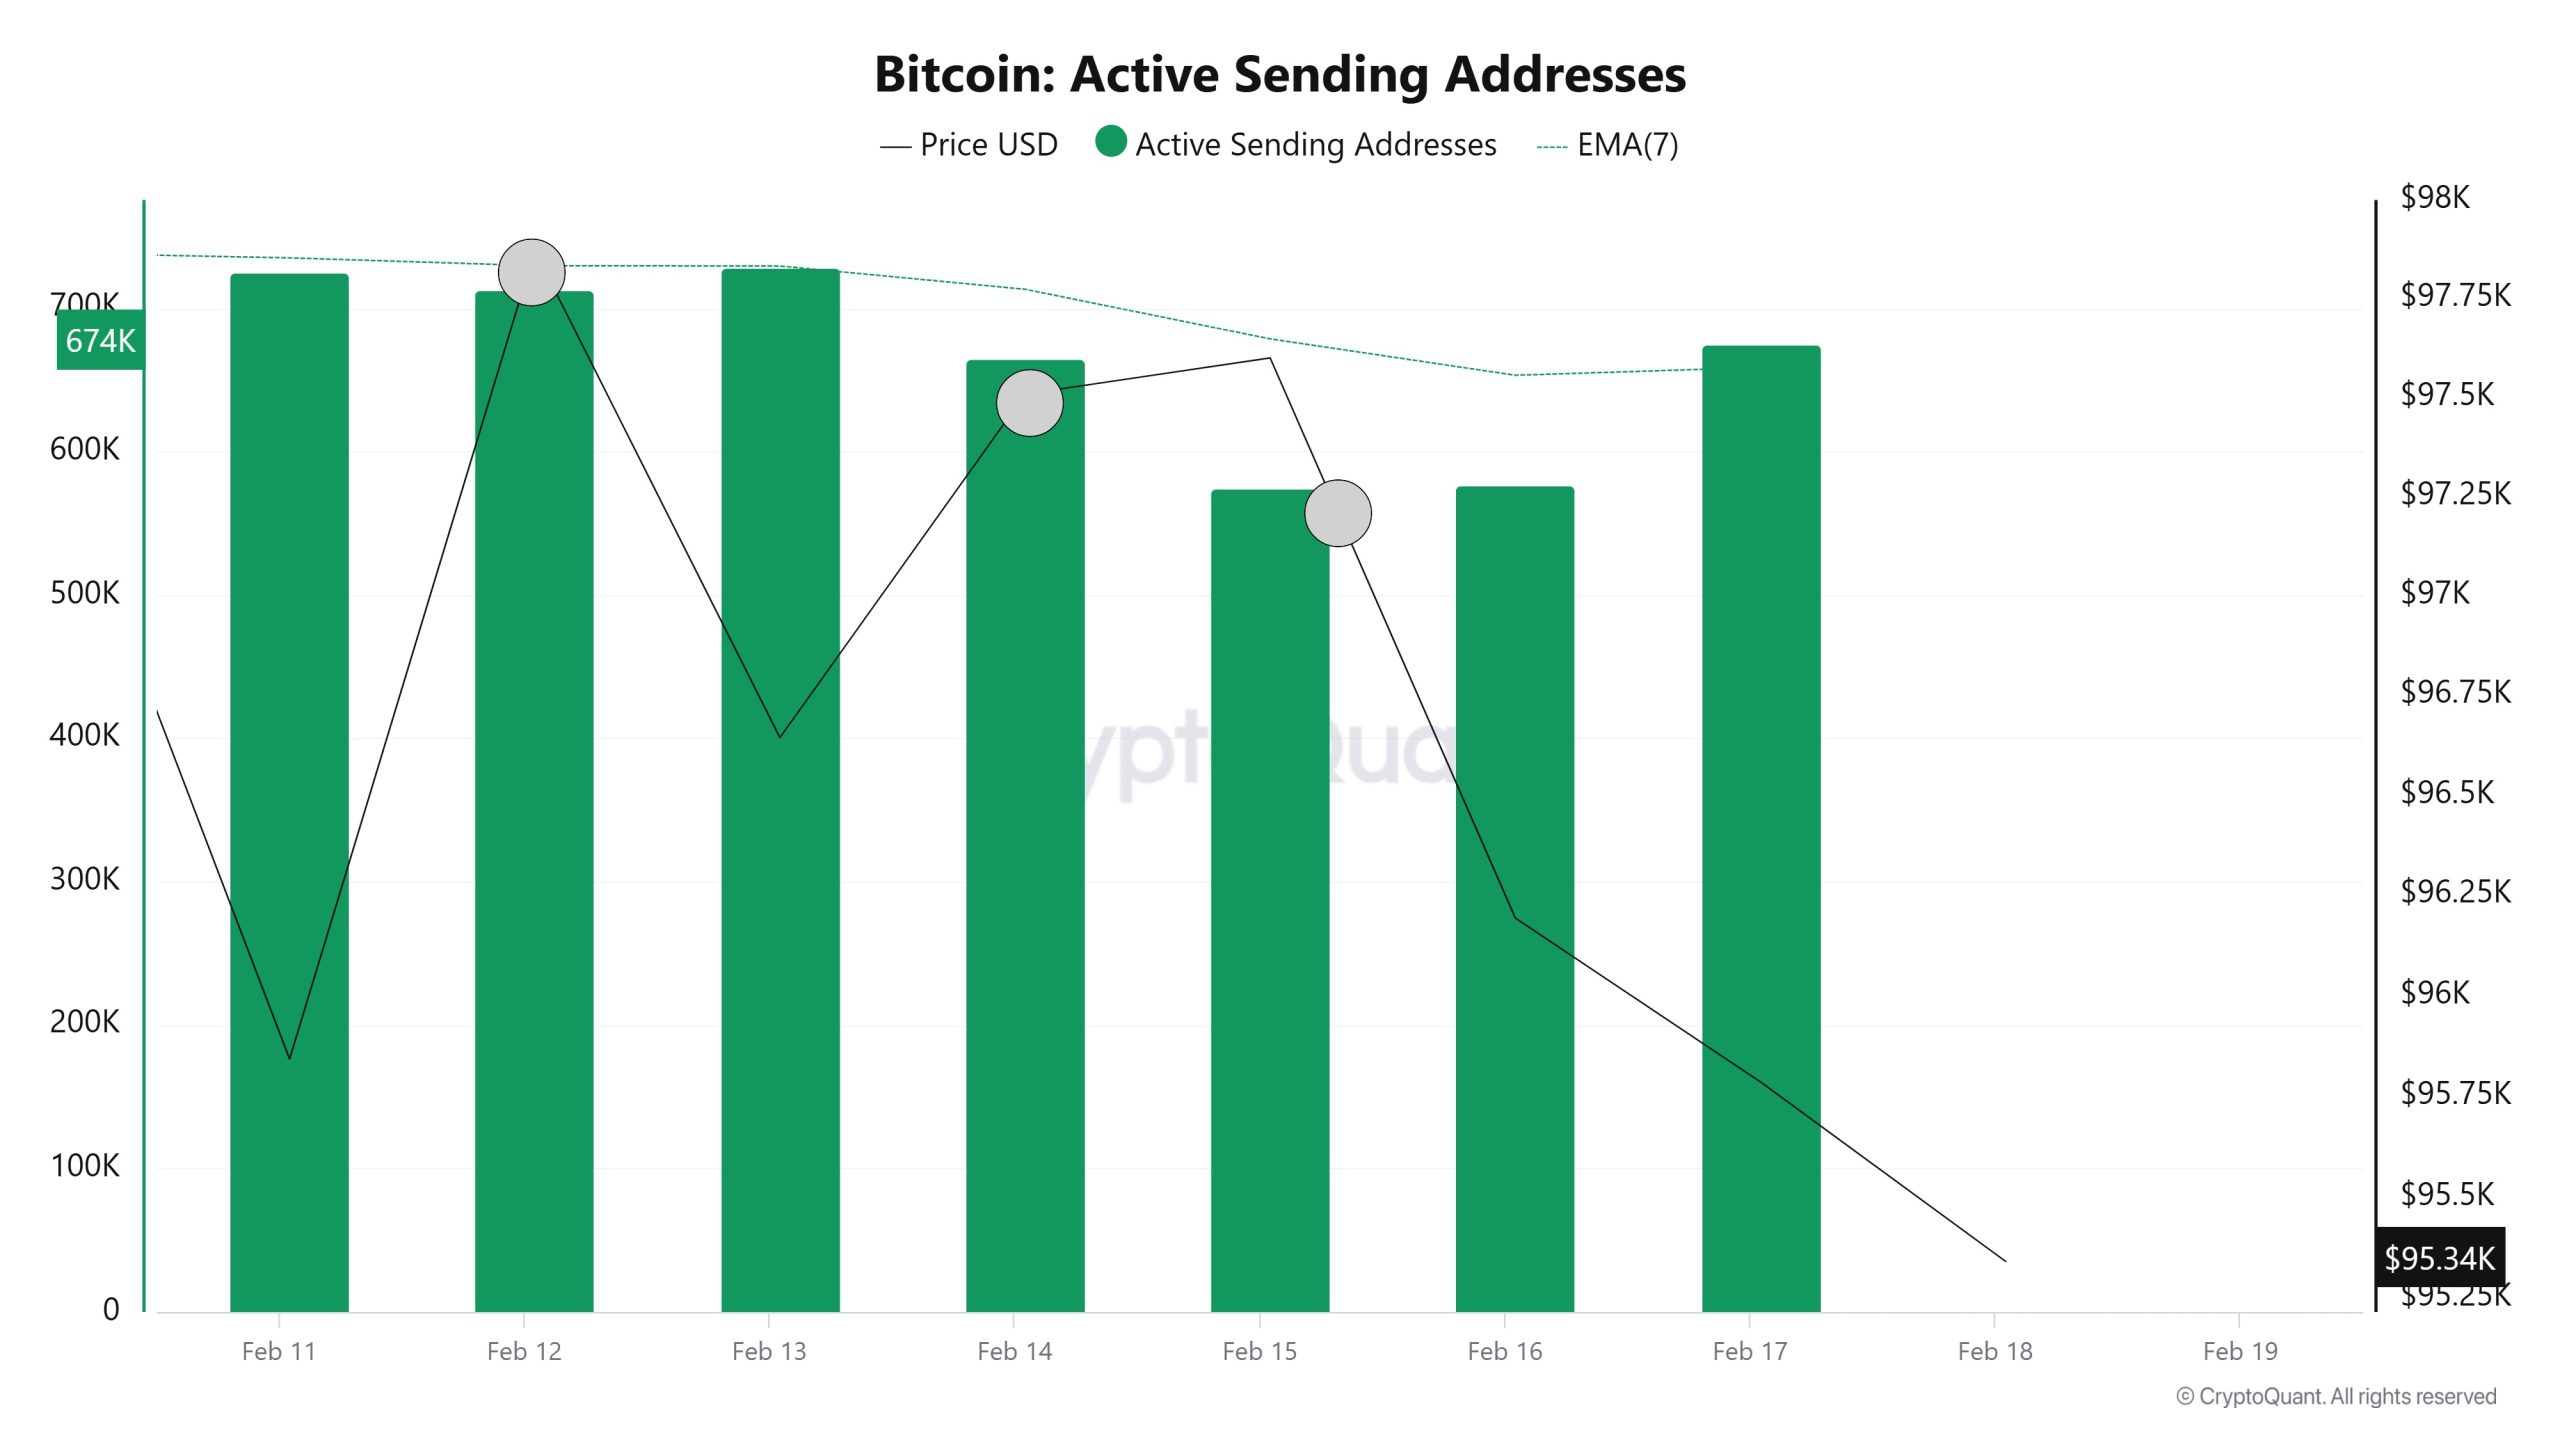
On the outflows, there was a significant increase in active shipping addresses towards February 13, along with the Black Line (price line). On the day of the price peak, active shipping addresses rose as high as 728,591, indicating that buyers sold their positions as Bitcoin remained around the 95,000 level for a while. The average of 738,471 active addresses may indicate that the market is falling, and investors are selling out of fear.
Breakdowns
MRVR
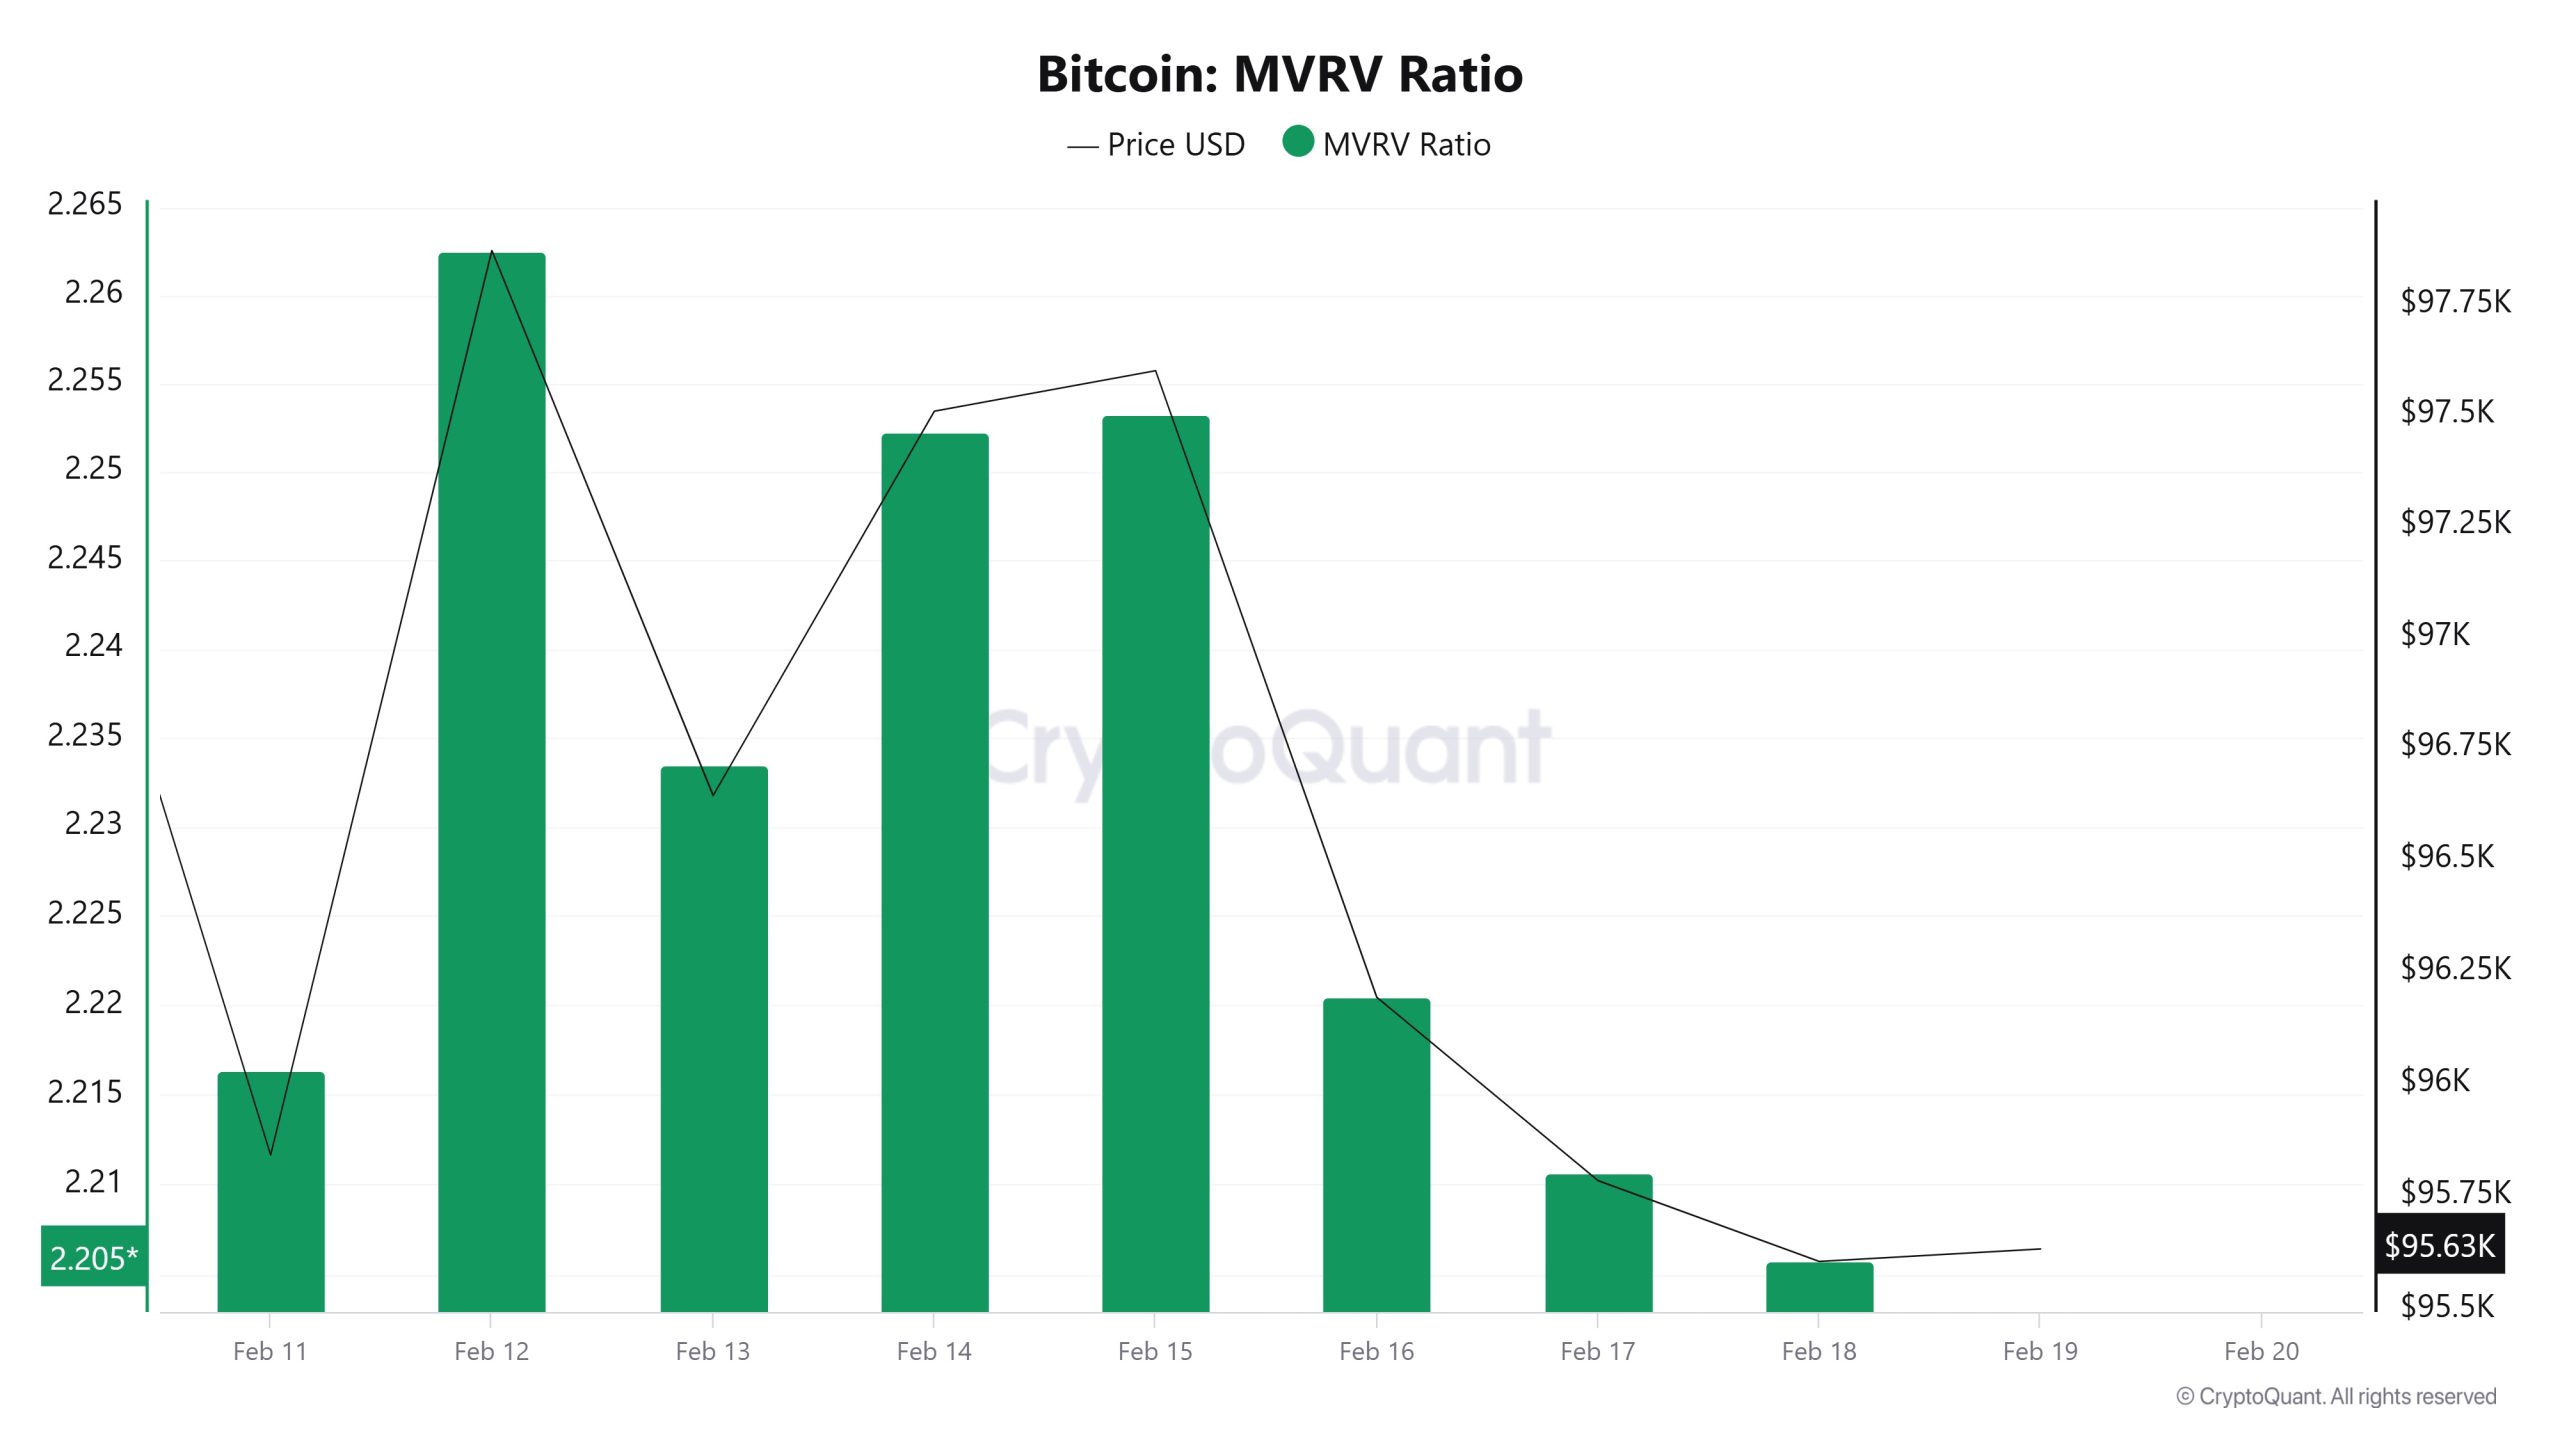
On February 12, the Bitcoin price was 97,872 while the MVRV Ratio was 2.26. As of February 18, the Bitcoin price was down to 95,605 while the MVRV Ratio was 2.20. Compared to last week, Bitcoin price decreased by 2.32% and MVRV Ratio decreased by 2.65%.
Realized Price
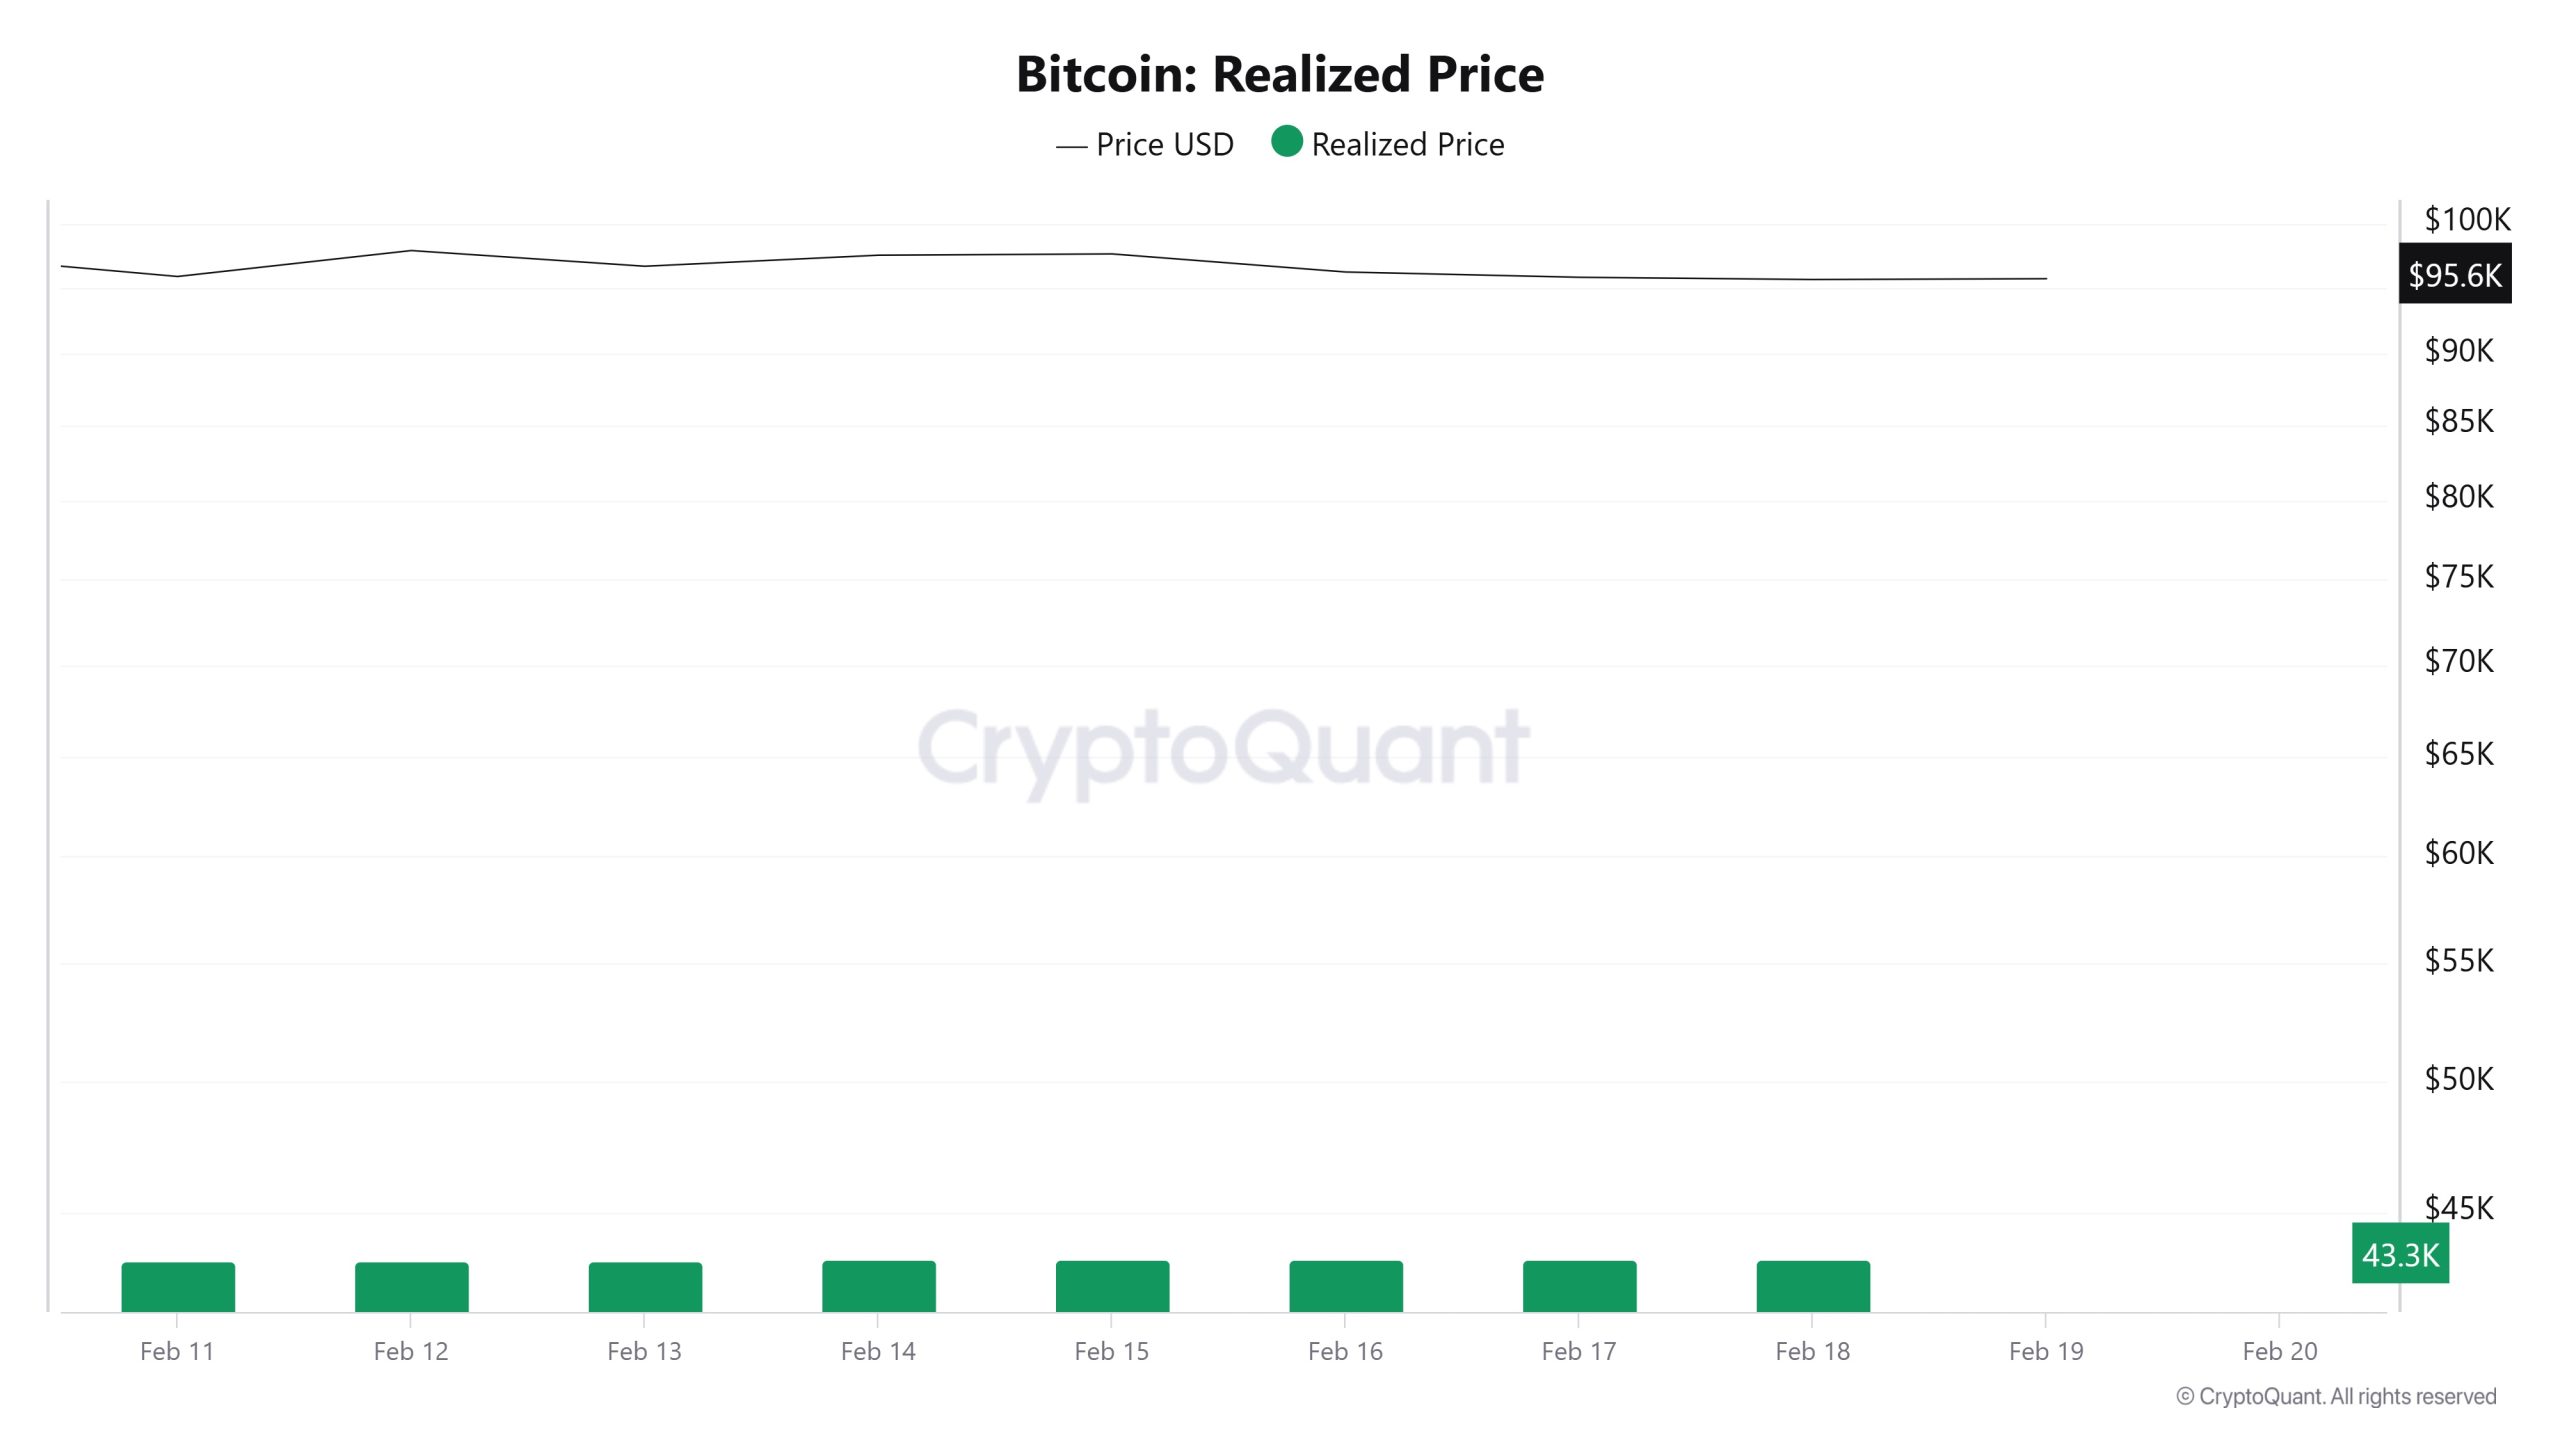
On February 12, the Bitcoin price was 97,872 while the Realized Price was 43,257. As of February 18, Bitcoin price was down to 95,605 while Realized Price was up to 43,344. Compared to last week, Bitcoin price decreased by 2.32% while Realized Price increased by 0.2%.
Spent Output Profit Ratio (SOPR)
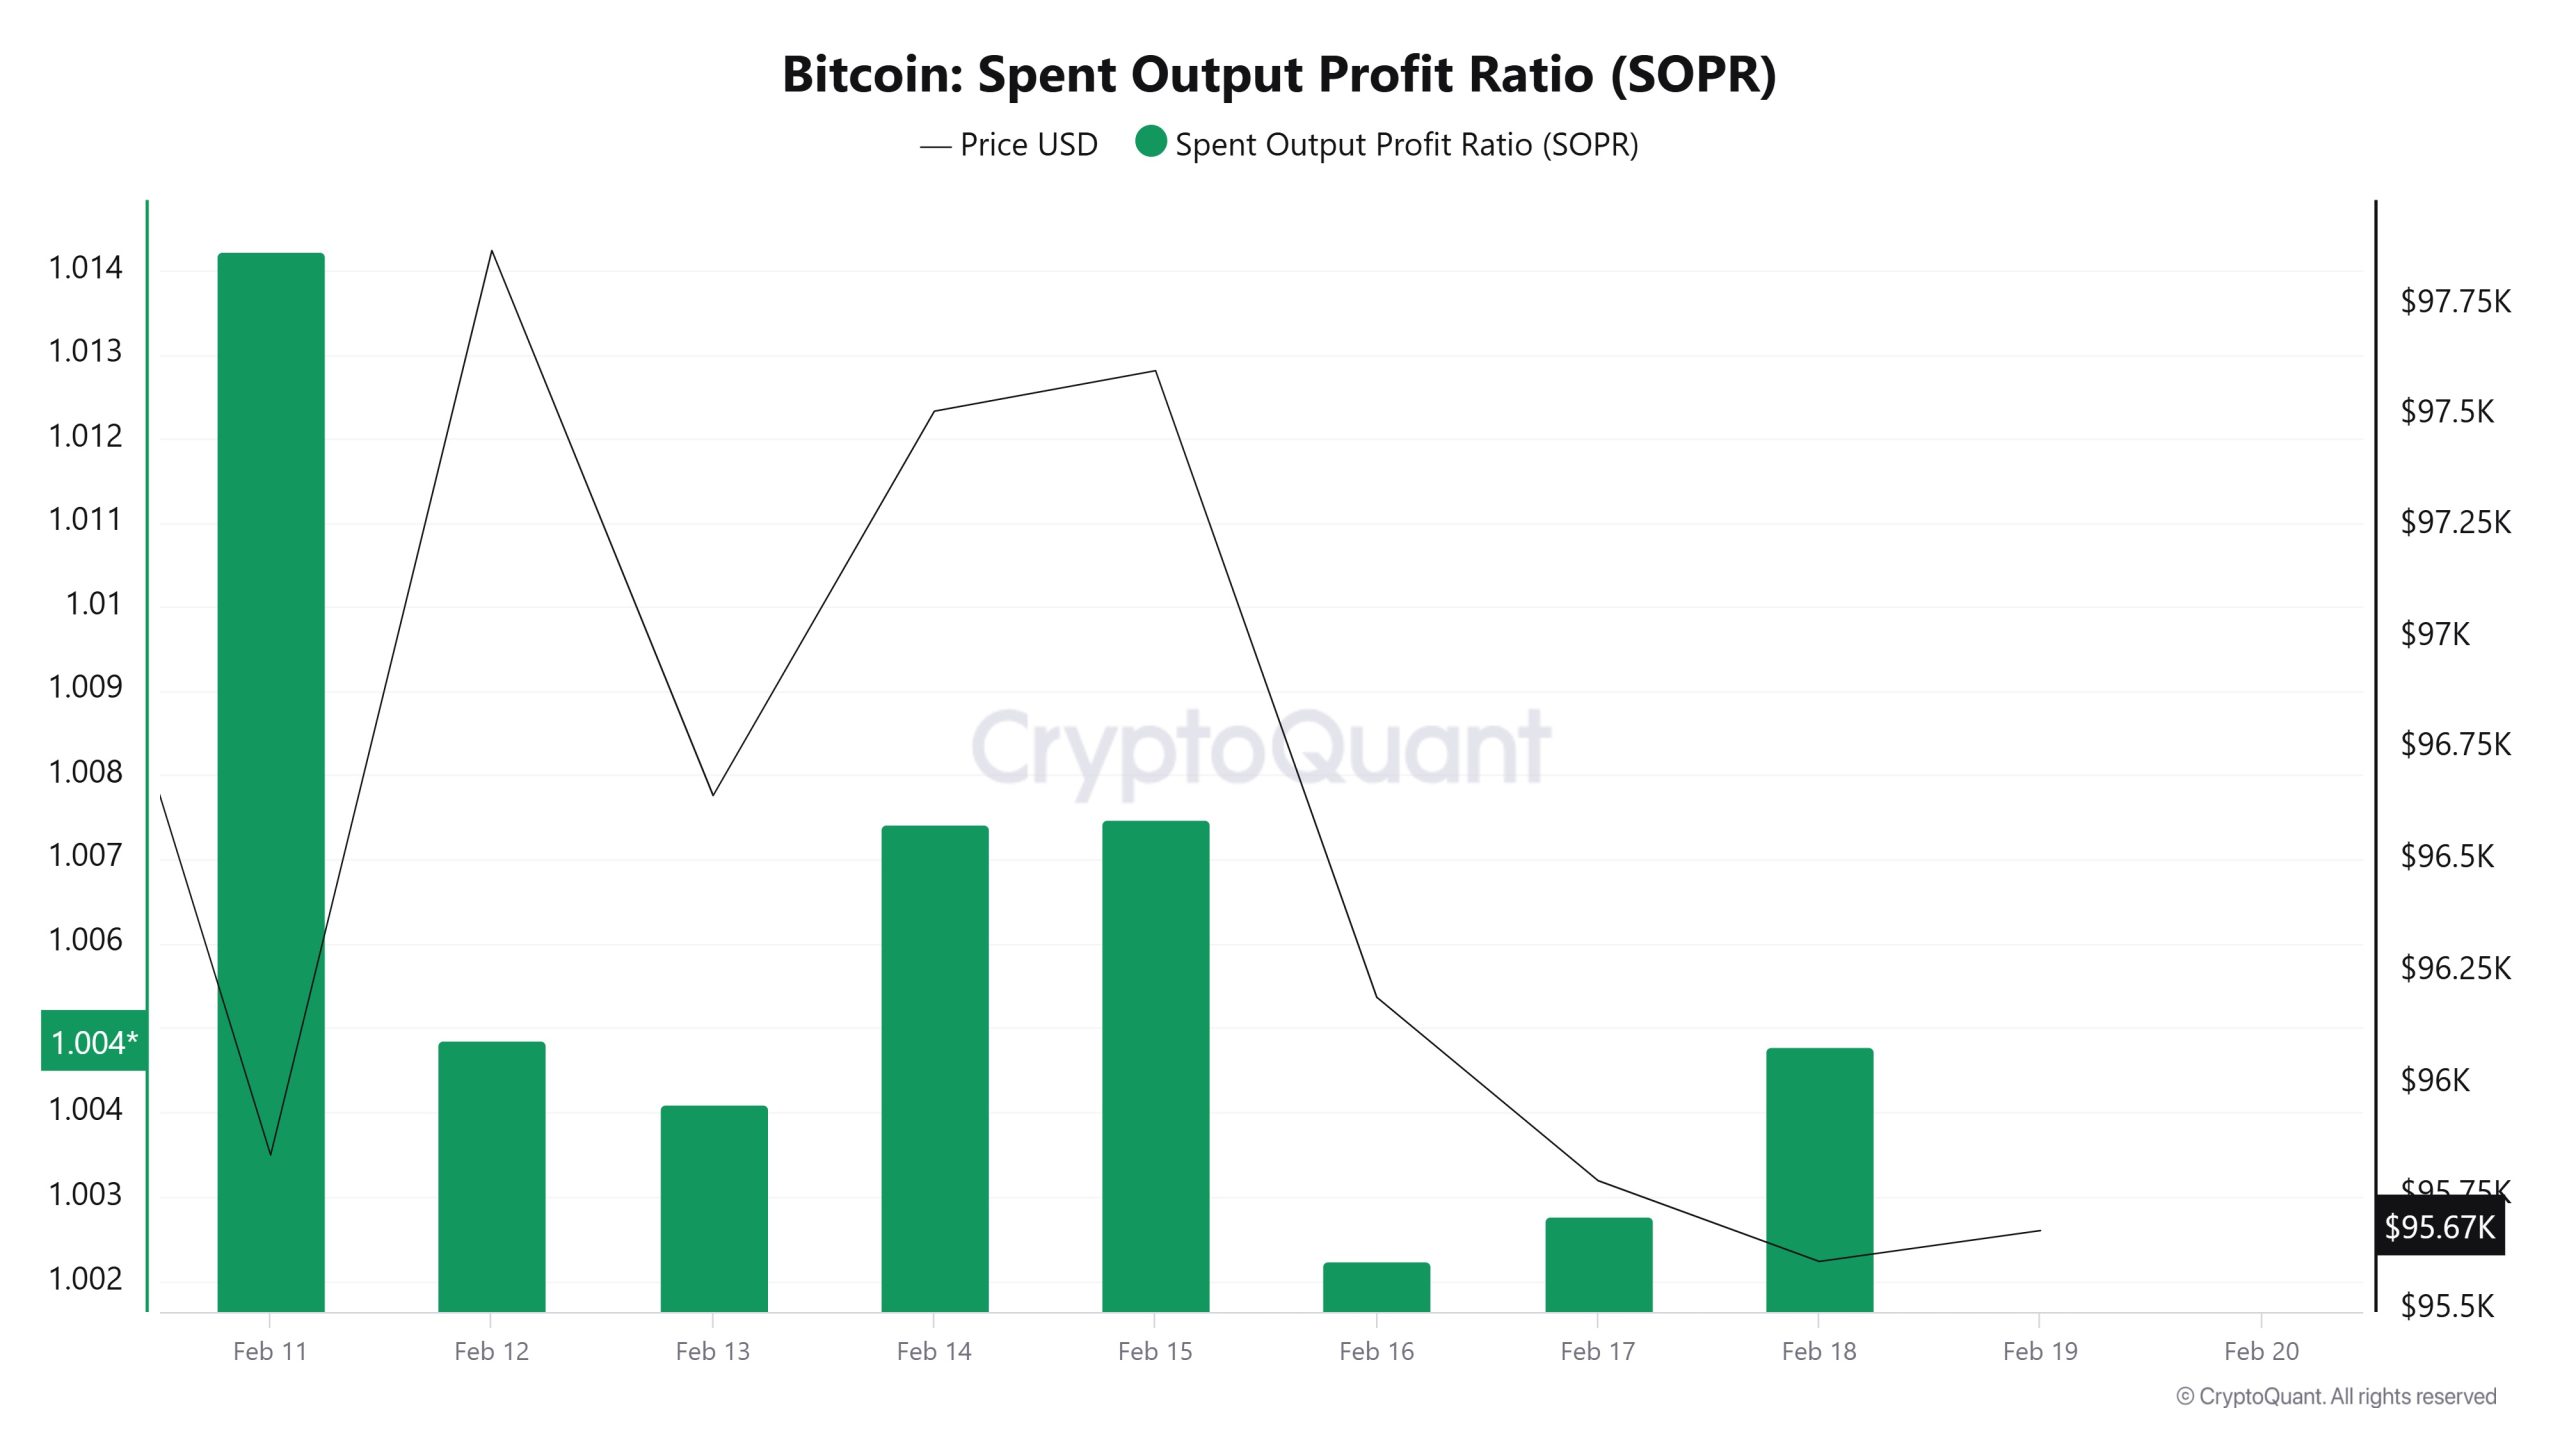
On February 12, the Bitcoin price was at 97,872 while the SOPR metric was 1.0048. As of February 18, the Bitcoin price was down to 95,605 while the SOPR metric was 1.0047. Compared to last week, the Bitcoin price has decreased by 2.32% and the SOPR metric has decreased by about 0.01%.
Derivatives
Open Interest
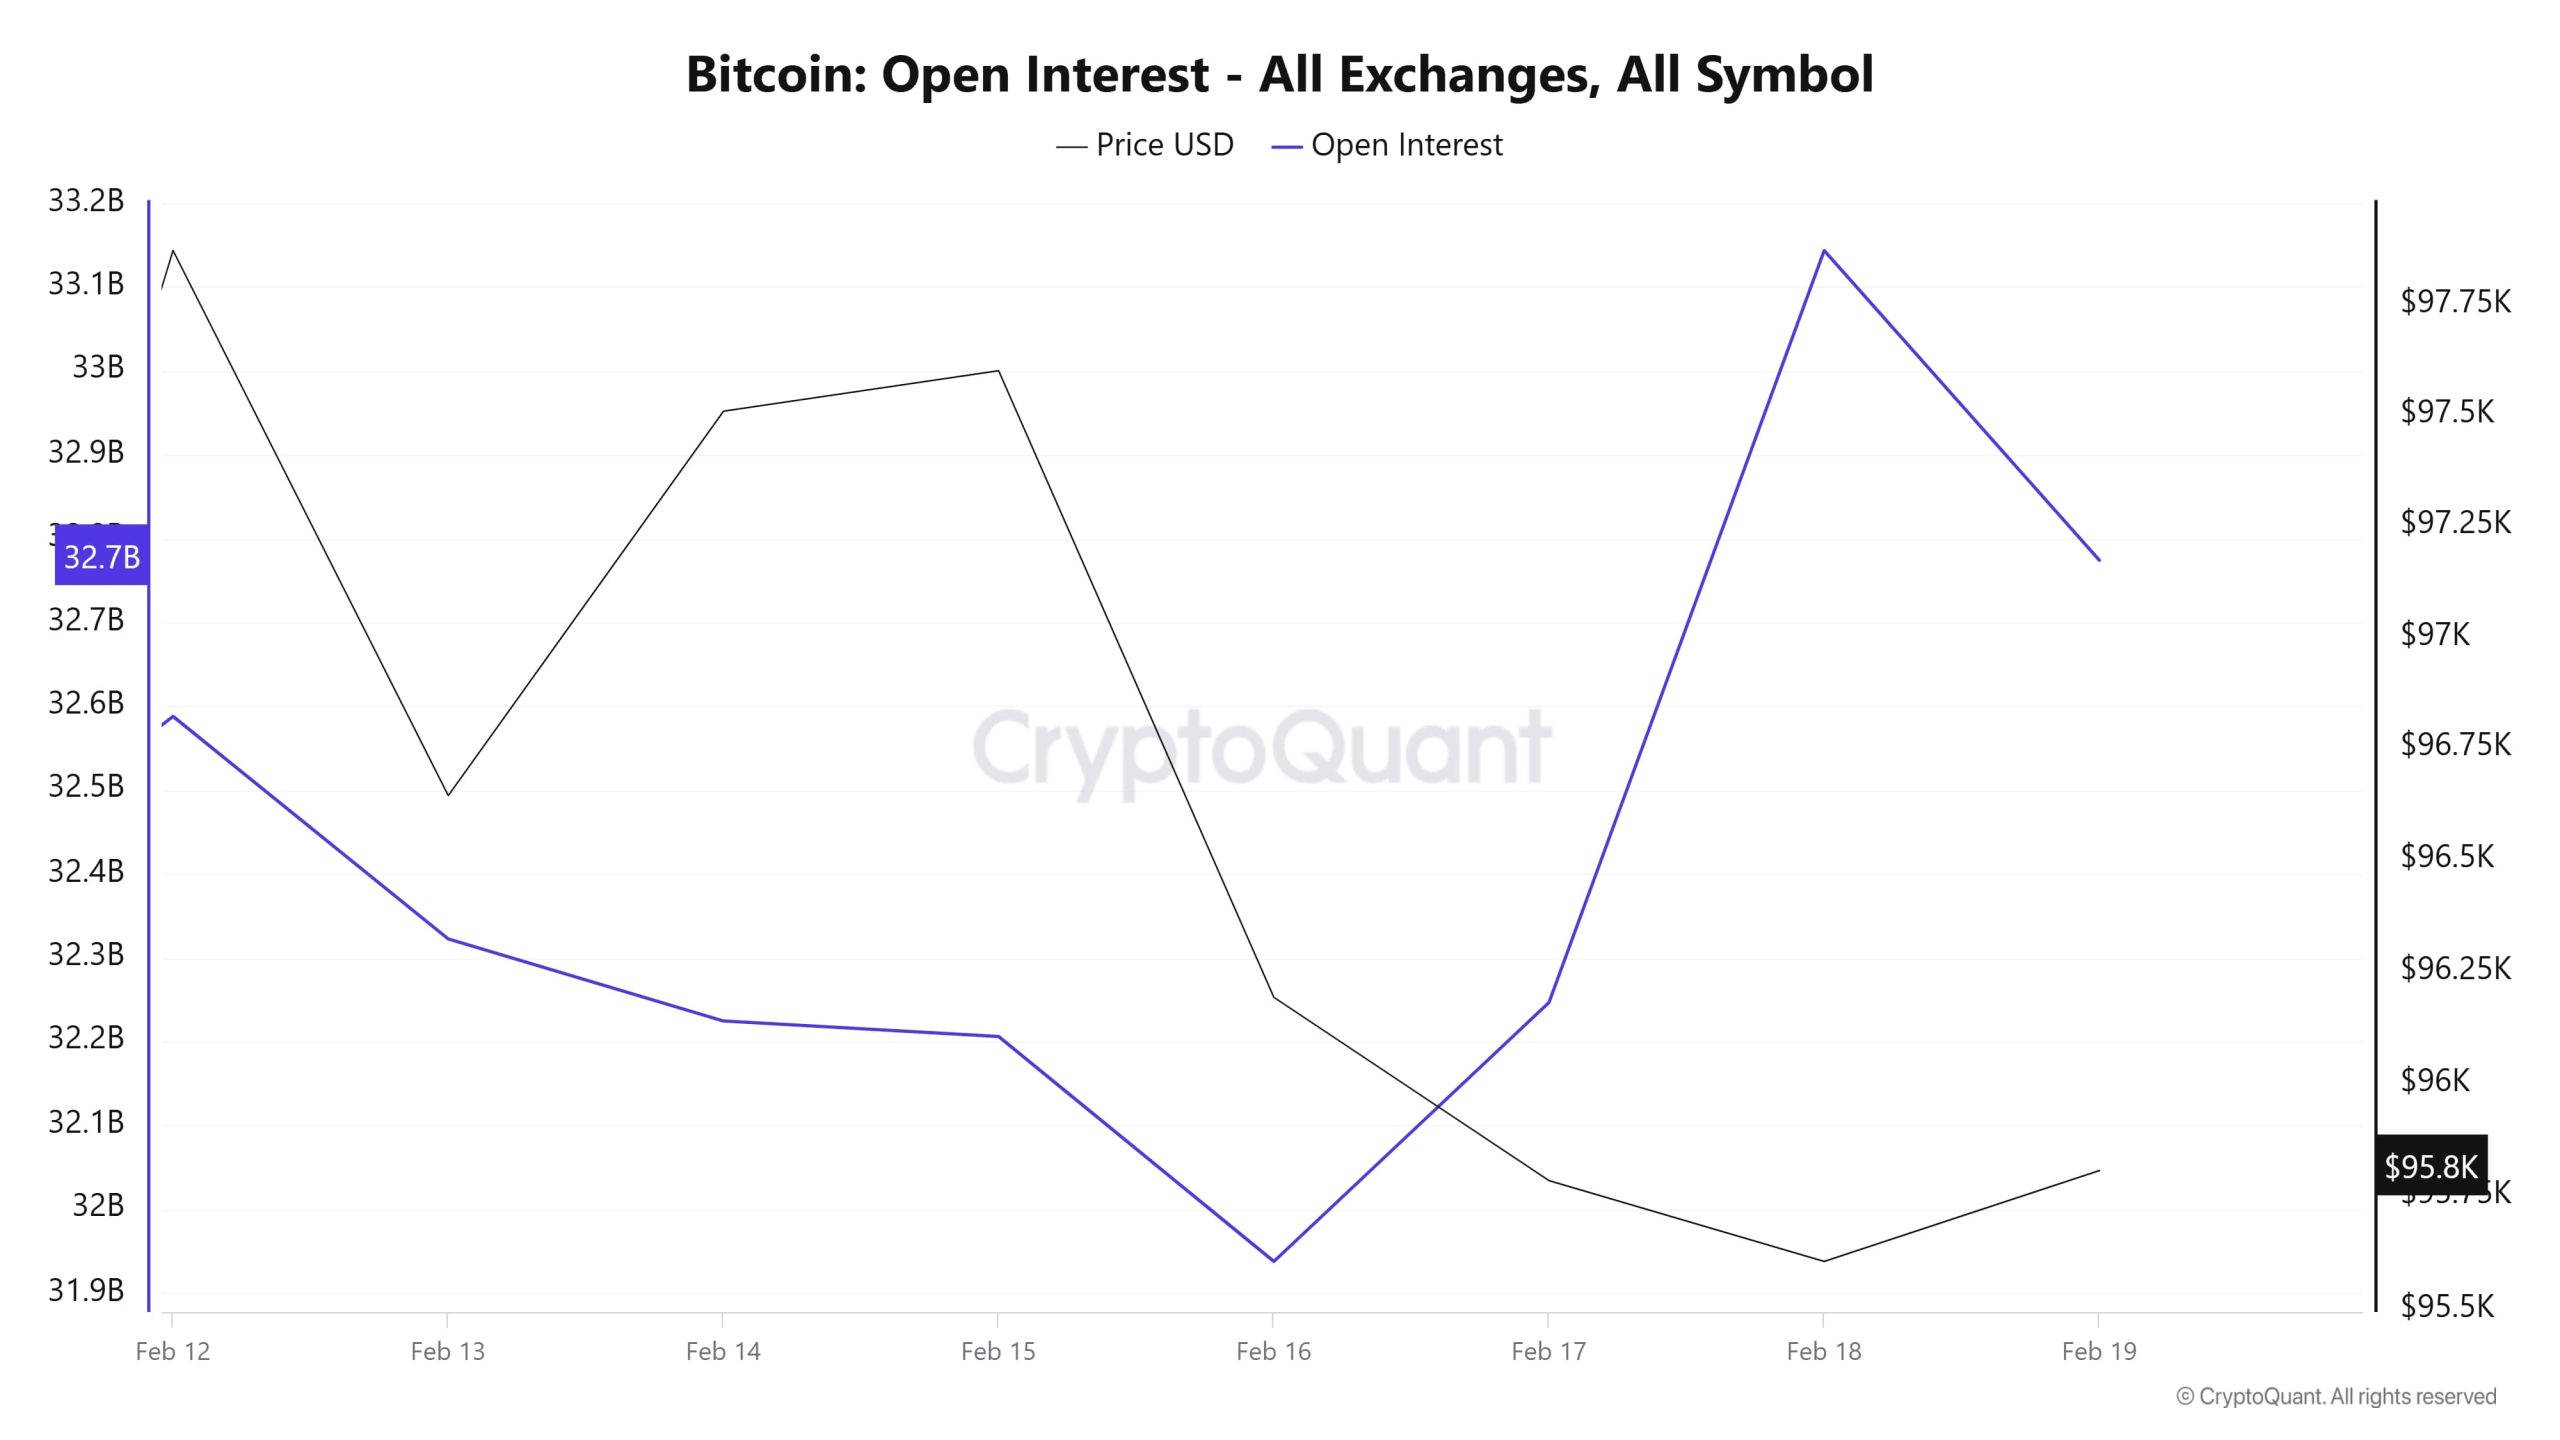 On February 12, open positions stood at around $32.6 billion, with a gradual decline in the following days. This decline continued until February 16 and open positions fell to $31.9 billion. However, the direction changes as of February 16. Open positions started to recover and the rise accelerated, reaching $33.1 billion on February 18. This increase does not last long and on February 19, it returns to the level of $32.7 billion . The relationship between BTC price and open positions fluctuates. On February 16, as the price hit a low, open positions also bottomed out. In the following days, there was a rapid increase in open positions while the price remained flat for a while.
As a result, it is seen that the price decline is caused by the short positions opened and the price rises as the positions are closed.
Funding Rate
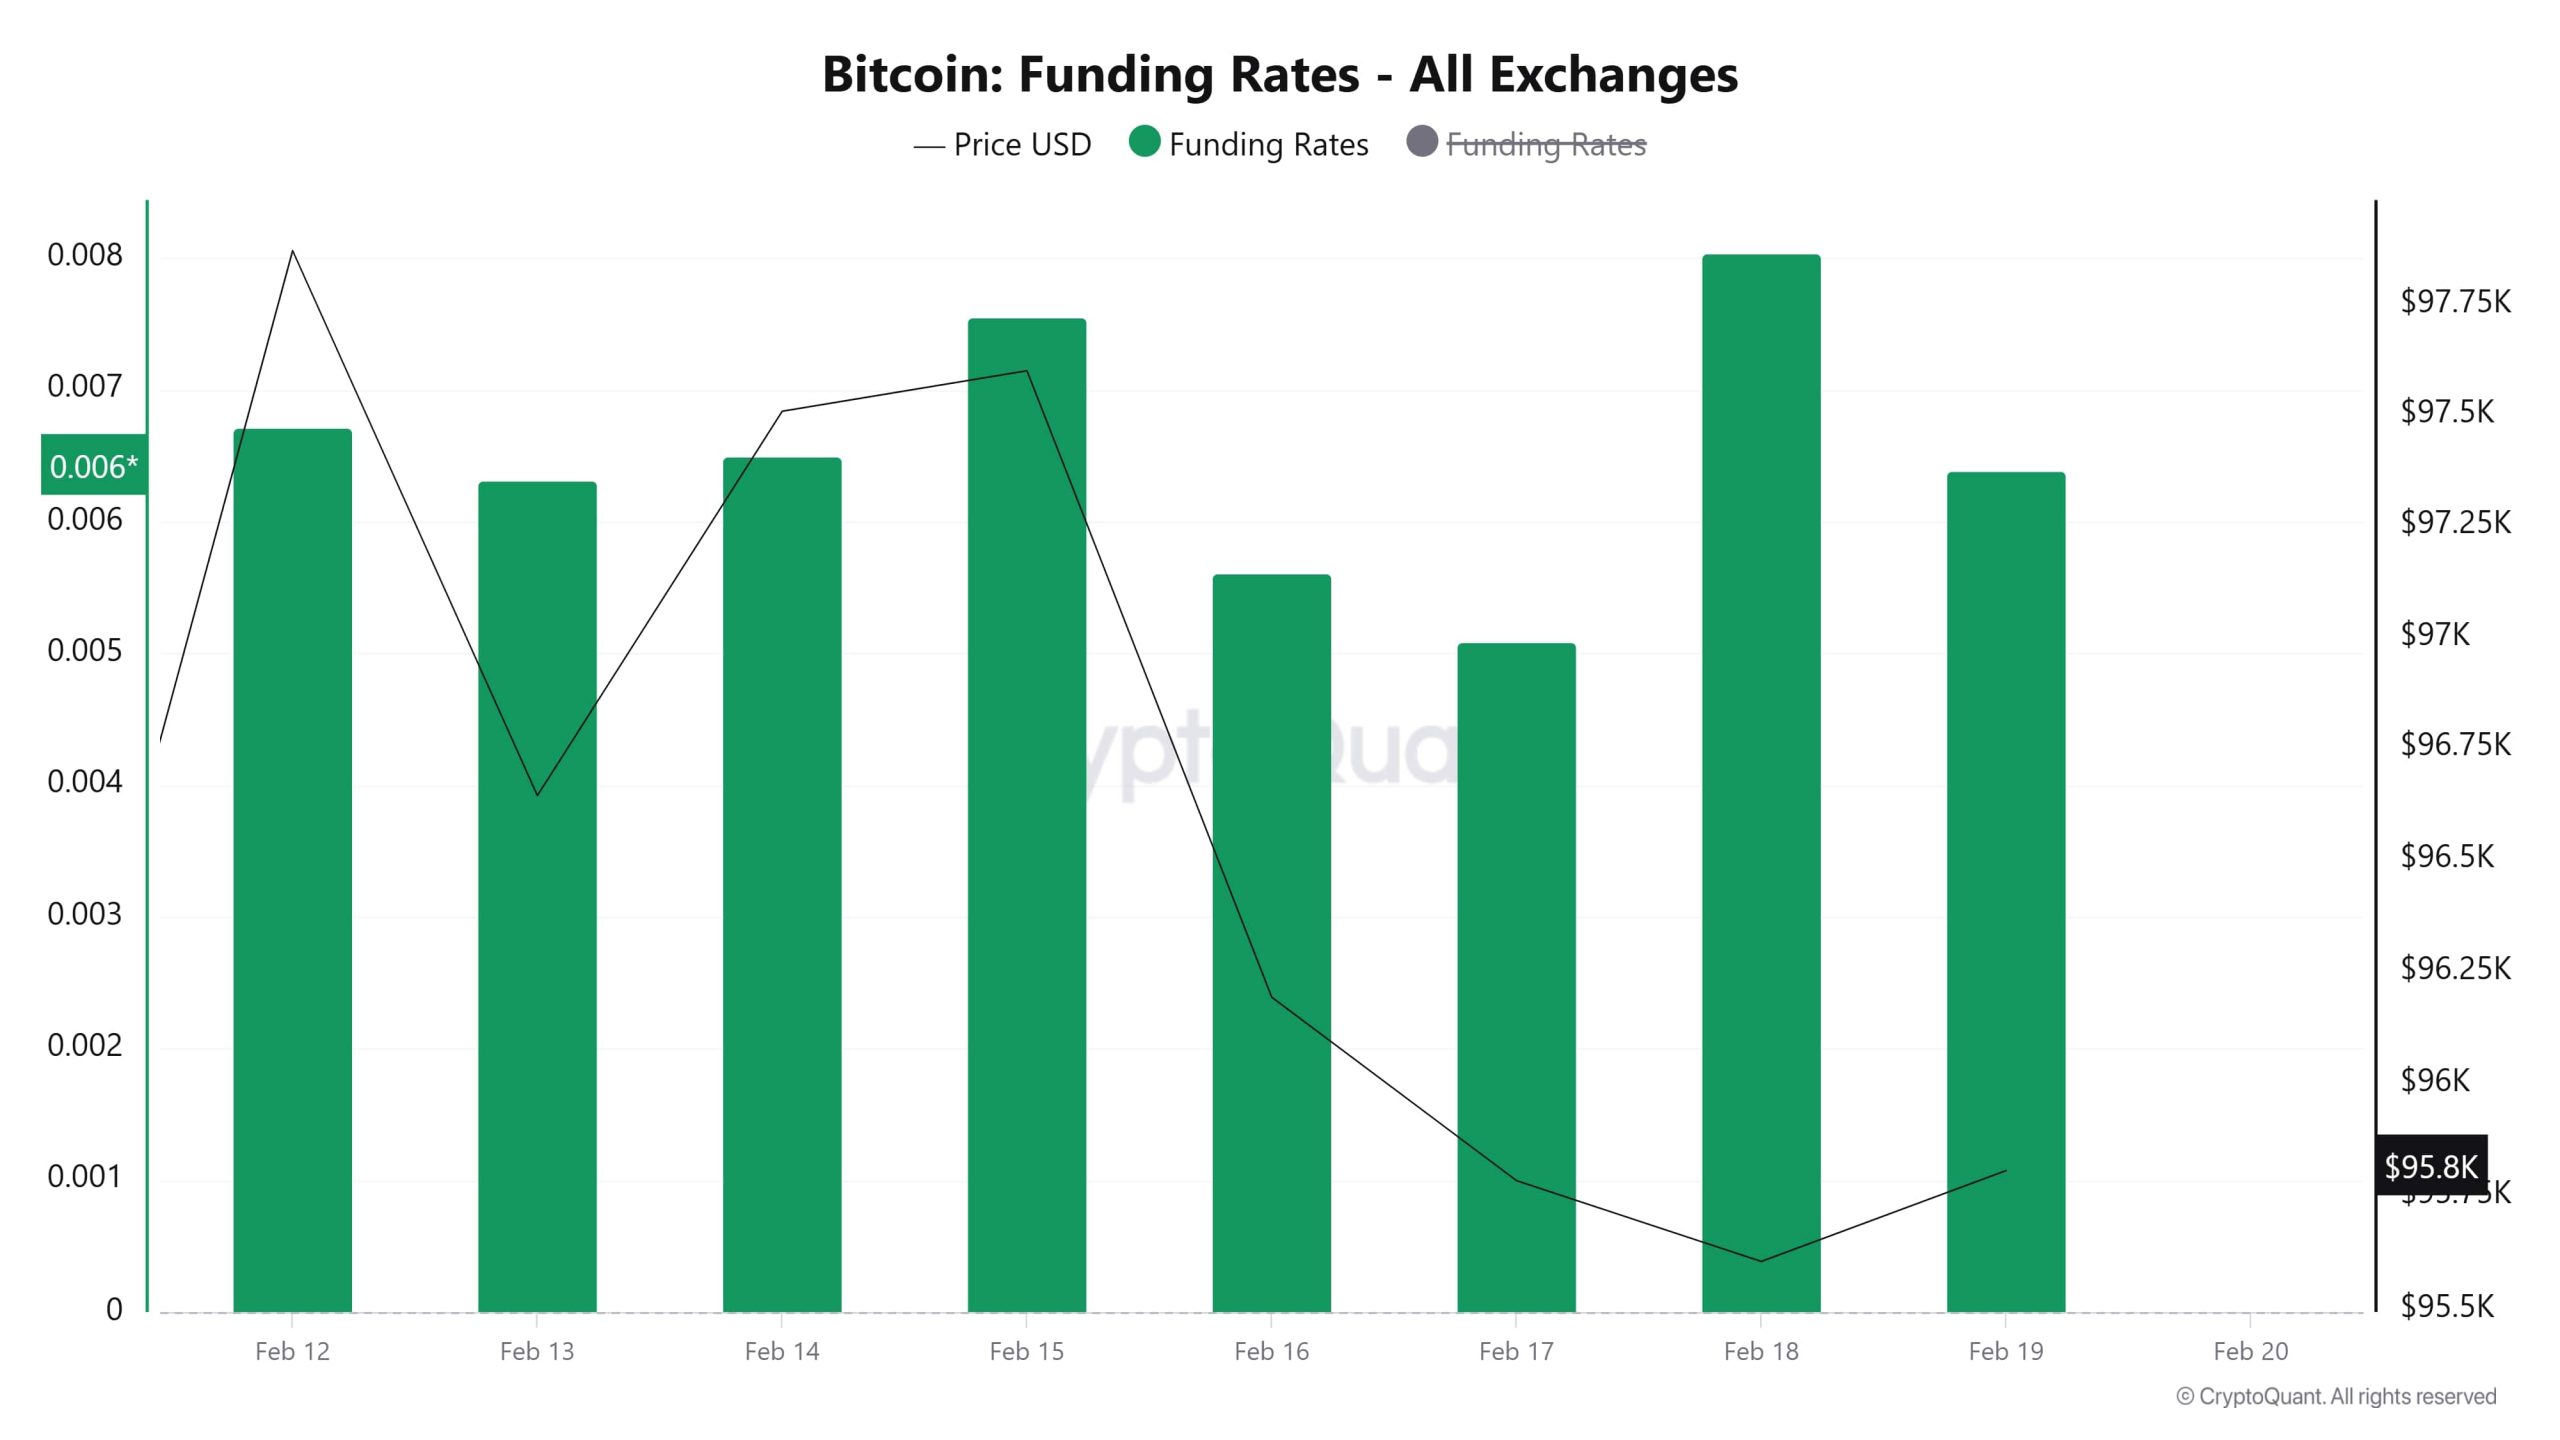
As of February 12, the funding rate starts at 0.006 and rises as prices rise. On February 13, there is a brief decline, but it rebounds on February 14 and 15, approaching 0.008. After February 15, funding rates fluctuate. As of February 16, a significant decline began and fell to lower levels on February 17. During this period, the BTC price also moves downwards. As of February 18, while funding rates increased again, it is noteworthy that the price has not yet shown a significant recovery. On February 19, funding rates declined slightly, but still remained in positive territory.
Long & Short Liquidations
With the BTC price, which has been on a downward trend since February 12, it is seen that $ 308 million long positions have been liquidated. Short liquidations have been realized at the level of 95 million dollars.
| Date | Long Amount (Million $) | Short Amount (Million $) |
|---|---|---|
| 12 January | 60.35 | 33.54 |
| 13 January | 19.05 | 6.75 |
| 14 January | 12.12 | 25.24 |
| 15 January | 2.44 | 1.91 |
| 16 January | 11.73 | 1.10 |
| 17 January | 20.73 | 7.29 |
| 18 January | 182.14 | 19.34 |
| TOTAL | 308.56 | 95.17 |
Supply Distribution
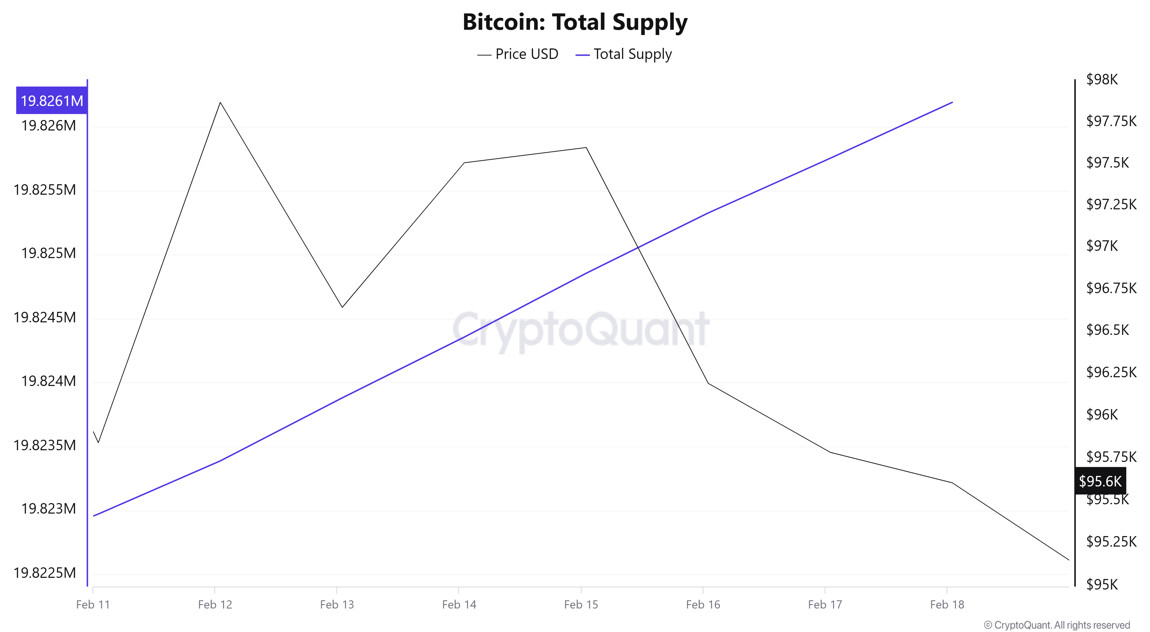
Total Supply: It reached 19,826,192 units, up about 0.0325% from last week.
New Supply: The amount of BTC produced this week was 6,435.
Velocity: Velocity, which was 14.13 last week, was 14.02 as of February 18.
| Wallet Category | 11.02.2025 | 18.02.2025 | Change (%) |
|---|---|---|---|
| < 1 BTC | 8.5% | 8.5264% | 0.31% |
| 1 – 10 BTC | 11.67% | 11.685% | 0.13% |
| 10 – 100 BTC | 24.81% | 24.83% | 0.08% |
| 100 – 1k BTC | 28.21% | 28.257% | 0.17% |
| 1k – 10k BTC | 18.18% | 18.172% | -0.04% |
| 10k+ BTC | 8.60% | 8.524% | -0.88% |
When we look at the supply distribution, there was a limited increase of 0.31% in the “< 1 BTC” category, while a slight increase of 0.13% was observed in the “1 – 10 BTC” category. A small increase of 0.08% was observed in the “10 – 100 BTC” category, indicating that investors in this range remained relatively stable.
There was a remarkable increase of 0.17% in the “100 – 1K BTC” category, indicating that mid-sized investors are becoming more active in the market. In contrast, the “1K – 10K BTC” category saw a small decrease of 0.04% , while the “10K+ BTC” category saw a significant decrease of 0.88%. This suggests that large investors are gradually reducing their holdings and supply is shifting to smaller-scale wallets.
Exchange Reserve
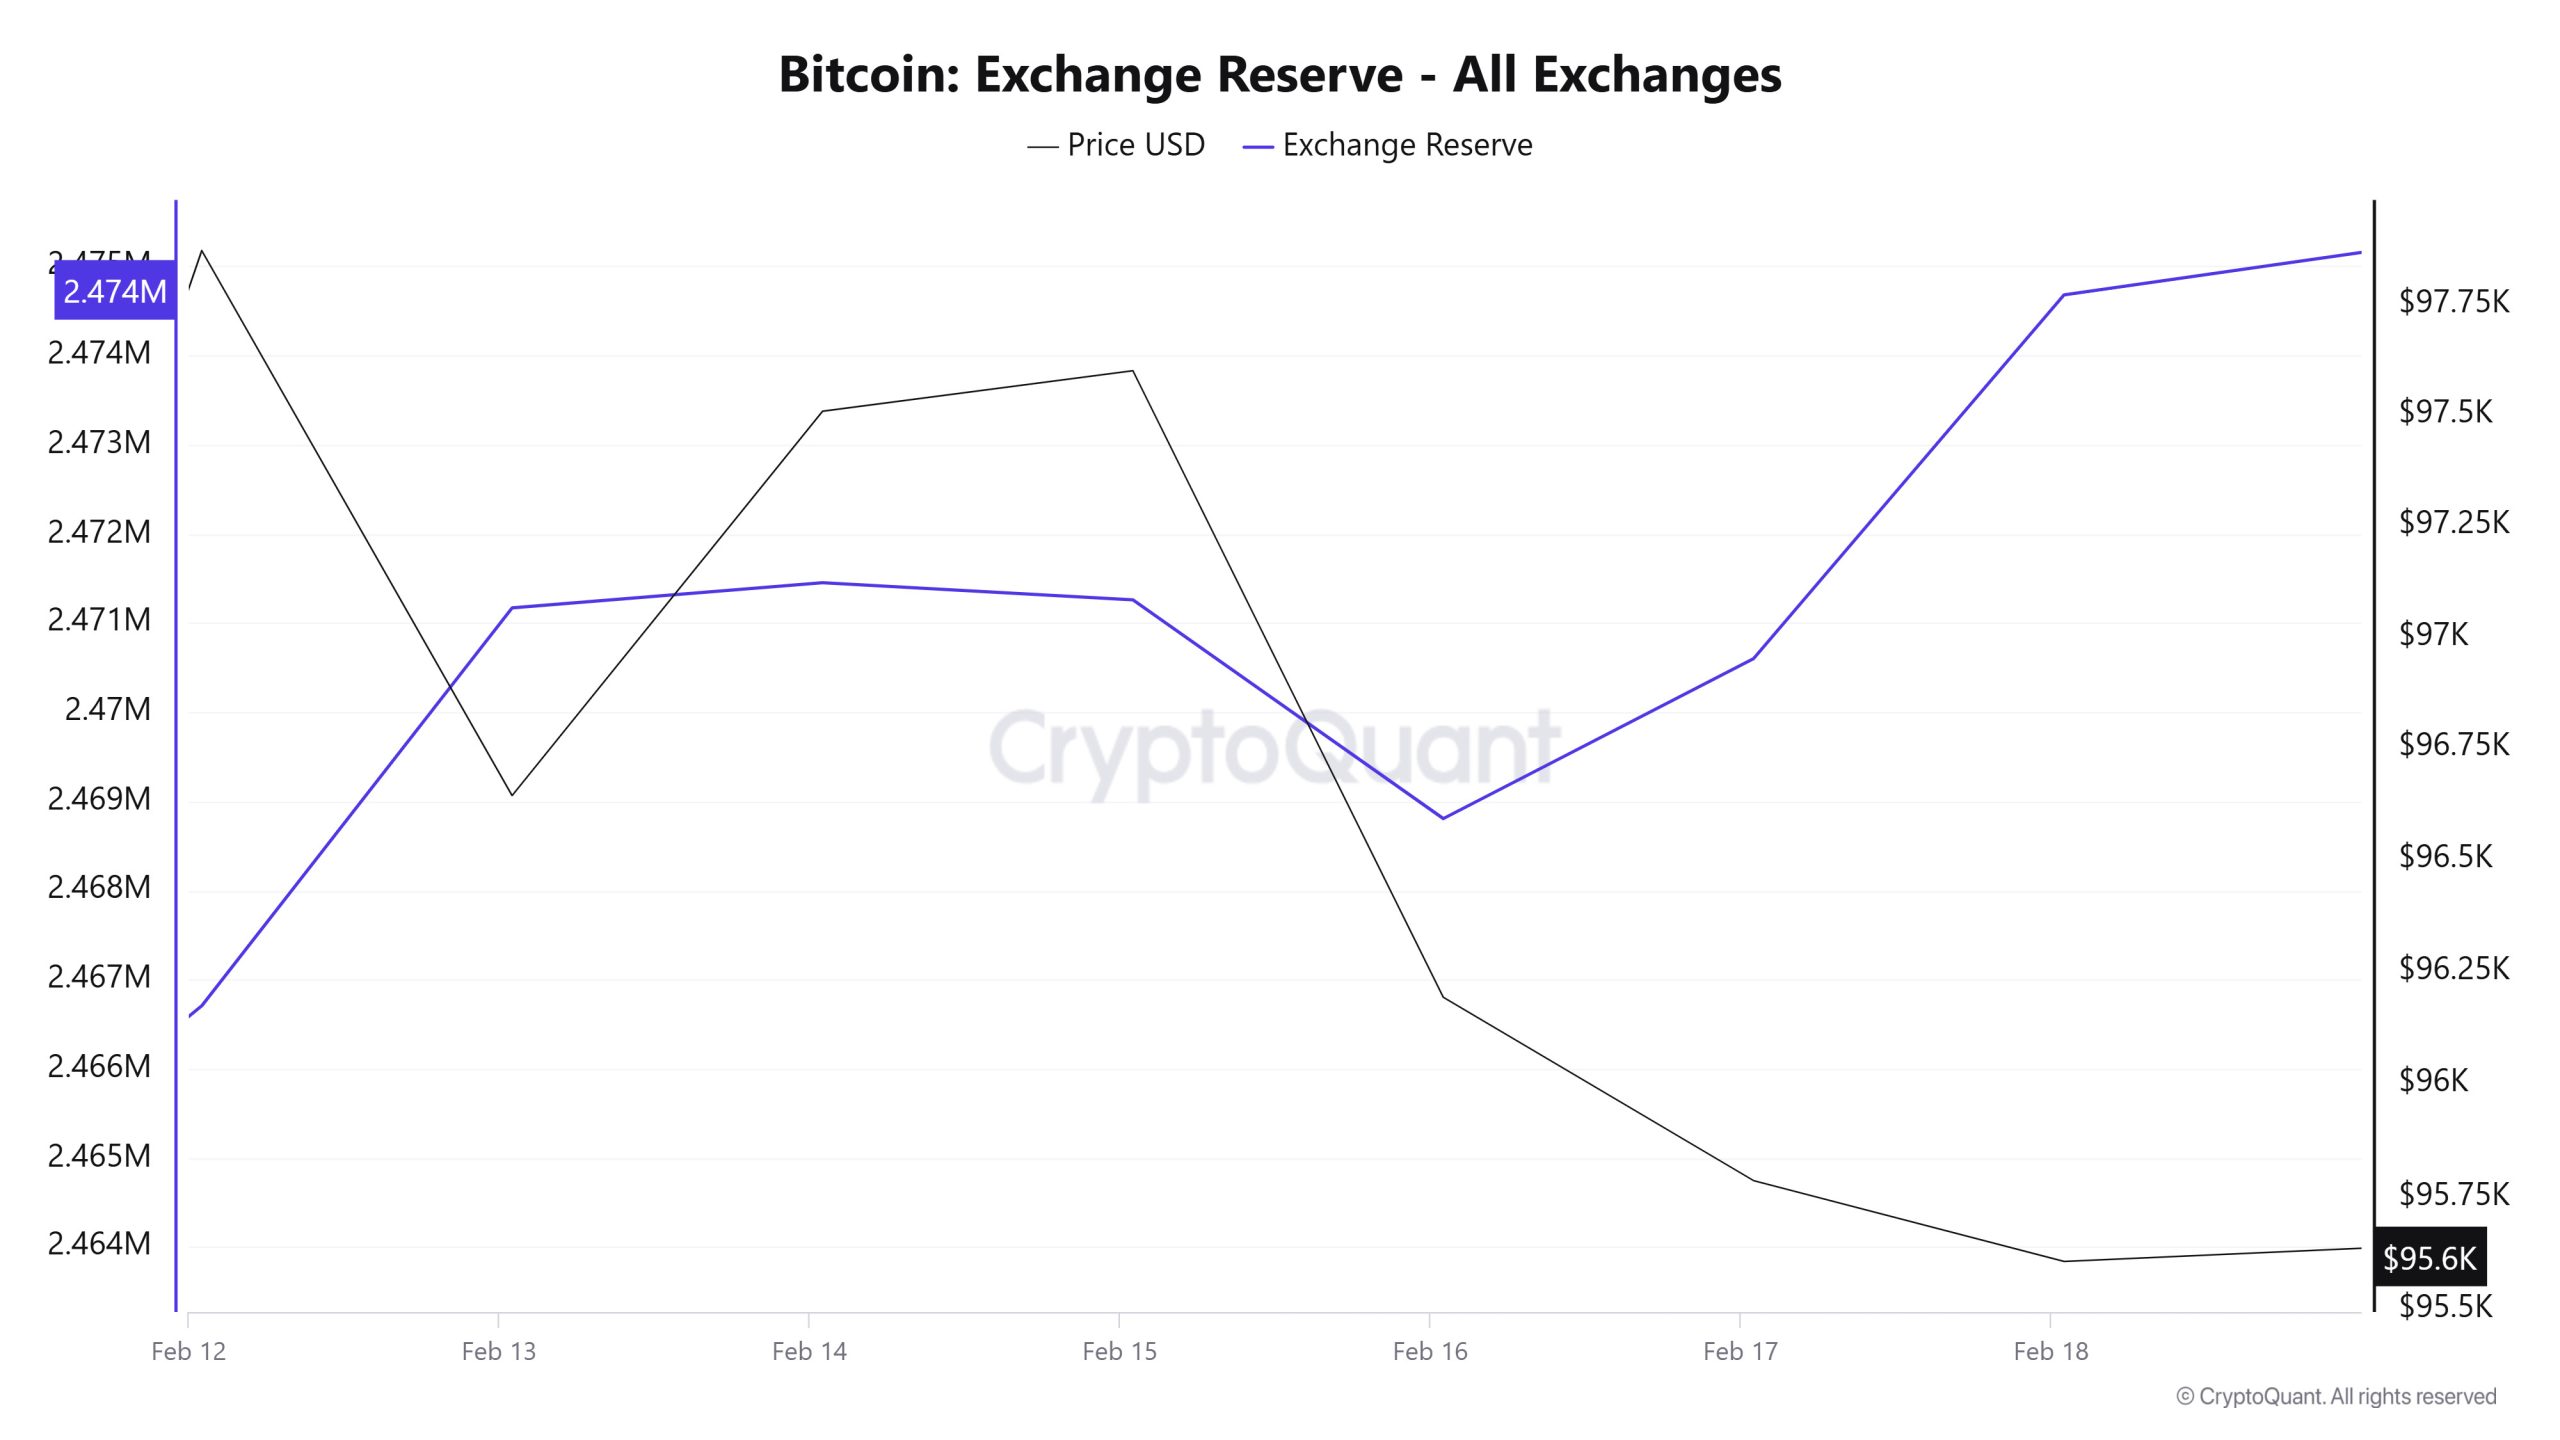
Between February 12-18, 2025, Bitcoin reserves on exchanges increased from 2,466,705 BTC to 2,474,680 BTC. In total, there were net inflows of 7,975 BTC during this period, and exchanges’ Bitcoin reserves increased by 0.32%. The Bitcoin price decreased by approximately 2.3% during this period. Bitcoin, which closed at $97,872 on February 12, 2025, closed at $95,606 on February 18, 2025.
| Date | 12-Feb | 13-Feb | 14-Feb | 15-Feb | 16-Feb | 17-Feb | 18-Feb |
|---|---|---|---|---|---|---|---|
| Exchange Inflow | 25,389 | 28,571 | 34,633 | 13,409 | 11,807 | 20,144 | 25,789 |
| Exchange Outflow | 22,522 | 24,106 | 34,352 | 13,600 | 14,261 | 18,348 | 21,710 |
| Exchange Netflow | 2,867 | 4,464 | 282 | -191 | -2,455 | 1,796 | 4,079 |
| Exchange Reserve | 2,466,705 | 2,471,170 | 2,471,451 | 2,471,260 | 2,468,806 | 2,470,602 | 2,474,680 |
| BTC Price | 97,872 | 96,644 | 97,508 | 97,600 | 96,193 | 95,785 | 95,606 |
The decline in BTC price suggests that the sell-off is continuing. If the reserve hike continues, this may increase the selling pressure in the short term and suppress the price. However, the start of net outflows from stock exchanges may support the price to gain upward momentum in the long run.
Fees and Revenues
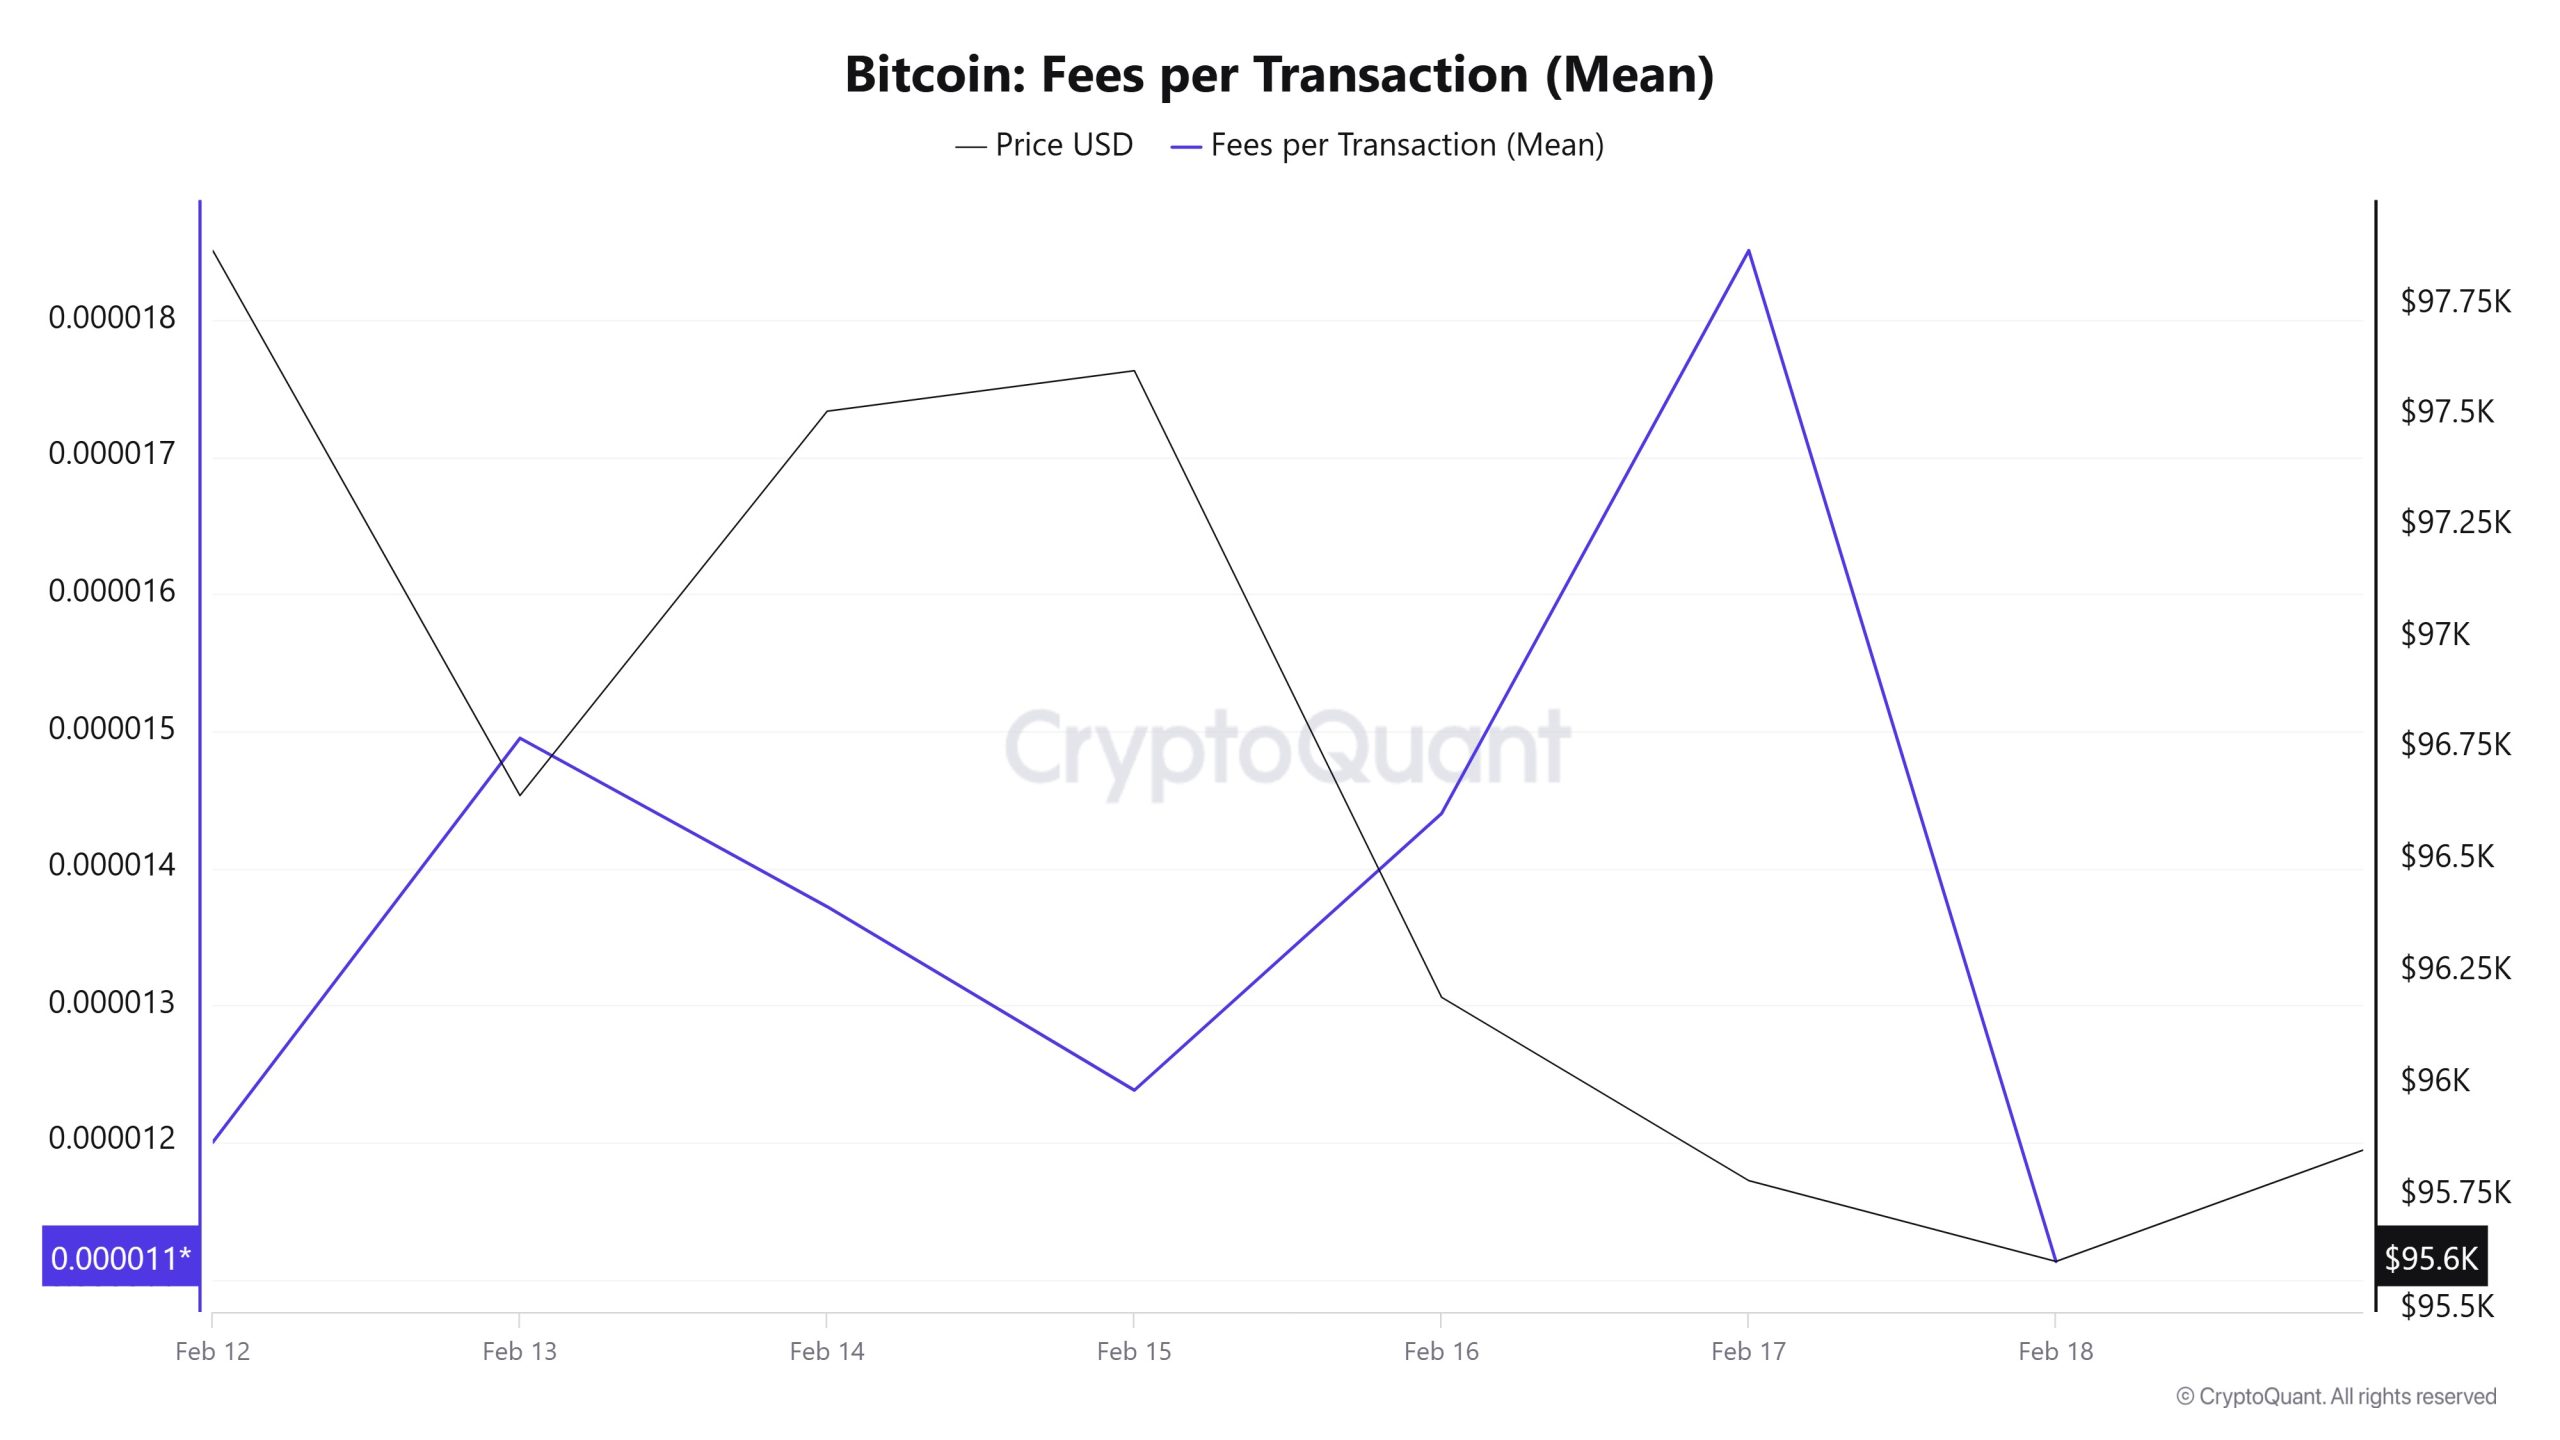
When Bitcoin Fees per Transaction (Mean) data between February 12-18 is analyzed, it is seen that this value was at the level of 0.000012 on February 12, the first day of the week. On February 13, the value increased slightly and reached 0.00001495. However, despite the recovery in the Bitcoin price at this level, a retracement was observed in this data. As of February 15, Fees per Transaction (Mean), which showed an upward trend again, reached 0.00001851 on February 17, recording the highest value of the week.
However, on February 18, the last day of the weekly period, there was a sharp retracement, and the value dropped to 0.00001113, the lowest level of the week.
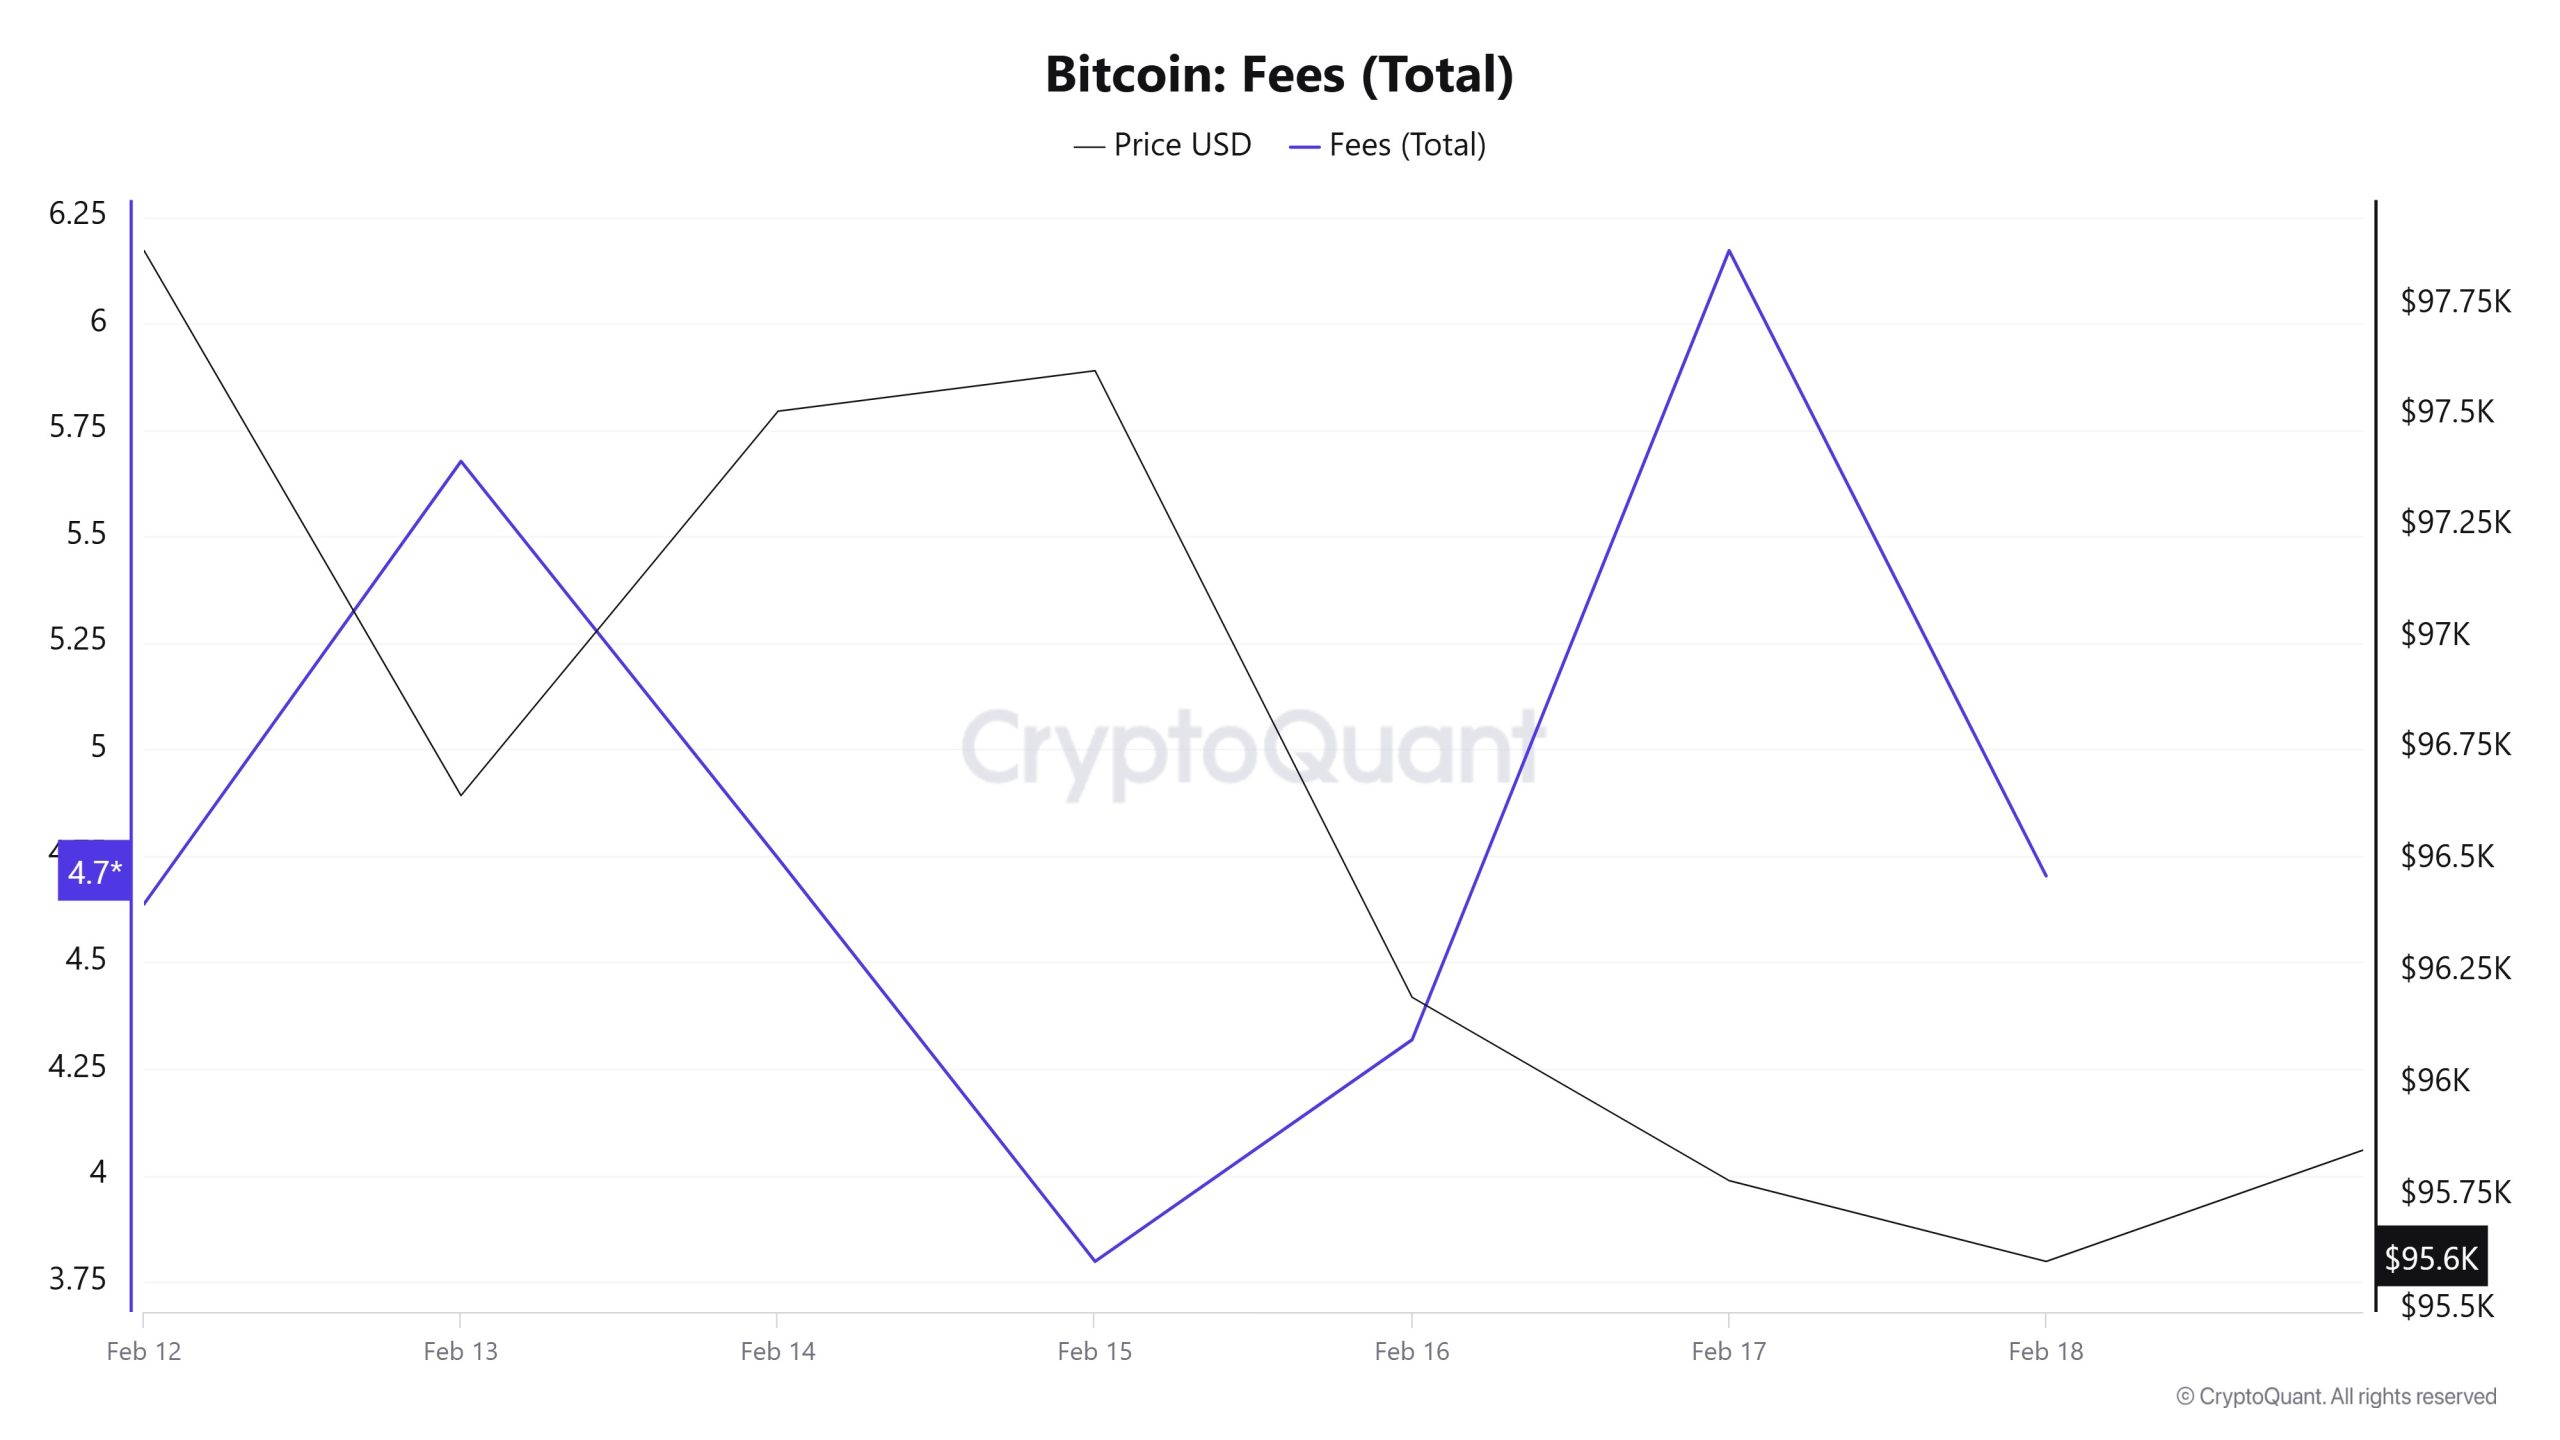
Similarly, when Bitcoin Fees (Total) data between February 12-18 are analyzed, it is observed that the value, which was at 4.63679763 on February 12, the first day of the week, increased on February 13, but then retreated after this date and reached its lowest level of the week on February 15, falling to 3.79761363. As of February 15, Bitcoin Fees (Total) data started to rise again and reached its highest value of the week on February 17, reaching 6.17147537.
However, on February 18, the last day of the weekly period, this value declined and closed at 4.
Miner Flows
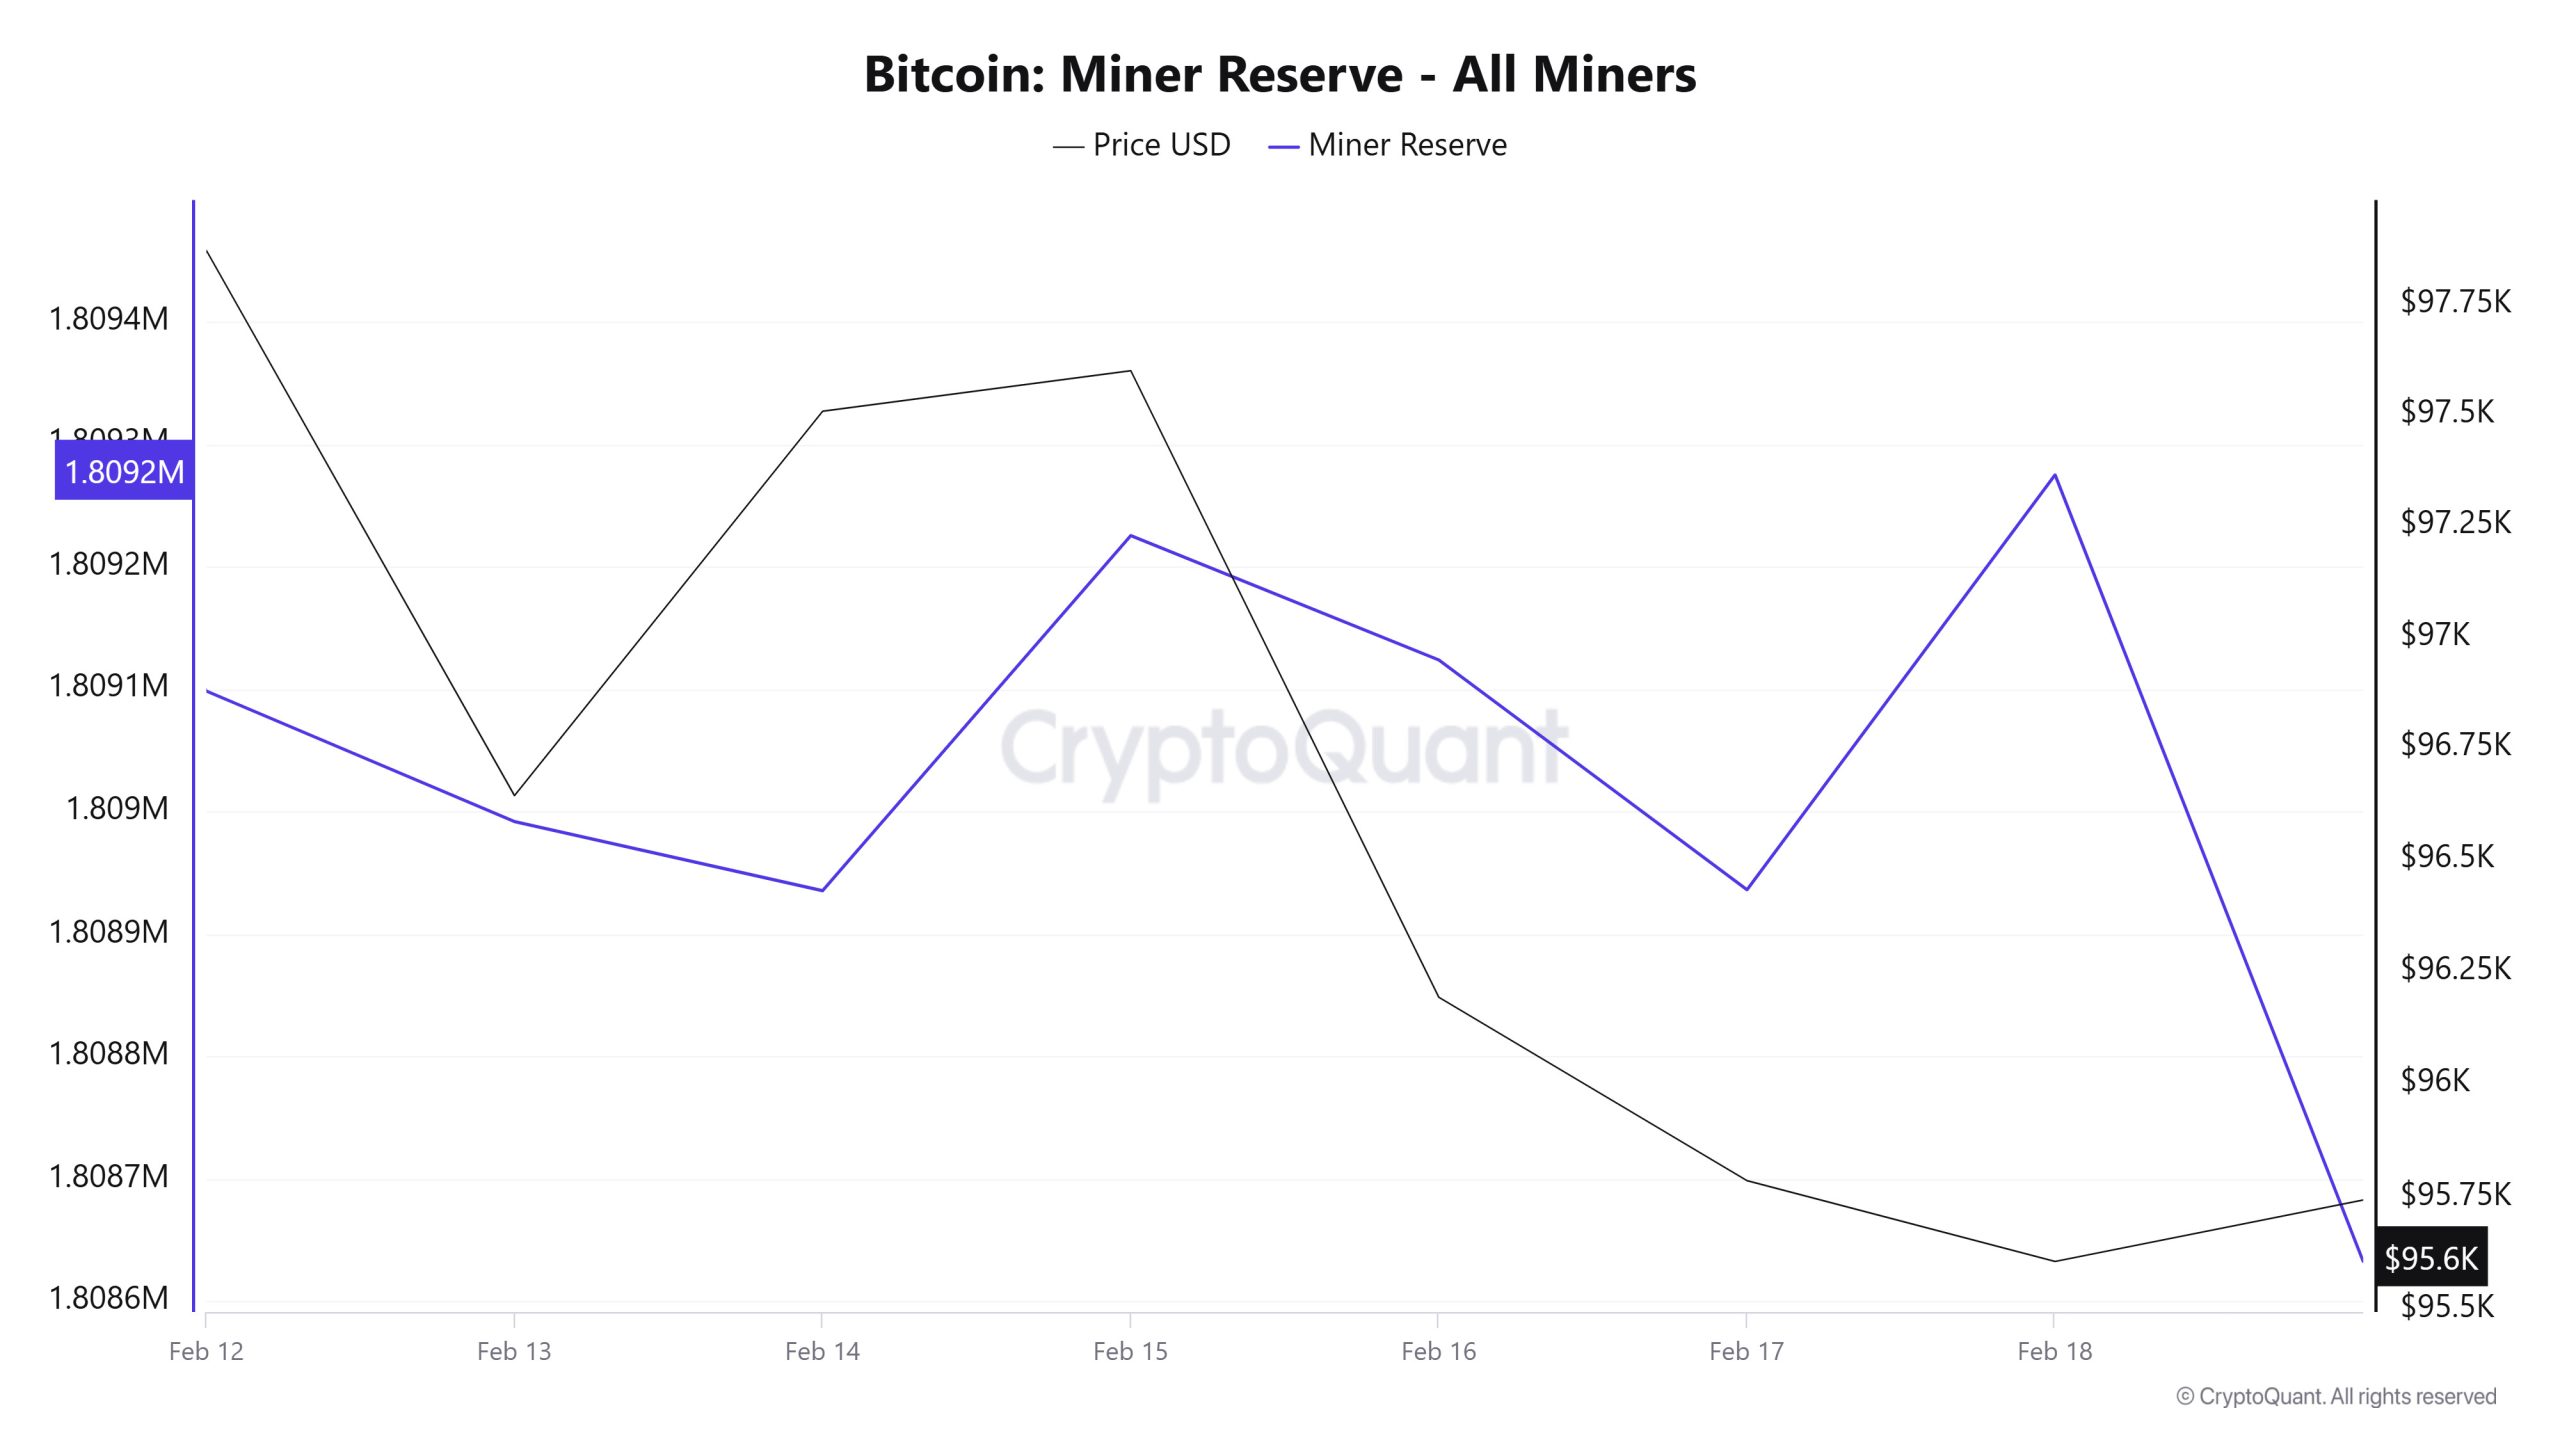
As can be seen in the Miner Reserve table, the number of Bitcoins in miners’ wallets decreased this week. Although Miner Reserve and Bitcoin price seemed to be positively correlated throughout the week, towards the end of the week, Miner Reserve and Bitcoin price turned into a negative correlation.
Miner Inflow, Outflow and NetFlow
Between February 12 and 18, 33,341 Bitcoins exited miners’ wallets, and 33,158 Bitcoins entered miners’ wallets between the same dates. The Miner Netflow for this week was -183 Bitcoin. Meanwhile, the Bitcoin price was $97,872 on February 12 and $95,605 on February 18.
For the week, the net flow (Miner NetFlow) was negative as Bitcoin inflow into miner wallets (Miner Inflow) was less than Bitcoin outflow from miner wallets (Miner Outflow).
| Date | February 12 | February 13 | February 14th | February 15 | February 16th | February 17th | February 18 |
| Miner Inflow | 5,046.70 | 5,786.14 | 5,001.22 | 3,348.01 | 2,989.99 | 4,624.17 | 6,361.75 |
| MinerOutflow | 5,406.50 | 5,892.86 | 5,057.64 | 3,057.92 | 3,091.64 | 4,811.84 | 6,022.89 |
| Miner Netflow | -359.80 | -106.71 | -56.42 | 290.10 | -101.65 | -187.68 | 338.86 |
Transaction
Transaction Count
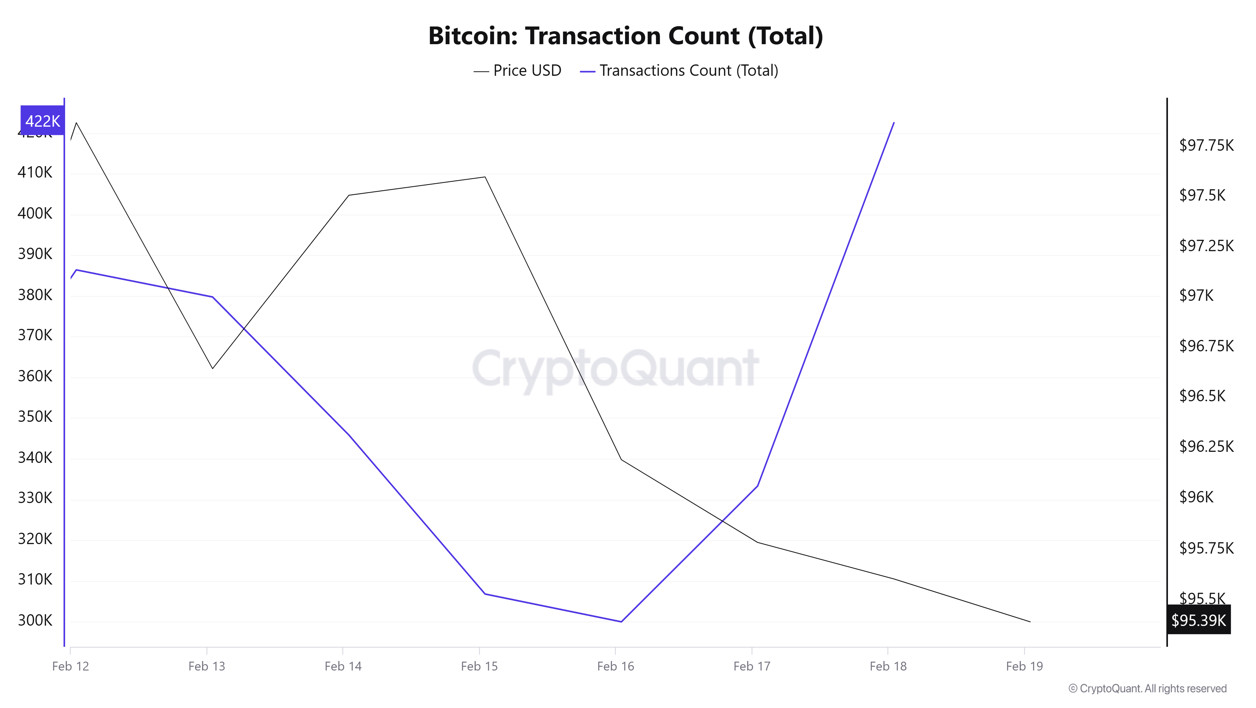
While the number of transactions on the Bitcoin network between February 5-11 was 2,858,411, it decreased by 13.4% to 2,474,612 between February 12-18. The lowest transaction volume was 299,940 on February 16, while the highest was 422,569 on February 18. This shows a continuation of the routine where the number of transactions on the weekend is lower than on weekdays. In addition, while the Bitcoin price fell on February 16-18, the increase in the amount of transactions can be considered as an indicator of transfers made due to selling pressure.
Tokens Transferred
While 3,802,662 Bitcoins were transferred between February 5-11, this amount increased by 3.43% to 3,932,866 between February 12-18. The least amount of bitcoins transferred was 471,624 on February 16, while the most bitcoins transferred in a single day was 626,357 on February 14. The fact that the least amount of bitcoins transferred and the least number of transactions occurred on the same day coincides with the lack of volume routines related to the weekend.
While there was a decrease in the number of transactions this week compared to last week, the increase in the total amount of Bitcoin transferred indicates that the average transfer size, i.e. the amount of Bitcoin per transaction, has increased. This indicates that investors are trading in larger chunks or that institutional investors are becoming more active in the market. Considering the pullbacks on the price, the possibility that institutional investors may be making profit realizations should be taken into account.
Whale Activities
Early in the last 7-day period, a number of Bitcoin whales transferred their assets to centralized digital asset exchanges, adding to the selling pressure. Whales have been quiet compared to previous periods. According to data from CryptoQuant, between February 12 and February 16, 2025, the volume of Bitcoin moved by whales increased by 45%, with transactions exceeding $10 million totaling 32,450 BTC. However, as Bitcoin fell from $98,850 to $94,000, major players stepped in and pulled more than 28,000 Bitcoins into their wallets through OTC transactions, according to data shared by CryptoQuant. This shows that institutional and large investors continue to be interested in Bitcoin, despite the decline in price.
Whales Activities
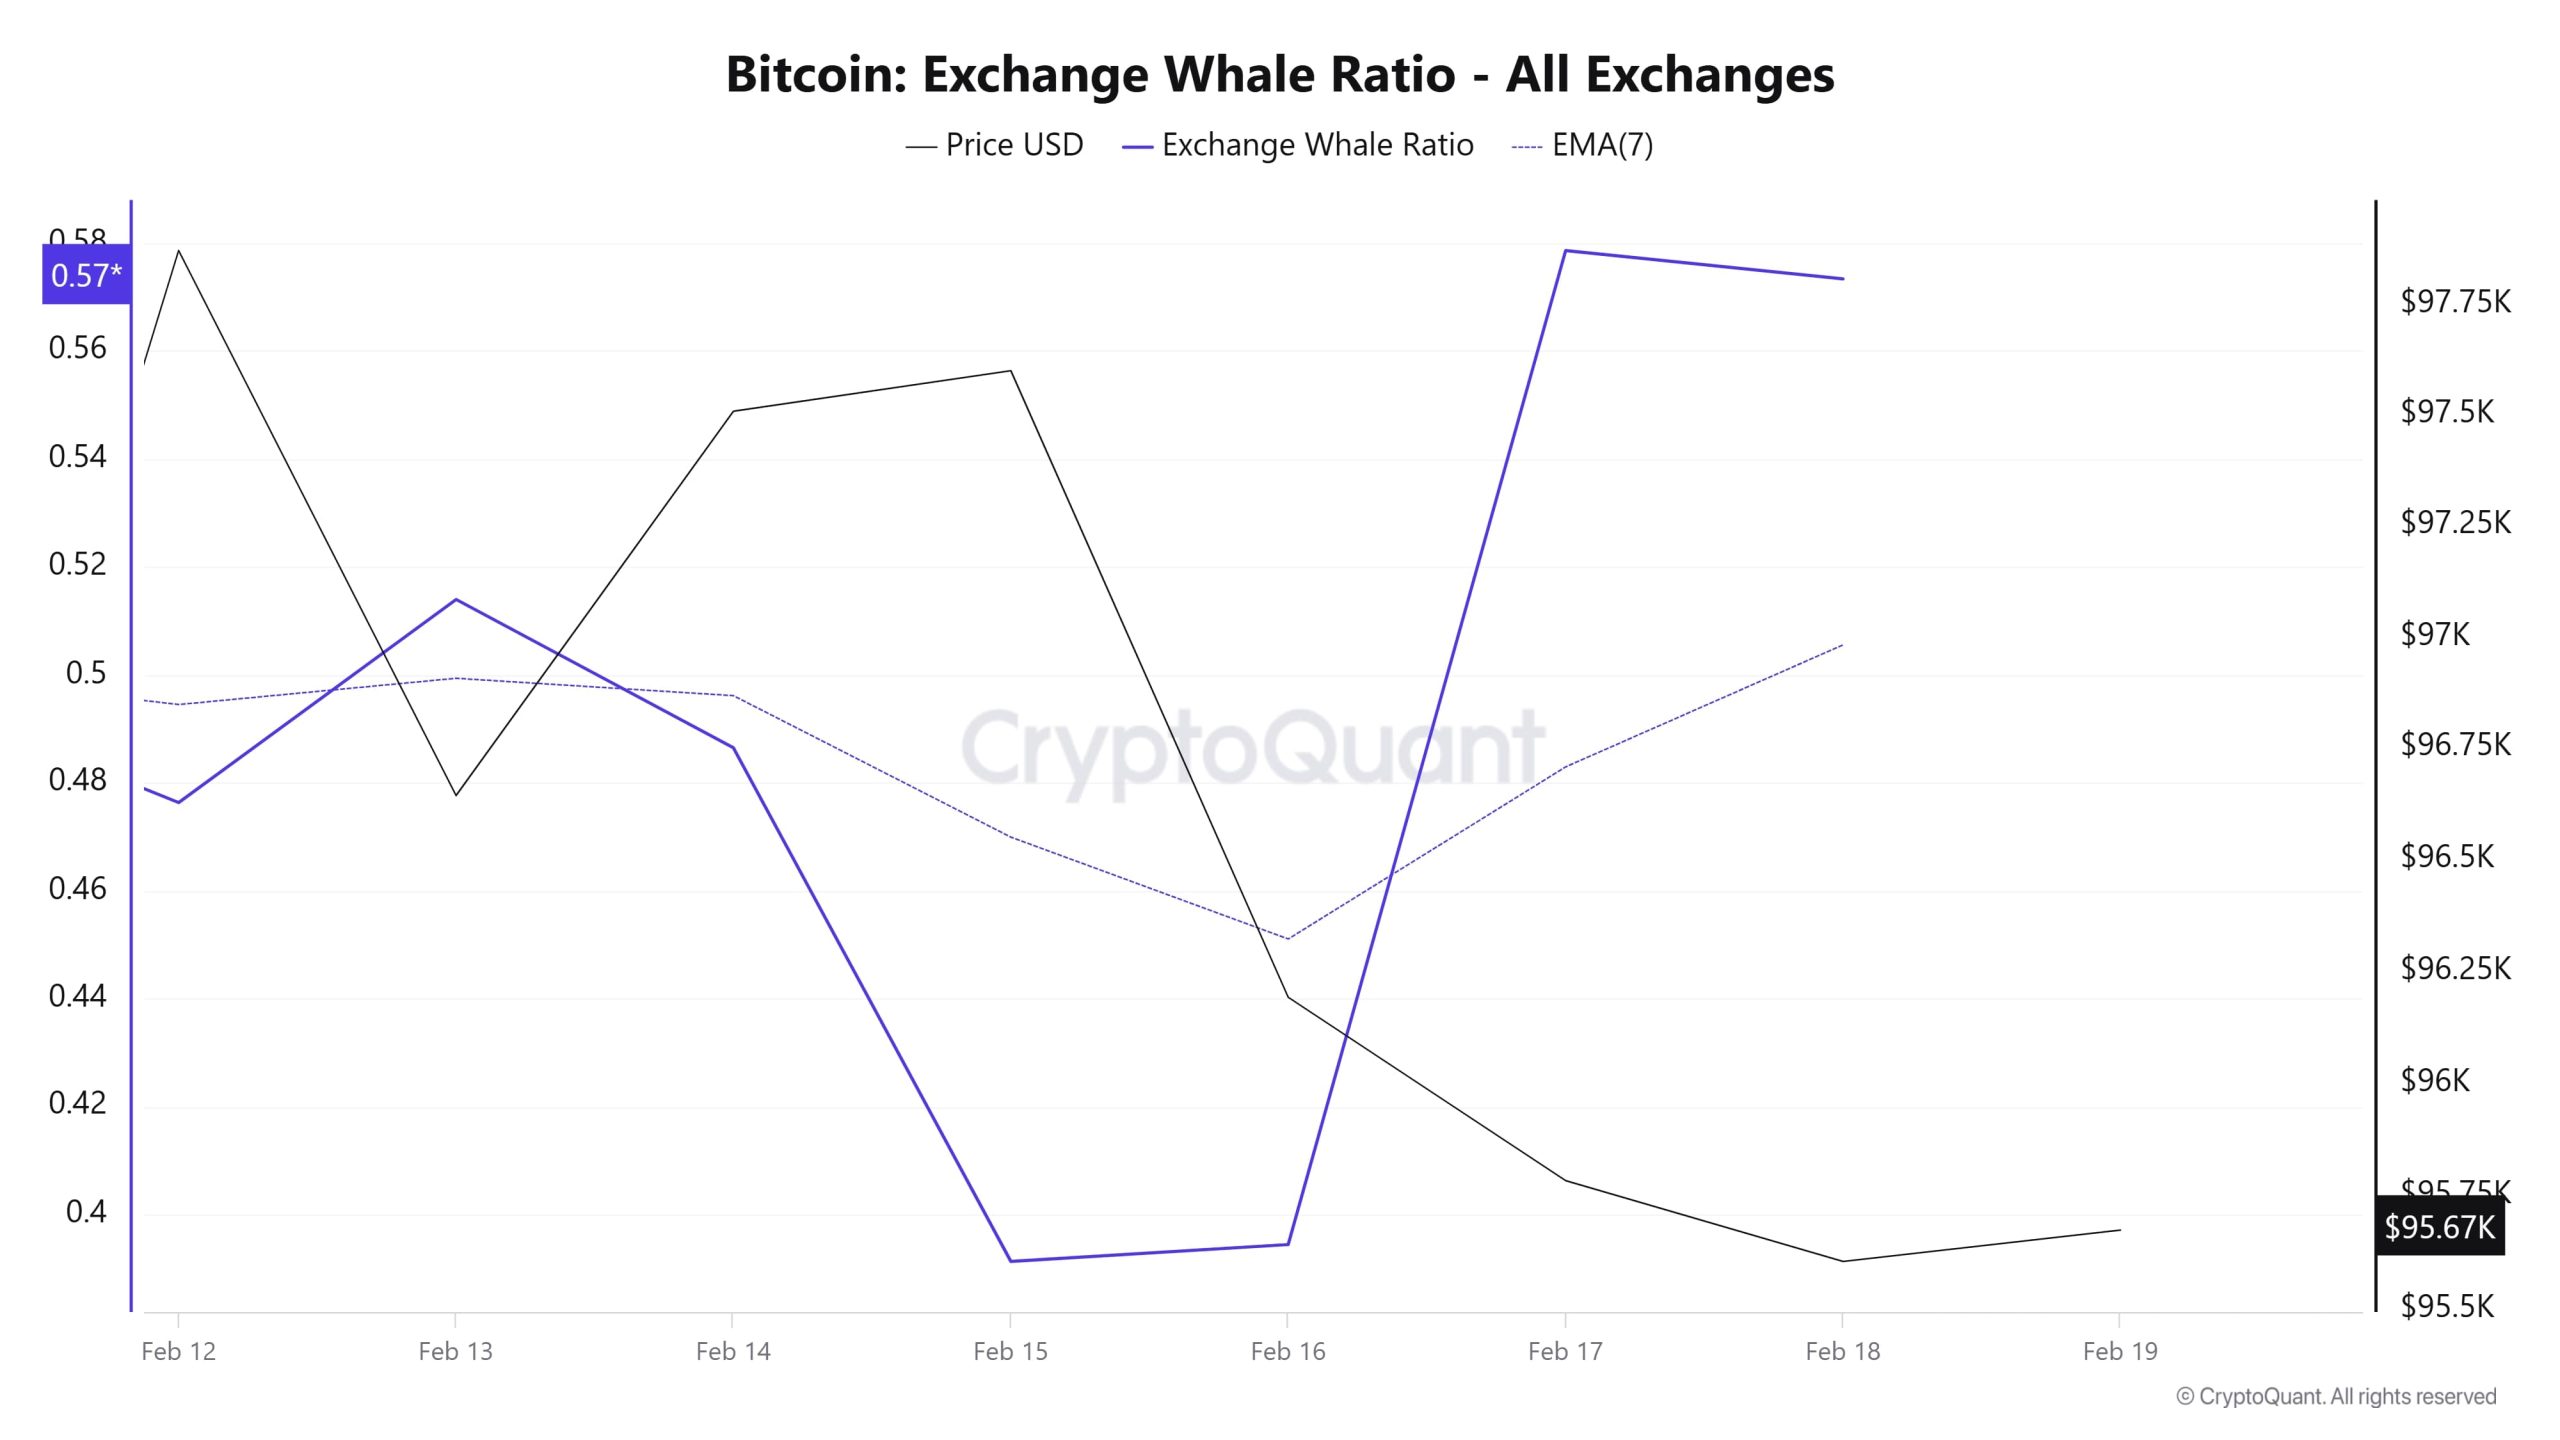
According to the data that has attracted attention in the cryptocurrency market in the last 7 days, whale activity on the central exchange displayed a low outlook in the first days. When we look at the Exchange Whale Ratio metric, it showed that whales used central exchanges less at the beginning of the 7-day period and the value was measured as 0.47. This metric reached 0.39 in the middle of the process, indicating that whales started to use the central exchange less than at the beginning of the process. At the time of writing, the value is 0.57, indicating that whales are using the central exchange more frequently. When this ratio is above 0.350, it usually means that whales use centralized exchanges frequently. At the same time, the total BTC transfer was in line with last week, with 3,932,866 BTC moving. As a result, a decisive break above $95,500 attracted additional buyers. However, the failure to breach the 98,000-level led to a new low, but Bitcoin whales signaled long-term confidence by withdrawing large amounts of BTC from exchanges.
BTC Onchain Overall
| Metric | Ascension 📈 | Decline 📉 | Neutral ➖ |
|---|---|---|---|
| Active Addresses | ✓ | ||
| Breakdowns | ✓ | ||
| Derivatives | ✓ | ||
| Supply Distribution | ✓ | ||
| Exchange Reserve | ✓ | ||
| Fees and Revenues | ✓ | ||
| Miner Flows | ✓ | ||
| Transaction | ✓ | ||
| Whale Activities | ✓ |
LEGAL NOTICE
The investment information, comments and recommendations contained in this document do not constitute investment advisory services. Investment advisory services are provided by authorized institutions on a personal basis, taking into account the risk and return preferences of individuals. The comments and recommendations contained in this document are of a general type. These recommendations may not be suitable for your financial situation and risk and return preferences. Therefore, making an investment decision based solely on the information contained in this document may not result in results that are in line with your expectations.
NOTE: All data used in Bitcoin onchain analysis is based on Cryptoqaunt.
