
Weekly Bitcoin Onchain Report – September 10
Active Addresses
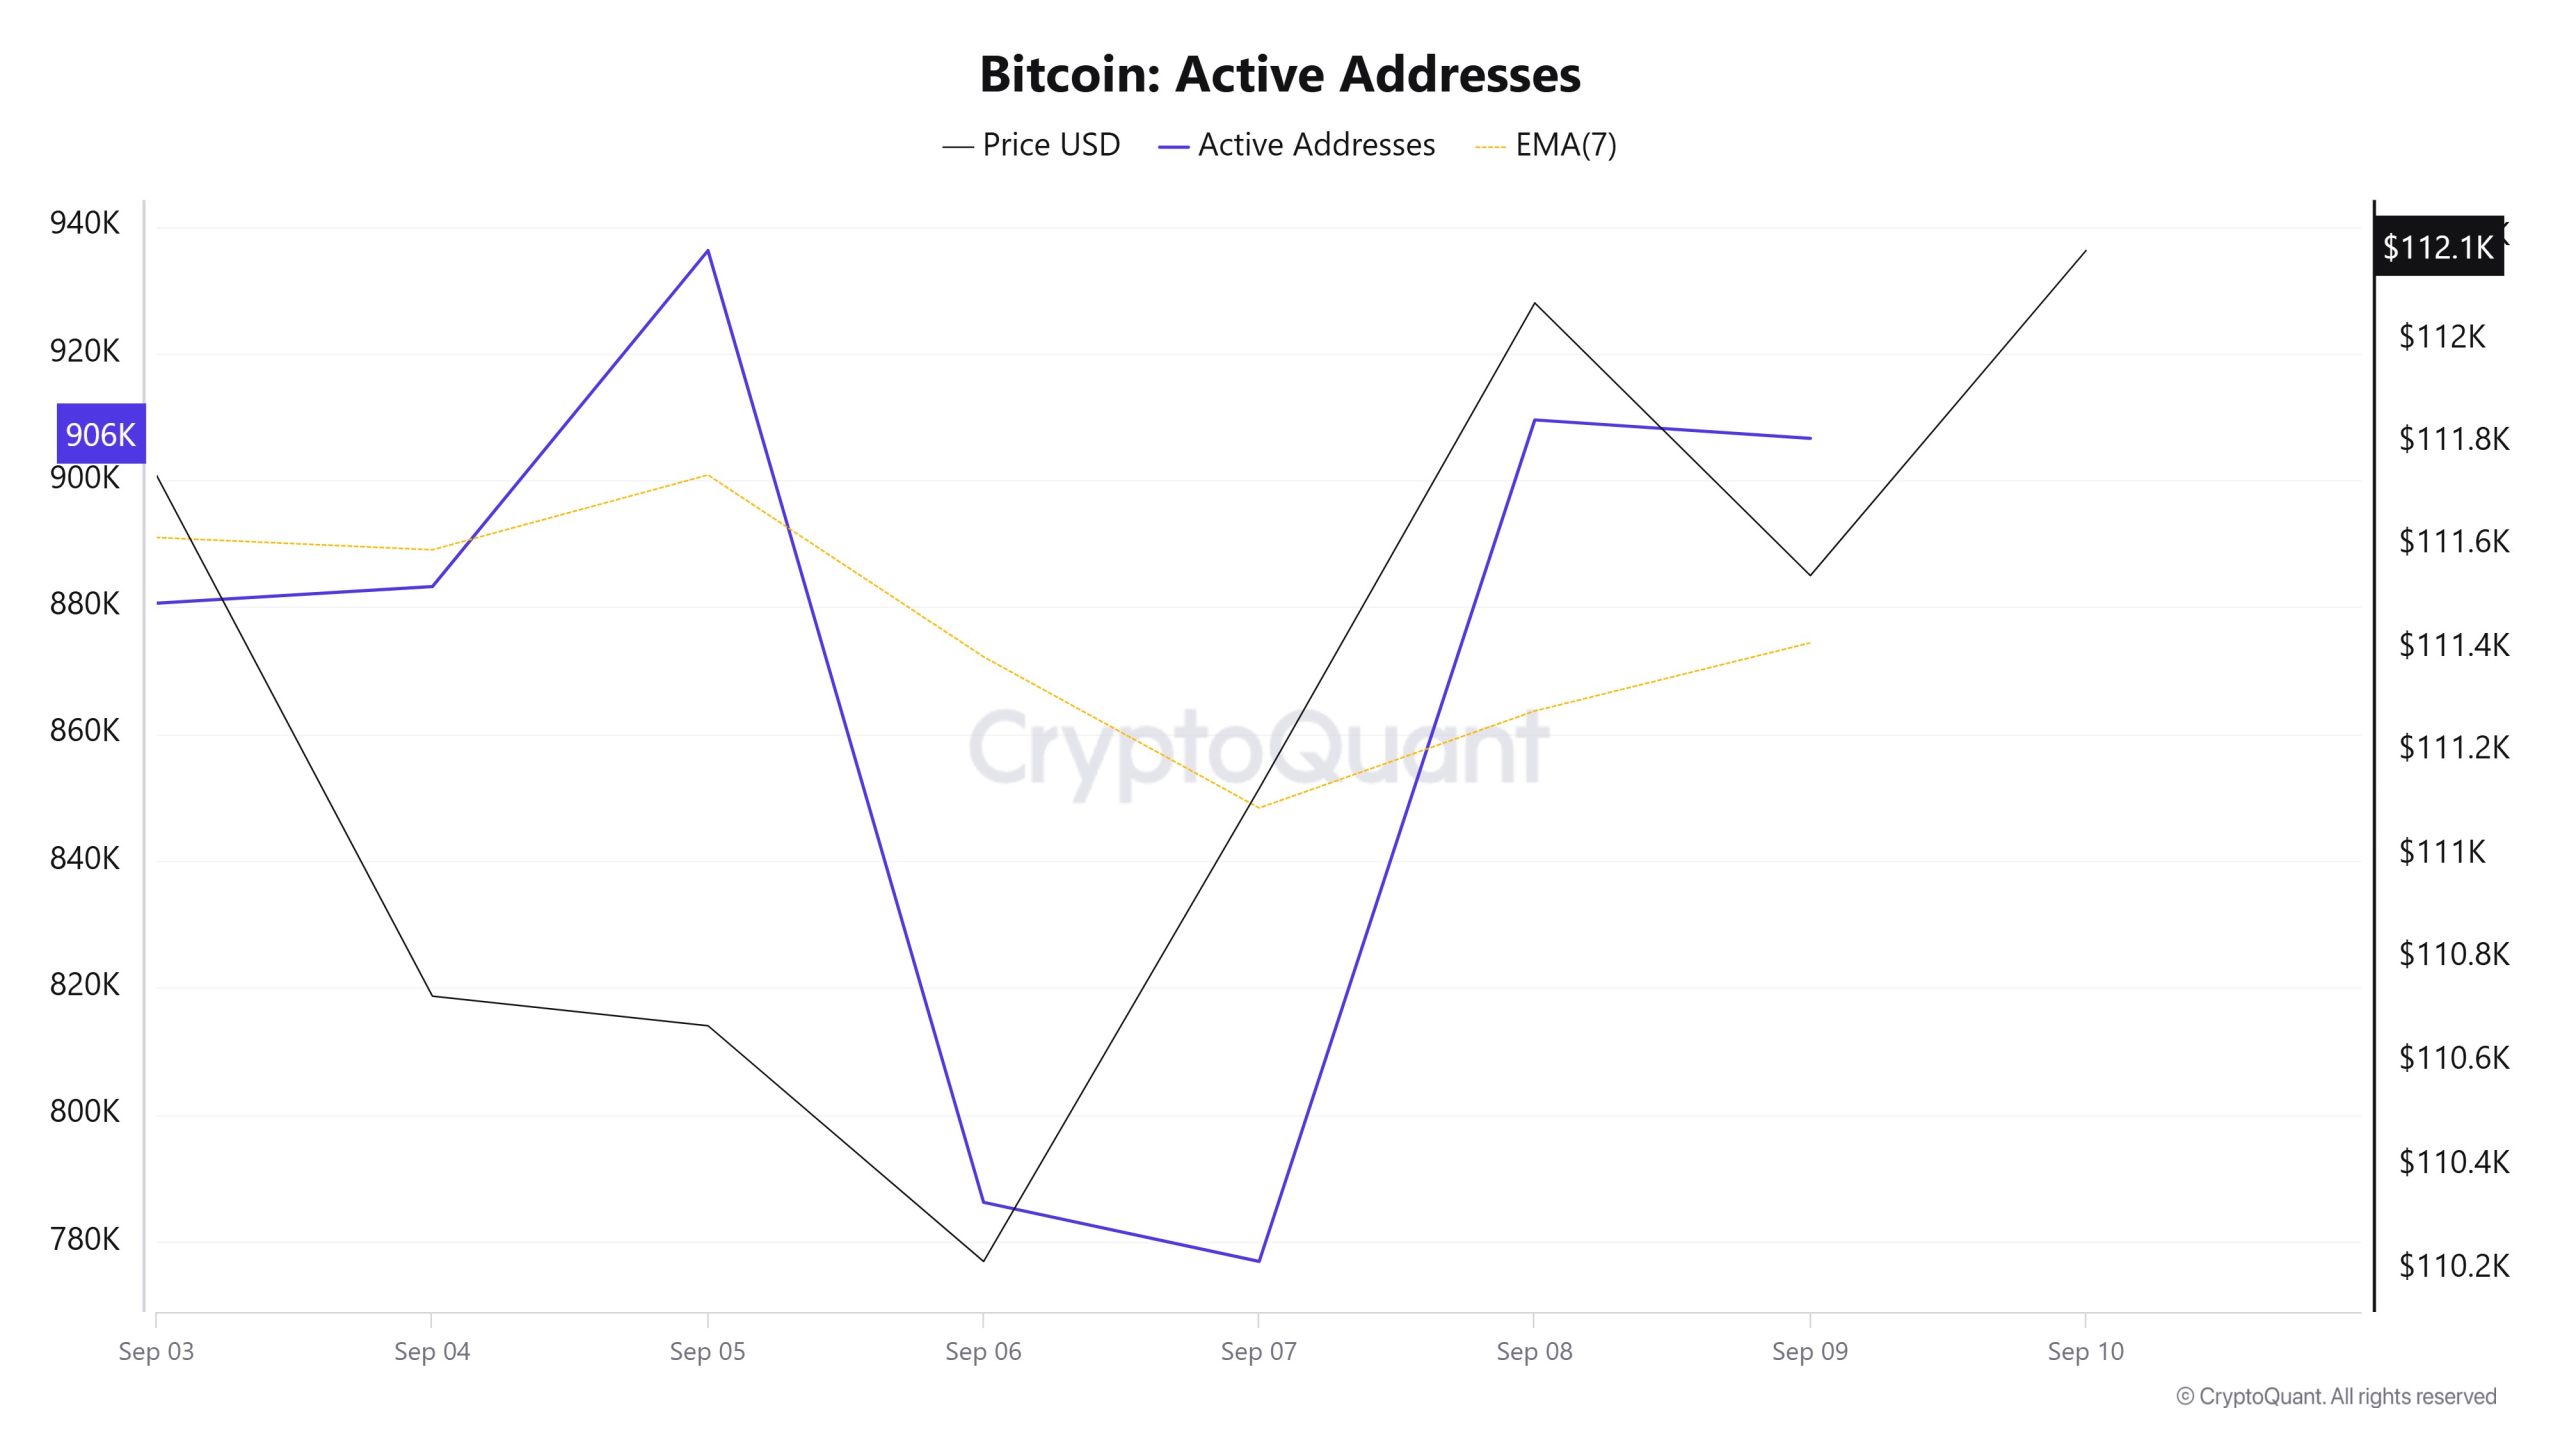
Between September 3 and September 10, 936,229 active addresses entered the Bitcoin network. In this process, the Bitcoin price dropped to the level of 110,000 dollars. The decline in the number of active addresses, especially on September 6, was observed to move the price downwards towards $110,000, while Bitcoin went to $112,000 on September 7 as the number of active addresses increased. From a technical point of view, it is noteworthy that the 7-day simple moving average (SMA) crossed the price on September 6. This technical signal indicates a sell-off on the market.
Active Sending Addresses
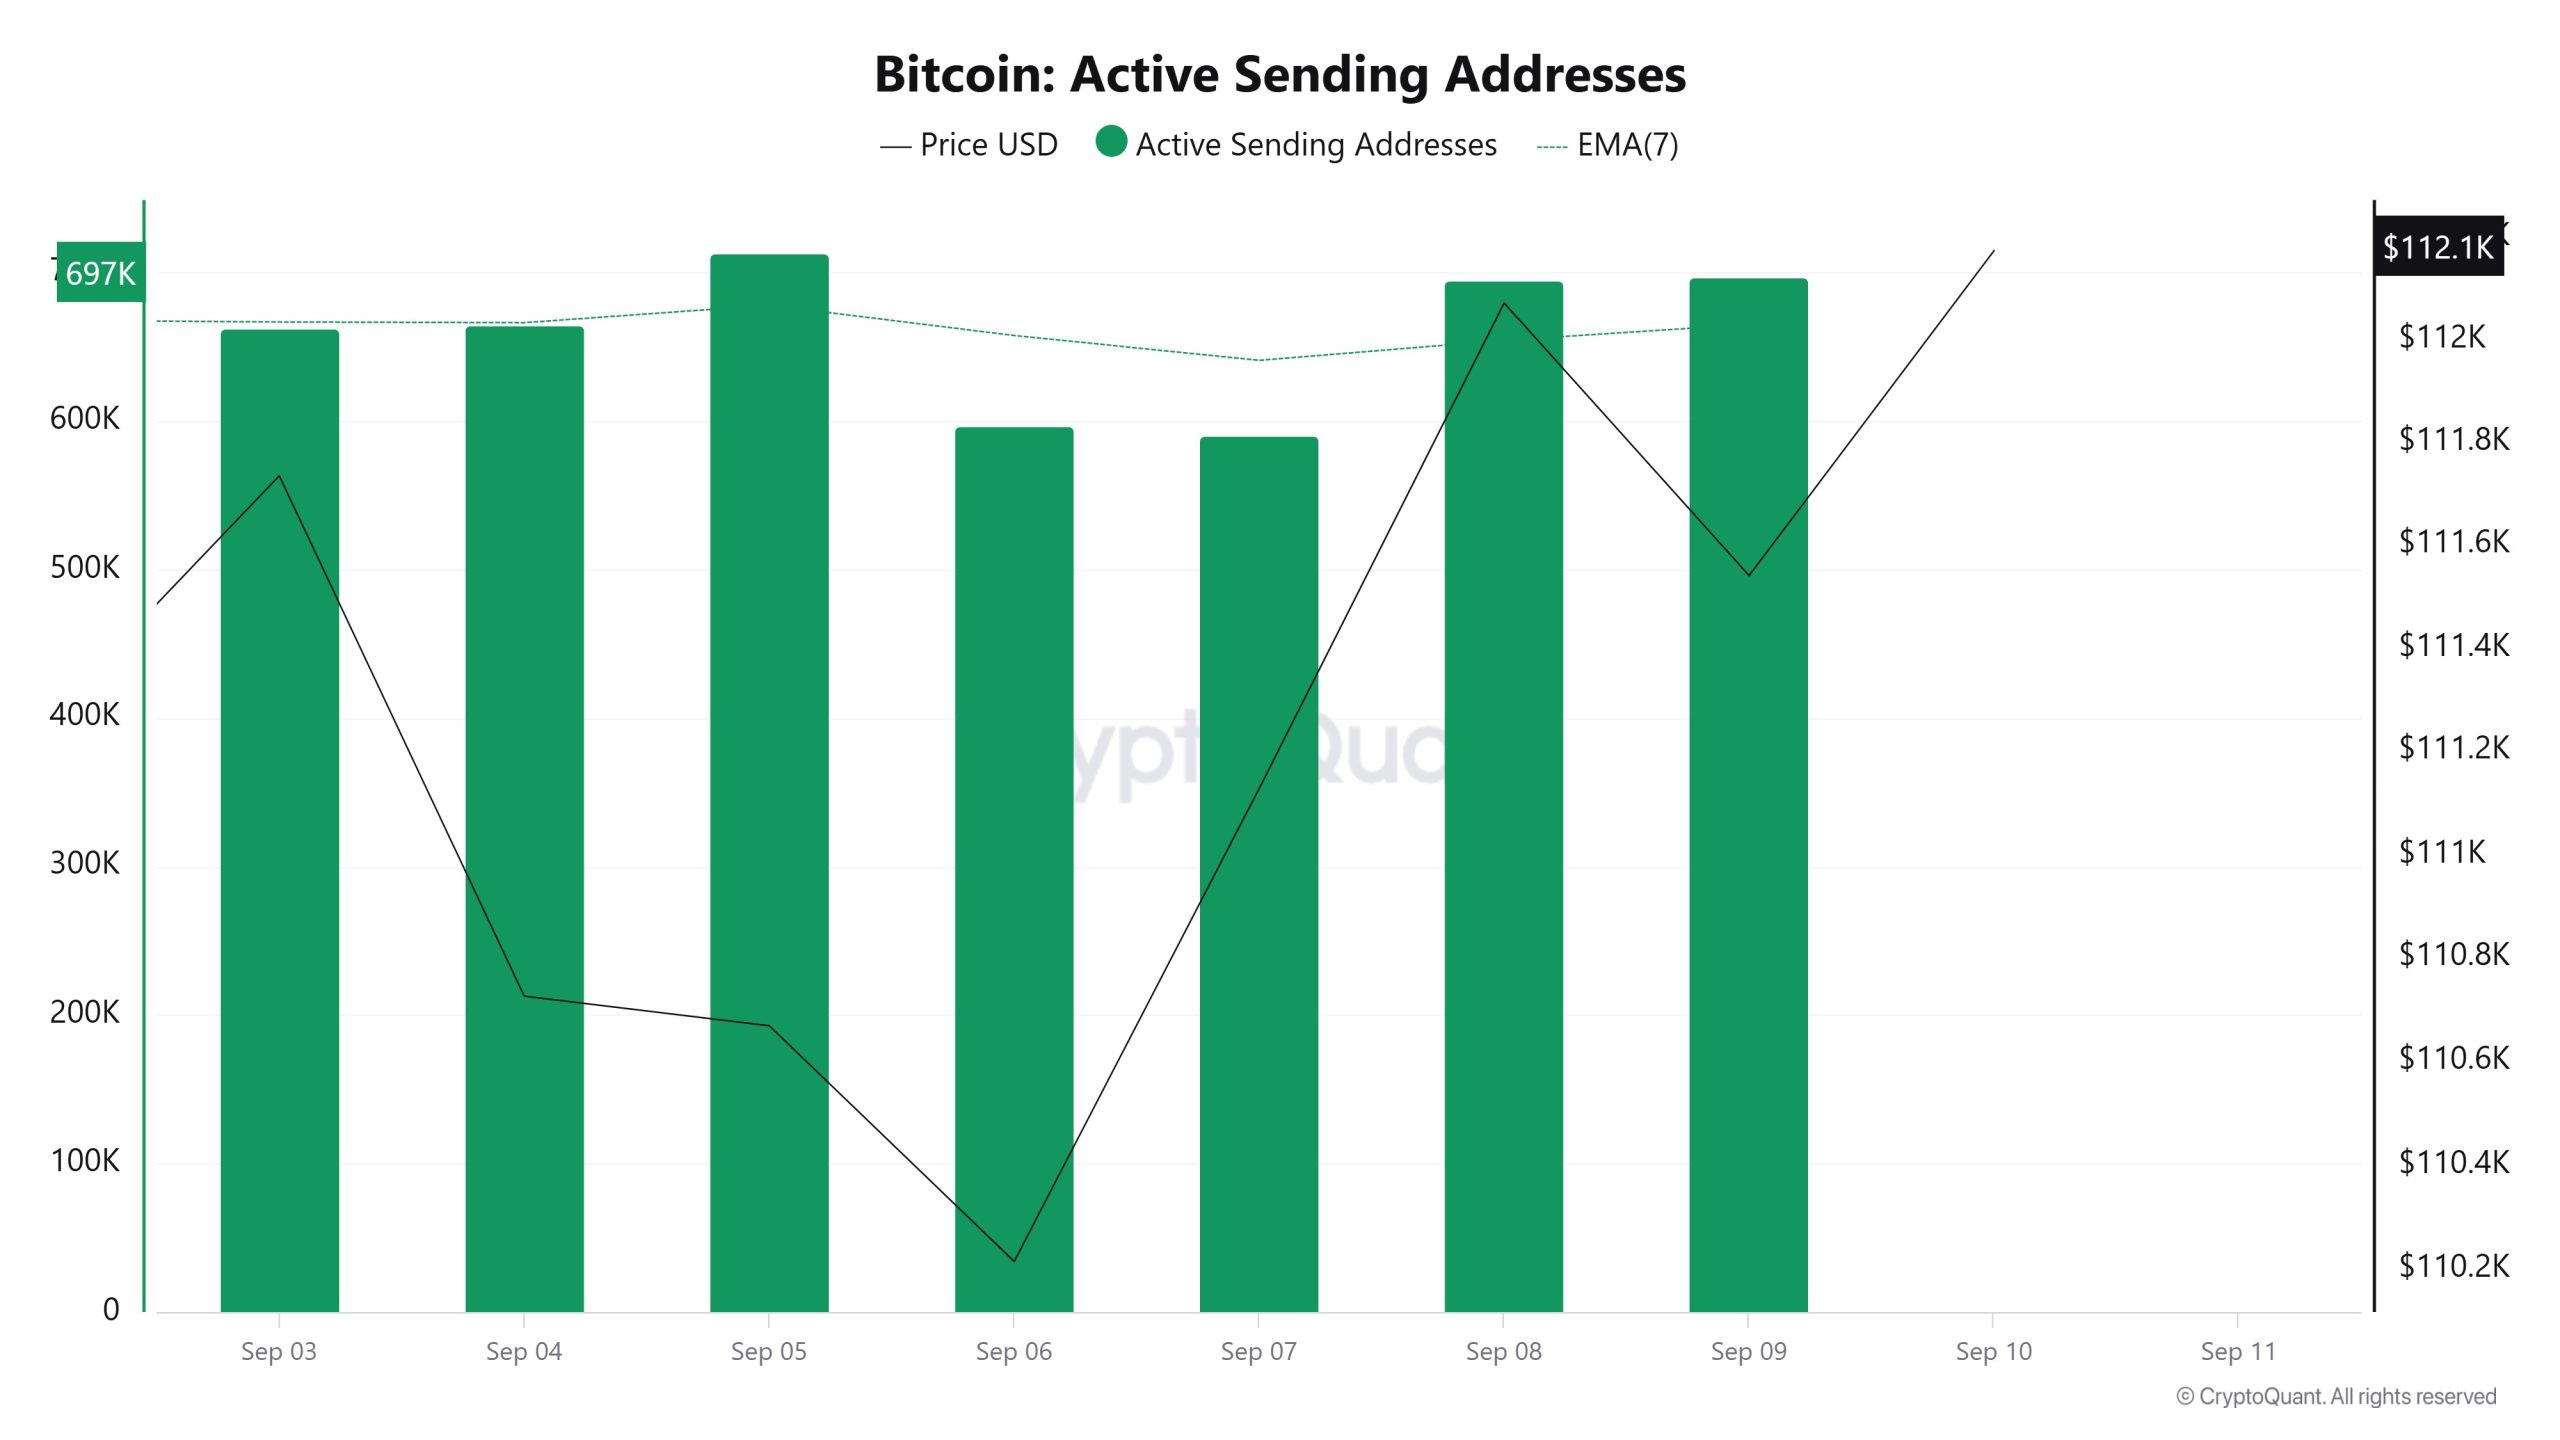
Between September 3 and September 10, there was an upward trend in the “Active Sending Addresses” metric. On the day of the price high, this metric stood at 713,317, indicating that user activity on the Bitcoin network has moved in tandem with the price. This data suggests that the $110,000 level is supported on a bearish basis, not only in terms of price, but also in terms of on-chain address activity. Overall, the Active Sending Addresses metric followed a downward trend during this period.
Active Receiving Addresses
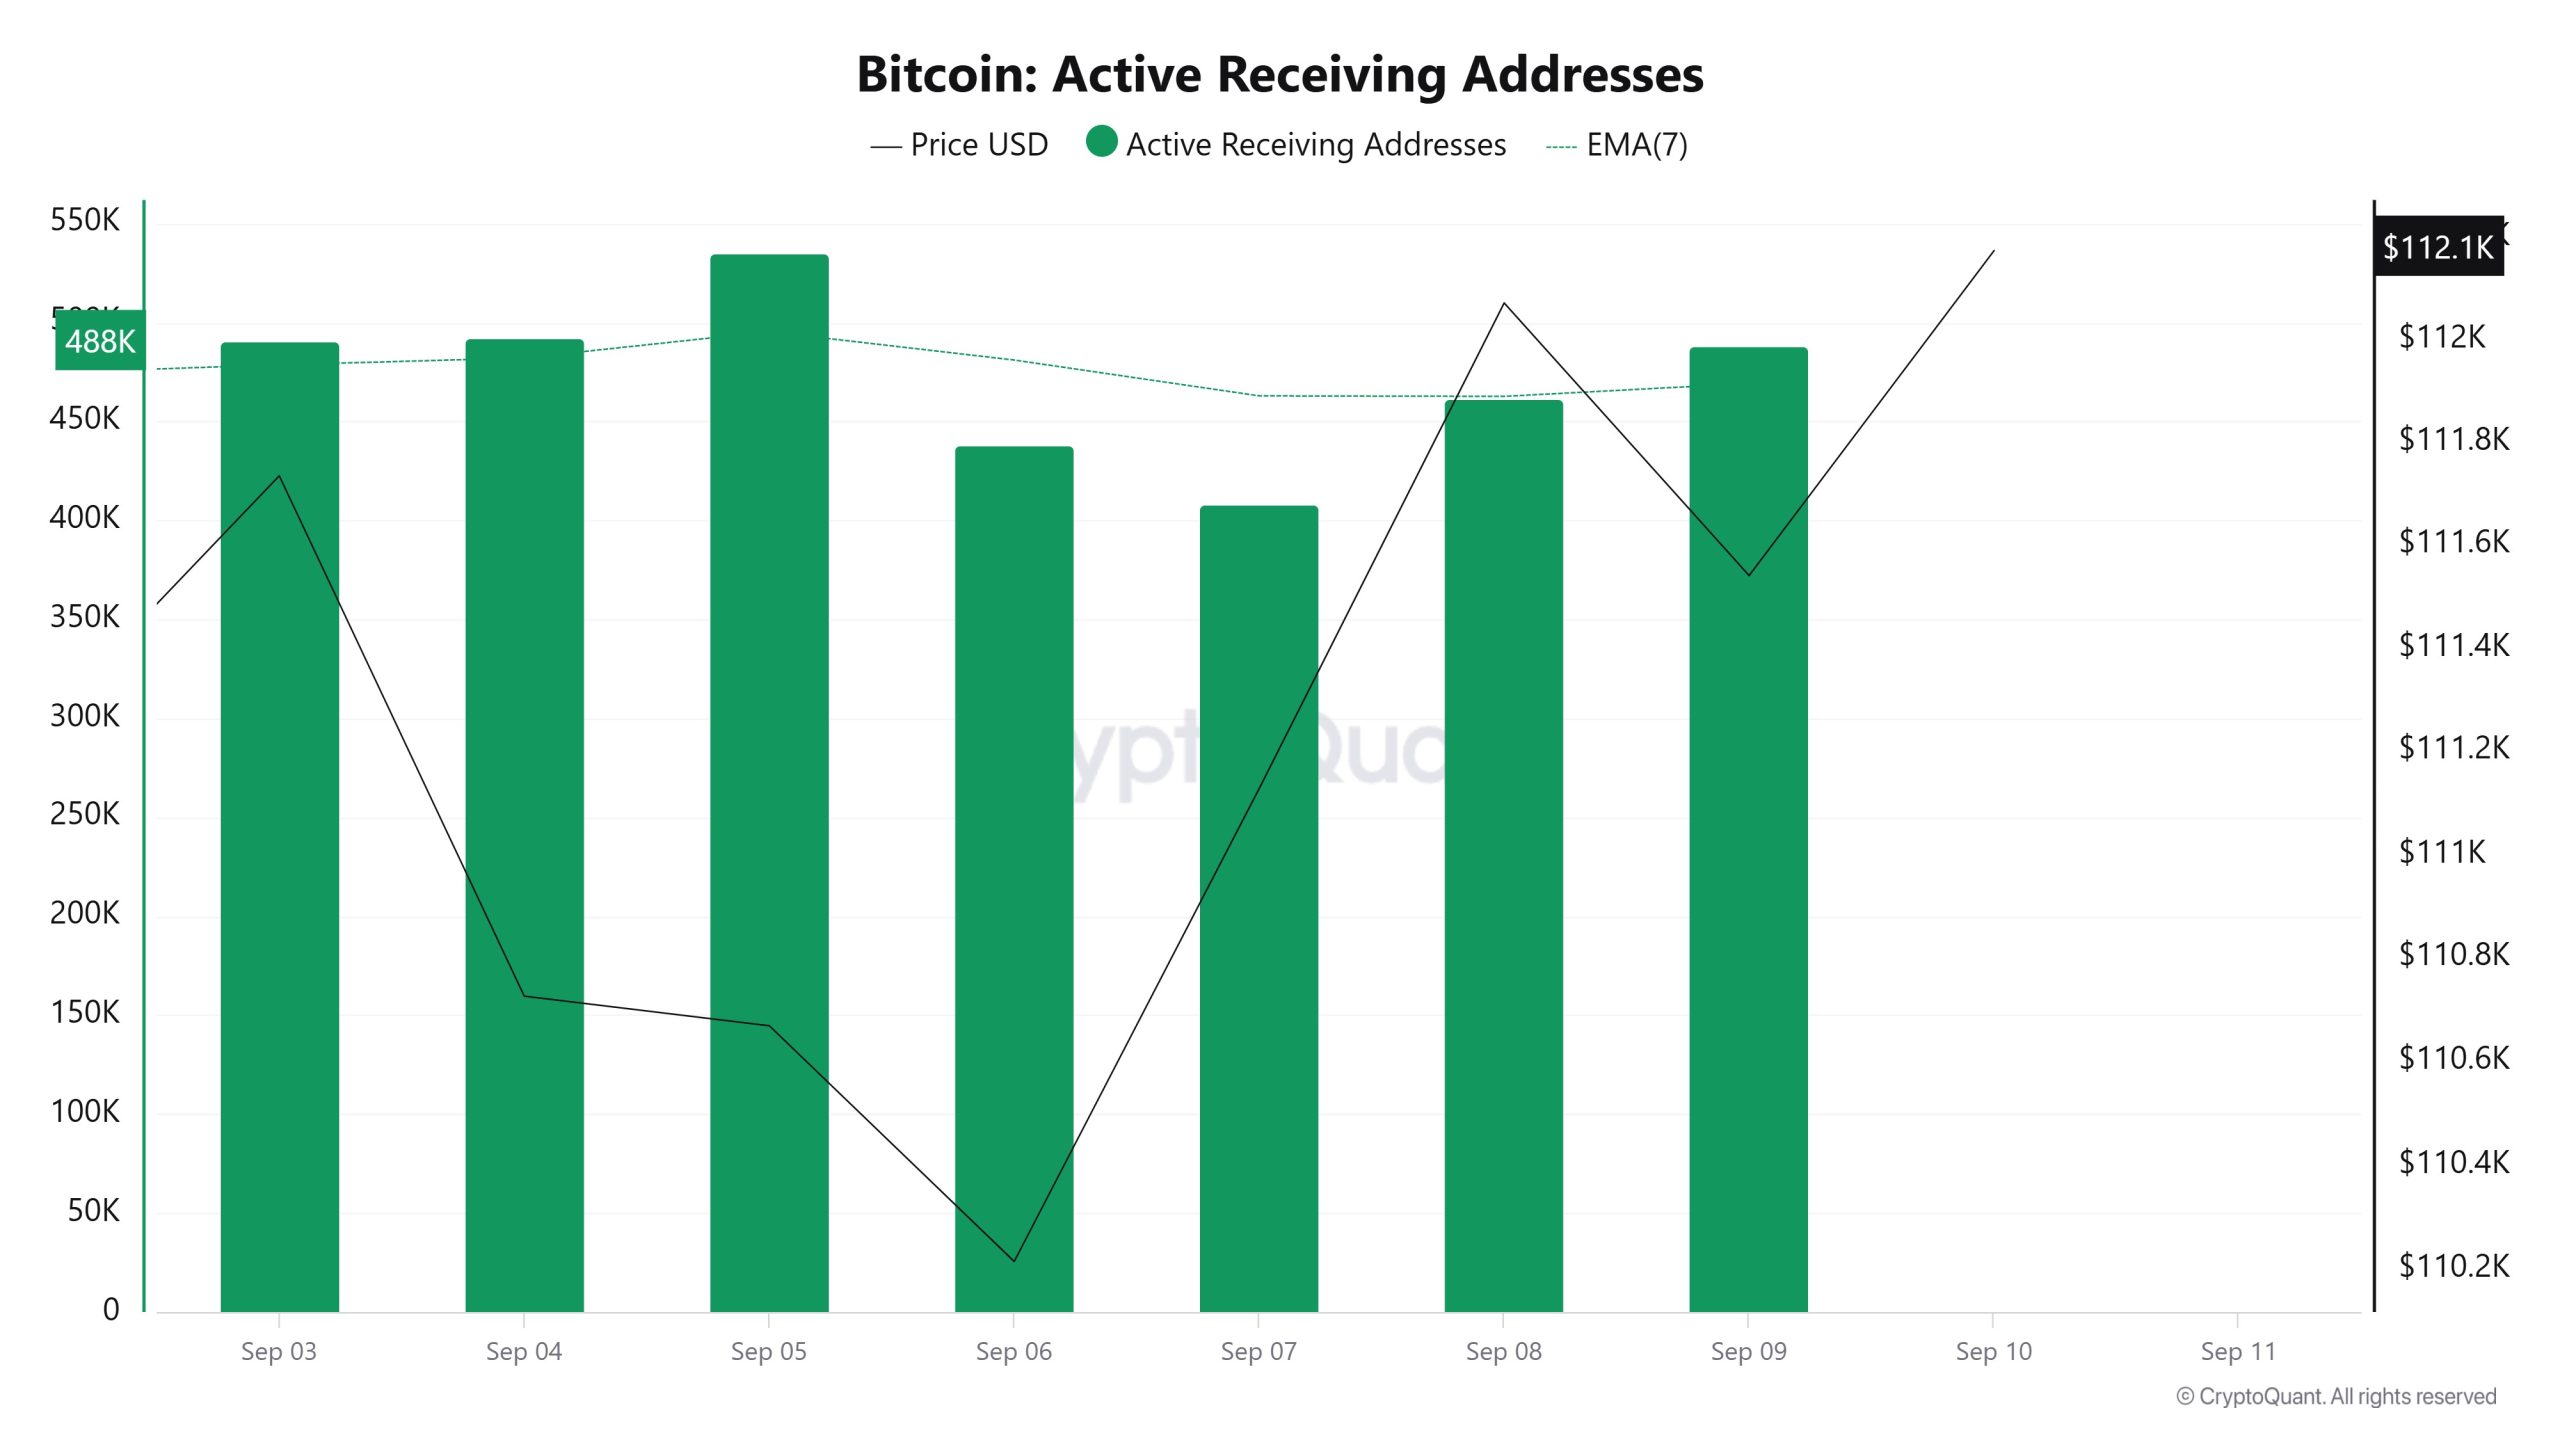
Between September 3 and September 10, there was a regular decline in active buy addresses with the Black Line (price line). On the day the price reached its low, active buying addresses dropped to 438,026, indicating that sellers were selling Bitcoin at $110,000.
Breakdowns
MRVR
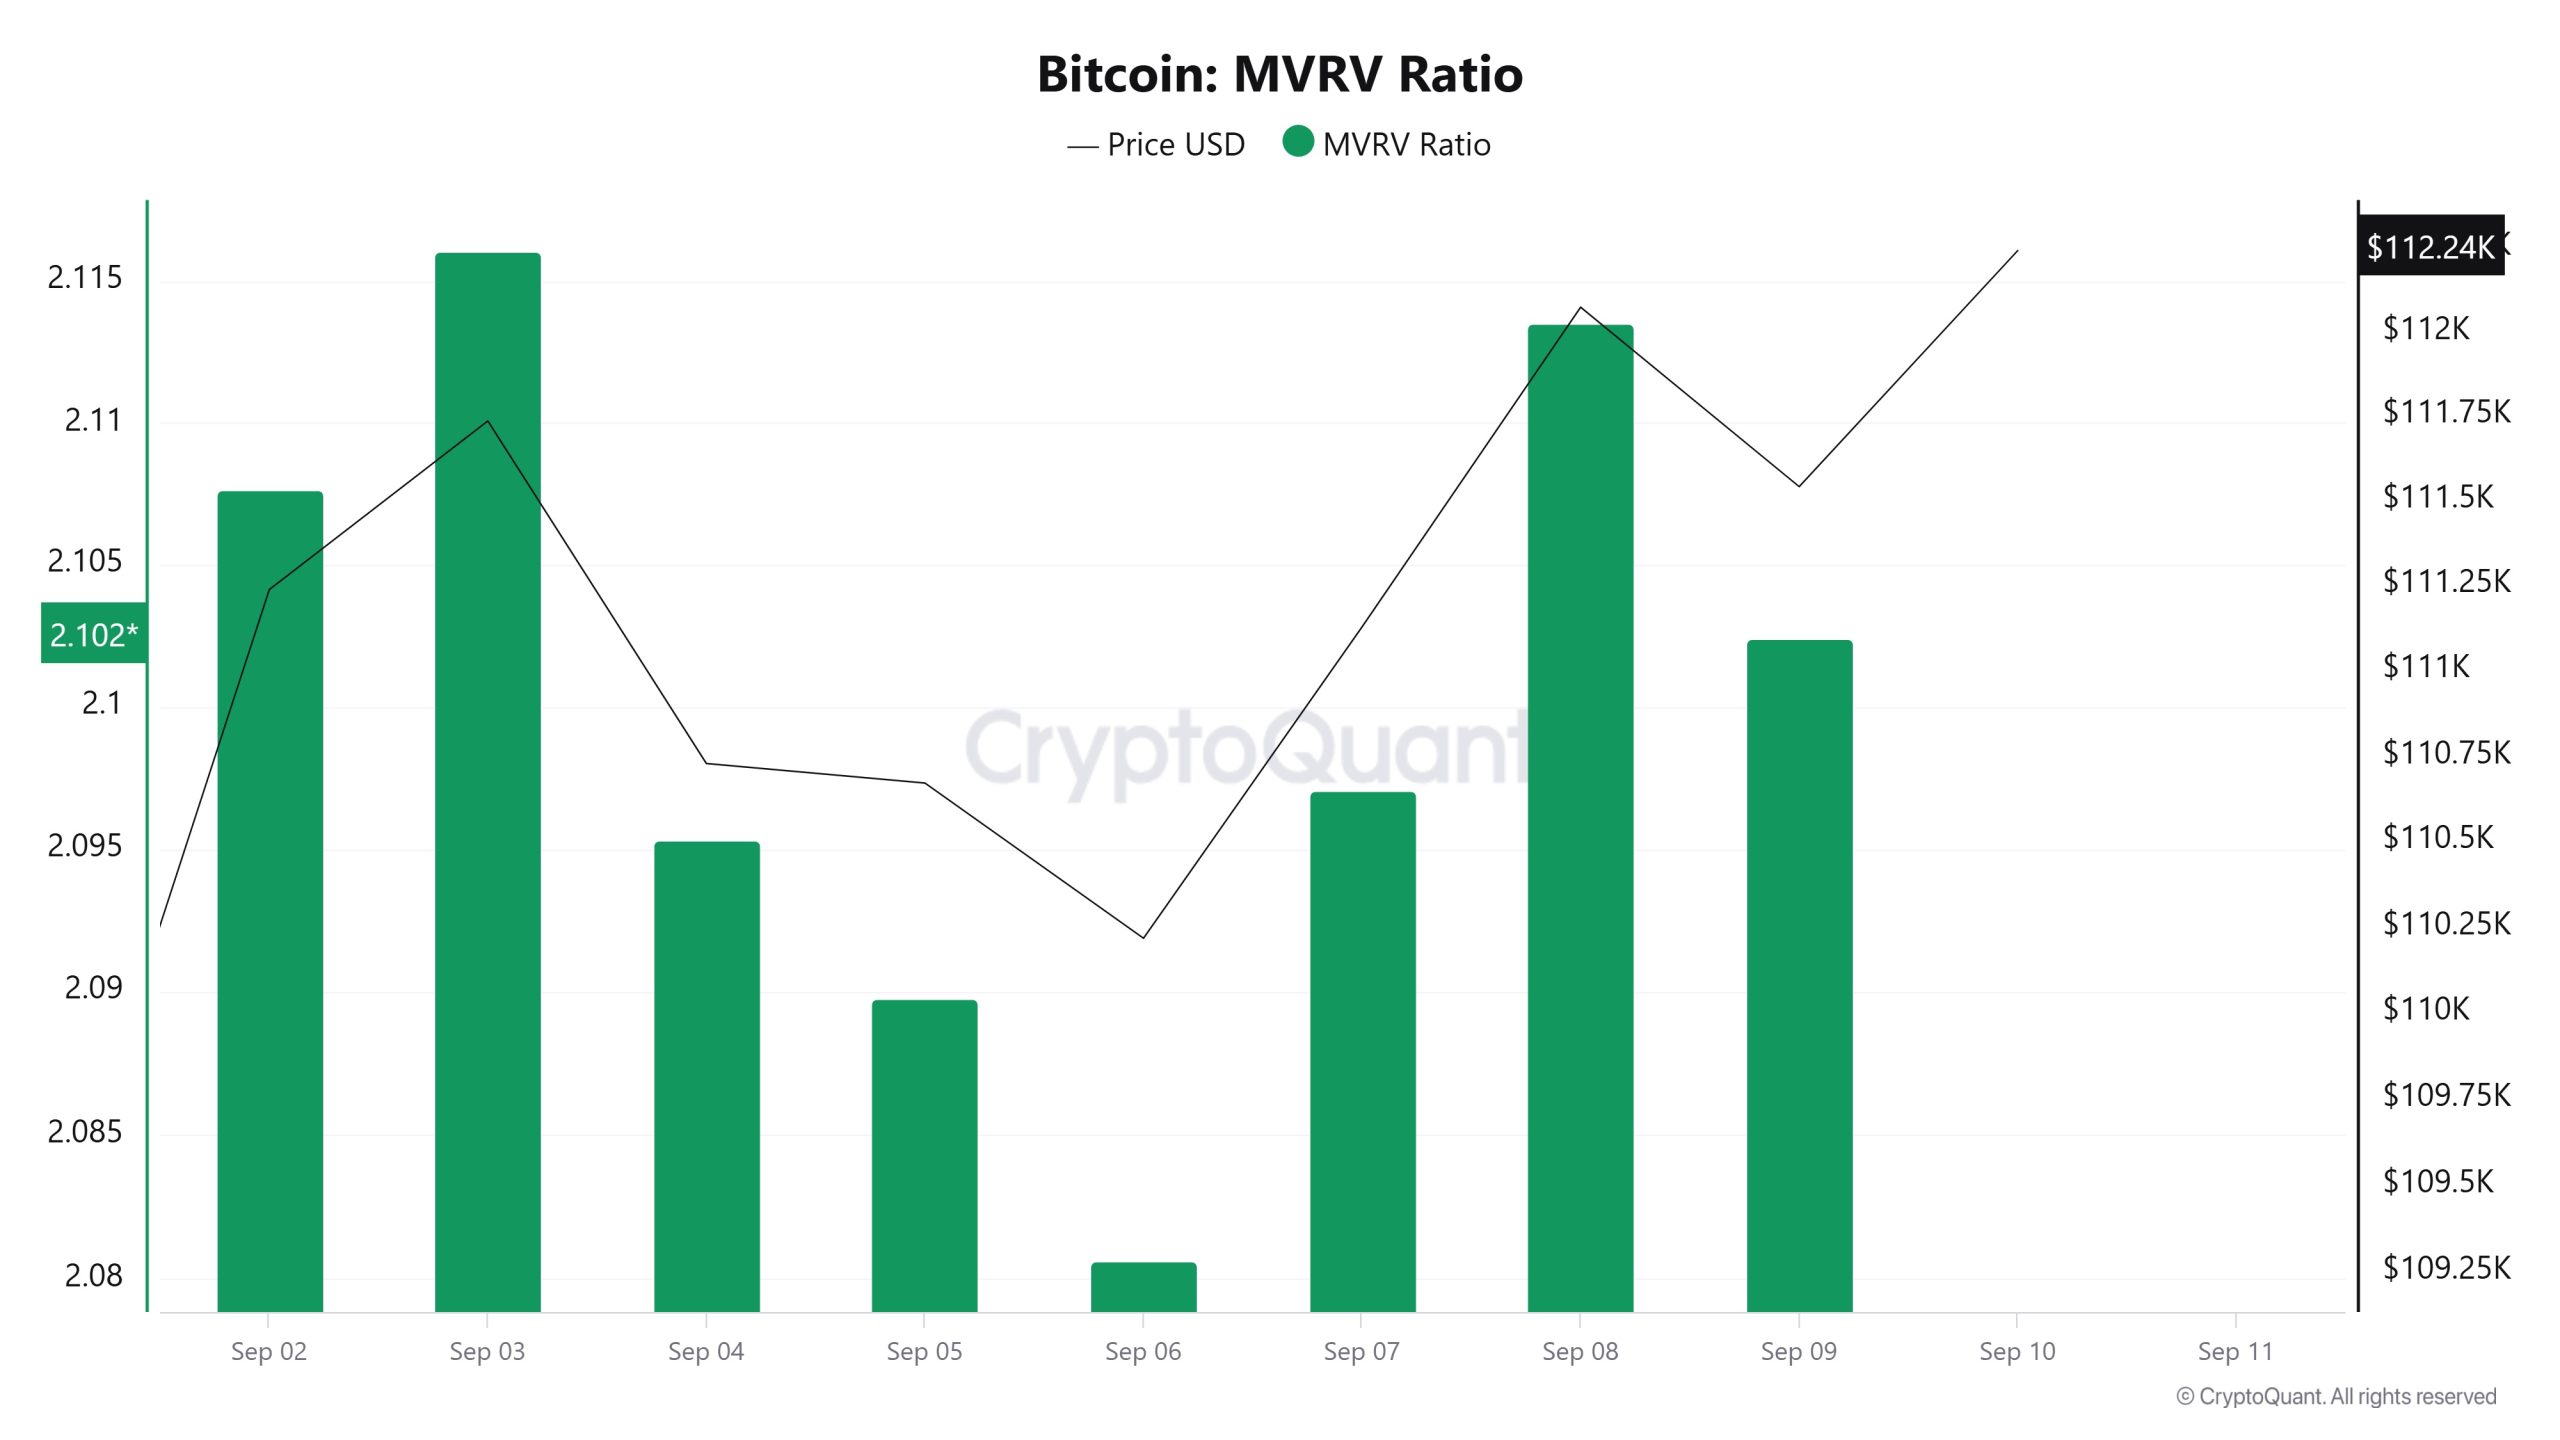
On September 3, the Bitcoin price was at $111,735 while the MVRV Ratio was 2.116. As of September 9, the Bitcoin price fell 0.17% to $111,541, while the MVRV Ratio fell 0.66% to 2,102.
Realized Price
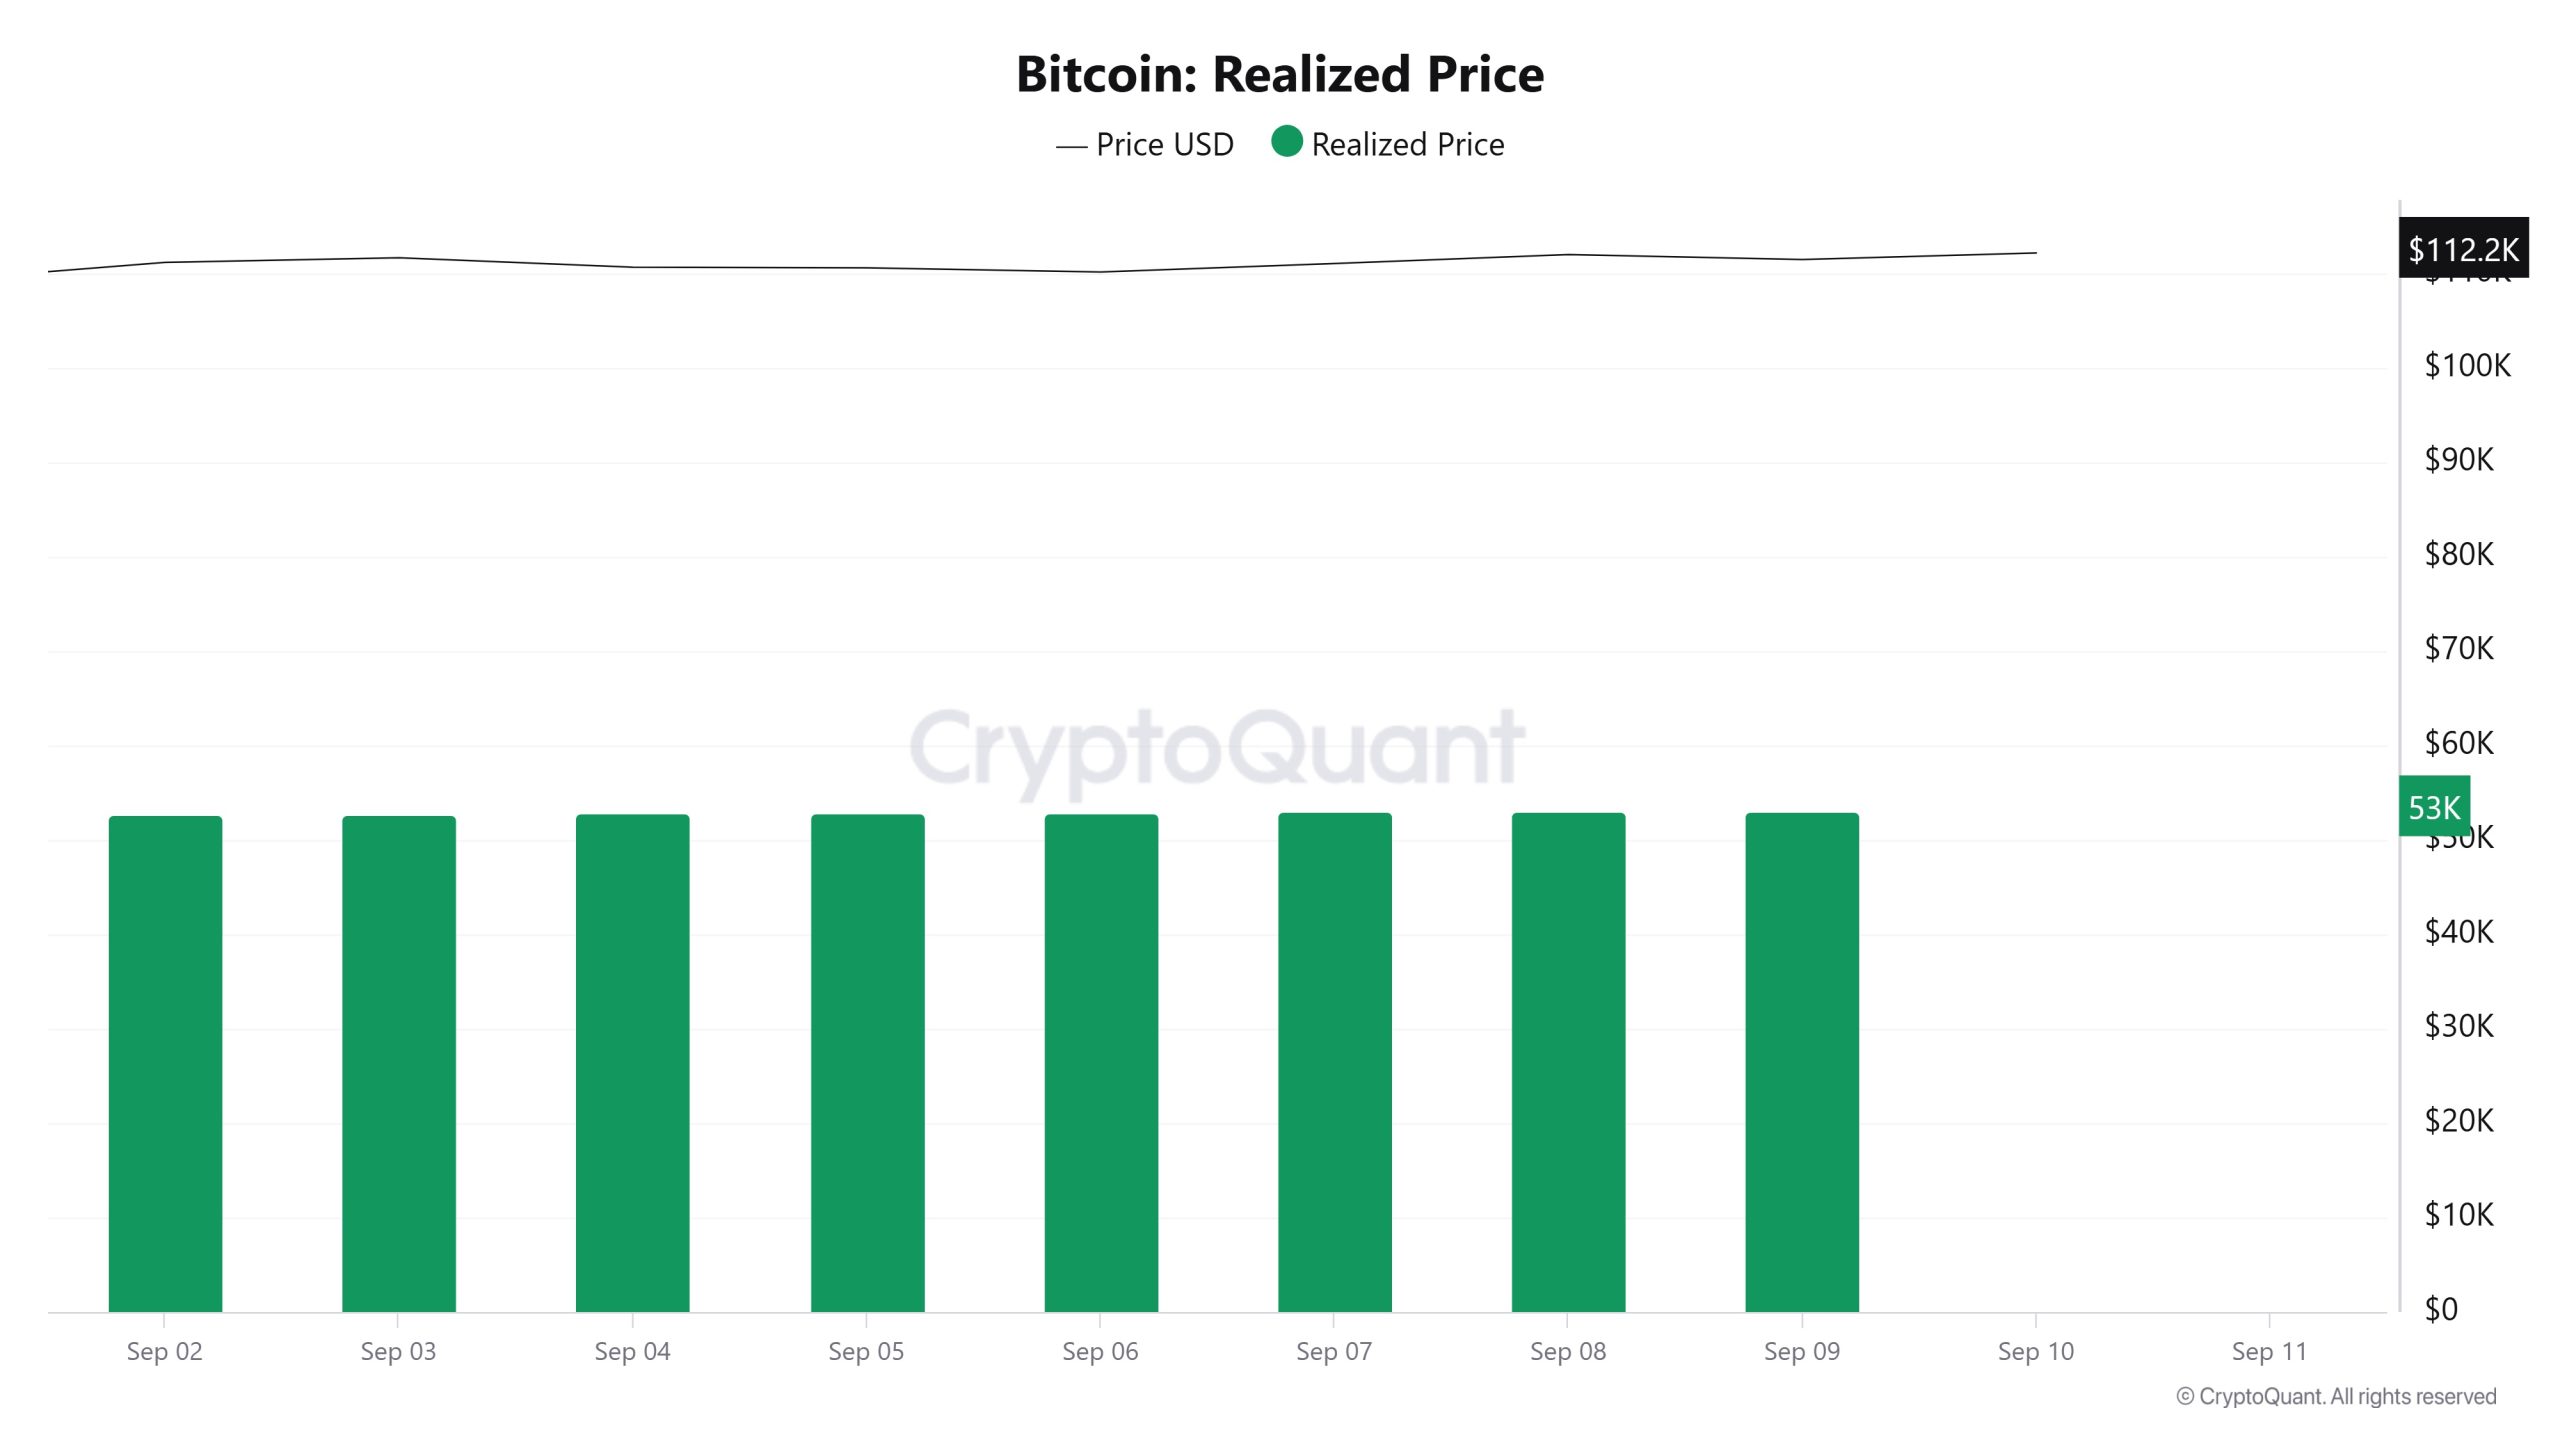
On September 3, the Bitcoin price was at $111,735 while the Realized Price was 52,803.
As of September 9, the Bitcoin price fell 0.17% to $111,541, while the Realized Price rose 0.47% to 53,054.
Spent Output Profit Ratio (SOPR)
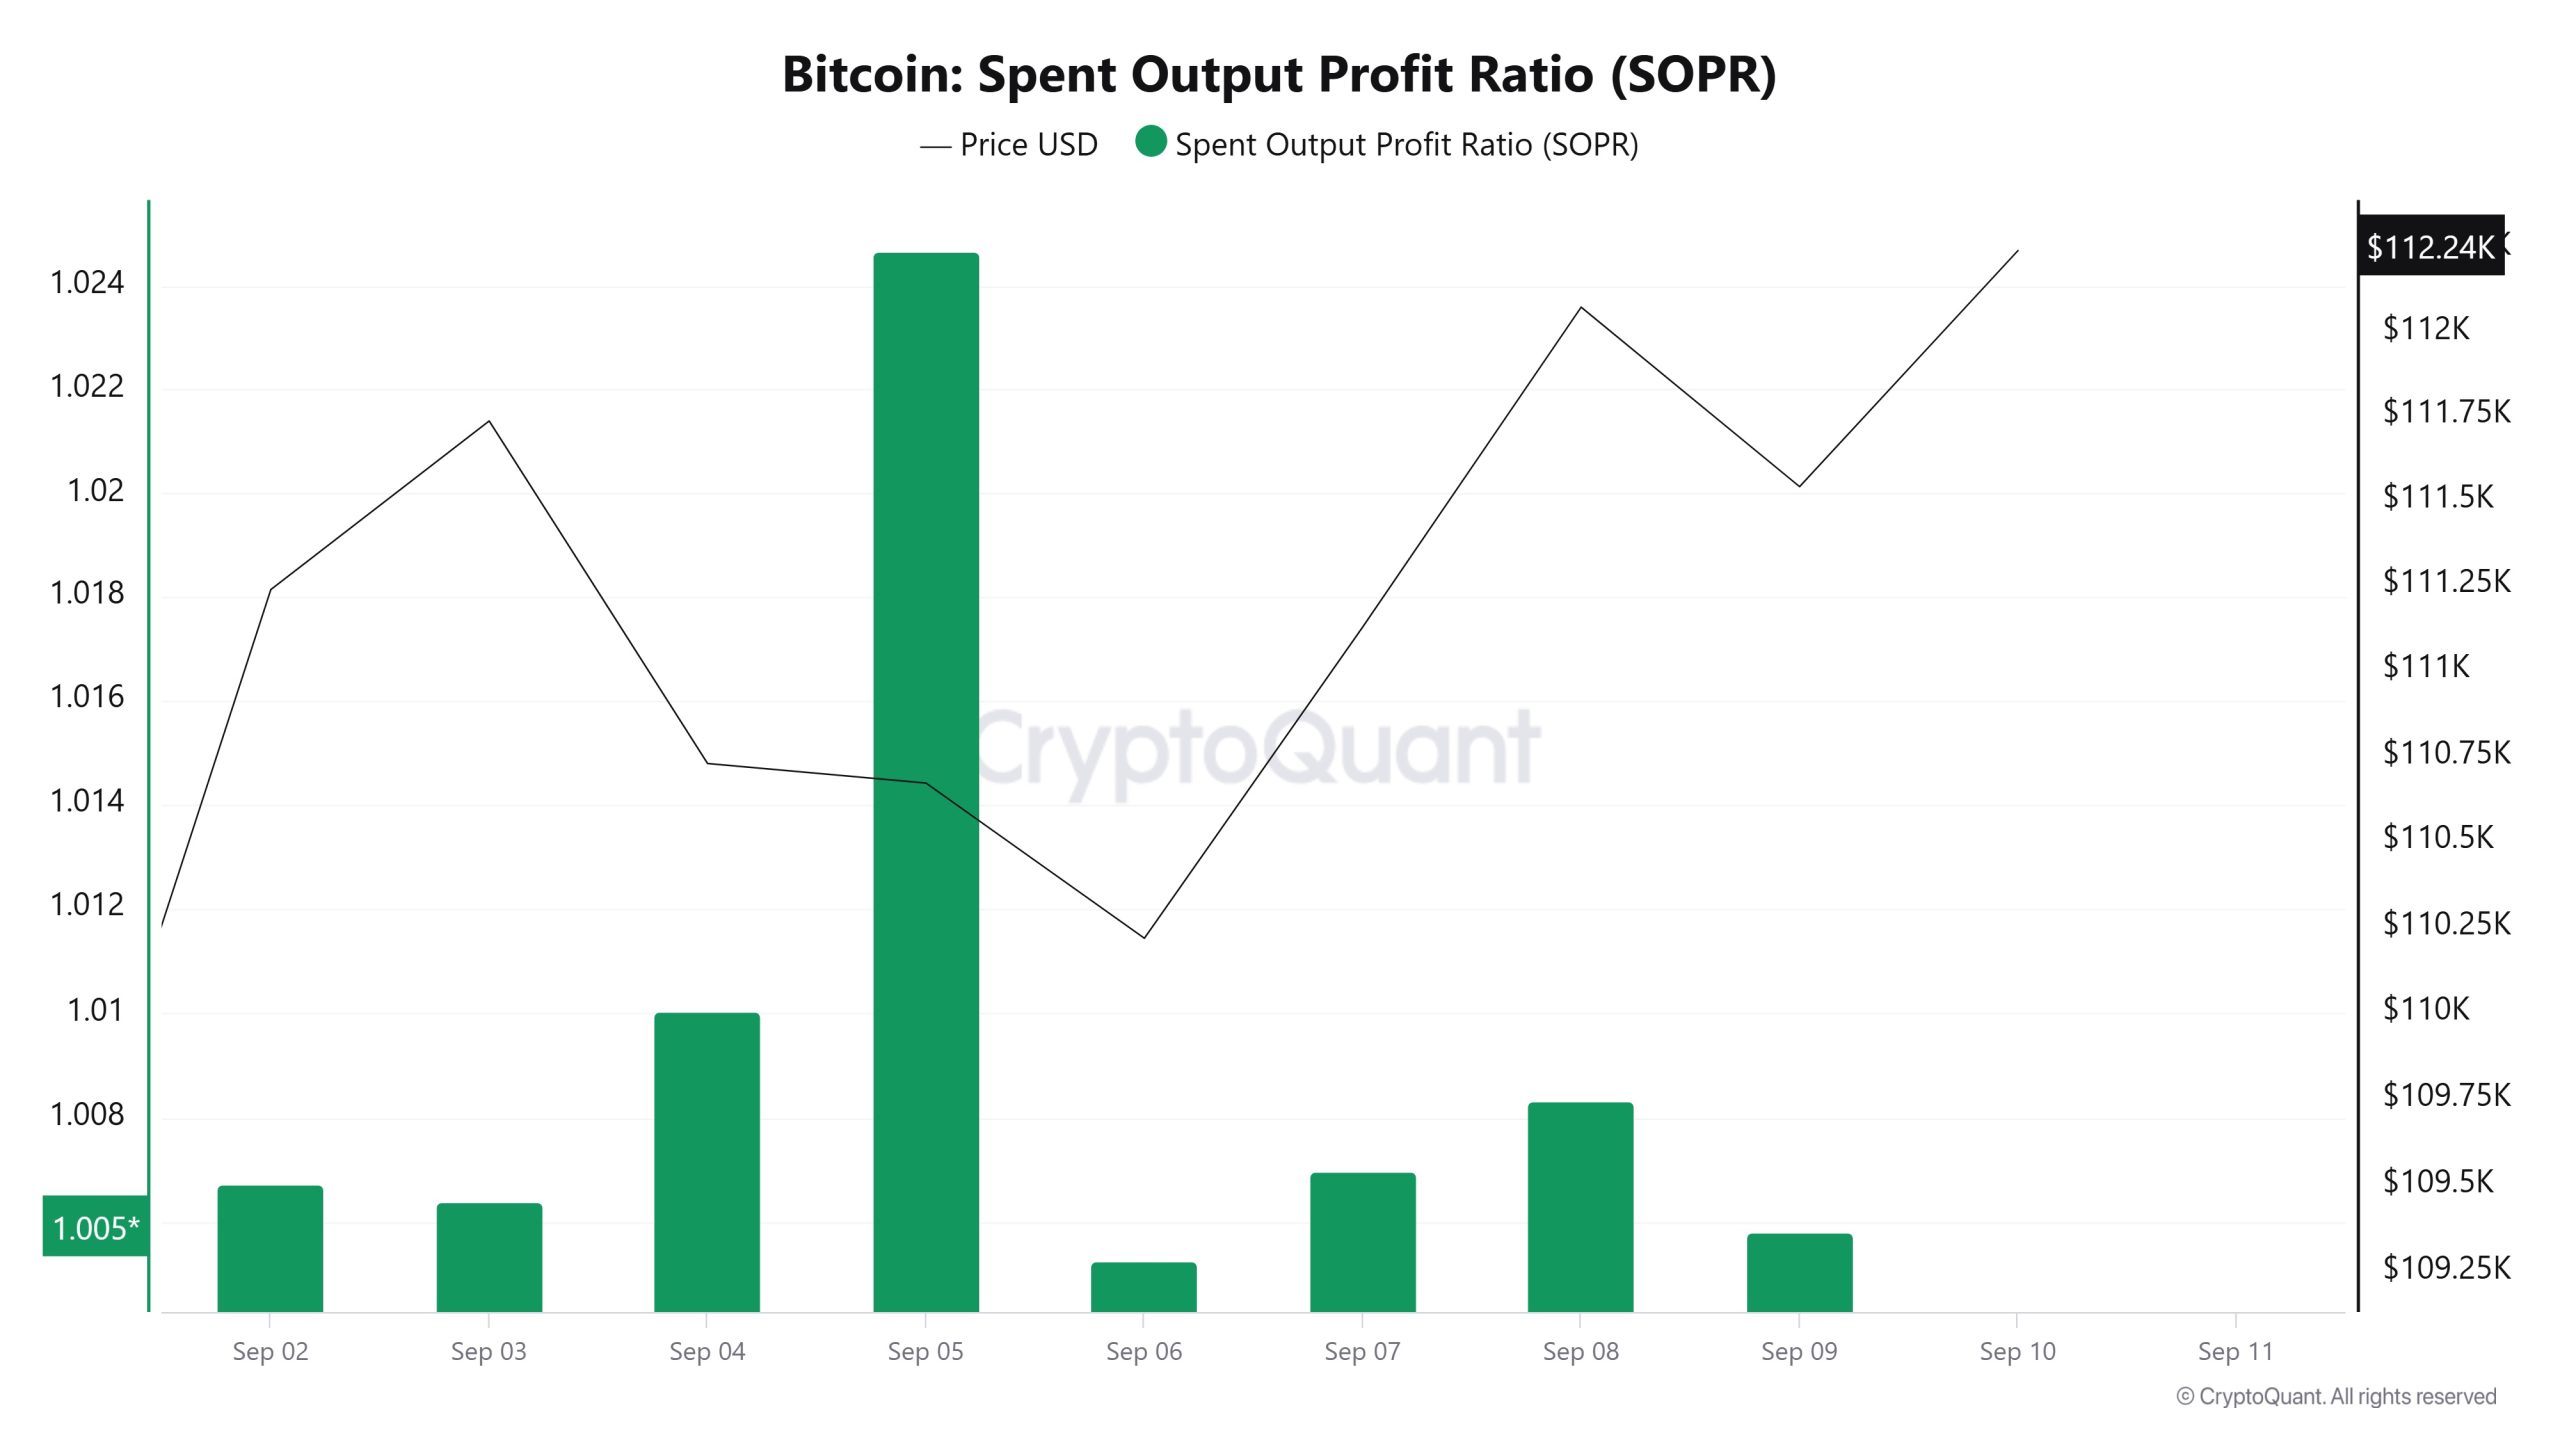
On September 3, the Bitcoin price was at $111,735 while the SOPR metric was at 1.006.
As of September 9, the Bitcoin price fell 0.17% to $111,541, while the SOPR metric fell 0.09% to 1,005.
Supply Distribution
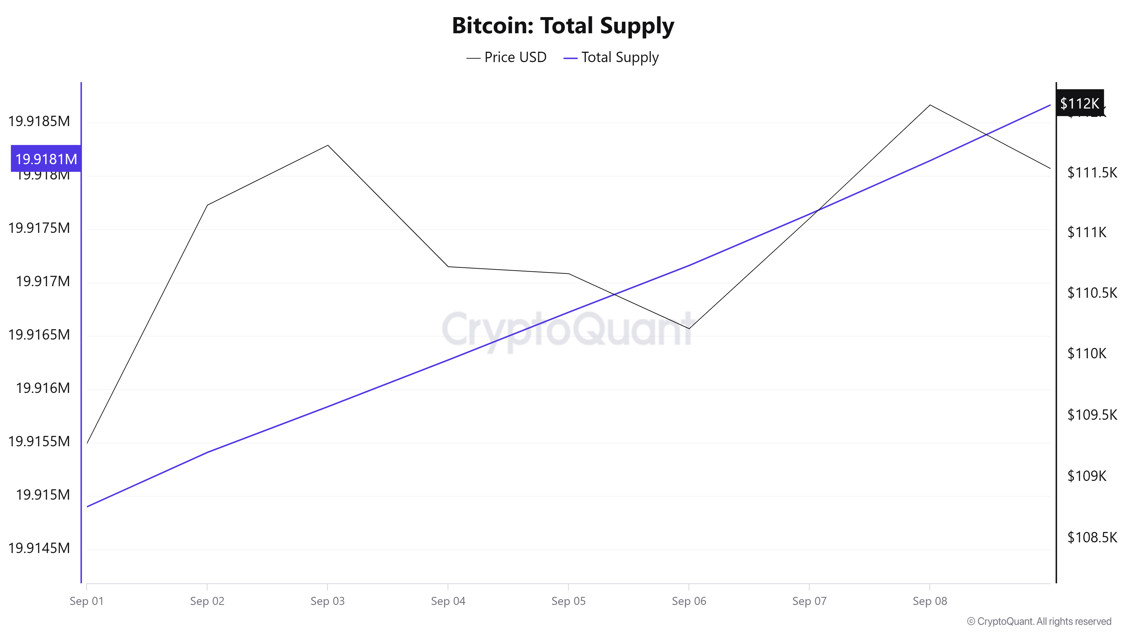
Total Supply: It reached 19,918,142 units, up about 0.01687% from last week.
New Supply: The amount of BTC produced this week was 3,360.
Velocity: Velocity, which was 12.35 last week, was 12.30 as of September 8.
| Wallet Category | 01.10.2025 | 08.10.2025 | Change (%) |
|---|---|---|---|
| < 1 BTC | 8.4688% | 8.4593% | -0.112% |
| 1 – 10 BTC | 11.4048% | 11.4080% | 0.028% |
| 10 – 100 BTC | 24.6272% | 24.6349% | 0.031% |
| 100 – 1k BTC | 29.6331% | 29.7390% | 0.357% |
| 1k – 10k BTC | 18.0496% | 17.9420% | -0.596% |
| 10k+ BTC | 7.8161% | 7.8138% | -0.029% |
According to the latest weekly data, Bitcoin wallet distribution presented a mixed outlook. While the share of wallets holding <1 BTC declined slightly by 0.11%, there was a slight increase of 0.03% in the 1-10 BTC range and 0.03% in the 10-100 BTC group. A more significant increase of 0.36% was recorded in the 100-1,000 BTC range, while the 1,000-10,000 BTC band saw a 0.60% decrease. 10,000+ BTC wallets, which represent the largest investors, saw a limited decline of 0.03%.
Exchange Supply Ratio
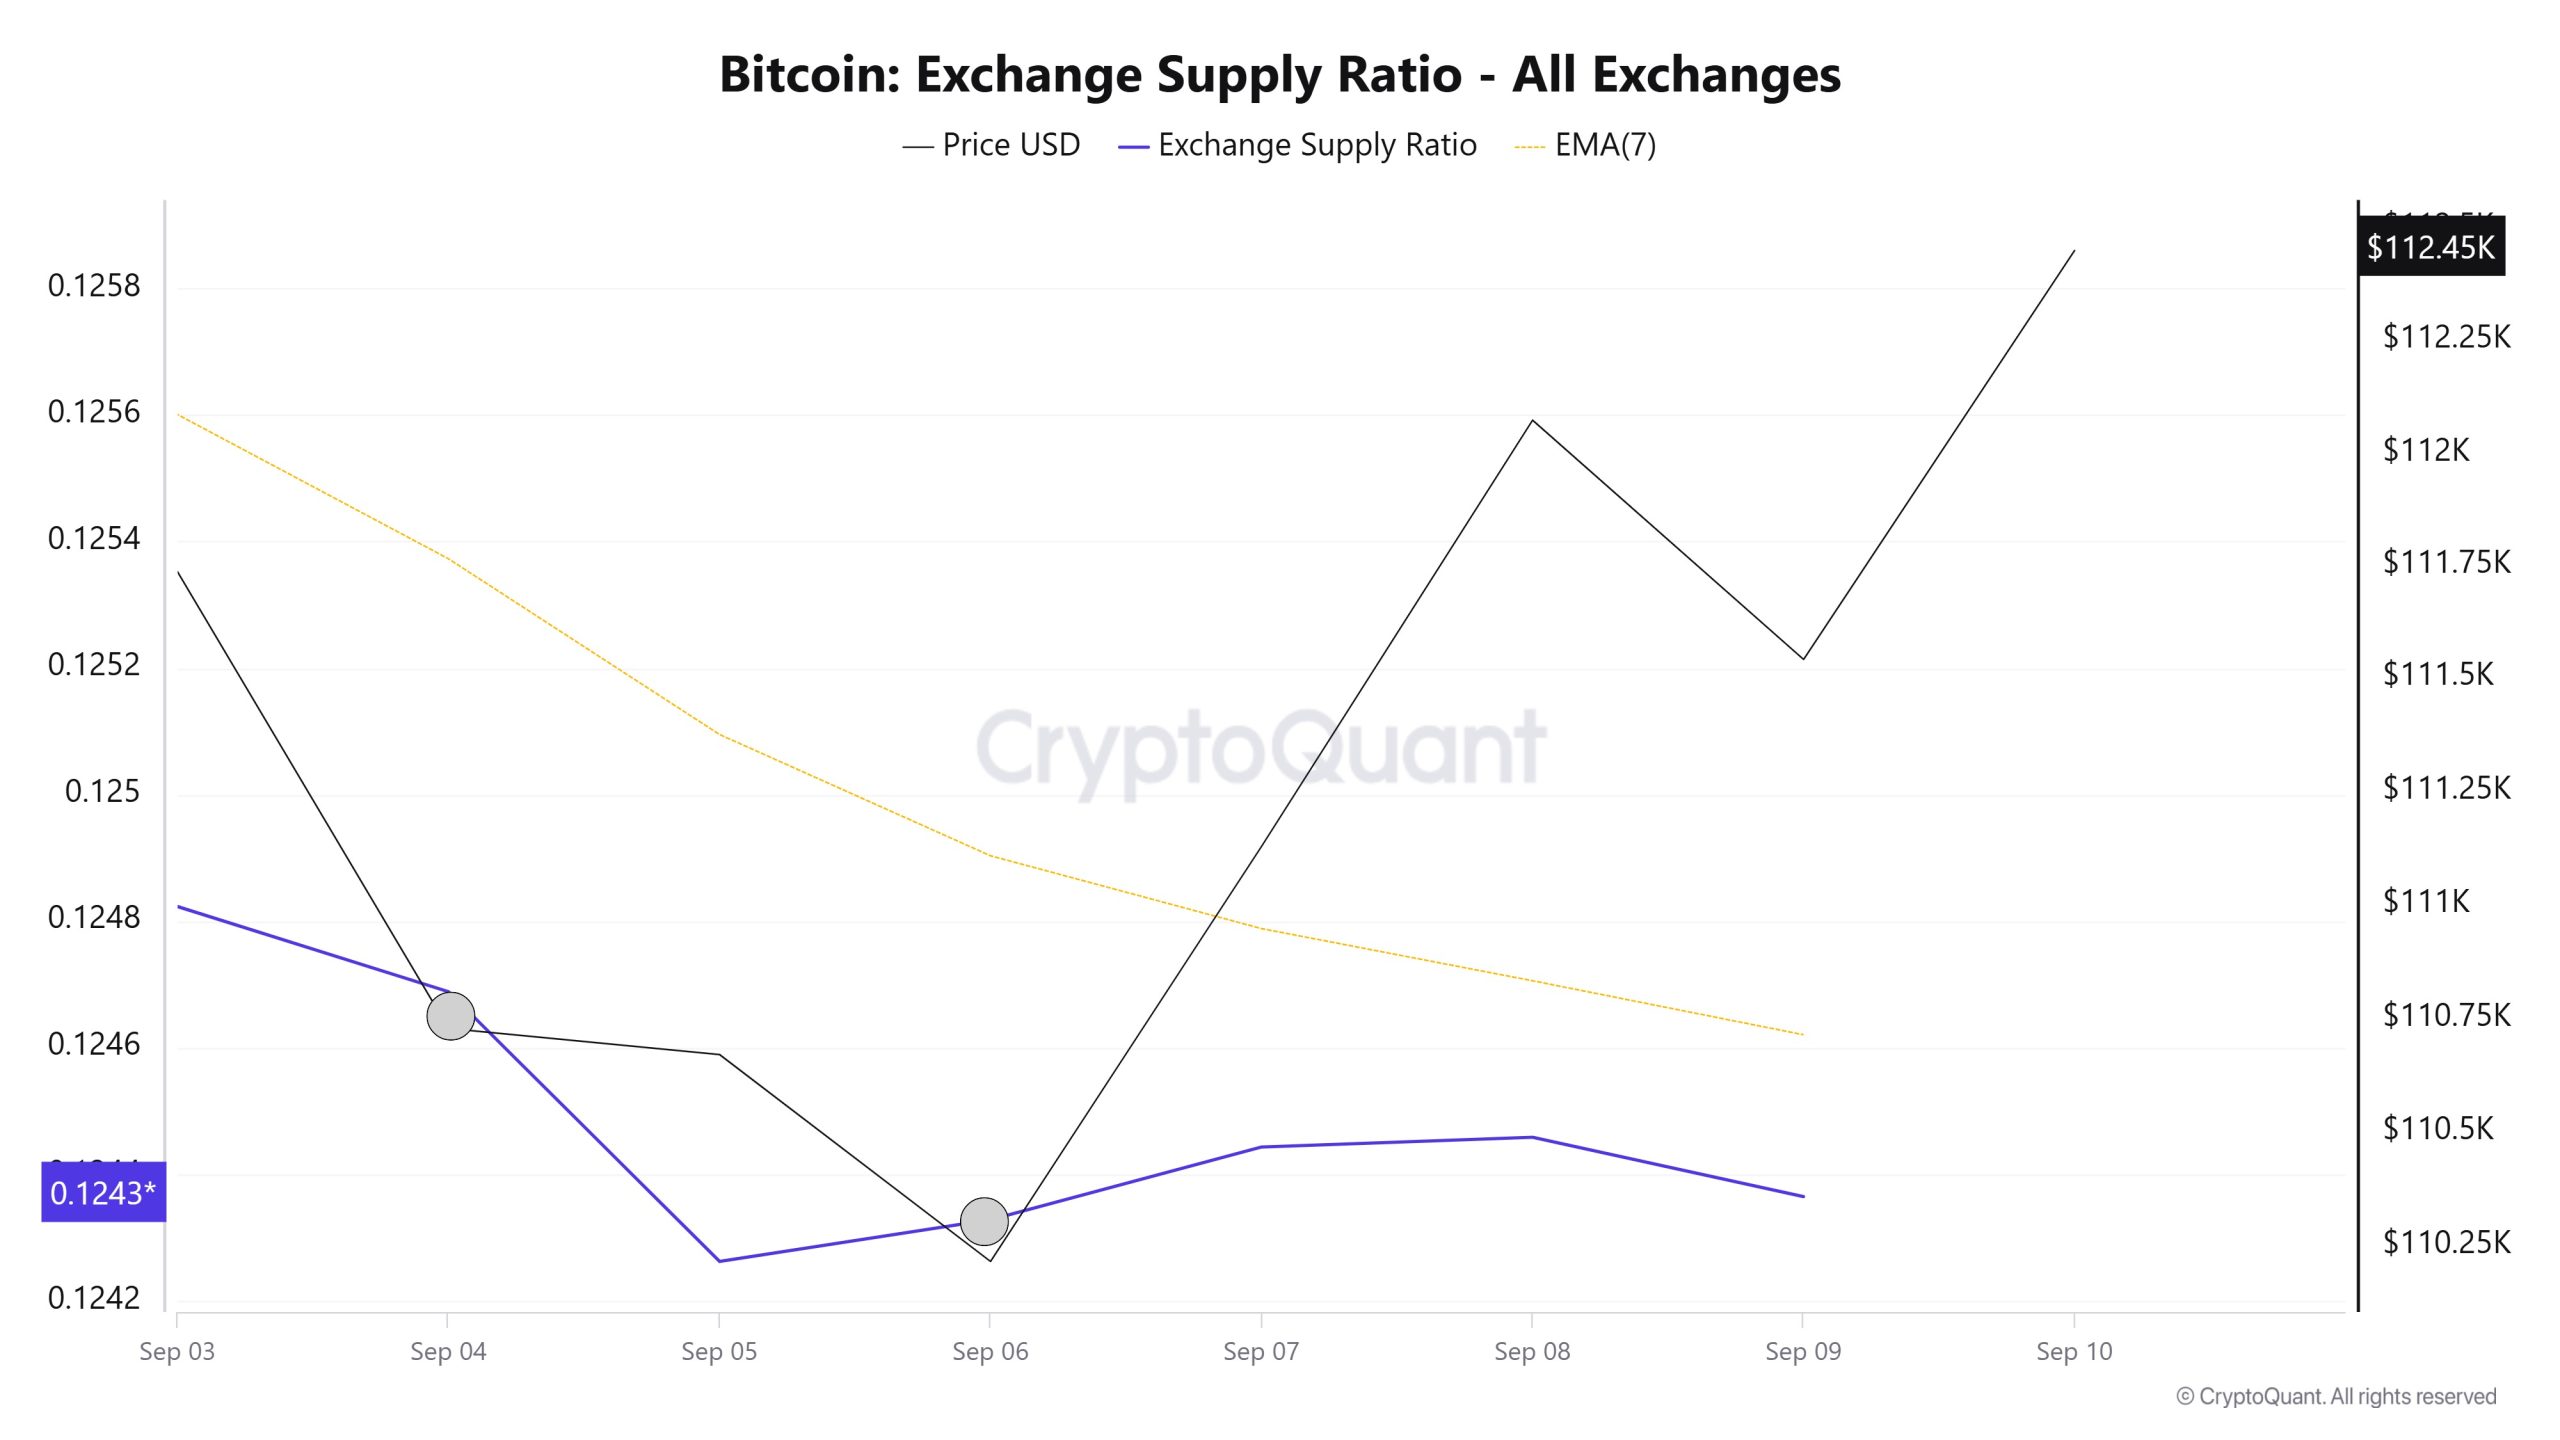
Data from the Bitcoin Exchange Supply Ratio table, which shows how much of Bitcoins are held on exchanges compared to the total supply of Bitcoins, showed low rates this week. This week’s data reveals that the general trend is for a negative correlation between the price of Bitcoin and the rate of supply entering exchanges, dominated by a negative correlation in these two variables. It shows that most Bitcoins continue to be sold out of wallets and are not readily available for sale in the market.
Between August 3 and September 10, the Bitcoin Exchange Supply Ratio decreased from 0.1253726133 to 0.1247882551. During this period, the Bitcoin price rose from $110,000 to $112,000. Notably, on September 4-6, at the intersection of the price and the Exchange Supply Ratio, the price continued to fall while the Exchange Supply Ratio rose significantly. This suggests that despite the price decline, the amount of Bitcoin supplied to exchanges has increased, possibly indicating that long-term investors have stopped holding their assets. It is observed that the Bitcoin price is generally declining.
Exchange Reserve
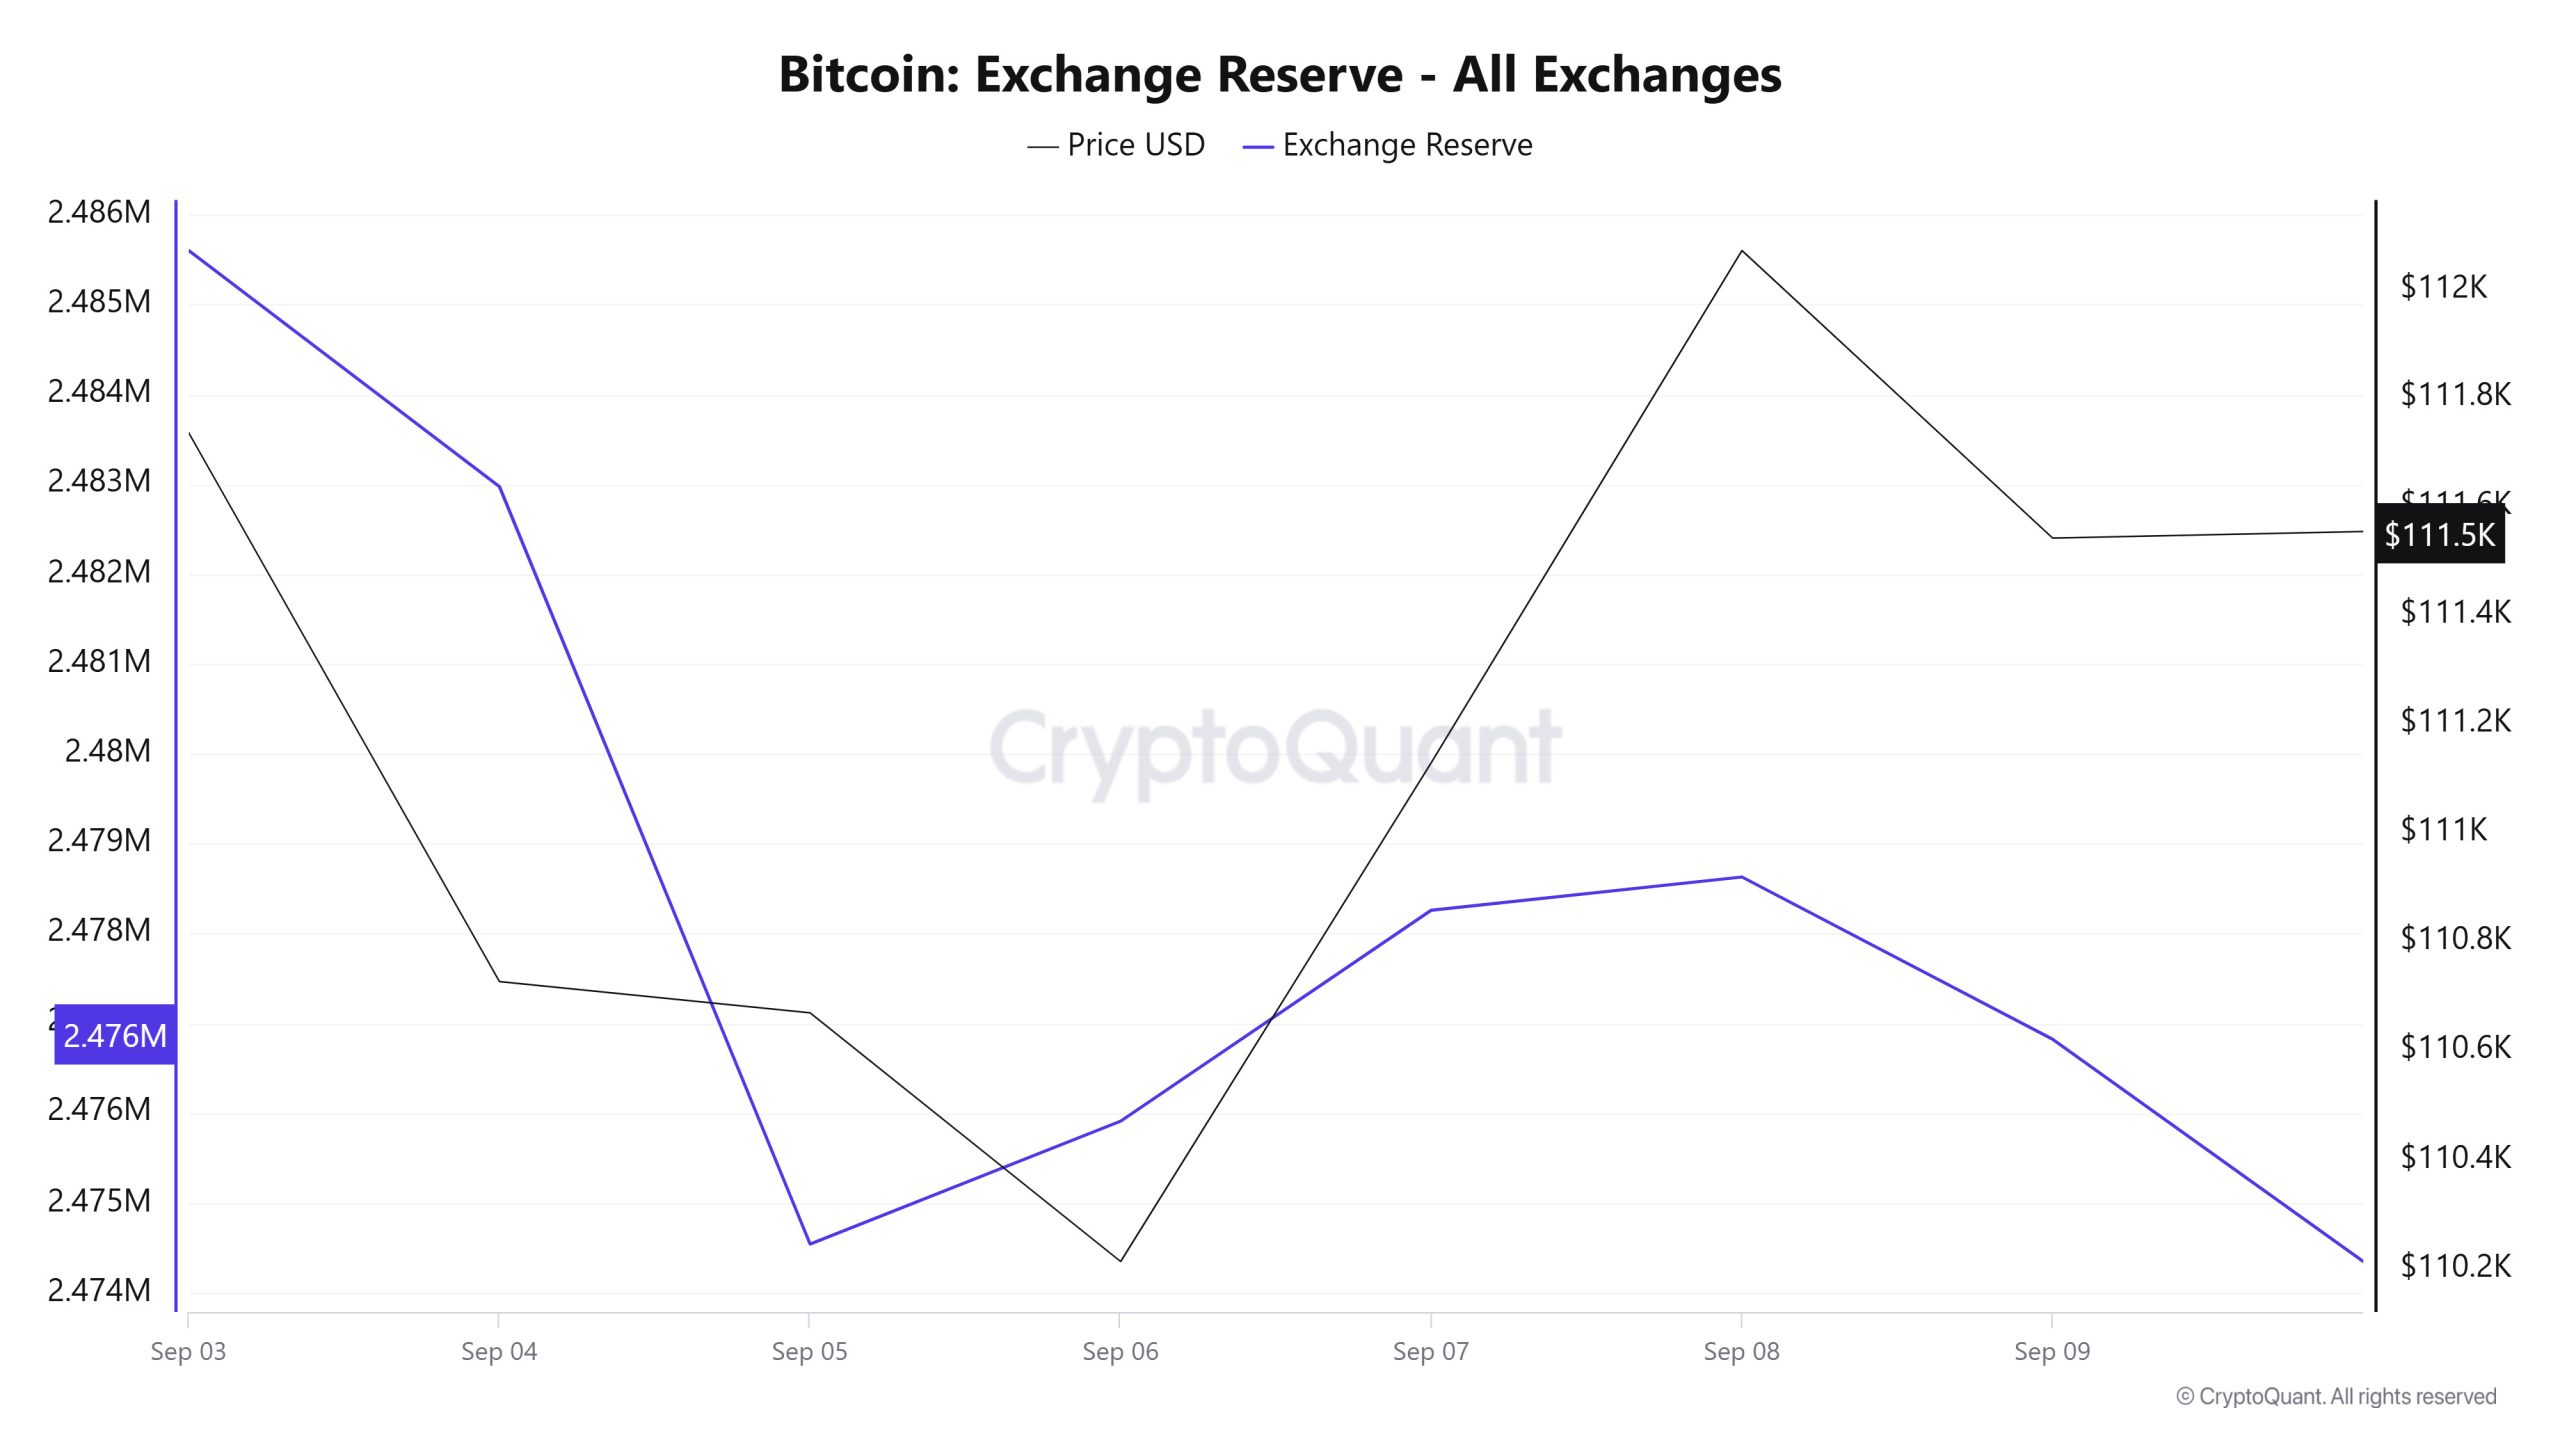
Between September 03-09, 2025, Bitcoin reserves on exchanges decreased from 2,485,603 BTC to 2,476,823 BTC. During this period, there was a total net outflow of 8,780 BTC, a decrease in reserves of about 0.35%. During the same period, the BTC price rose slightly from $111,298 to $111,541, a gain of 0.22%. The persistence of net outflows suggests that investors continue to withdraw BTC from exchanges and that selling pressure has subsided. The slight upward trend in this period may have been supported by the tightening on the supply side.
| Date | Exchange Inflow | Exchange Outflow | Exchange Netflow | Exchange Reserve | BTC Price |
|---|---|---|---|---|---|
| 03-Sep | 31,877 | 25,731 | 6,146 | 2,485,603 | 111,298 |
| 04-Sep | 30,374 | 33,002 | -2,628 | 2,482,975 | 110,727 |
| 05-Sep | 29,789 | 38,222 | -8,433 | 2,474,543 | 110,669 |
| 06-Sep | 9,712 | 8,344 | 1,369 | 2,475,911 | 110,216 |
| 07-Sep | 10,130 | 7,781 | 2,349 | 2,478,260 | 111,128 |
| 08-Sep | 22,009 | 21,640 | 369 | 2,478,628 | 112,072 |
| 09-Sep | 28,382 | 30,187 | -1,806 | 2,476,823 | 111,541 |
Fees and Revenues
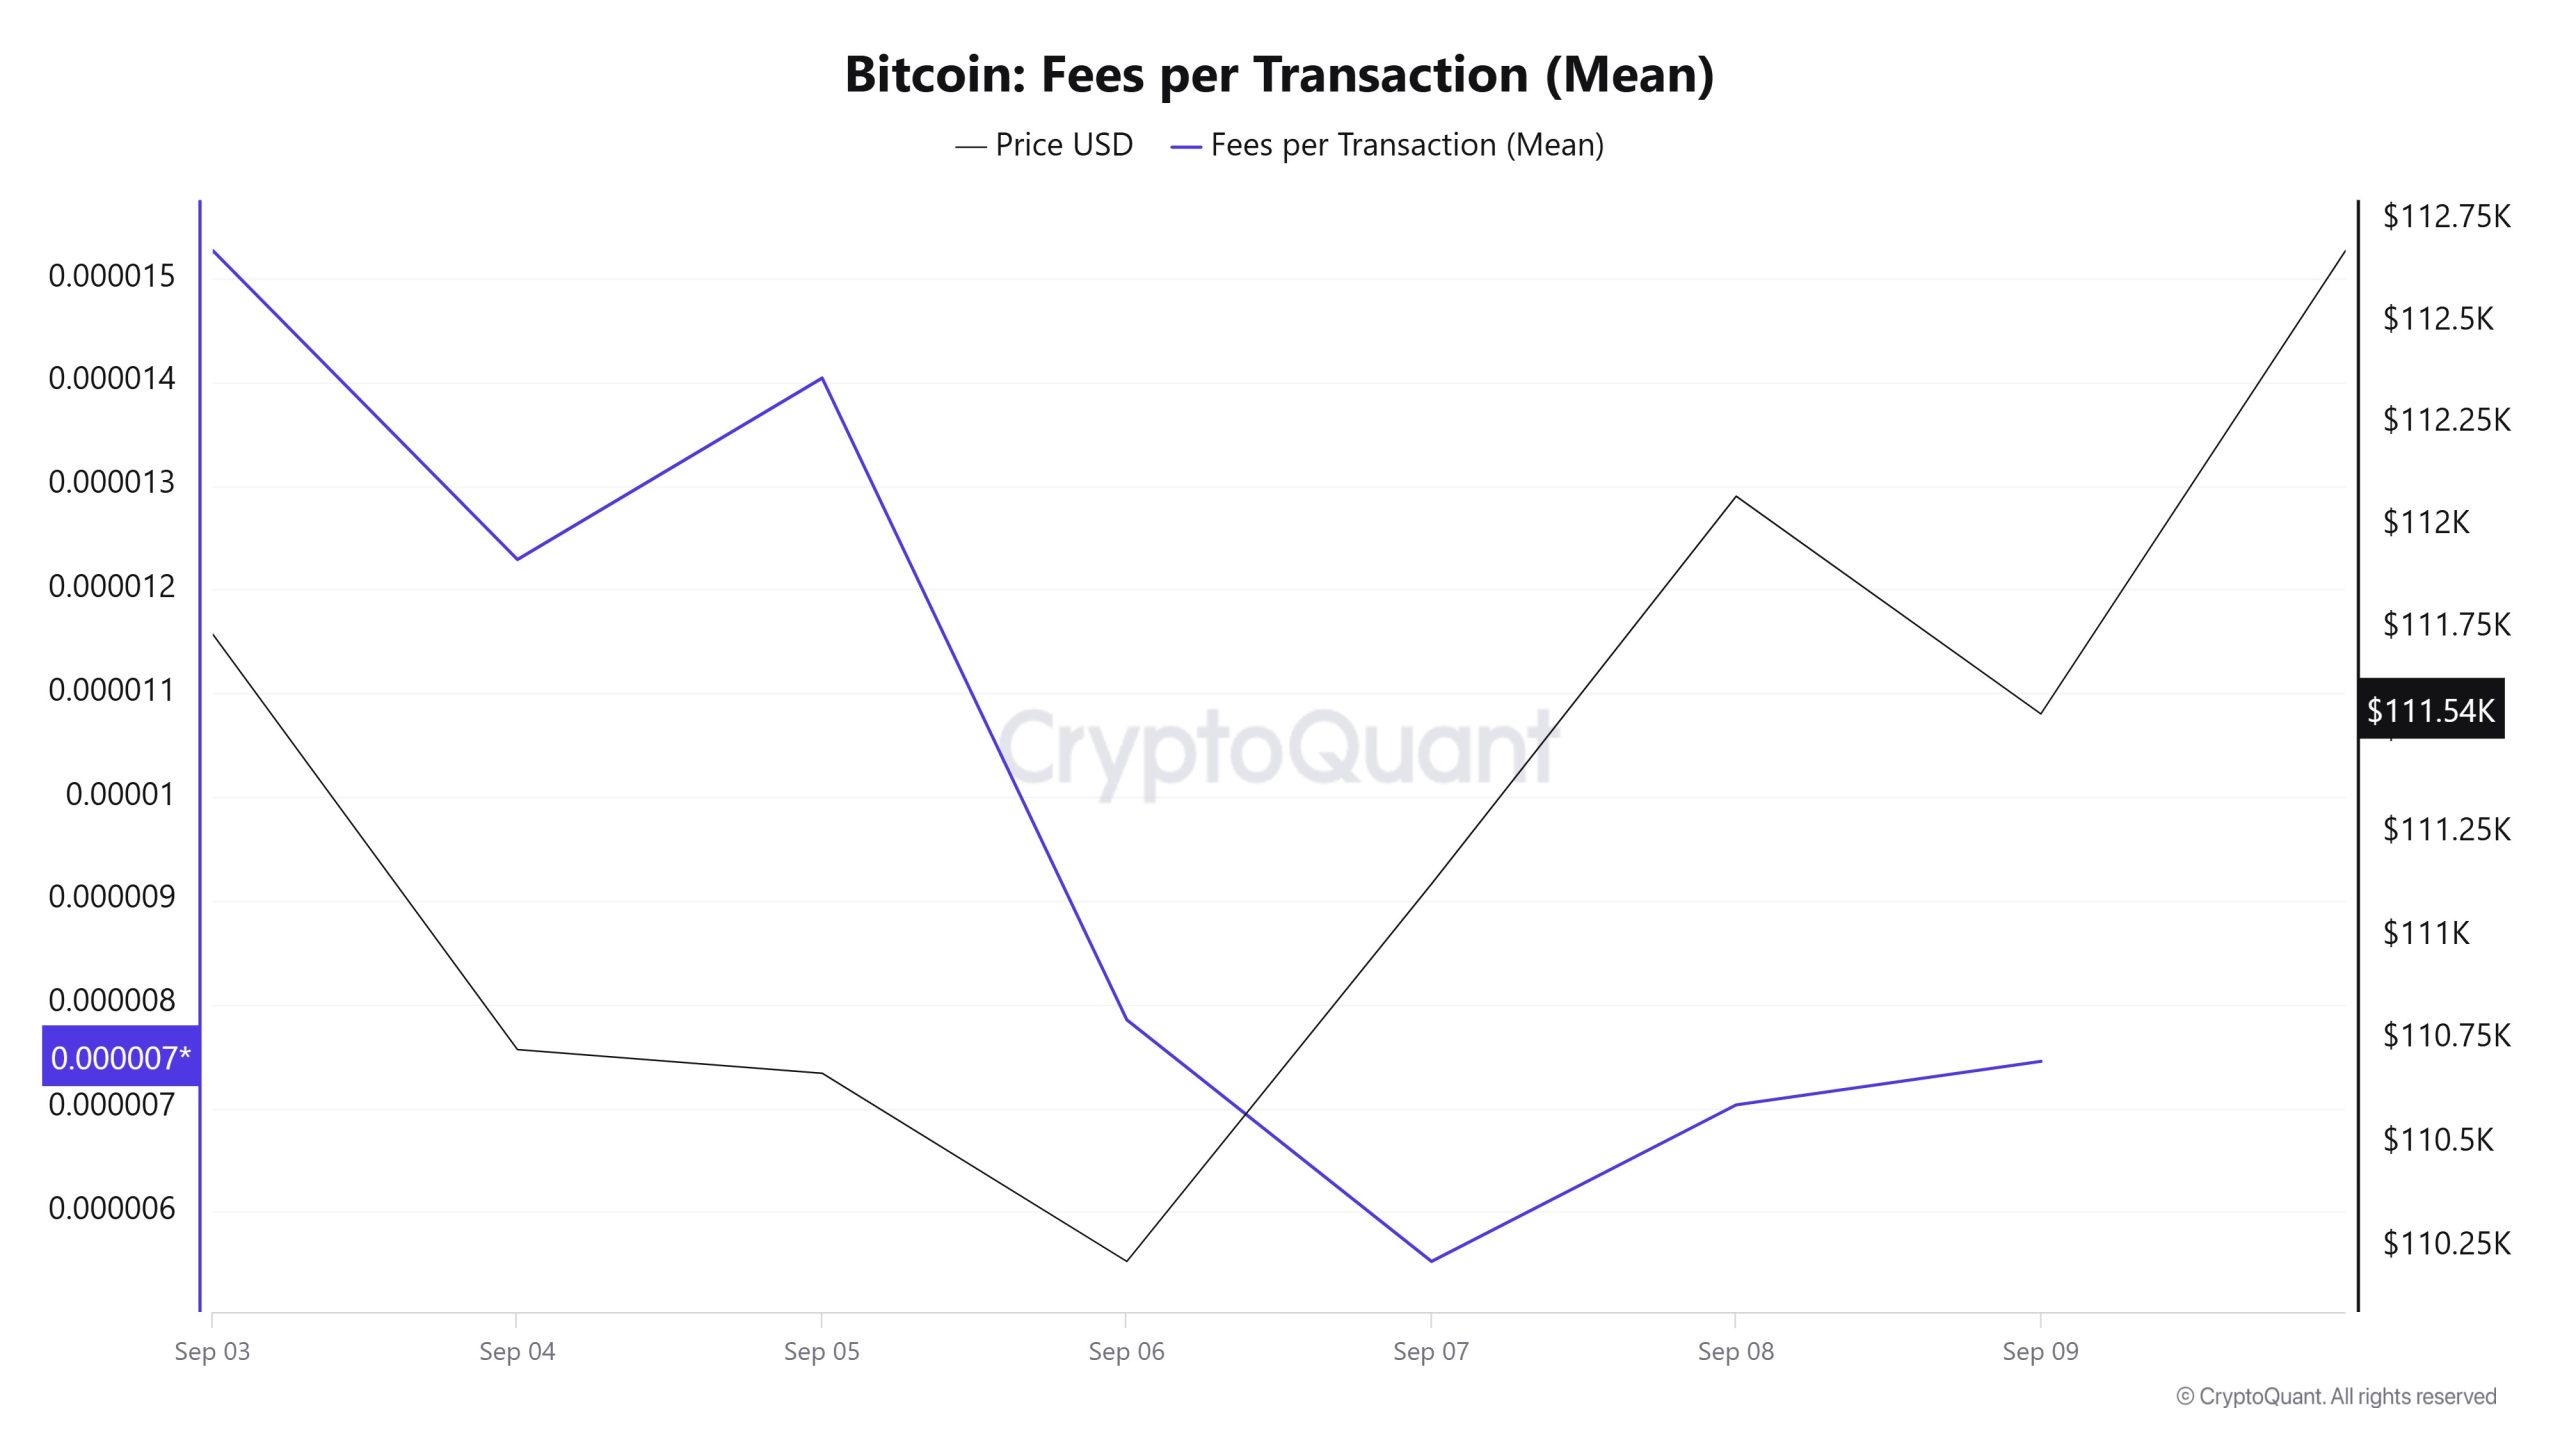
Analysing the Bitcoin Fees per Transaction (Mean) data between September 3 and 9, it is seen that the indicator was realized at 0.00001527 on September 3, the first day of the week.
The value in question, which peaked on the first day of the week, followed a fluctuating course after this date due to the volatility in Bitcoin price. On September 7, it fell to 0.00000552, recording the lowest value of the week.
In the following days, the Bitcoin Fees per Transaction (Mean) indicator resumed its upward trend and closed at 0.00000745 on September 9, the last day of the week.
Bitcoin: Fees (Total)
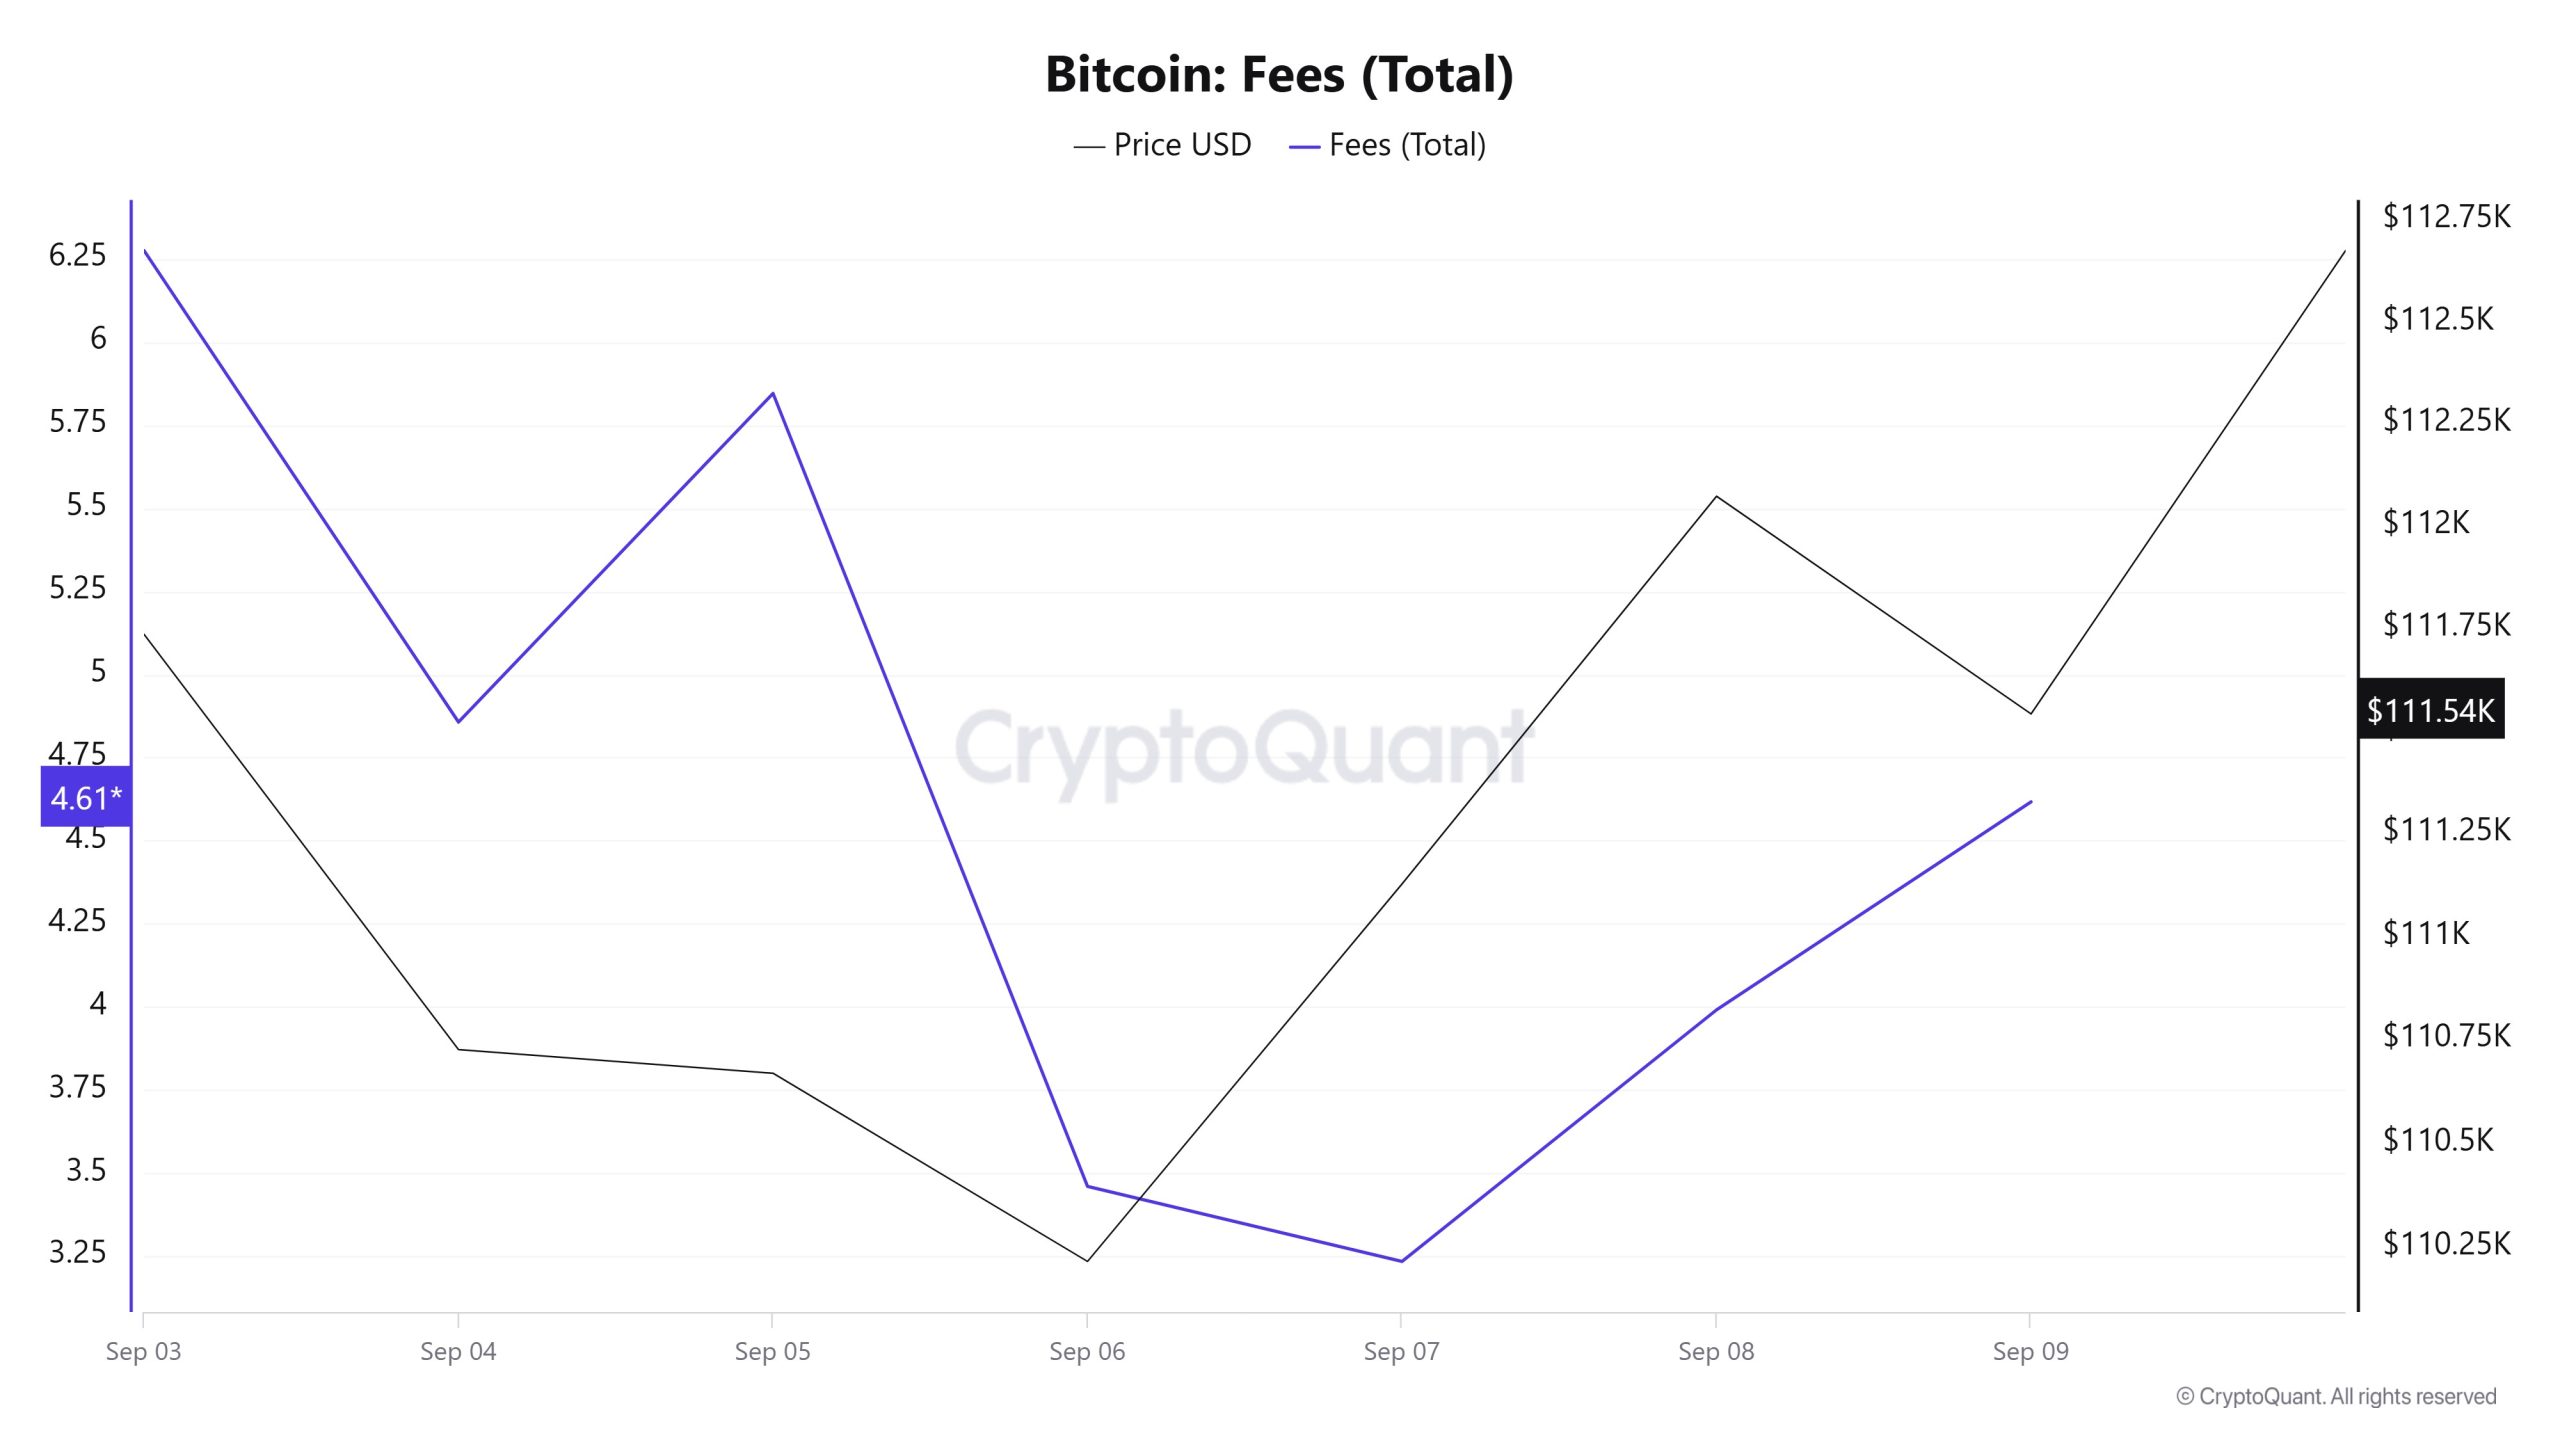
Similarly, an analysis of Bitcoin Fees (Total) data between September 3 and 9 shows that the indicator was at 6.27562614 on September 3, the first day of the week.
The value, which peaked on the first day of the week, followed a fluctuating course after this date due to the volatility in Bitcoin price. On September 7, it fell to 3.23341128, recording the lowest value of the week.
In the following days, the Bitcoin Fees (Total) indicator resumed its upward trend and closed at 4.61643745 on September 9, the last day of the week.
Miner Flows
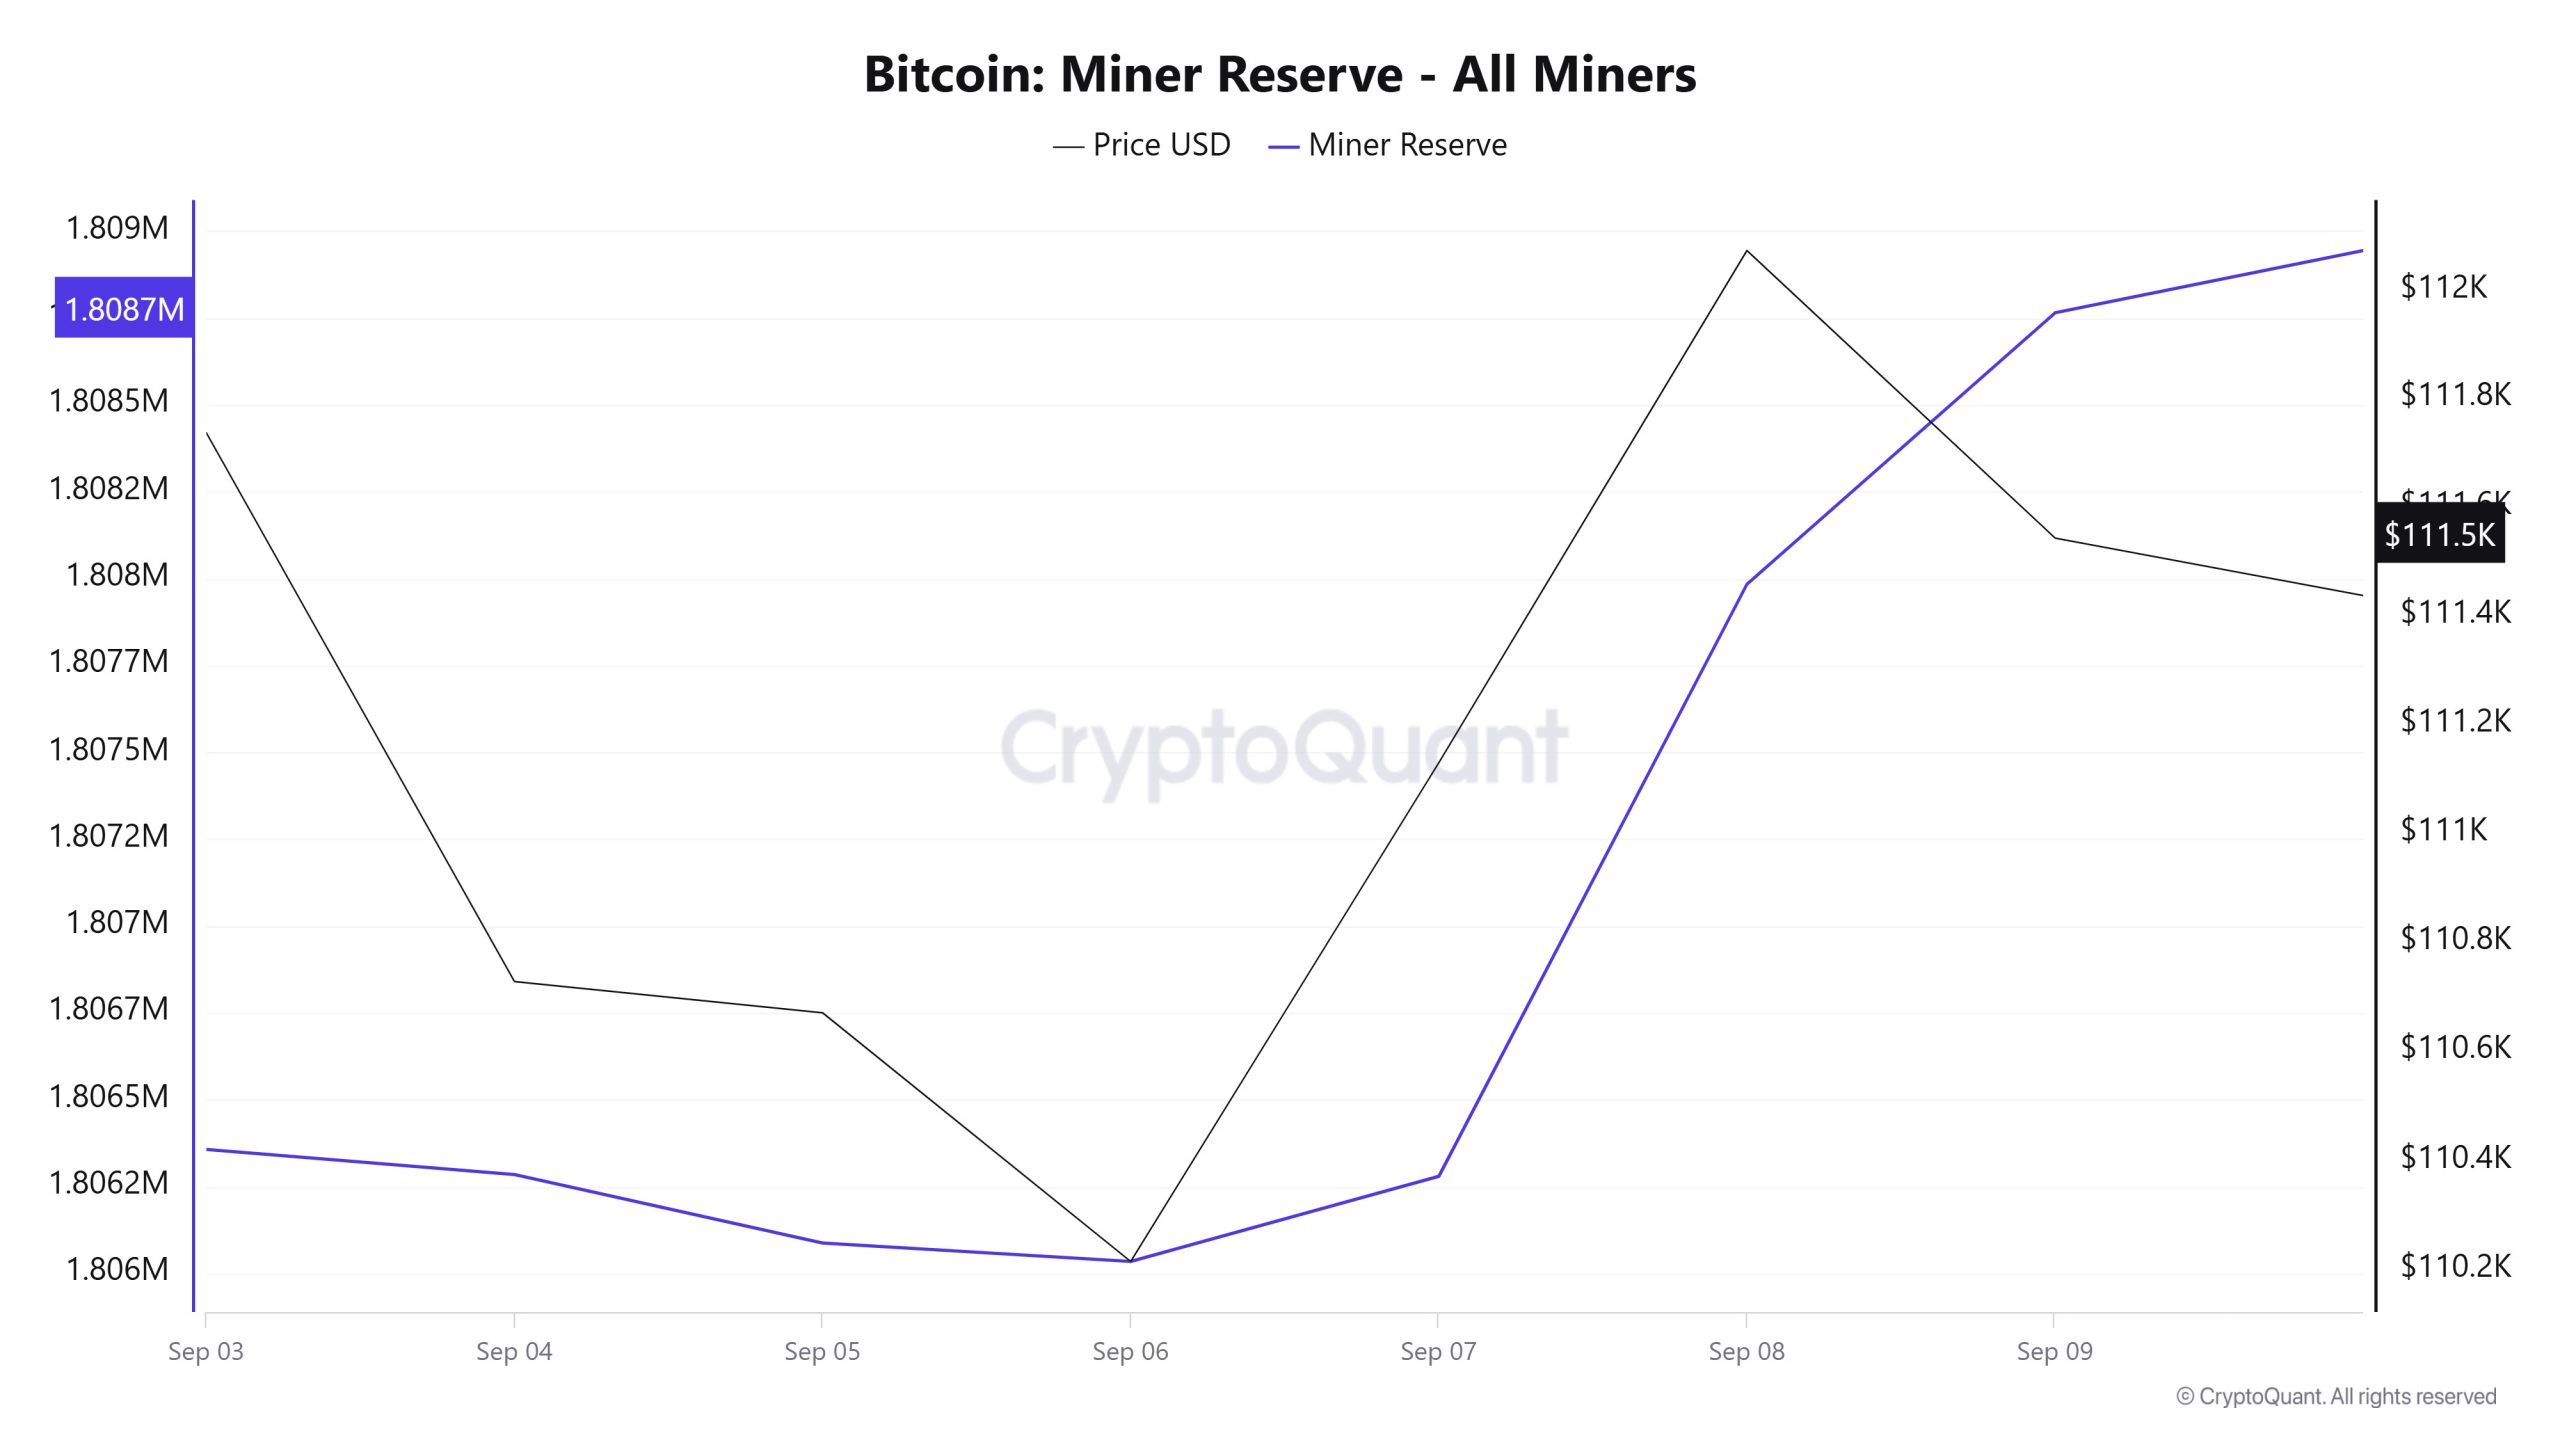
According to the data obtained from the Miner Reserve table, there has been an increase in Bitcoin reserves held in miners’ wallets this week. A time-varying correlation structure was observed between Bitcoin price and miner reserve over the time period analyzed. However, the general trend reveals that a positive correlation between these two variables is dominant.
Miner Inflow, Outflow and Netflow
Between September 3 and September 9, 34,335 Bitcoins exited miners’ wallets, and 36,652 Bitcoins entered miners’ wallets between the same dates. The Miner Netflow for this week was 2317 Bitcoin. Meanwhile, the Bitcoin price was $111,735 on September 3 and $111,541 on September 9.
For the week, the net flow (Miner Netflow) was positive as Bitcoin inflow into miner wallets (Miner Inflow) was higher than Bitcoin outflow from miner wallets (Miner Outflow).
| Date | Miner Inflow | Miner Outflow | Miner Netflow |
|---|---|---|---|
| Sept. 3 | 5,155.09 | 5,245.91 | -90.82 |
| Sept. 4 | 5,632.10 | 5,704.30 | -72.20 |
| Sept. 5 | 7,277.96 | 7,475.16 | -197.20 |
| Sept. 6 | 2,180.98 | 2,233.98 | -53.01 |
| Sept. 7 | 2,329.00 | 2,083.92 | 245.08 |
| Sept. 8 | 6,286.89 | 4,582.73 | 1,704.16 |
| Sept. 9 | 7,790.14 | 7,009.05 | 781.09 |
Transaction
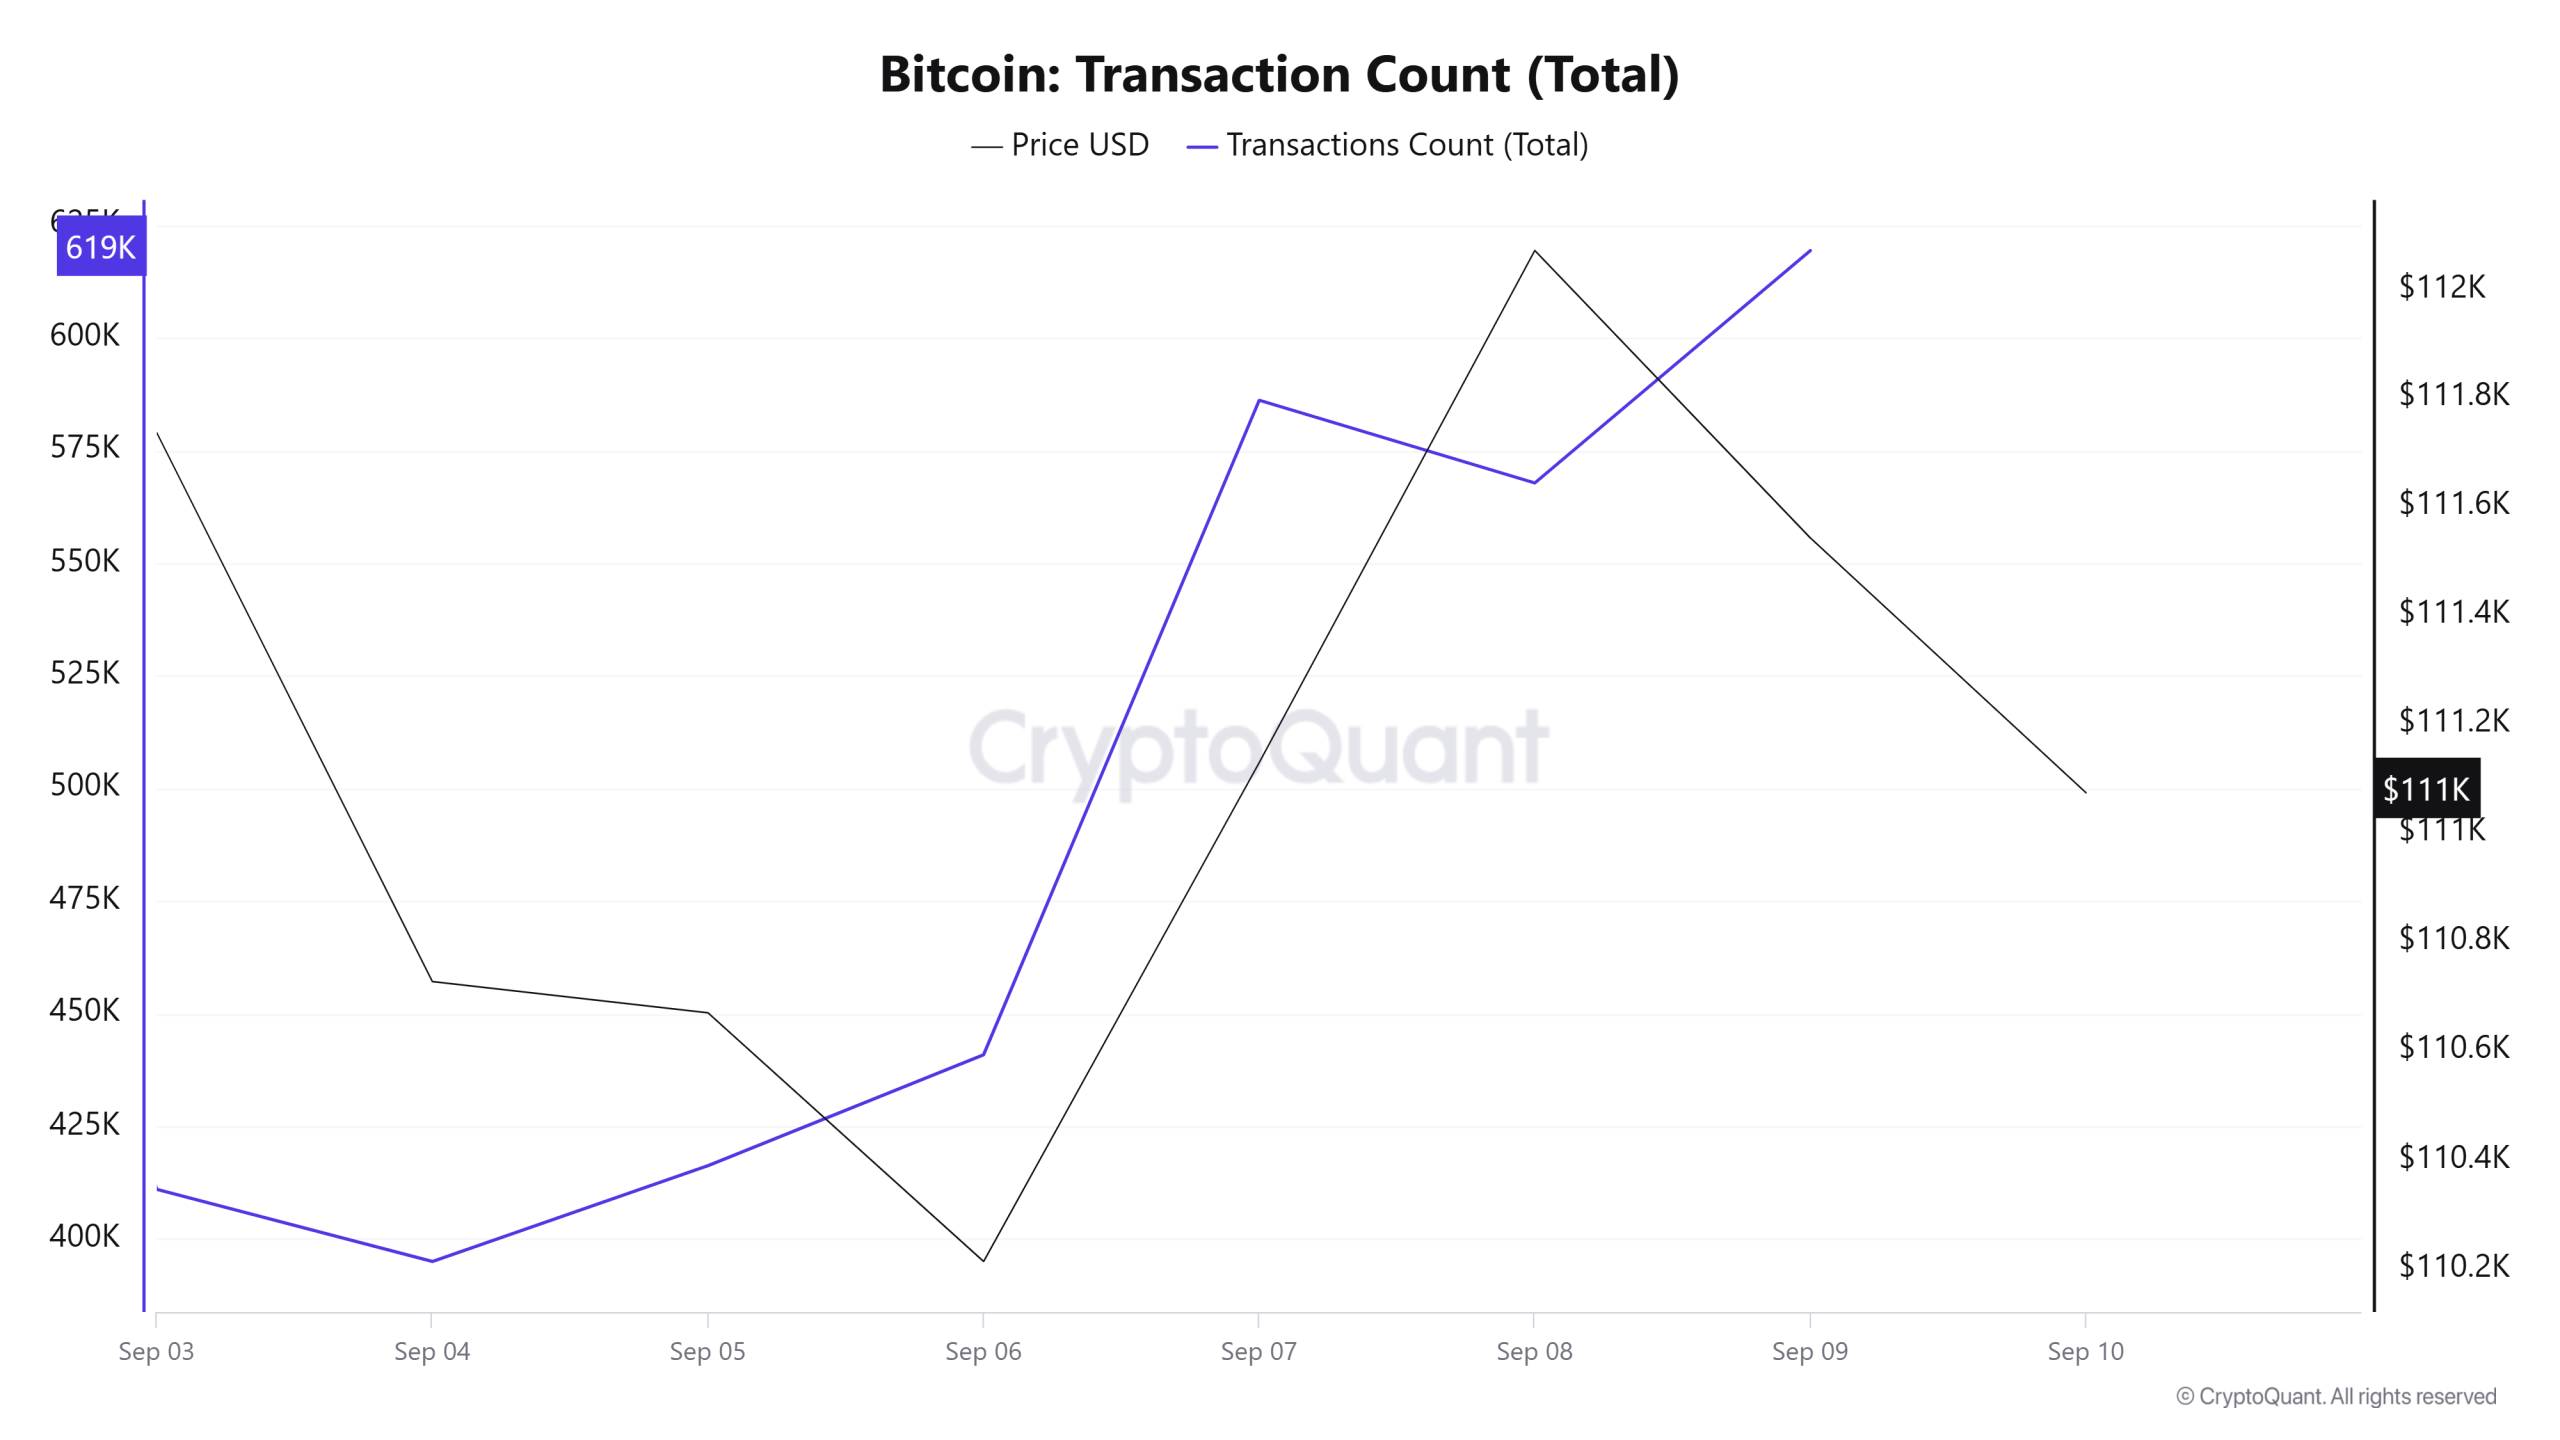
Last week, there were 3,962,794 transactions on the Bitcoin network, while this week the number of transactions decreased by about 13.27% to 3,436,735. The highest trading volume of the week was 619,347 trades on September 9, while the lowest was 395,041 on September 4. Although a volatile course was observed throughout the period, an upward trend was observed in the number of trades throughout the week. However, the inverse correlation between trading volume and price movements suggests that most of the transactions were on the sell side. In terms of the weekly trend, the decline in network activity compared to the previous week reveals a negative outlook, while the correlations observed during the week also support this view. However, sudden fluctuations in trading volumes complicate the short-term stability of the market and reinforce the bearish sentiment.
Tokens Transferred
While a total of 4,381,695 BTC was transferred last week, this week the transfer volume increased by 6.16% to 4,651,806 BTC. The highest daily transfer volume of the week was 827,552 BTC on September 5, while the lowest transfer volume was 467,033 BTC on September 6. The correlation between the amount transferred and the price fluctuated throughout the period. However, the fact that the highest and lowest transfer volumes occurred on consecutive days can be explained by the high volume on Friday and the lull on Saturday. This suggests that market activity tends to decline over the weekends. In particular, the high volatility in the transfer volume reveals that Bitcoin changed hands intensively during this period. In this period when the price is on a downward trend, it seems quite likely that the transfers will be sales-weighted.
Whale Activities
Whales Data:
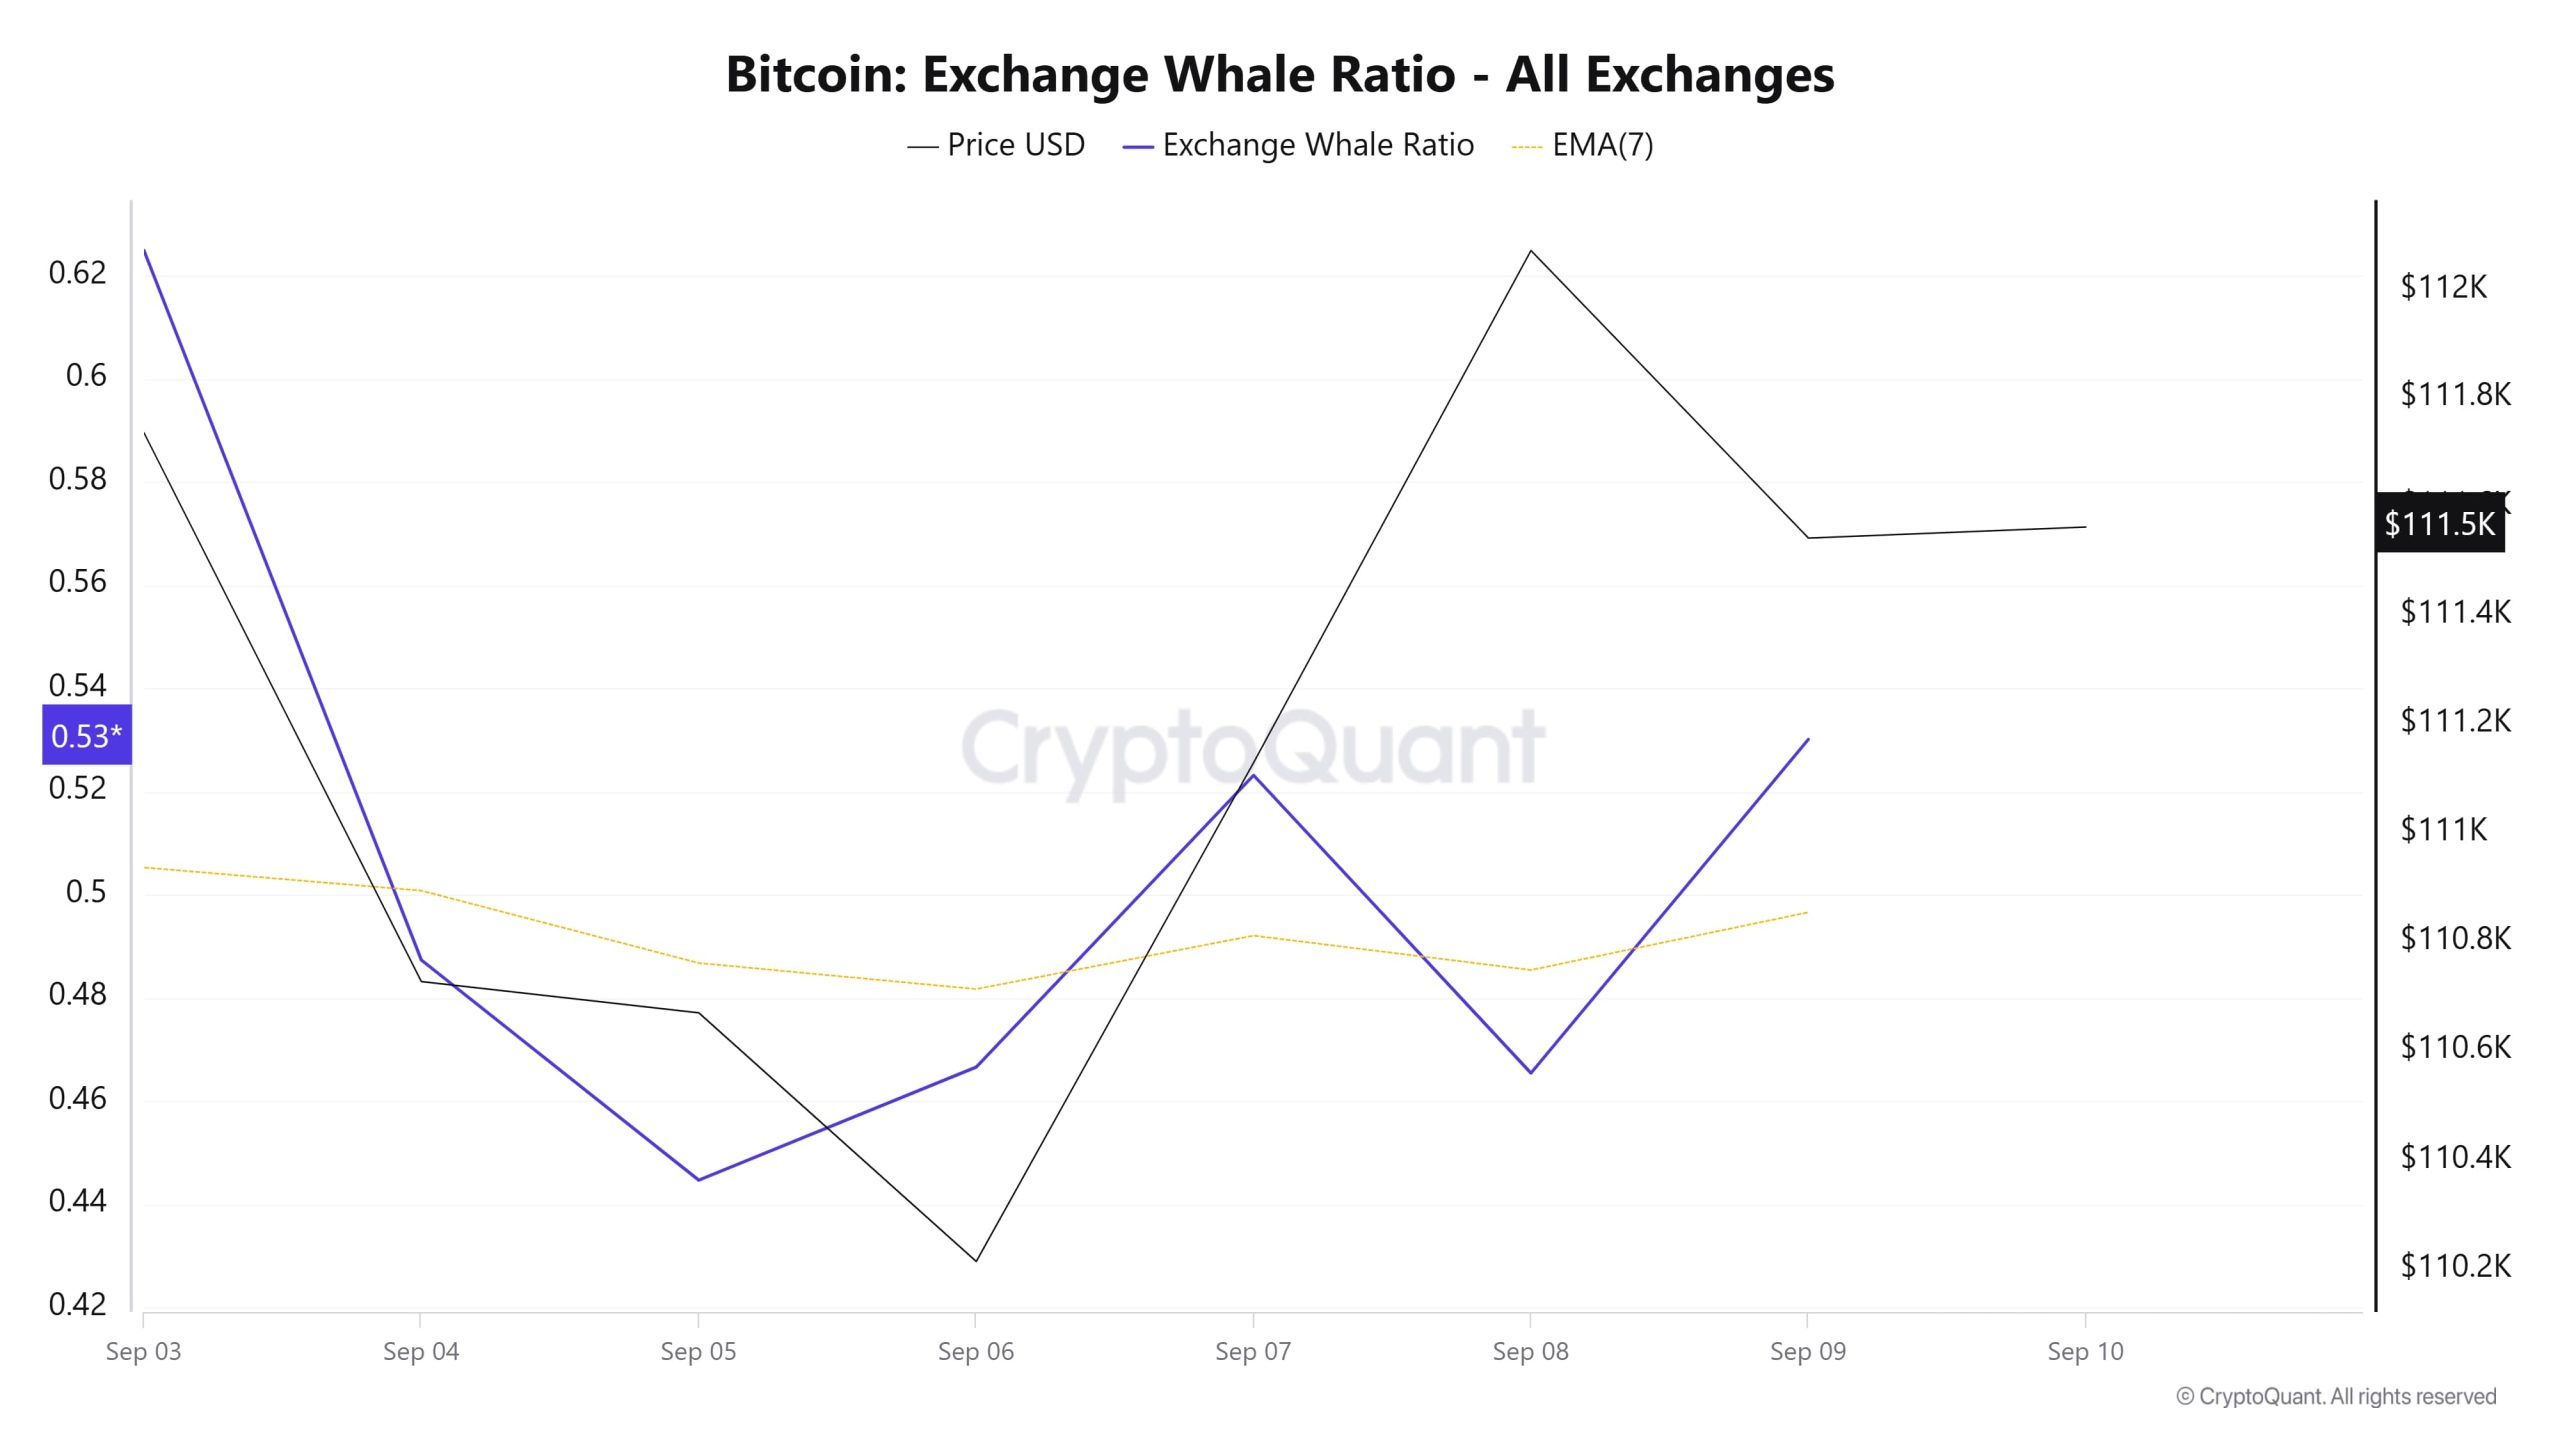
Over the last 7 days, according to data from the cryptocurrency market, whale activity on centralized exchanges has declined from the beginning to the middle of the period. When we look at the Exchange Whale Ratio metric, on September 3, the first day of the 7-day period, the rate of whales using central exchanges was 0.624, which was also the peak of this process. The lowest point occurred on September 5 and fell to 0.444. When this ratio is above 0.35, it usually means that whales use centralized exchanges frequently. The metric, which currently has a value of 0.530, seems to have caught the upward momentum. BTC is seen to stay between 109,500 and 113,000 in this process. At the same time, it is seen that 4,651,806 BTC moved in total BTC transfers, up 6% compared to last week. Looking at the data, large Bitcoin holders reduced their positions while mid-level investors continued to accumulate Bitcoin. While the digital asset traded around $111,400, it reveals that addresses with more than 1,000 Bitcoins reduced their holdings, while wallets containing 100 to 1,000 Bitcoins continued to expand their positions. As a result, mid-level pockets are picking up the sale of high-value whales. However, the increase in whale activity suggests that high-value pockets may continue to sell. This could lead to a pullback in Bitcoin.
BTC Onchain Overall
| Metric | Positive 📈 | Negative 📉 | Neutral ➖ |
|---|---|---|---|
| Active Addresses | ✓ | ||
| Breakdowns | ✓ | ||
| Supply Distribution | ✓ | ||
| Exchange Supply Ratio | ✓ | ||
| Exchange Reserve | ✓ | ||
| Fees and Revenues | ✓ | ||
| Miner Flows | ✓ | ||
| Transaction | ✓ | ||
| Whale Activities | ✓ |
*The metrics and guidance in the table do not, by themselves, describe or imply an expectation of future price changes for any asset. The prices of digital assets may vary depending on many different variables. The onchain analysis and related guidance are intended to assist investors in their decision-making process, and making financial investments based solely on the results of this analysis may result in harmful transactions. Even if all metrics produce a positive, negative or neutral result at the same time, the expected results may not be seen according to market conditions. Investors reviewing the report would be well advised to heed these caveats.
Legal Notice
The investment information, comments and recommendations contained in this document do not constitute investment advisory services. Investment advisory services are provided by authorized institutions on a personal basis, taking into account the risk and return preferences of individuals. The comments and recommendations contained in this document are of a general type. These recommendations may not be suitable for your financial situation and risk and return preferences. Therefore, making an investment decision based solely on the information contained in this document may not result in results that are in line with your expectations.
NOTE: All data used in Bitcoin onchain analysis is based on Cryptoqaunt.

