
Weekly Bitcoin Onchain Report
Active Addresses
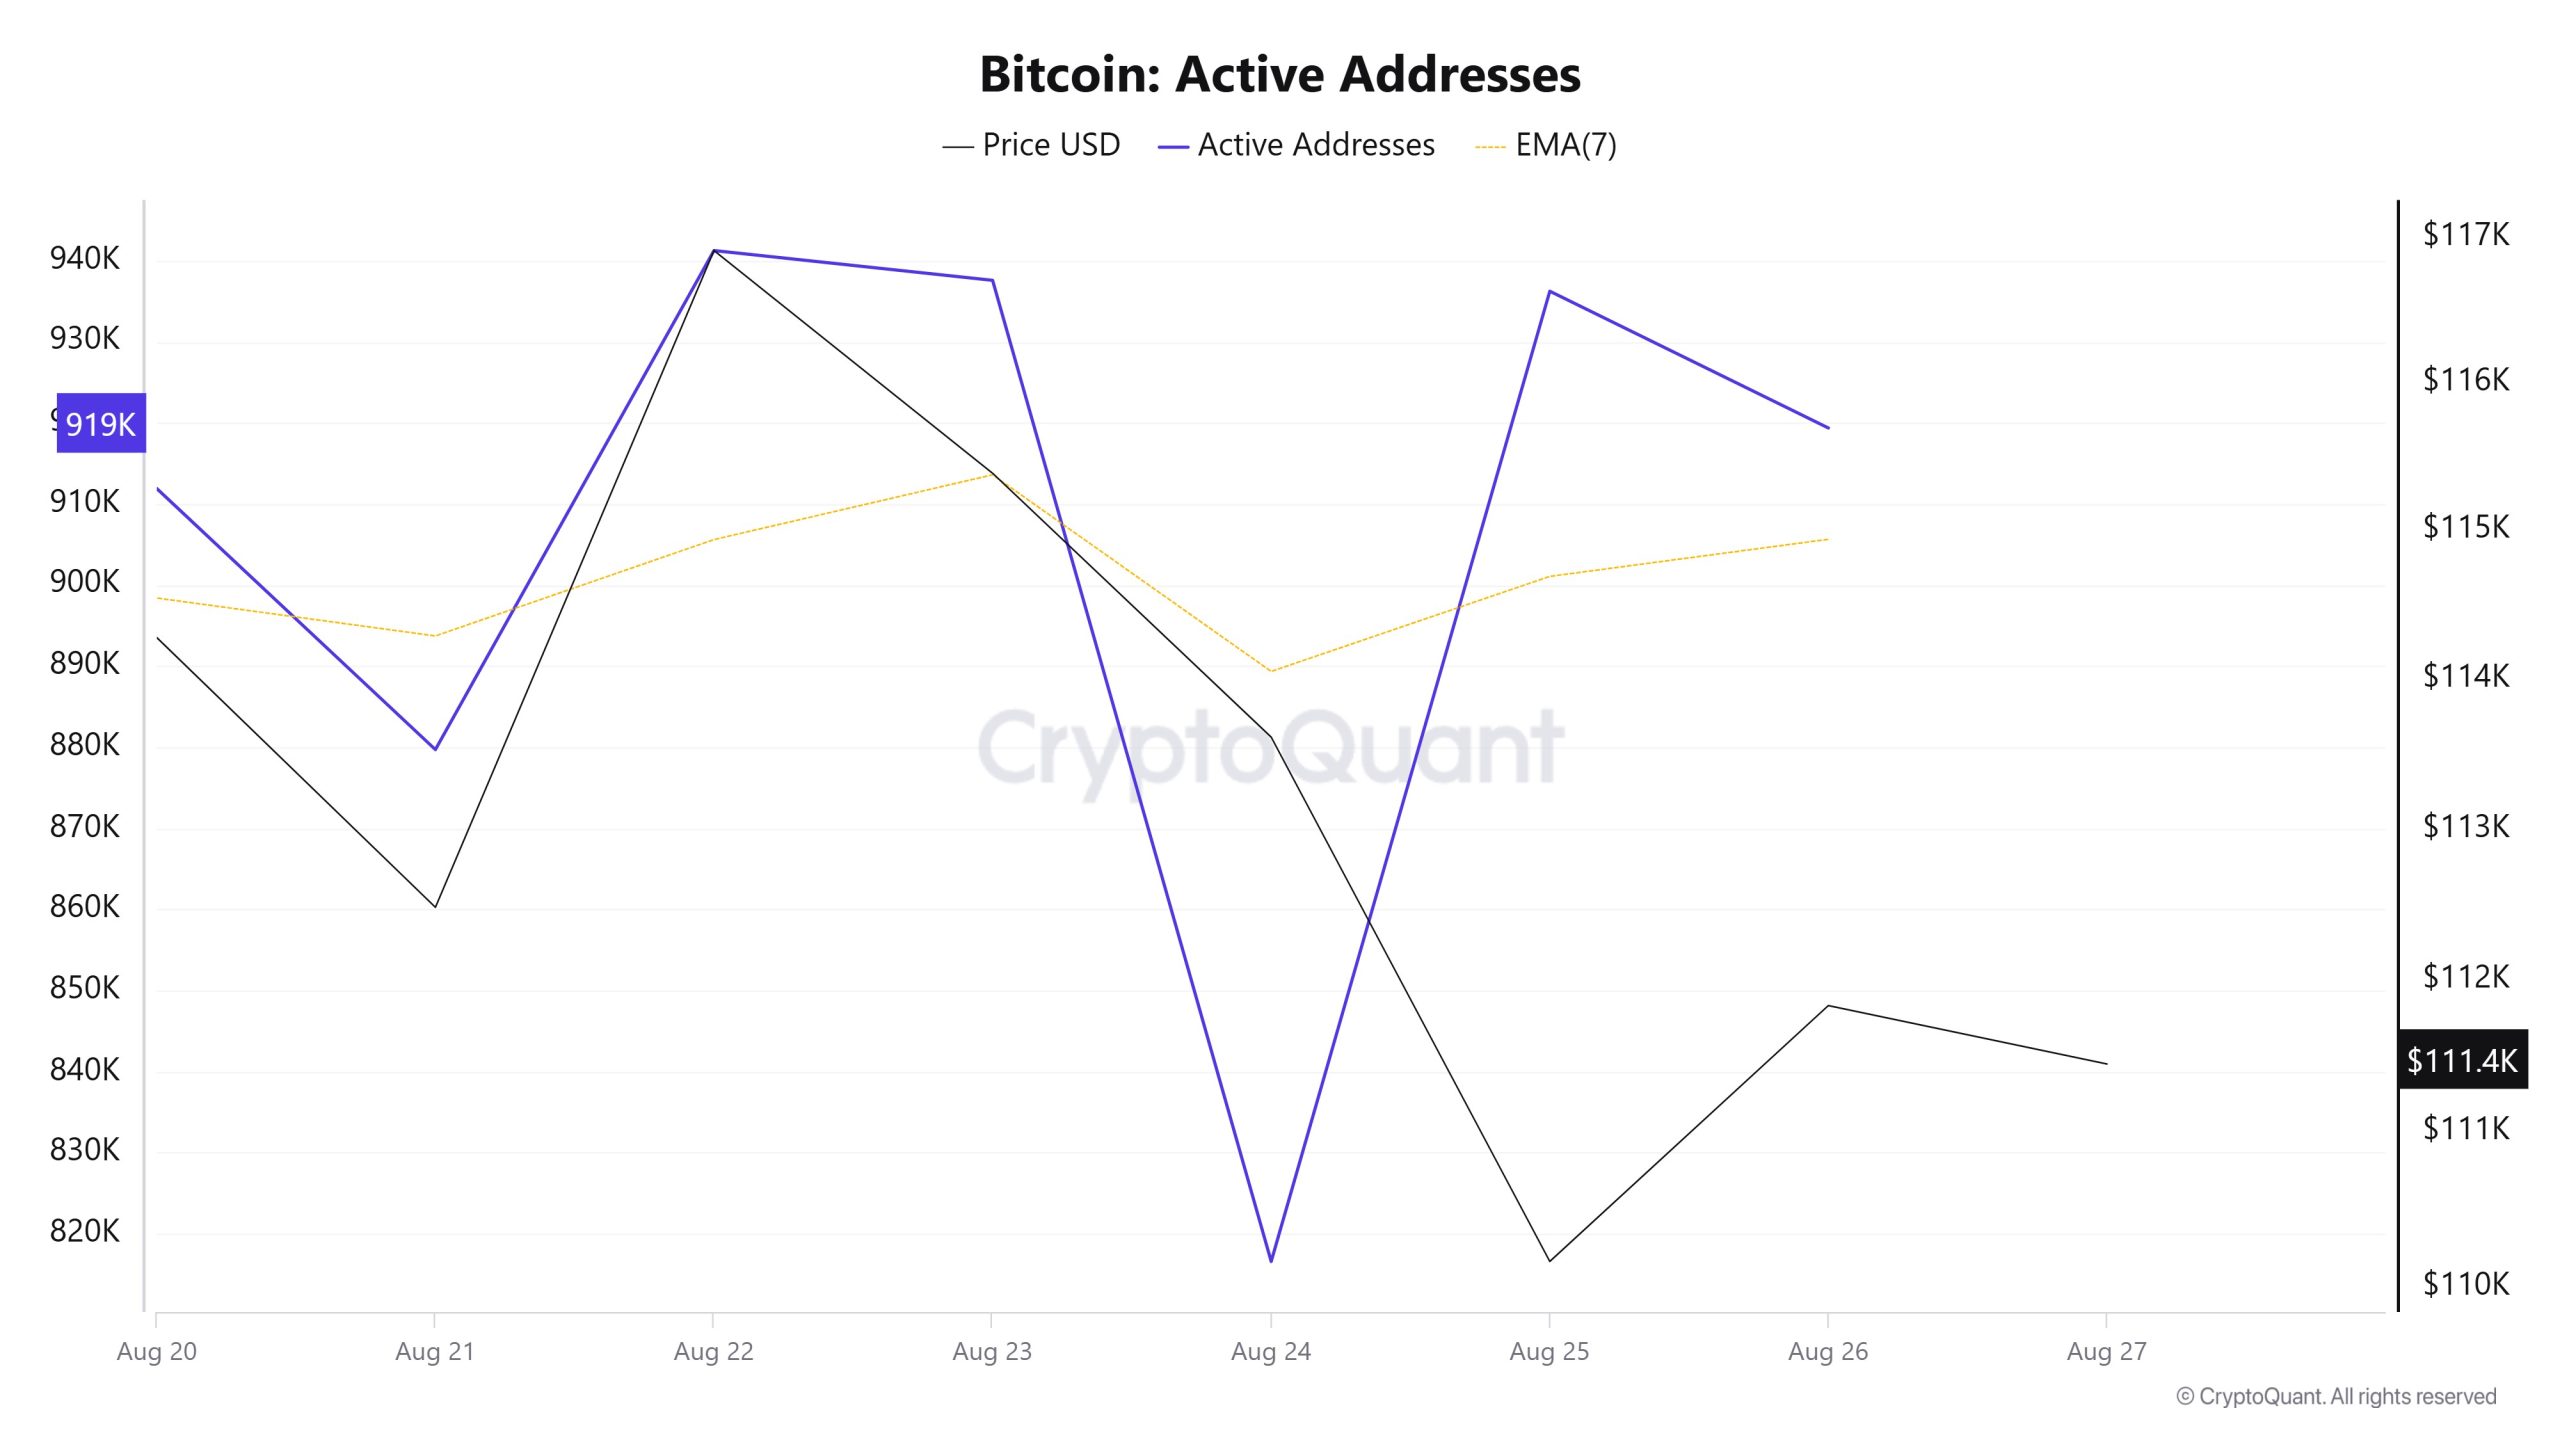
Between August 20 and August 27,941,248 active addresses entered the Bitcoin network. In this process, the Bitcoin price fell to the level of $110,000. Especially on August 24, the decline in the number of active addresses was observed to move the price downwards towards $110,000. From a technical perspective, it is noteworthy that downward movements were experienced at the point where the 7-day simple moving average (SMA) intersected the price on August 23. This technical signal indicates a sell-off on the market.
Active Sending Addresses
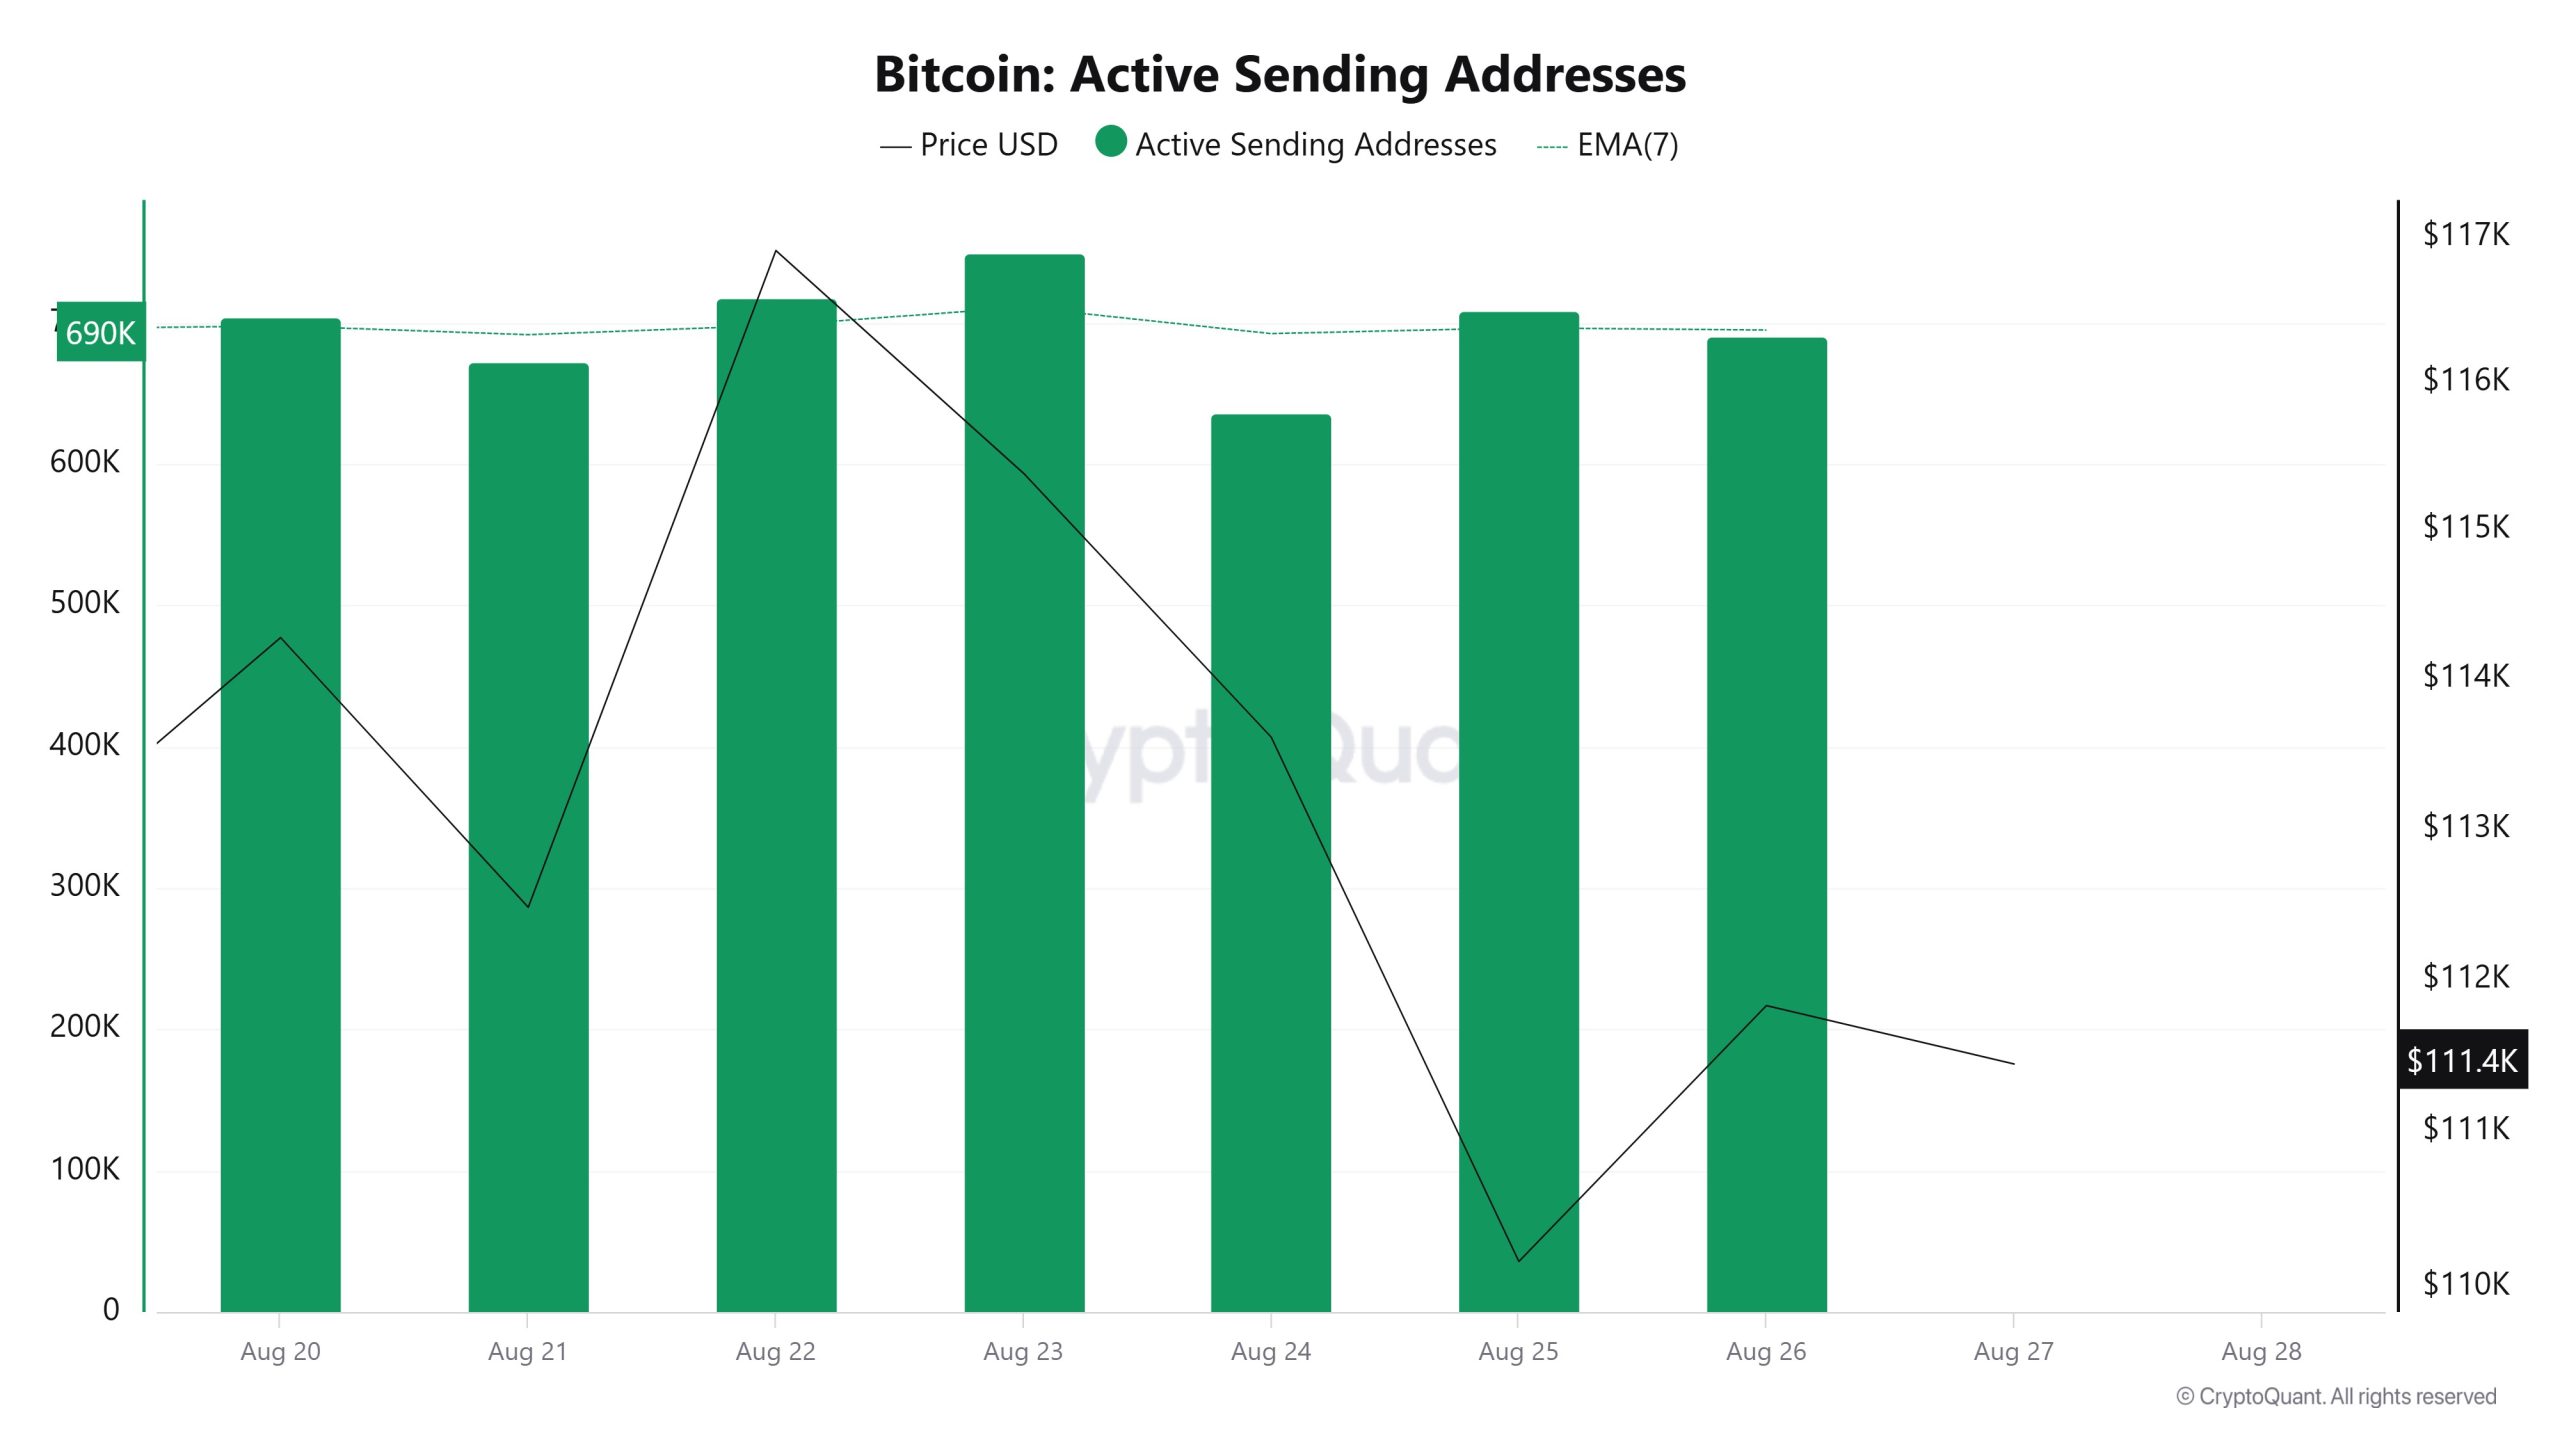
Between August 20 and August 27, a bearish trend was observed in the “Active Sending Addresses” metric. On the day of the price peak, this metric stood at 717,997, indicating that user activity on the Bitcoin network has moved in tandem with the price. This data suggests that the $110,000 level is supported on a bearish basis, not only in terms of price, but also in terms of on-chain address activity. Overall, the Active Sending Addresses metric trended downwards during this period.
Active Receiving Addresses
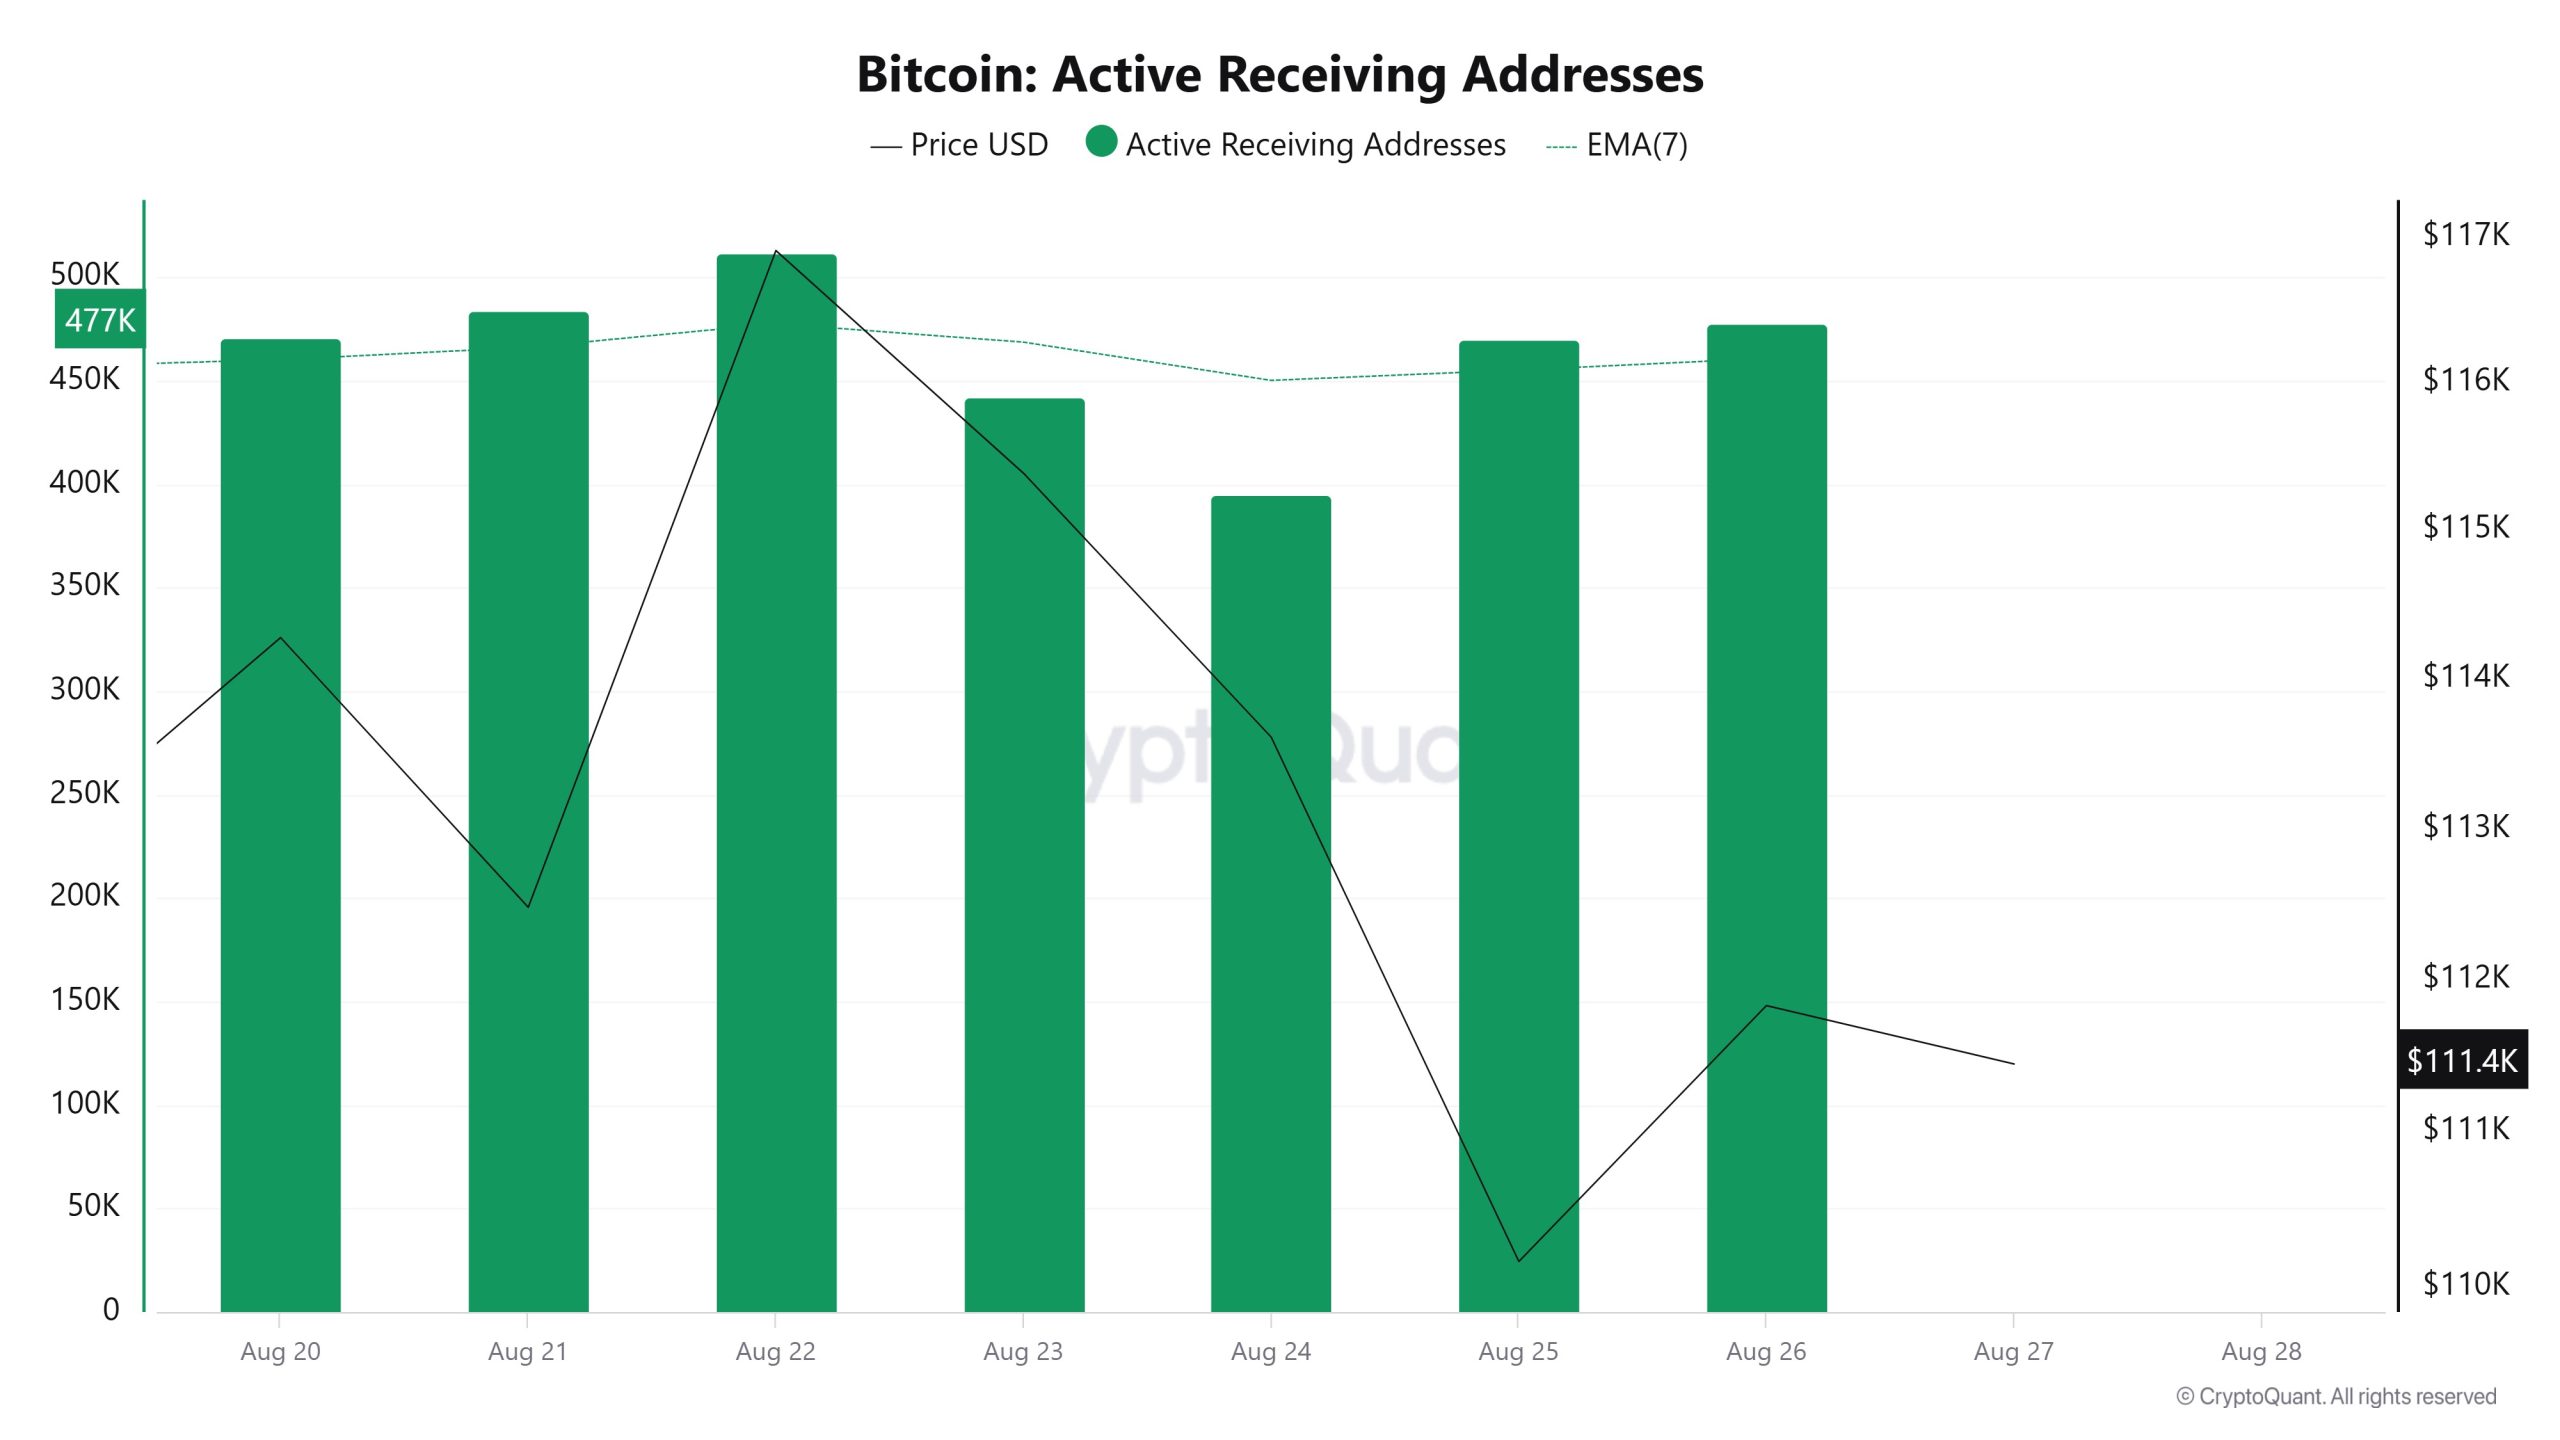
Between August 1320 and August 27, there was a regular decline in active buy addresses with the Black Line (price line). On the day of the price low, active receiving addresses fell as low as 470,312, indicating that sellers were selling Bitcoin at $110,000.
Breakdowns
MRVR
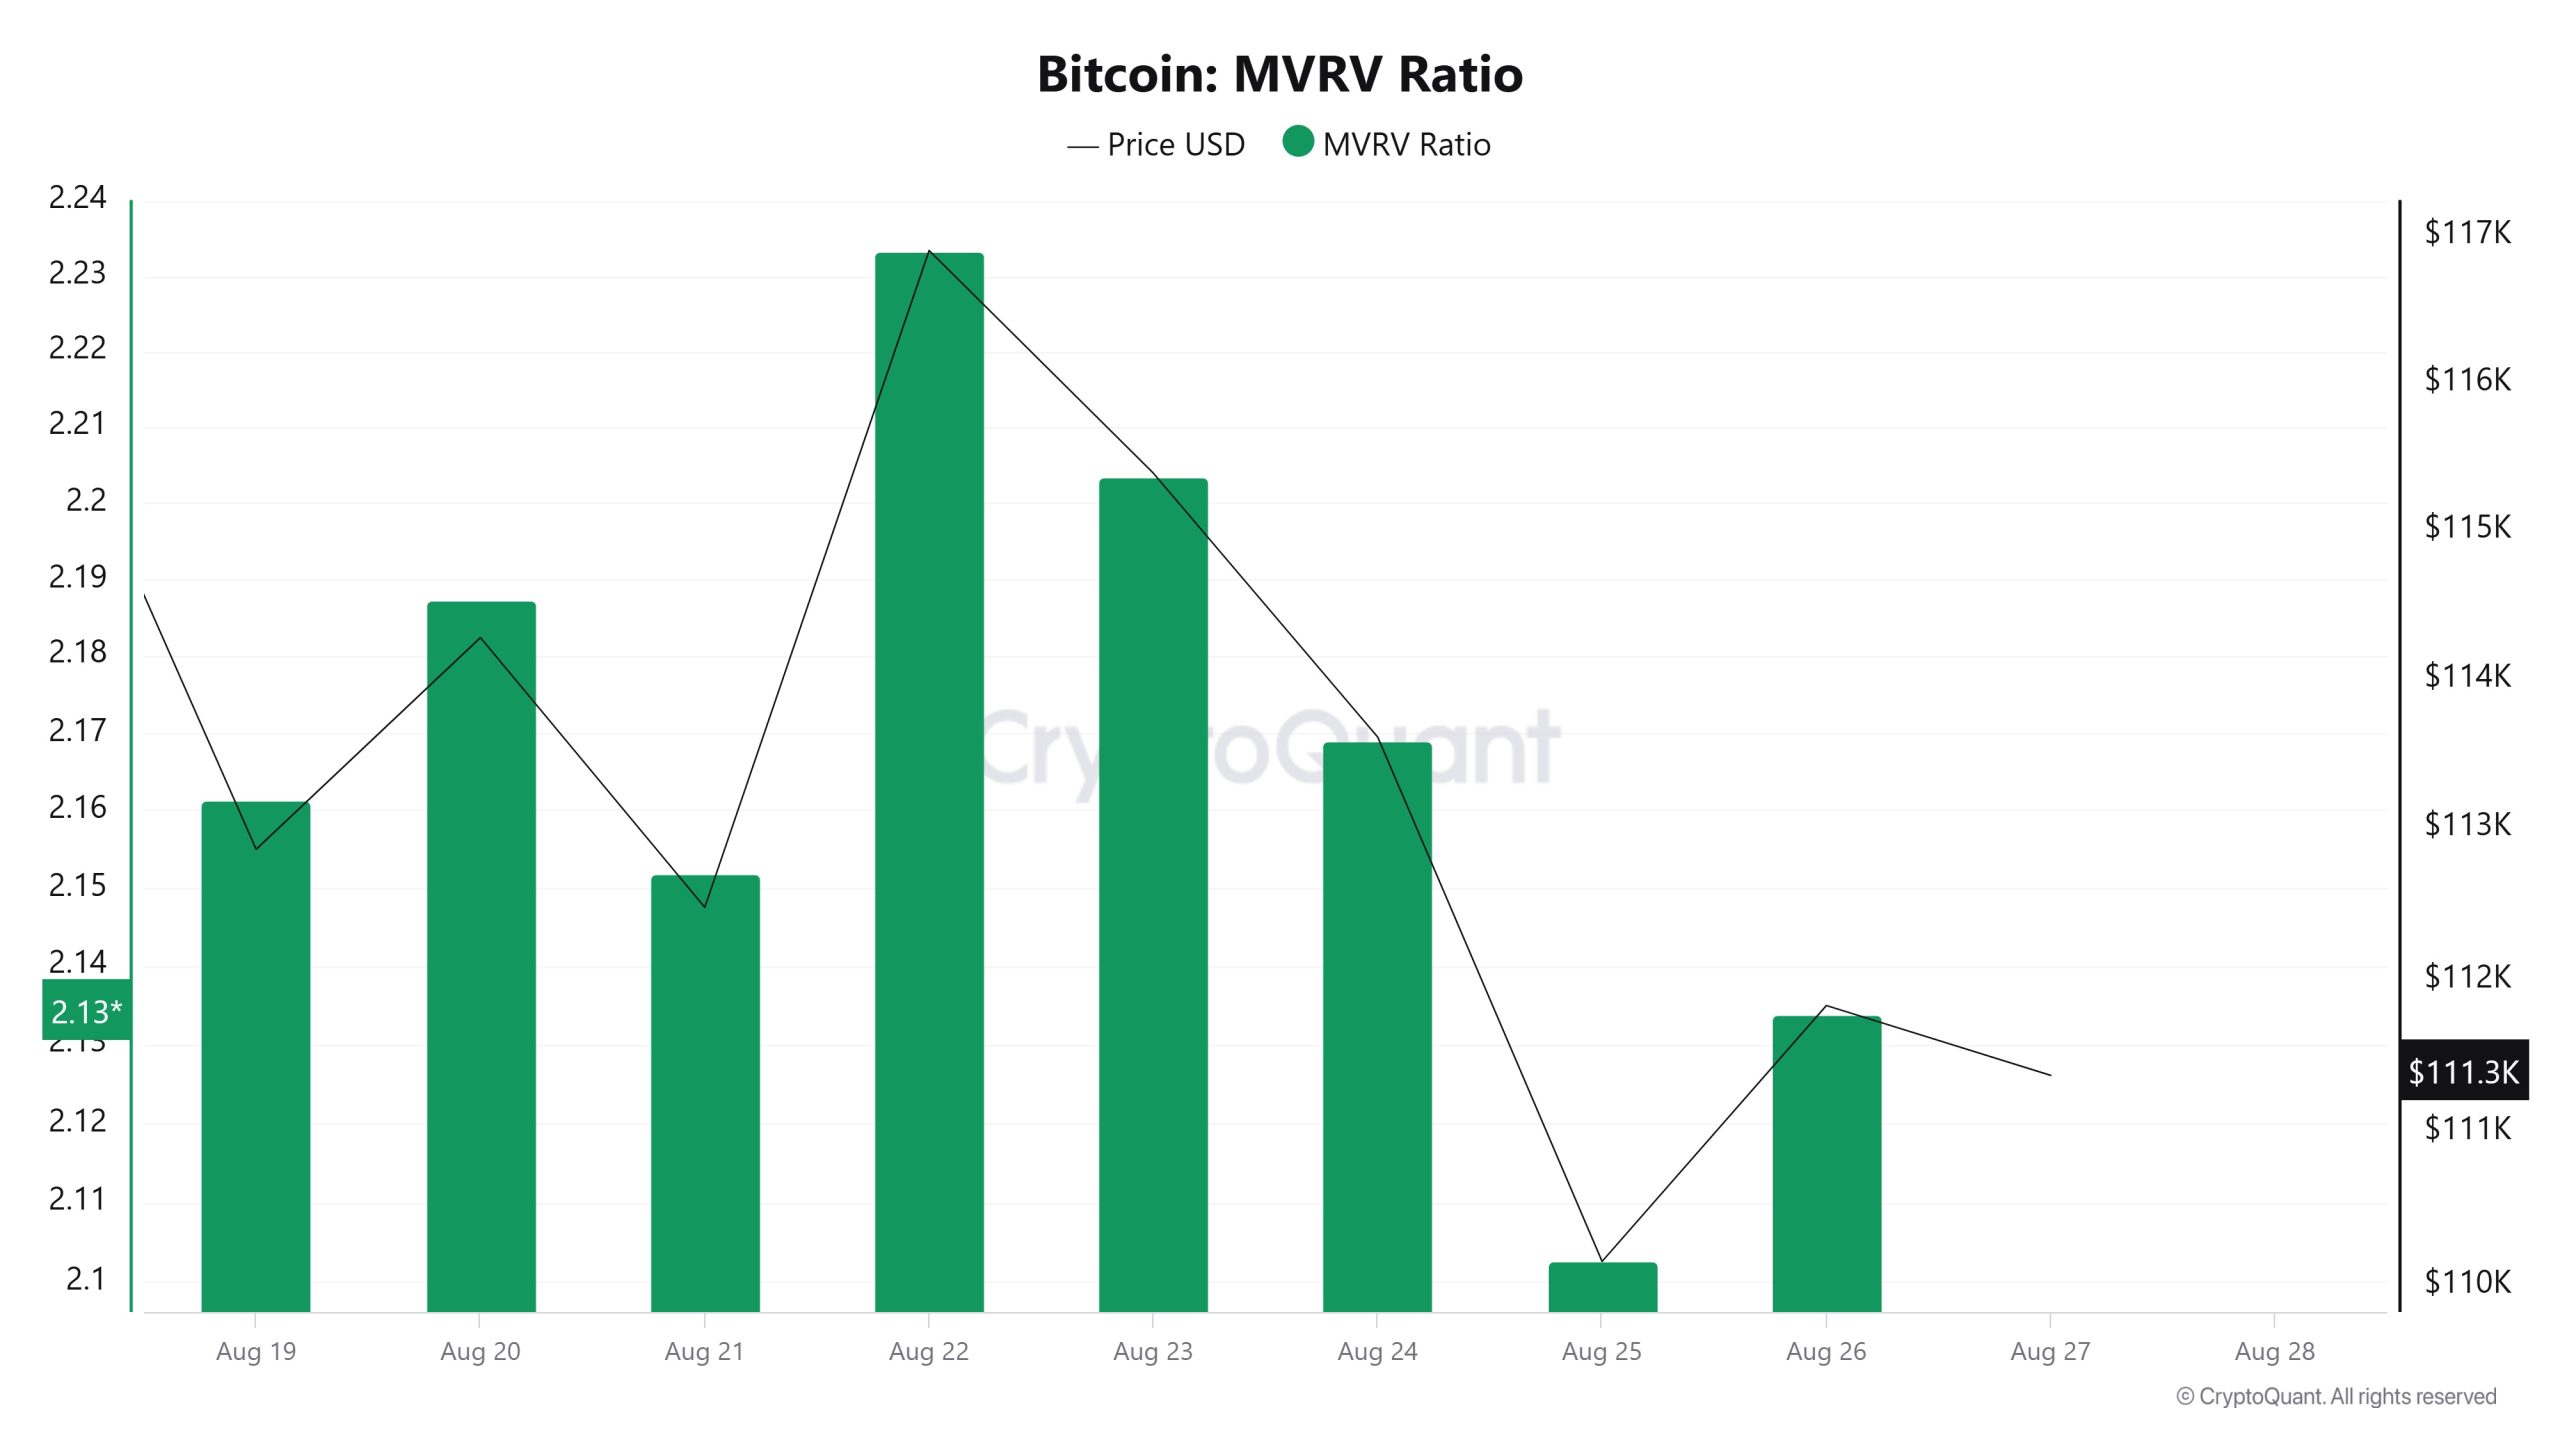
On August 20, the Bitcoin price was at $114,274 while the MVRV Ratio was 2.187. As of August 26, the Bitcoin price fell 2.14% to $111,828, while the MVRV Ratio fell 2.47% to 2.133.
Realized Price
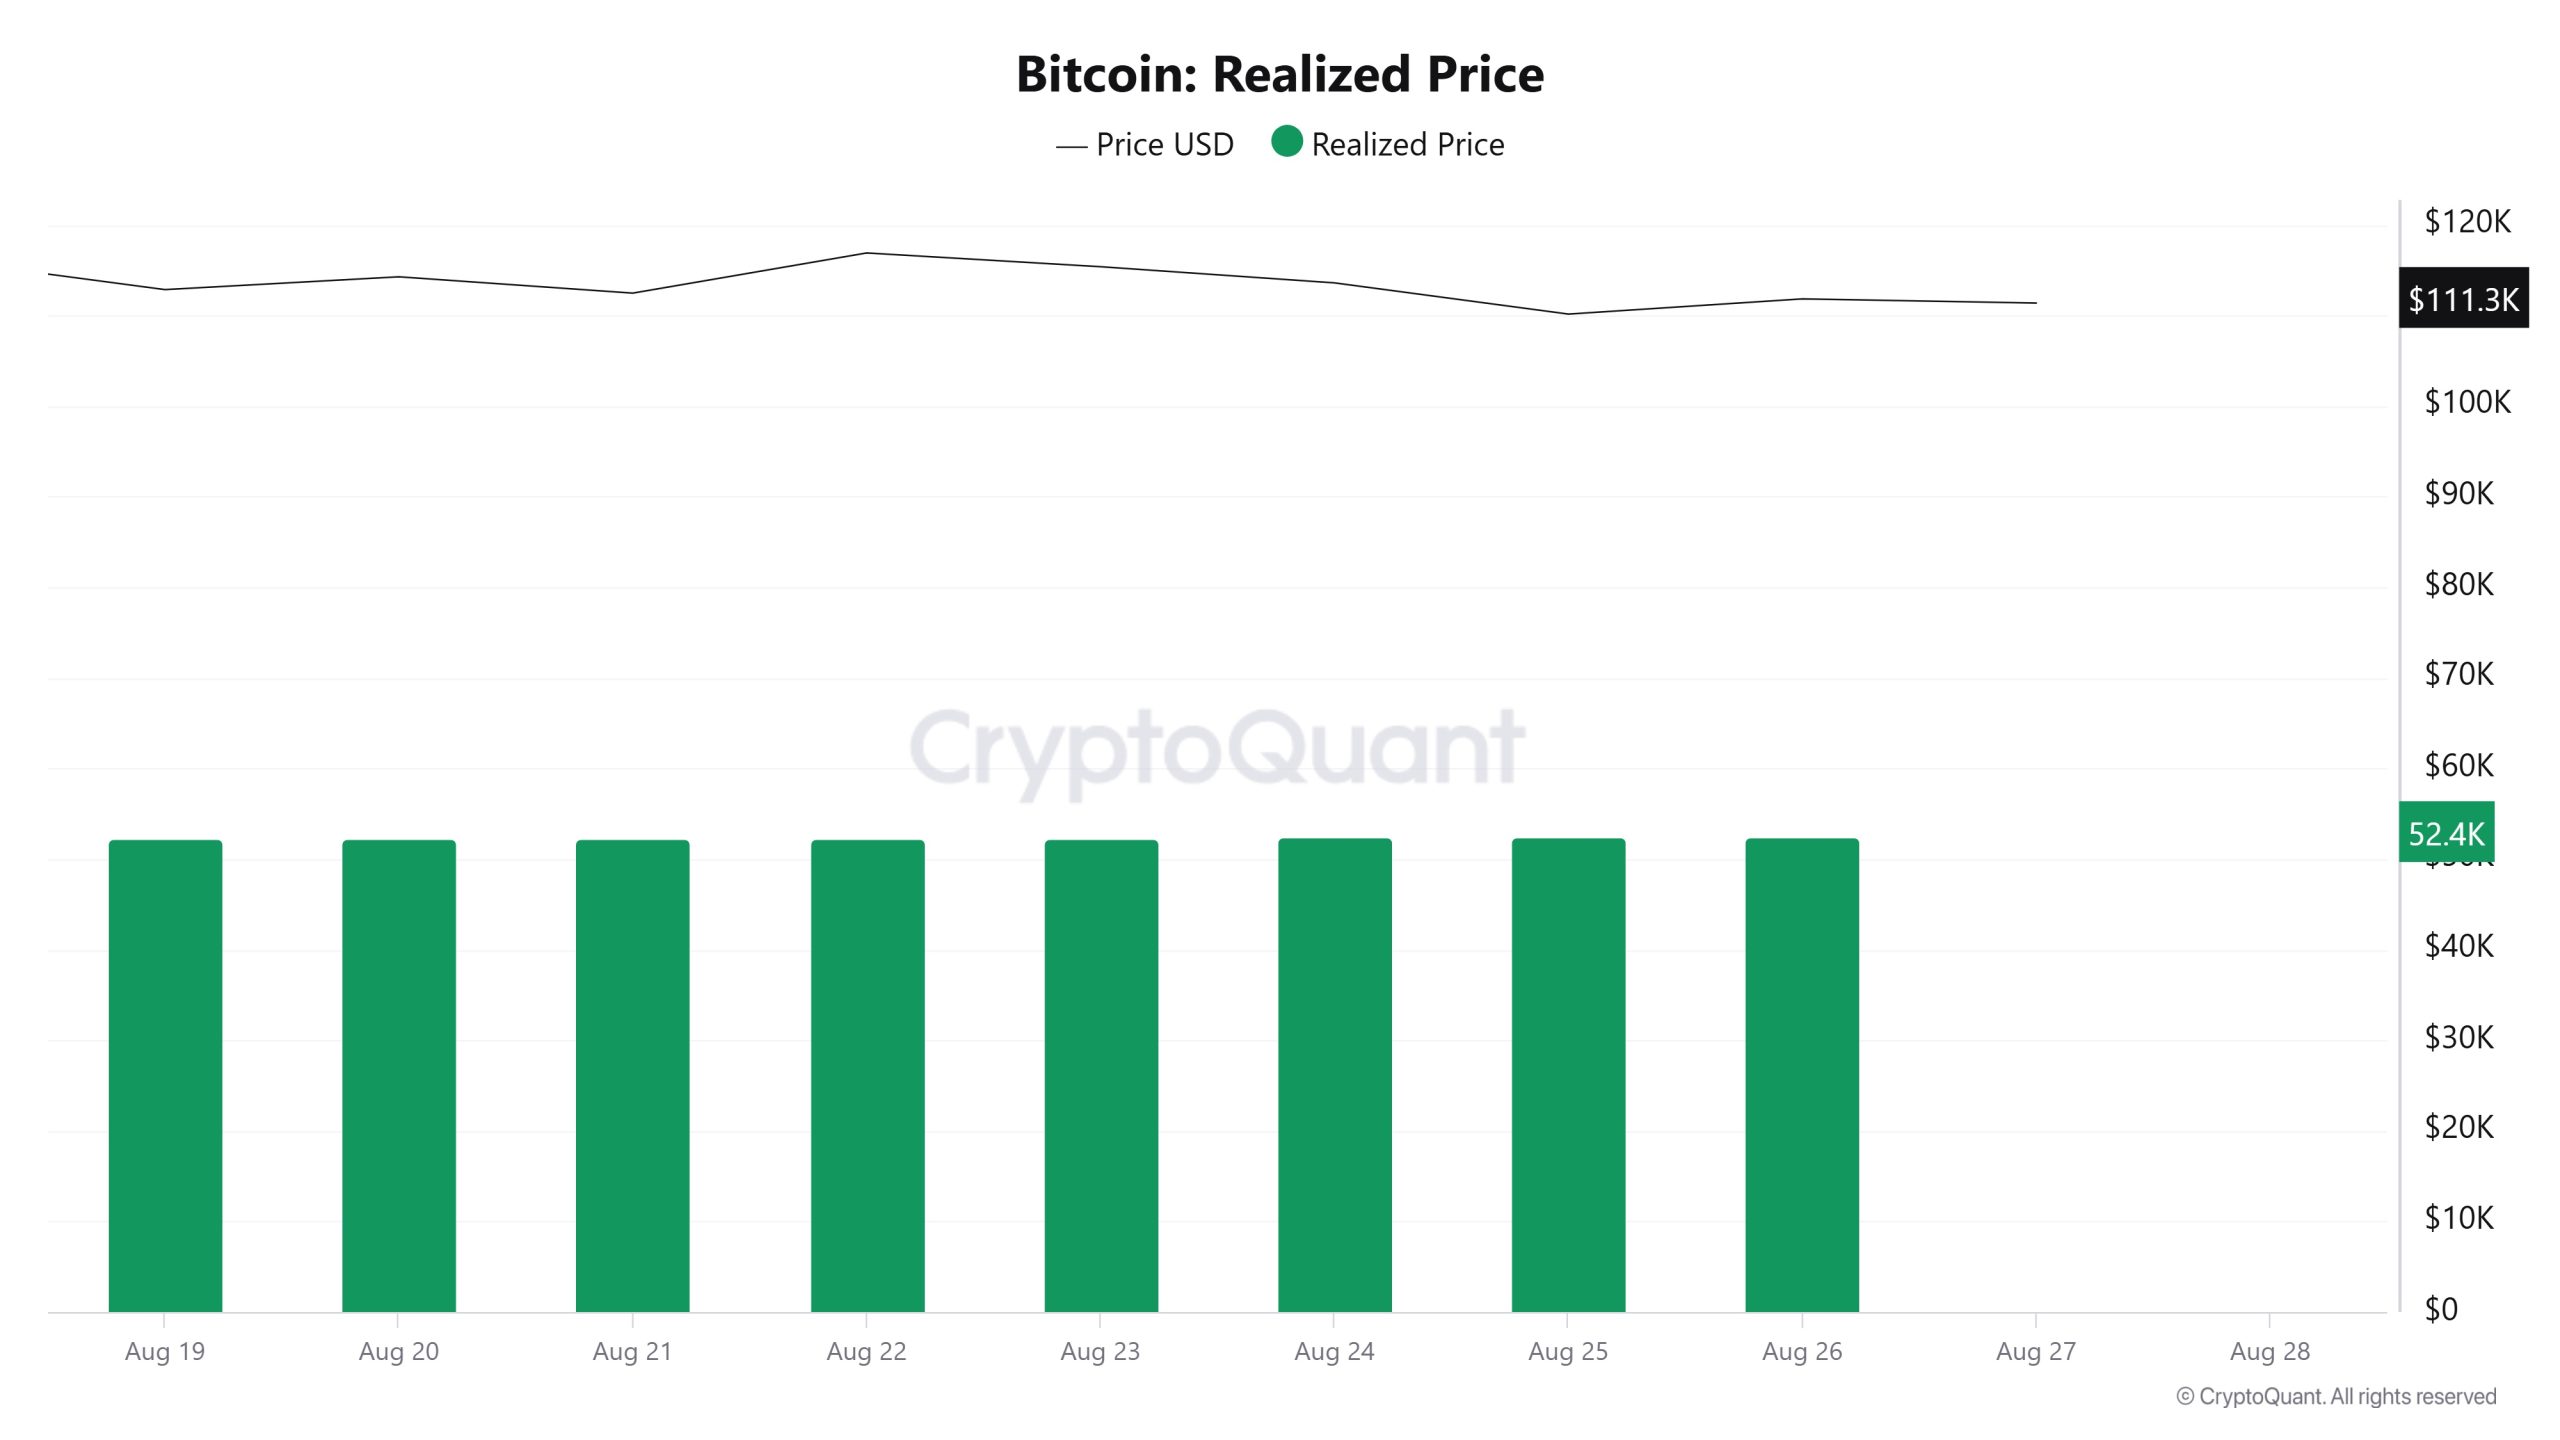
On August 20, the Bitcoin price was at $114,274 while the Realized Price was 52,244. As of August 26, Bitcoin price fell 2.14% to $111,828, while Realized Price rose 0.32% to 52,409.
Spent Output Profit Ratio (SOPR)
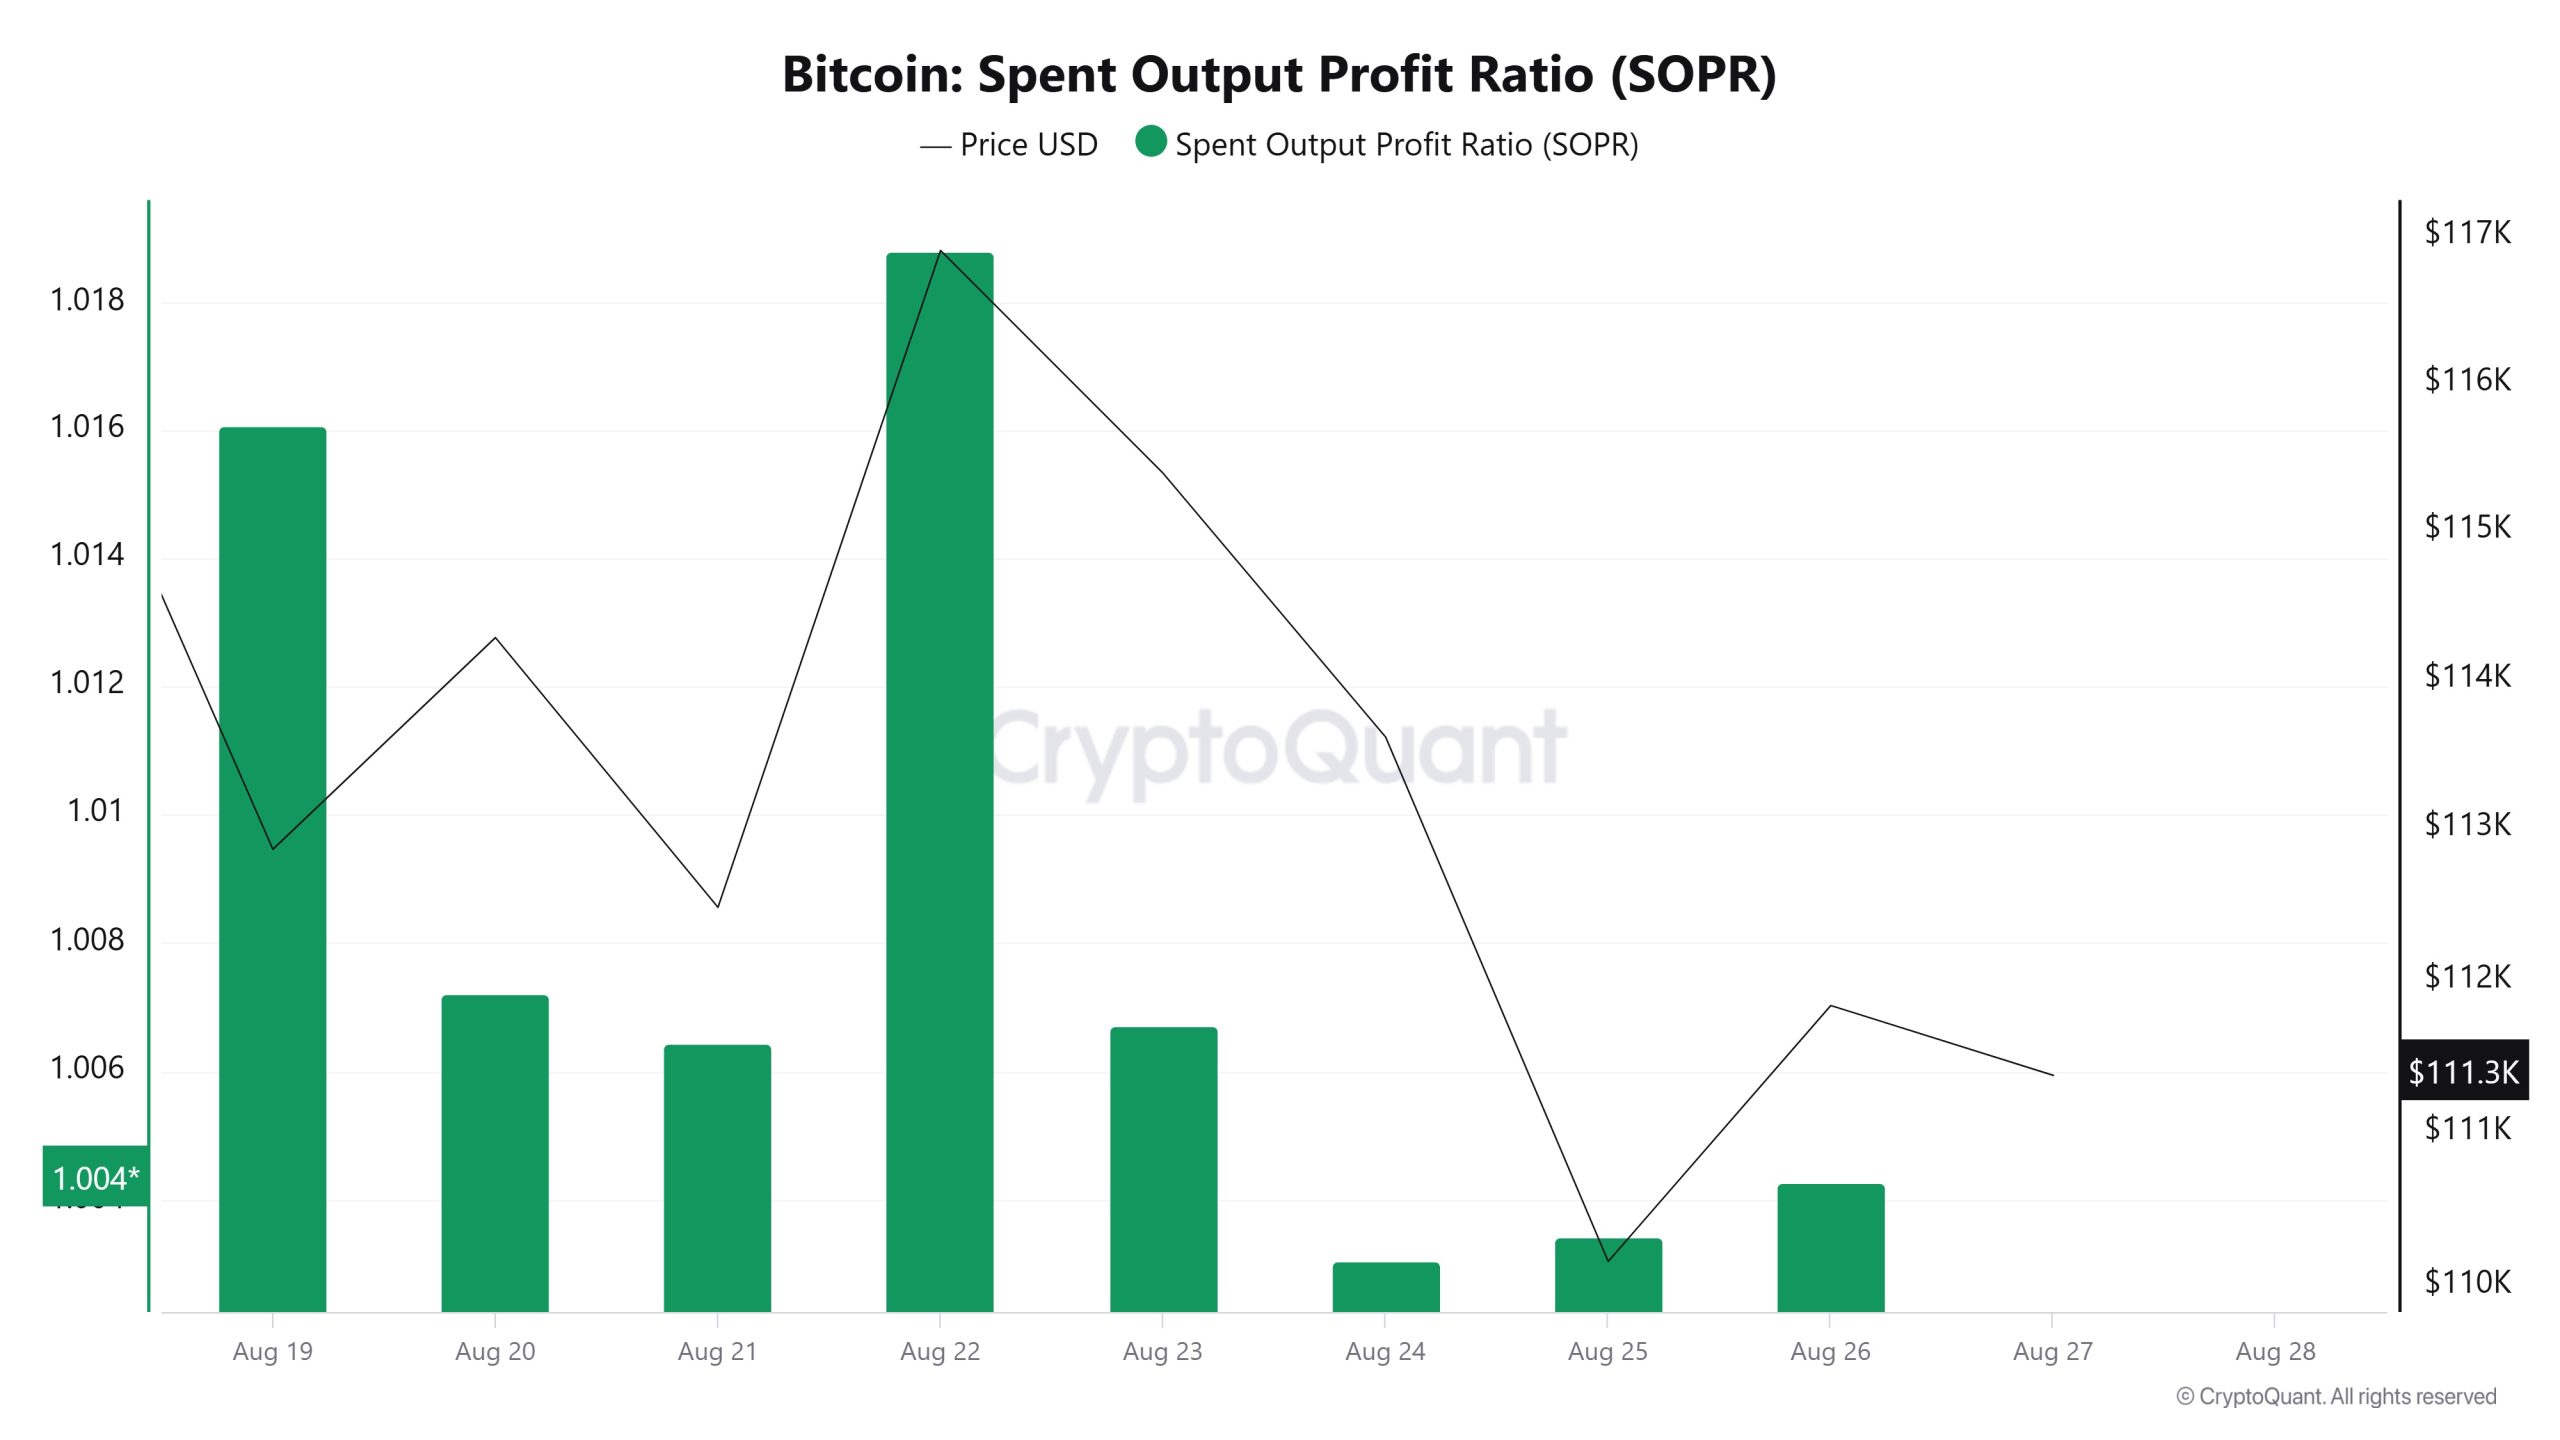
On August 20, the Bitcoin price was at $114,274 while the SOPR metric was at 1.007. As of August 26, the Bitcoin price fell 2.14% to $111,828, while the SOPR metric fell 0.30% to 1,004.
Derivatives
Open Interest
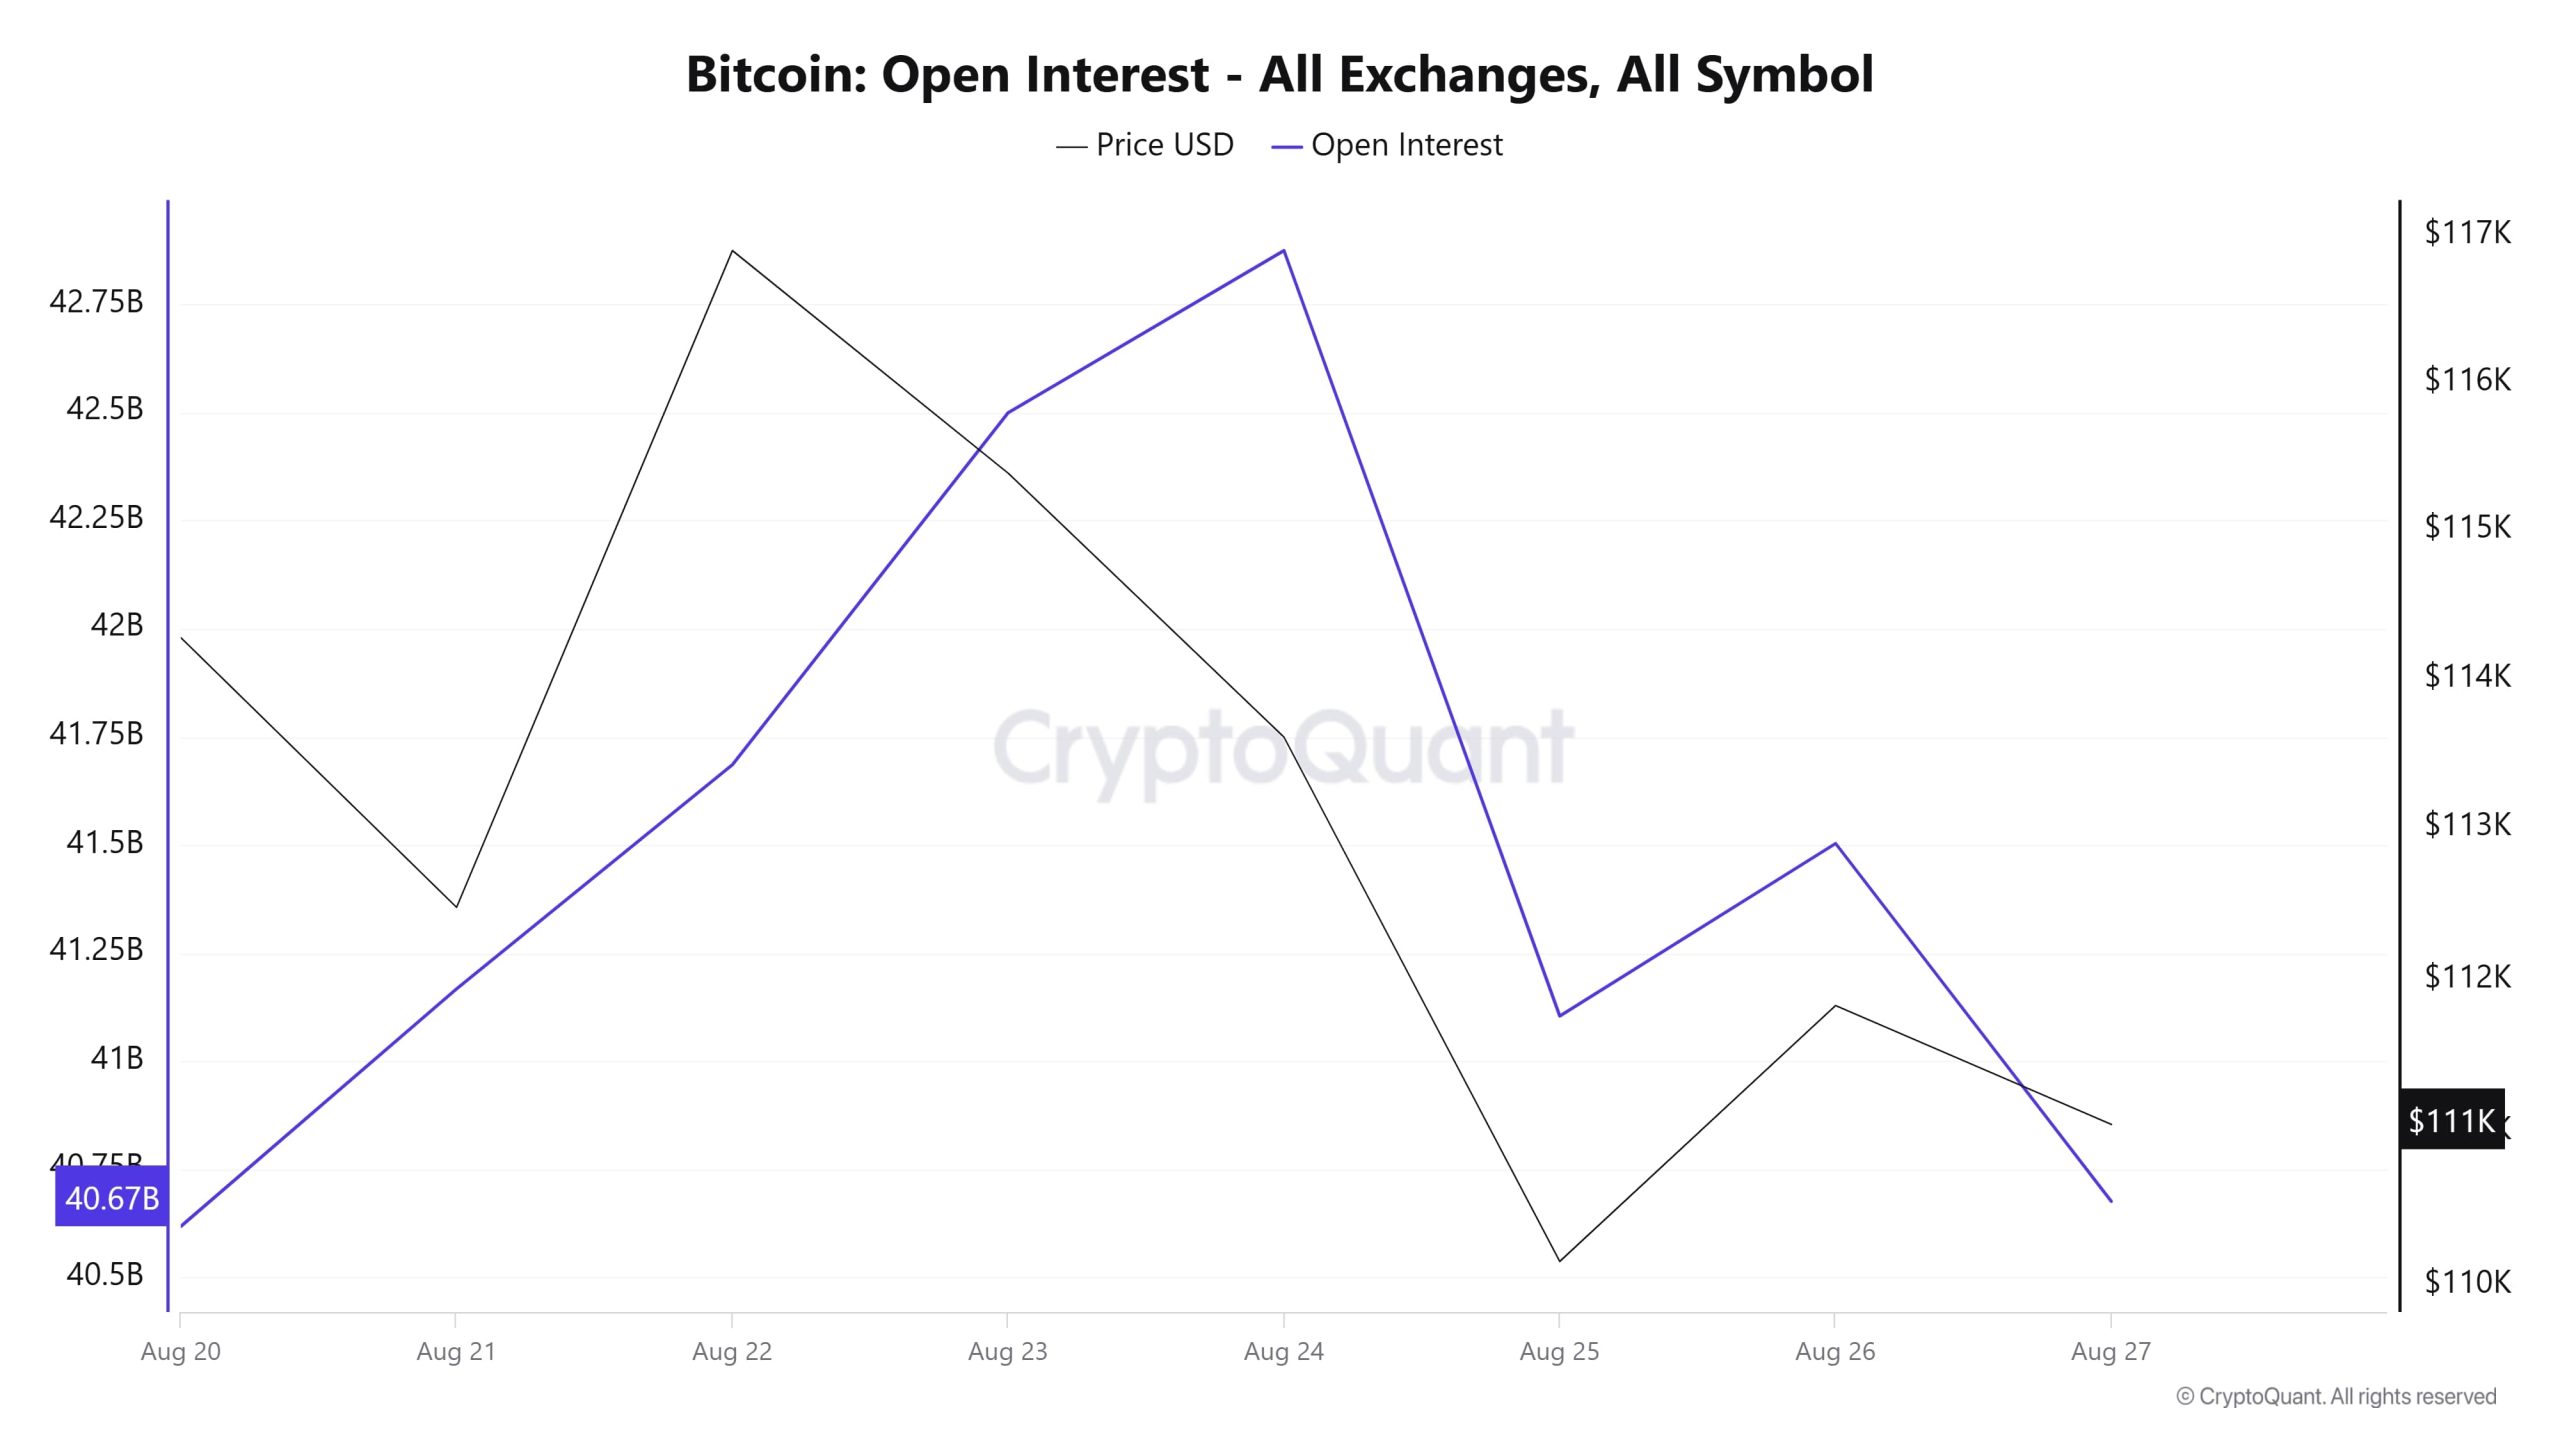
On August 20, open interest, which was $40.67 billion, moved upwards with the price, rising to around $42.75 billion on August 24. In this process, the price also peaked near $117,000, but after this rise, a rapid retracement was seen. As of August 25, with the price falling to around $110,000, open interest also fell sharply to below $41 billion. In the last two days, both price and OI have shown a recovery trend, but there is no strong momentum yet. This outlook suggests that short-term uncertainty persists in the market and volatility is at the forefront. In particular, the sharp ups and downs in open interest indicate that leveraged positions are closing quickly and traders are acting cautiously.
Funding Rate
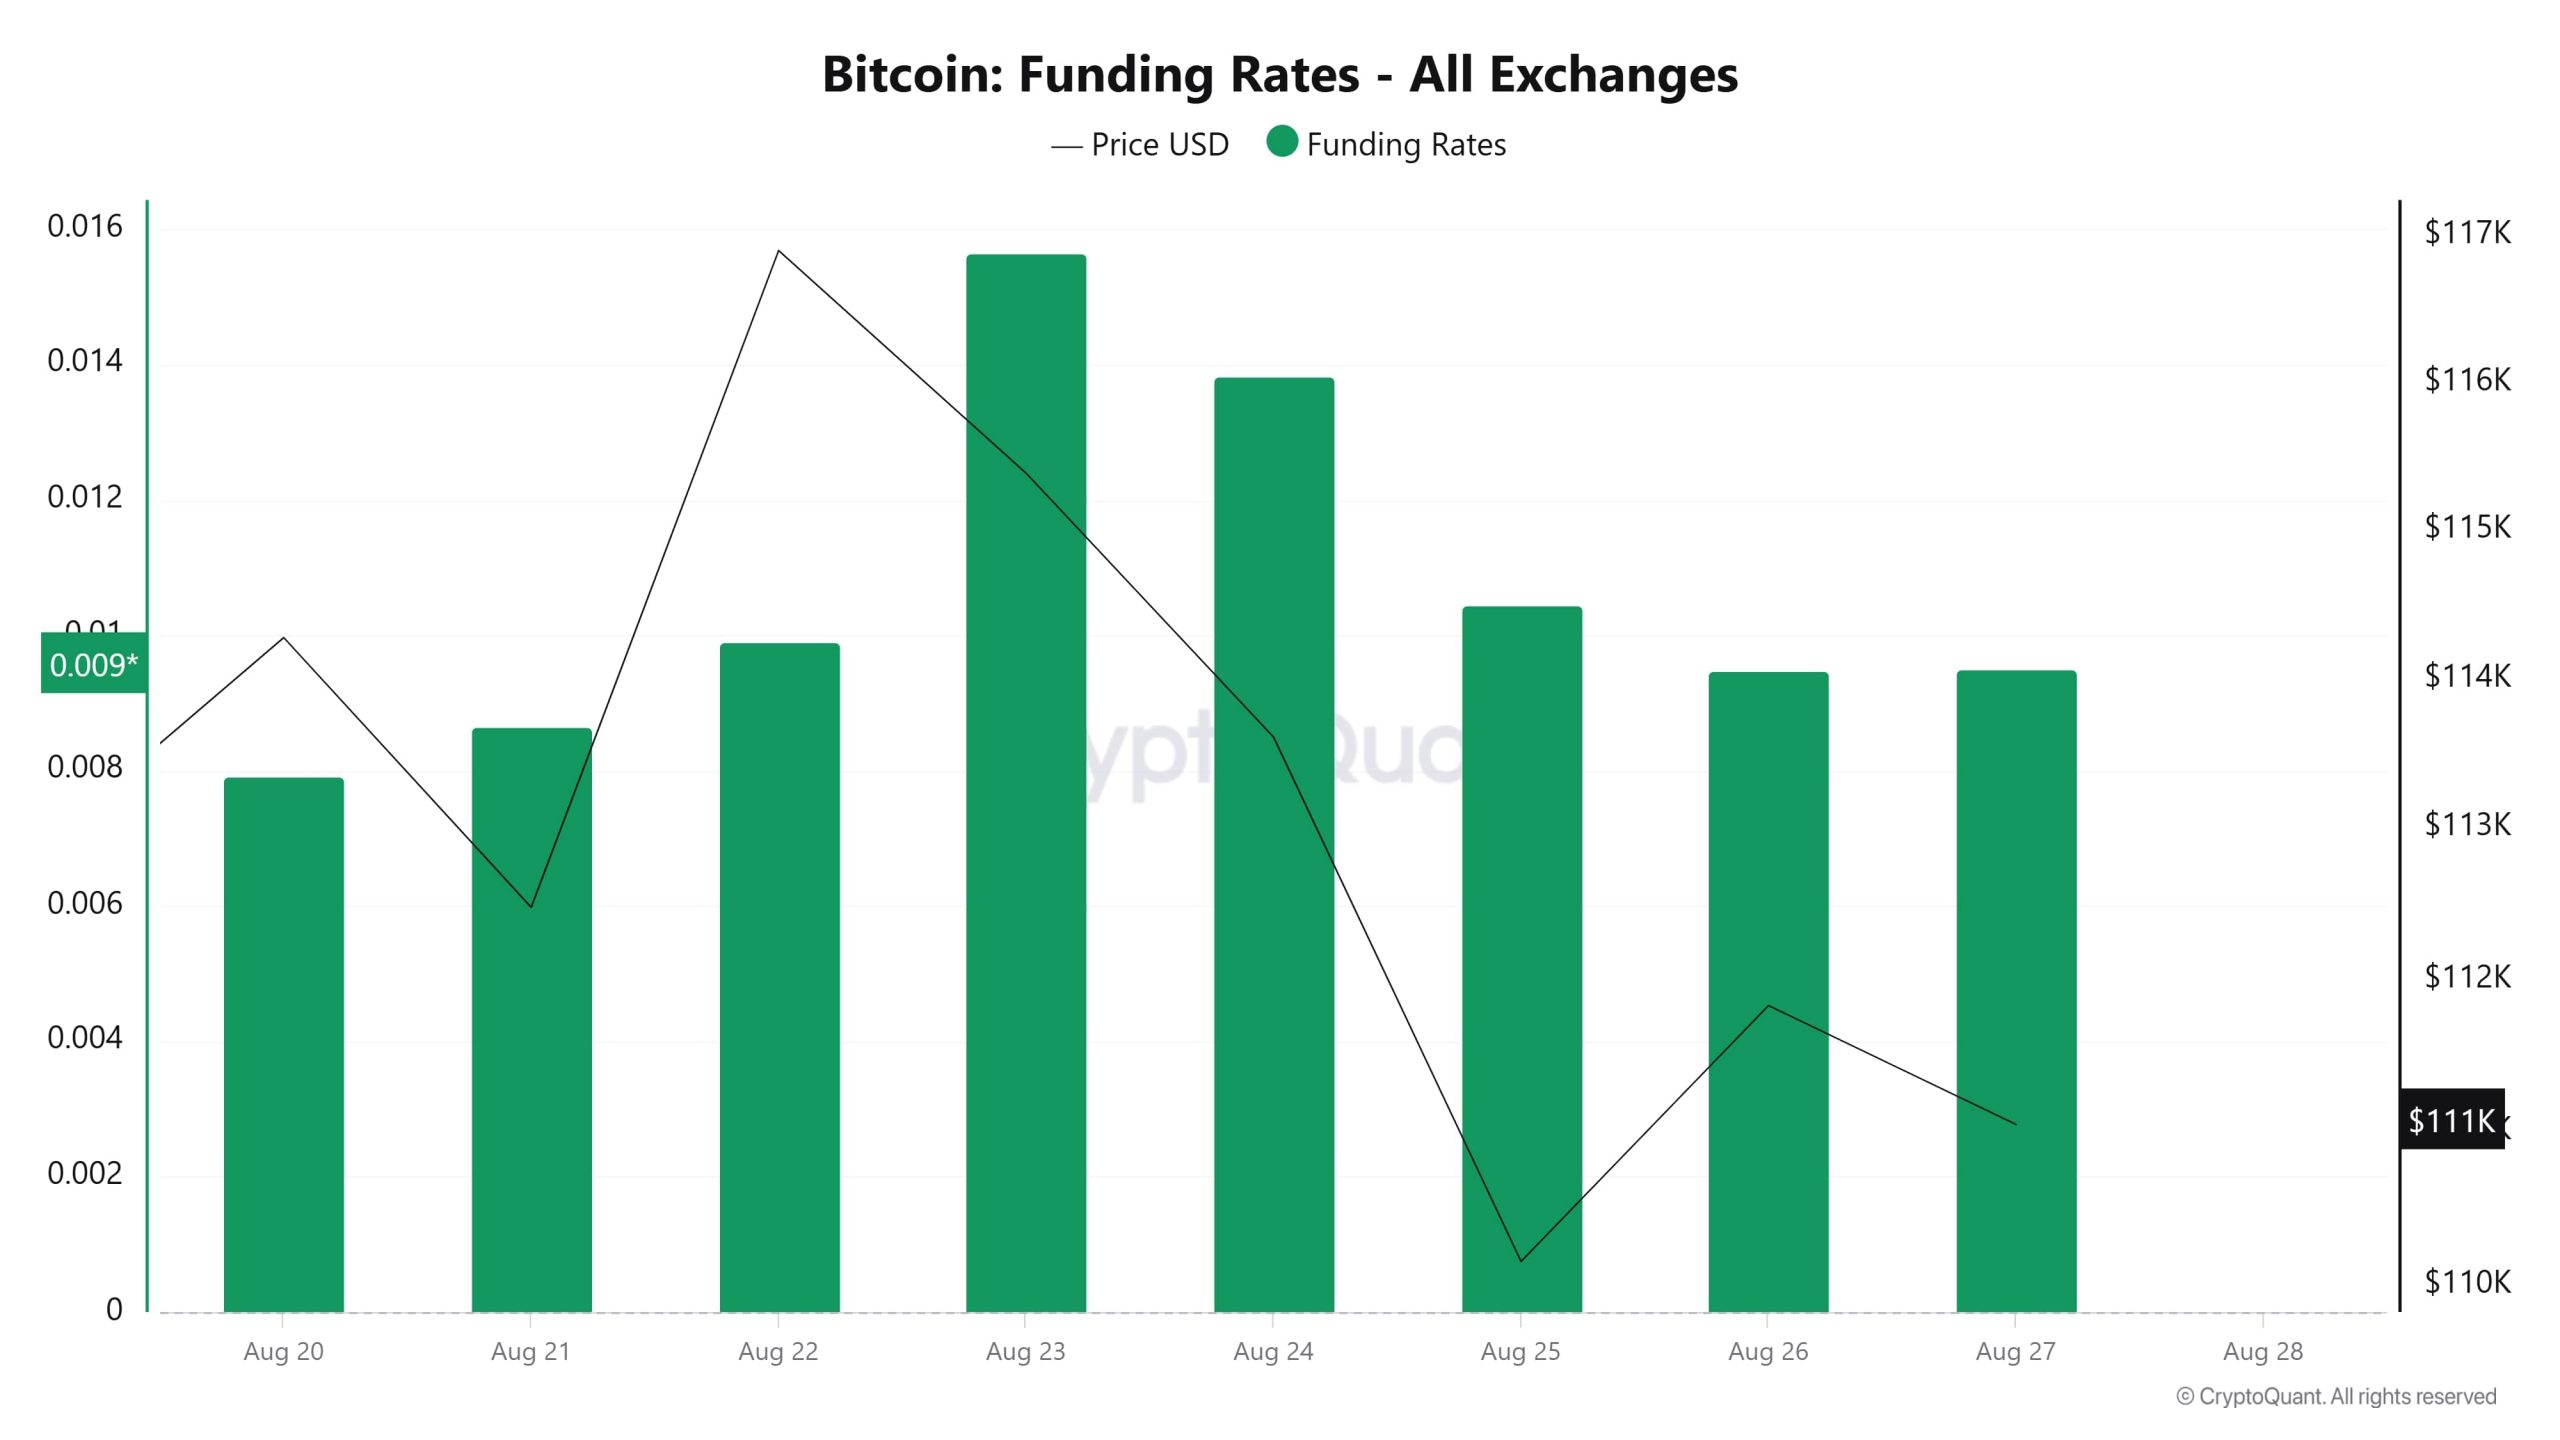
When Bitcoin’s funding rates and price movements are analyzed together in the chart, the short-term trend of the market clearly stands out. Starting at 0.008 on August 20, the rates climbed to 0.015 on August 23 in parallel with the rise in the price. In this process, the price approached the $117,000 level, indicating an increase in demand for long positions. However, as the price retreated after August 24, funding ratios gradually declined and reached almost neutral levels on August 25. Although the price has recovered somewhat in the last two days, funding rates have remained at low levels, indicating that traders are cautious and the market is still undecided. The overall picture shows that the volume of leveraged long positions has decreased, and traders are waiting for a new catalyst for a clear direction.
Long & Short Liquidations
With the BTC price falling from $117,500 to $108,700 last week, mainly long positions were liquidated. Approximately 940 million dollars of long and 193 million dollars of short transactions were liquidated.
| Date | Long Amount ($M) | Short Amount ($M) |
|---|---|---|
| August 20 | 26.50 | 63.44 |
| August 21 | 71.44 | 12.14 |
| August 22 | 84.78 | 60.86 |
| August 23 | 24.40 | 2.40 |
| August 24 | 119.91 | 9.24 |
| August 25 | 477.50 | 16.30 |
| August 26 | 135.65 | 29.45 |
| Total | 940.18 | 193.83 |
Supply Distribution
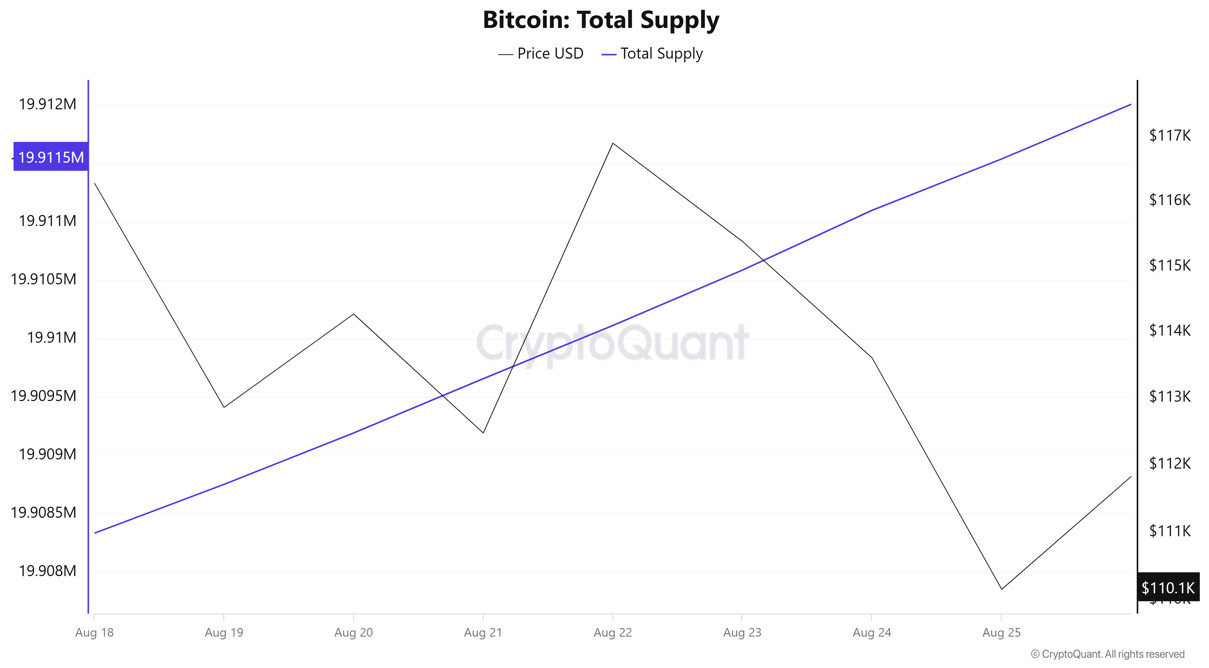
Total Supply: 19,911,542 units, up about 0.0324% from last week.
New Supply: The amount of BTC produced this week amounted to 6,451.
Velocity: Velocity, which was 12.45 last week, was 12.41 as of August 25.
| Wallet Category | 18-Aug-2025 | 25-Aug-2025 | Change (%) |
|---|---|---|---|
| < 1 BTC | 8.4533% | 8.4614% | 0.096% |
| 1 – 10 BTC | 11.3890% | 11.4039% | 0.131% |
| 10 – 100 BTC | 24.5804% | 24.5885% | 0.033% |
| 100 – 1k BTC | 29.4620% | 29.5614% | 0.338% |
| 1k – 10k BTC | 18.1395% | 18.1180% | -0.118% |
| 10k+ BTC | 7.9754% | 7.8664% | -1.365% |
According to the latest weekly data, a mixed outlook emerged in Bitcoin wallet distribution. While wallets holding less than 1 BTC saw a limited increase of 0.10%, wallets in the 1-10 BTC range increased by 0.13%. There was a slight increase of 0.03% in the 10-100 BTC group, while a more significant increase of 0.34% was recorded in the 100-1,000 BTC range. In contrast, wallets in the 1,000-10,000 BTC range experienced a limited 0.12% decline, while wallets over 10,000 BTC, which represent the largest investors, saw a remarkable 1.36% decline.
Exchange Supply Ratio
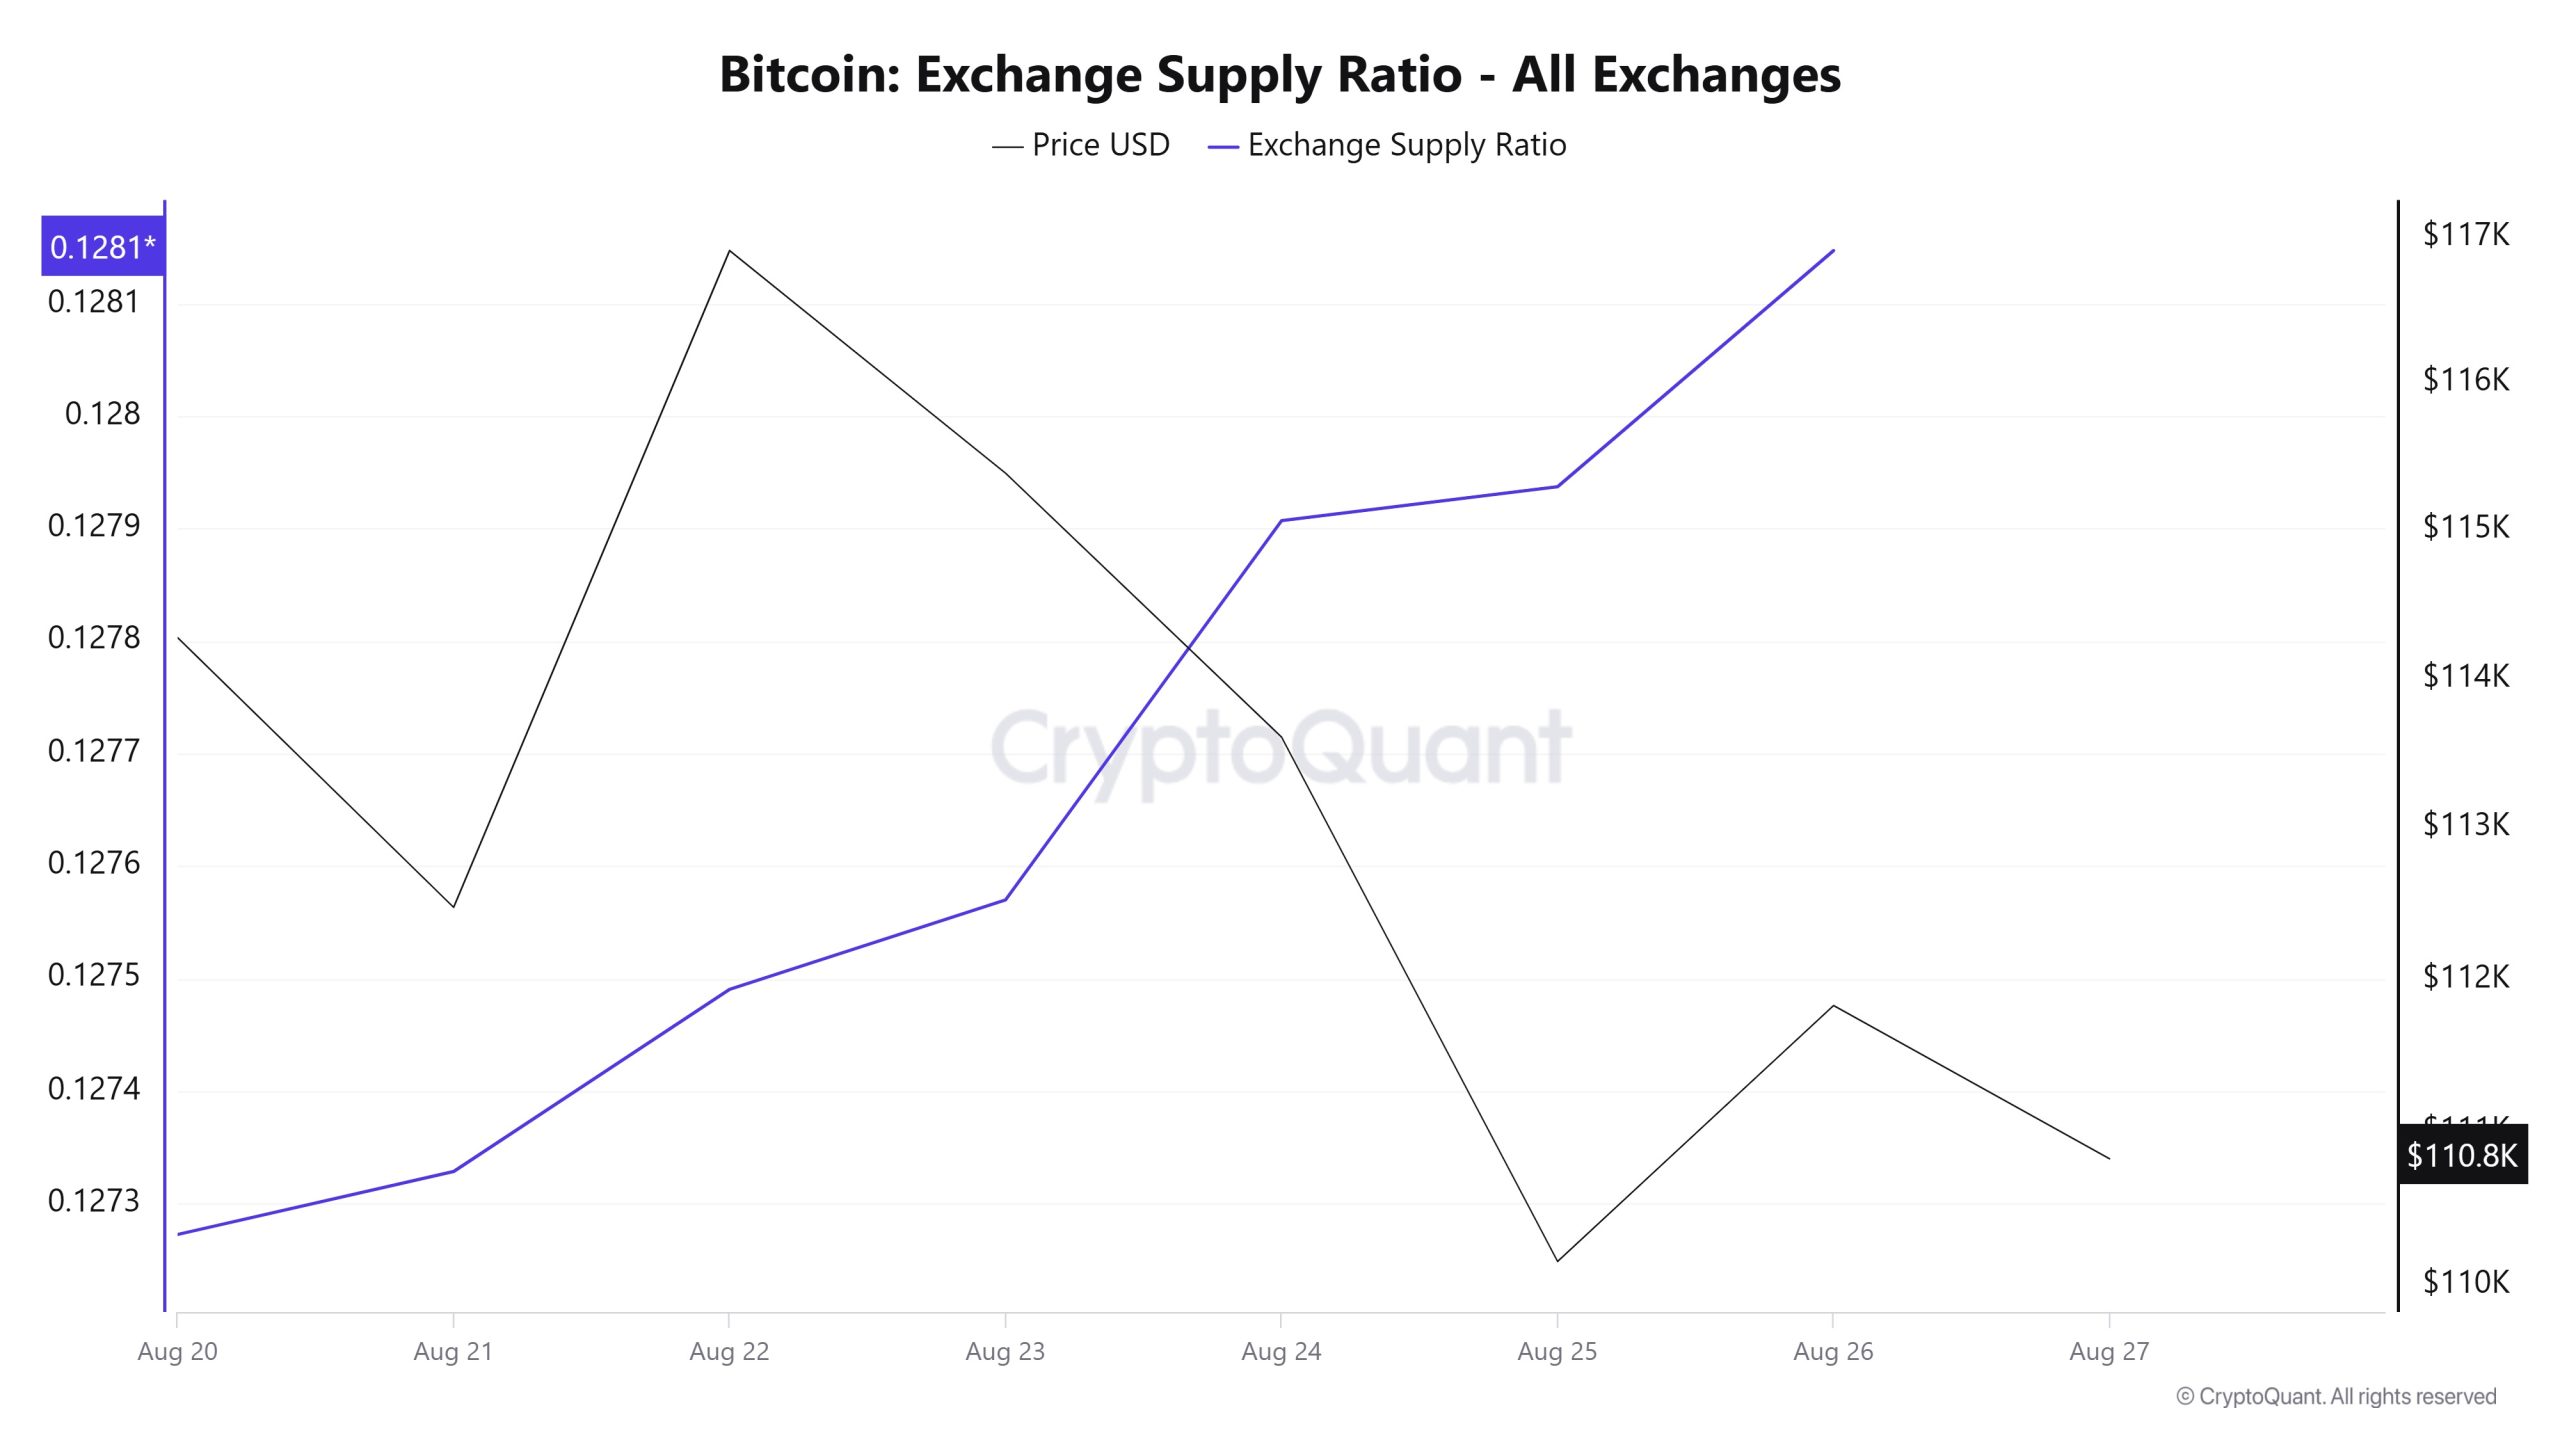
Data from the Bitcoin Exchange Supply Ratio table, which shows how much of Bitcoins are held on exchanges compared to the total supply of Bitcoins, showed low rates this week. This week’s data reveals that the general trend is for a negative correlation between the price of Bitcoin and the rate of supply entering exchanges. It shows that the majority of Bitcoins continue to be held in wallets and are not readily available for buying in the market.
Between August 20 and August 27, the Bitcoin Exchange Supply Ratio increased from 0.1279072 to 0.1281473. During this period, the Bitcoin price fell from $116,000 to $113,000. Notably, on August 24 and August 26, at the intersection of the price and the Exchange Supply Ratio, there was a significant increase in the Exchange Supply Ratio as the price continued to fall. This suggests that despite the price decline, the amount of Bitcoin supplied to exchanges increased, possibly indicating that long-term investors stopped holding their holdings. Bitcoin price is generally on a downward trend.
Exchange Reserve
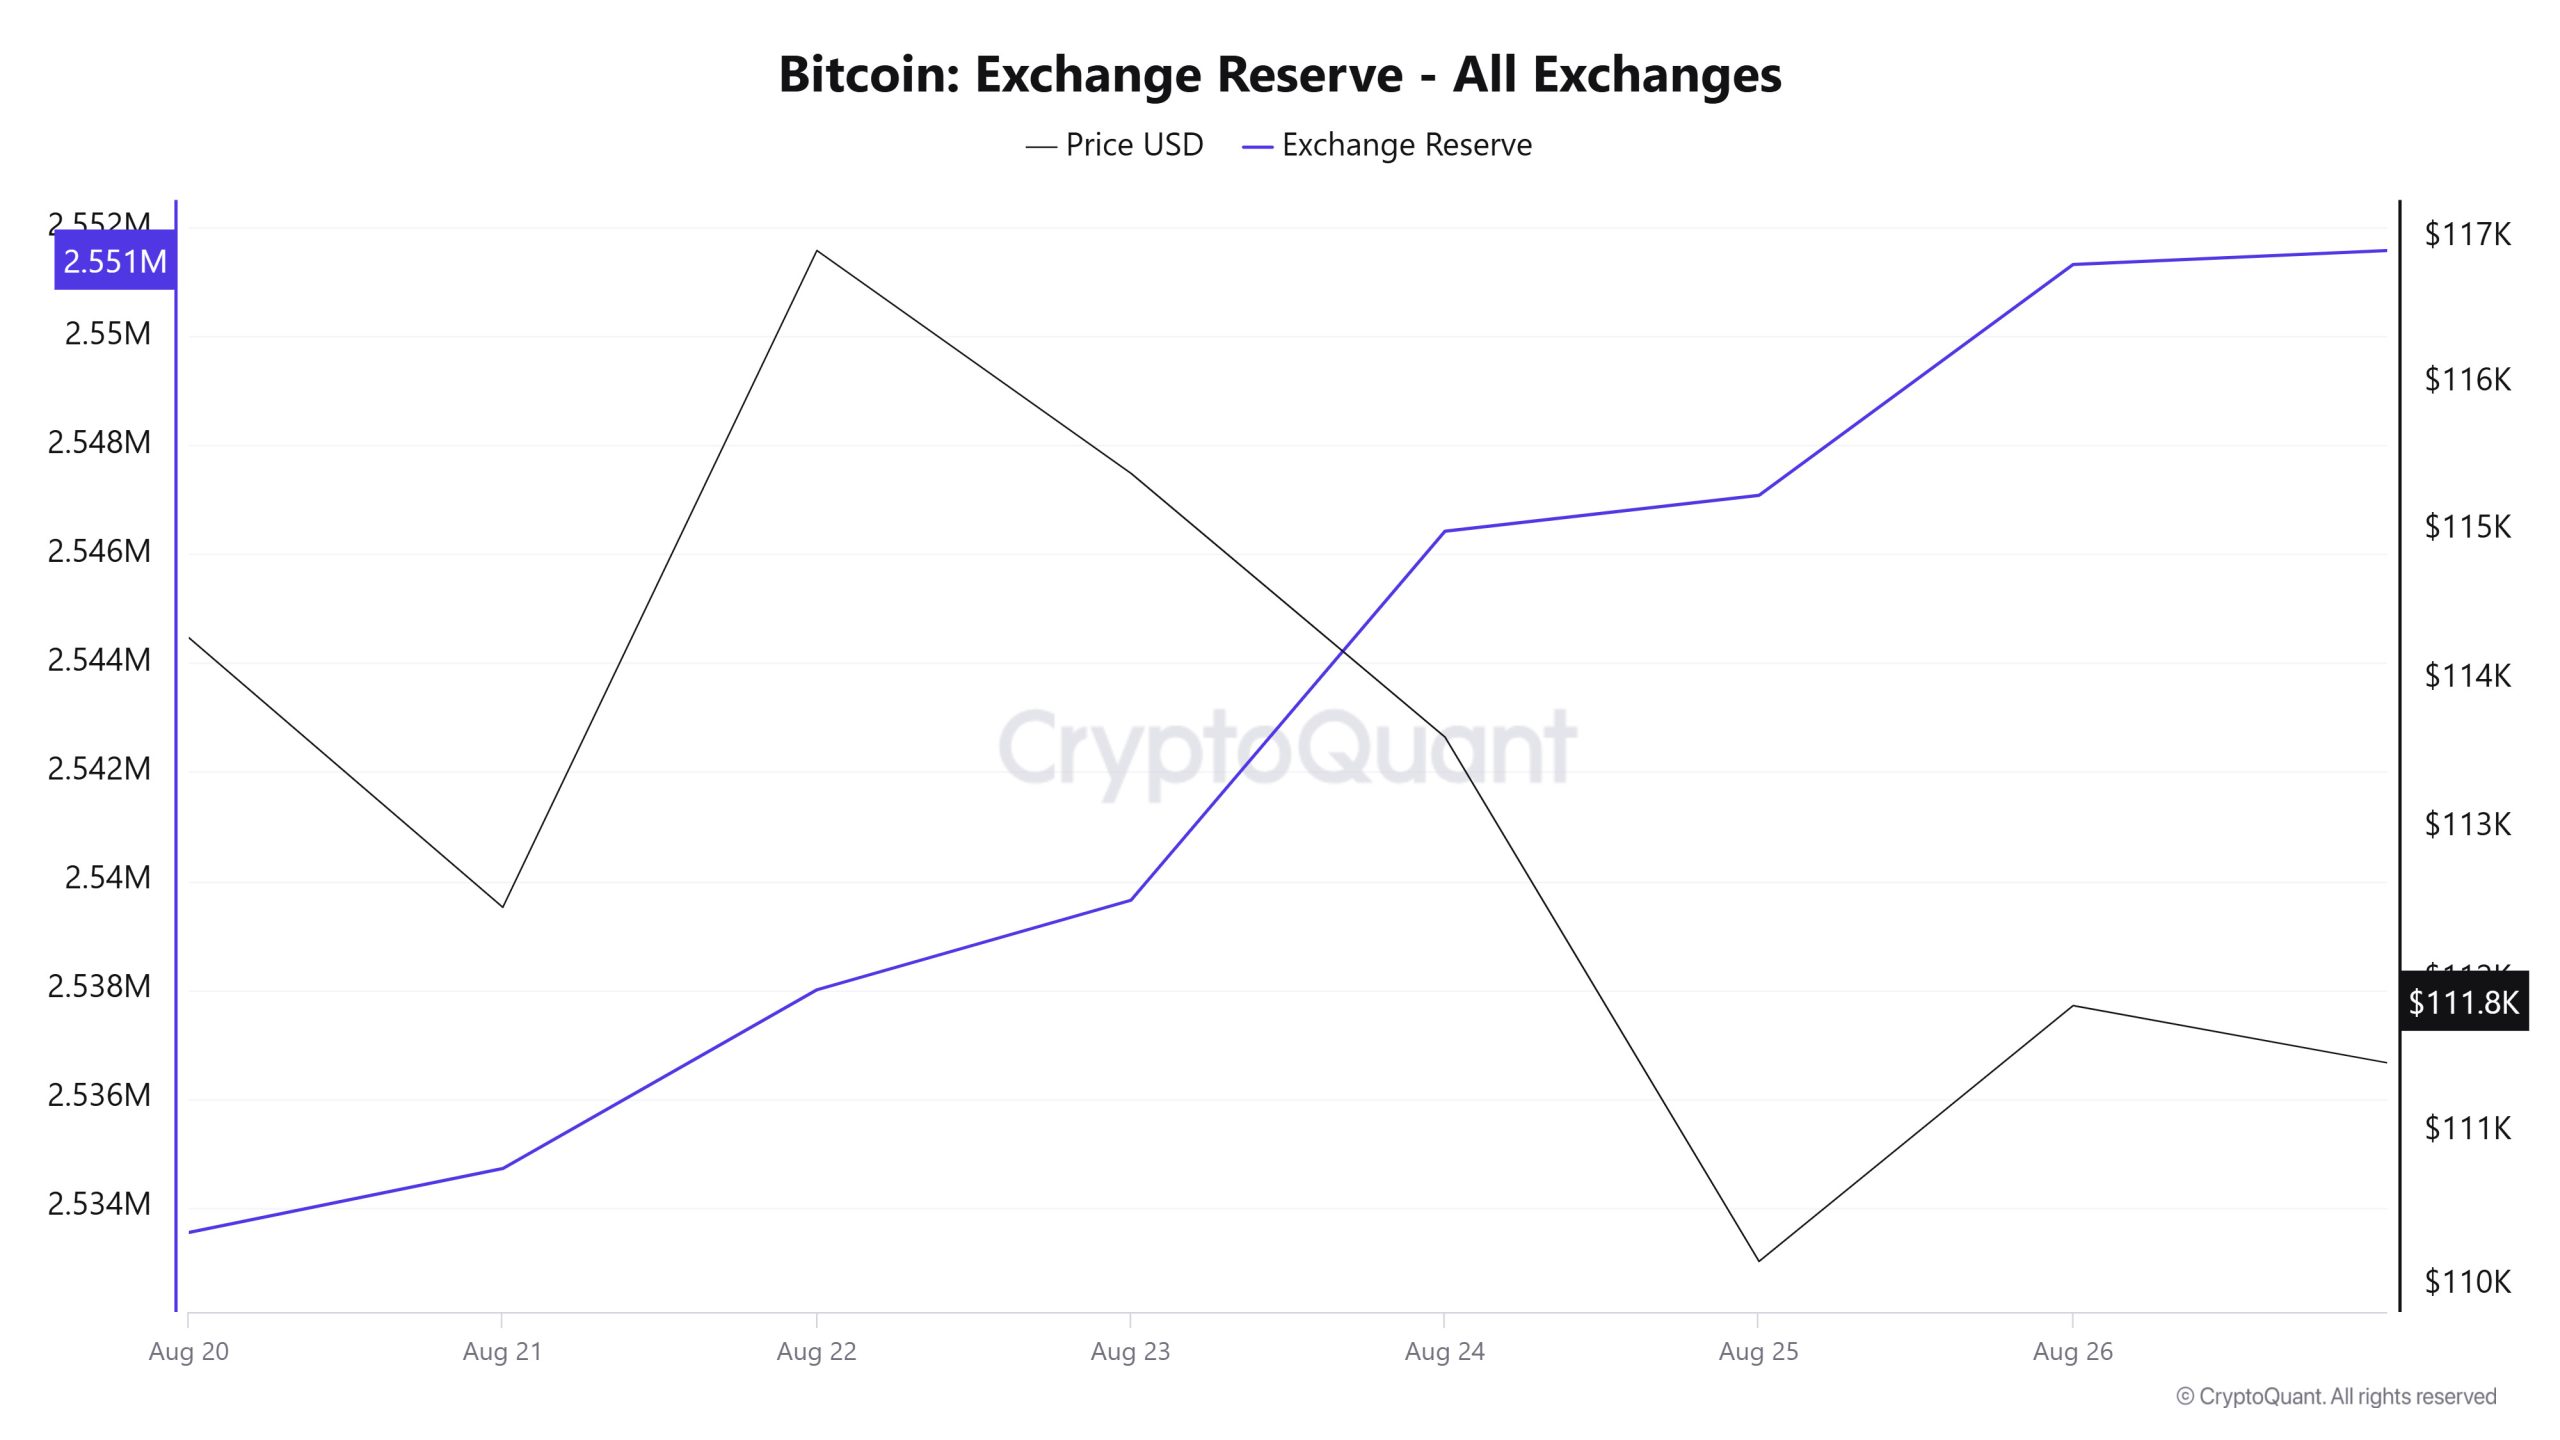
Between August 20-26, 2025, Bitcoin reserves on exchanges increased from 2,533,544 BTC to 2,551,317 BTC. In total, there was a net inflow of 17,773 BTC during this period, an increase in reserves of about 0.70%. During the same period, the BTC price fell from $114,274 to $111,829, a depreciation of about 2.14%. The increase in stock market reserves while the price fell suggests that investors have resumed selling positions and a cautious mood prevails. Selling pressure may continue in the short term.
| Date | Exchange Inflow | Exchange Outflow | Exchange NetFlow | Exchange Reserve | BTC Price |
|---|---|---|---|---|---|
| 20-Aug | 30,416 | 29,883 | 533 | 2,533,544 | 114,274 |
| 21-Aug | 32,431 | 31,258 | 1,174 | 2,534,718 | 112,476 |
| 22-Aug | 41,025 | 37,743 | 3,282 | 2,537,999 | 116,904 |
| 23-Aug | 20,219 | 18,574 | 1,645 | 2,539,644 | 115,384 |
| 24-Aug | 25,569 | 18,793 | 6,776 | 2,546,420 | 113,607 |
| 25-Aug | 31,290 | 30,633 | 657 | 2,547,077 | 110,159 |
| 26-Aug | 35,301 | 31,061 | 4,240 | 2,551,317 | 111,829 |
Fees and Revenues
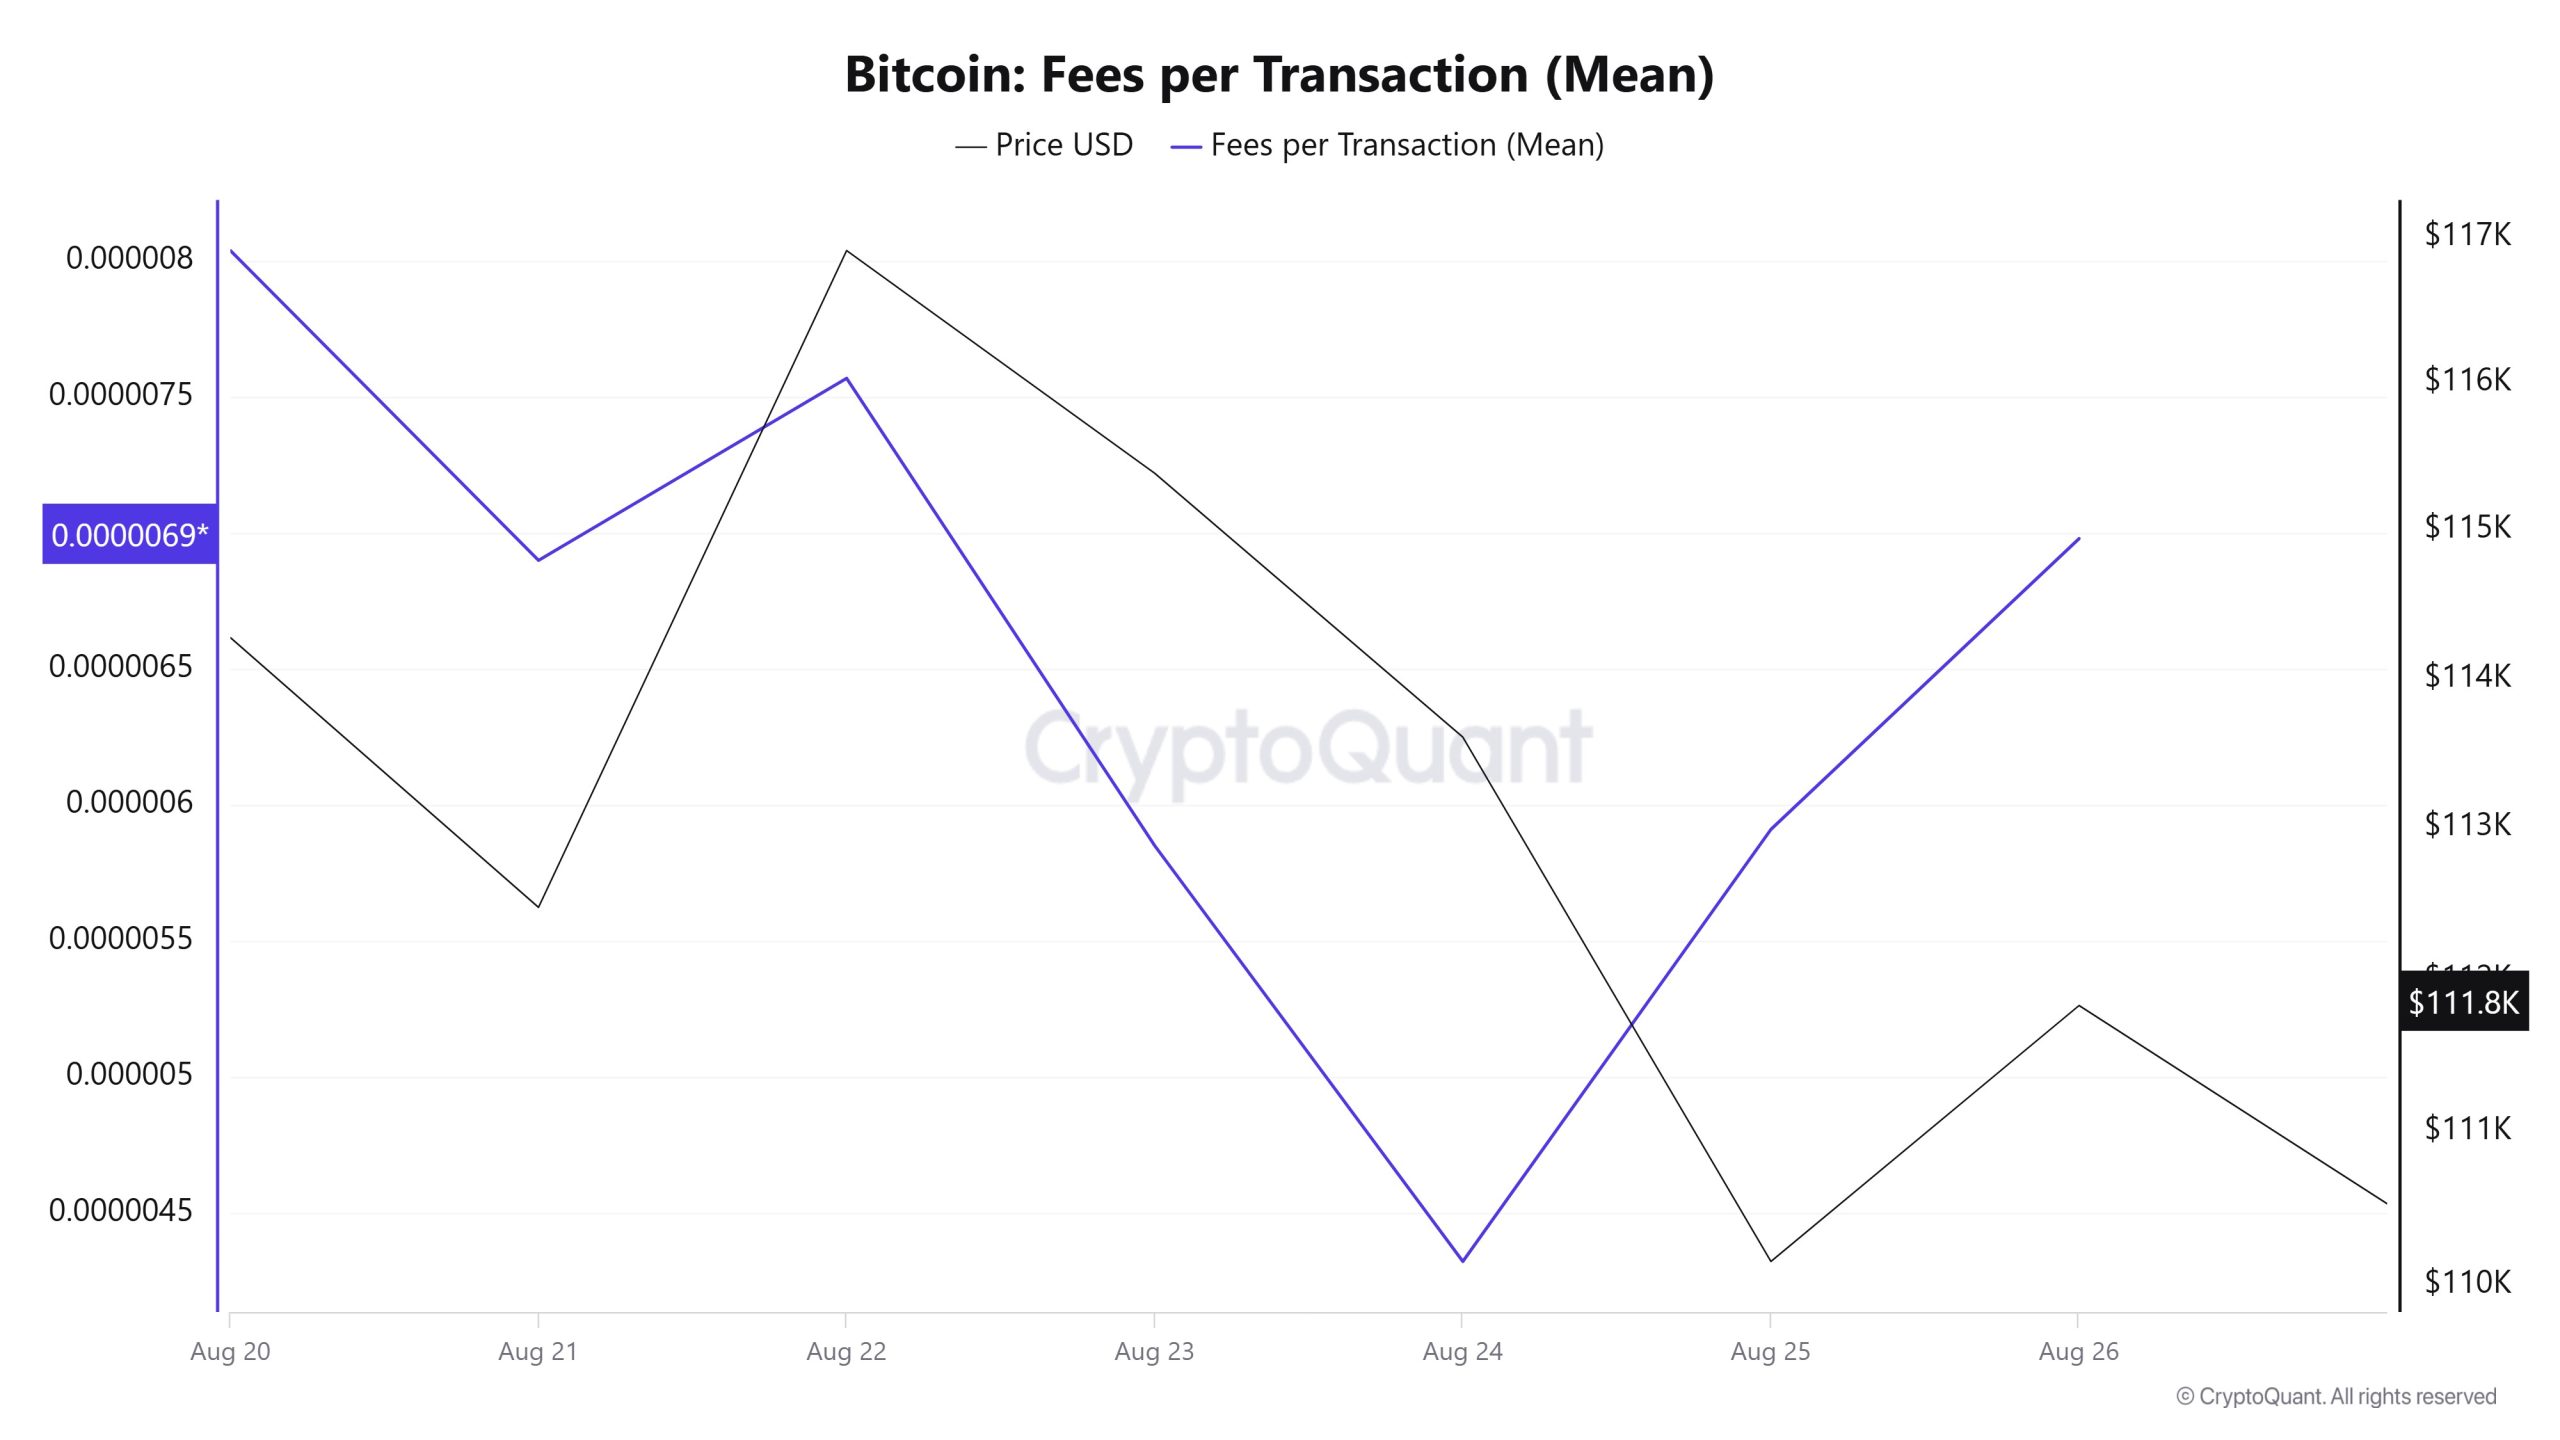
Analysing the Bitcoin Fees per Transaction (Mean) data between August 20 and August 26, it is seen that the indicator was realized at 0.00000804 on August 20, the first day of the week.
As of August 20, the value in question, which reached its peak level, followed a fluctuating course due to the volatility in Bitcoin price until this date. On August 24, it fell to 0.00000432, recording the lowest value of the week.
In the following days, the Bitcoin Fees per Transaction (Mean) indicator resumed its upward trend and closed at 0.00000698 on August 26, the last day of the week.
Bitcoin: Fees (Total)
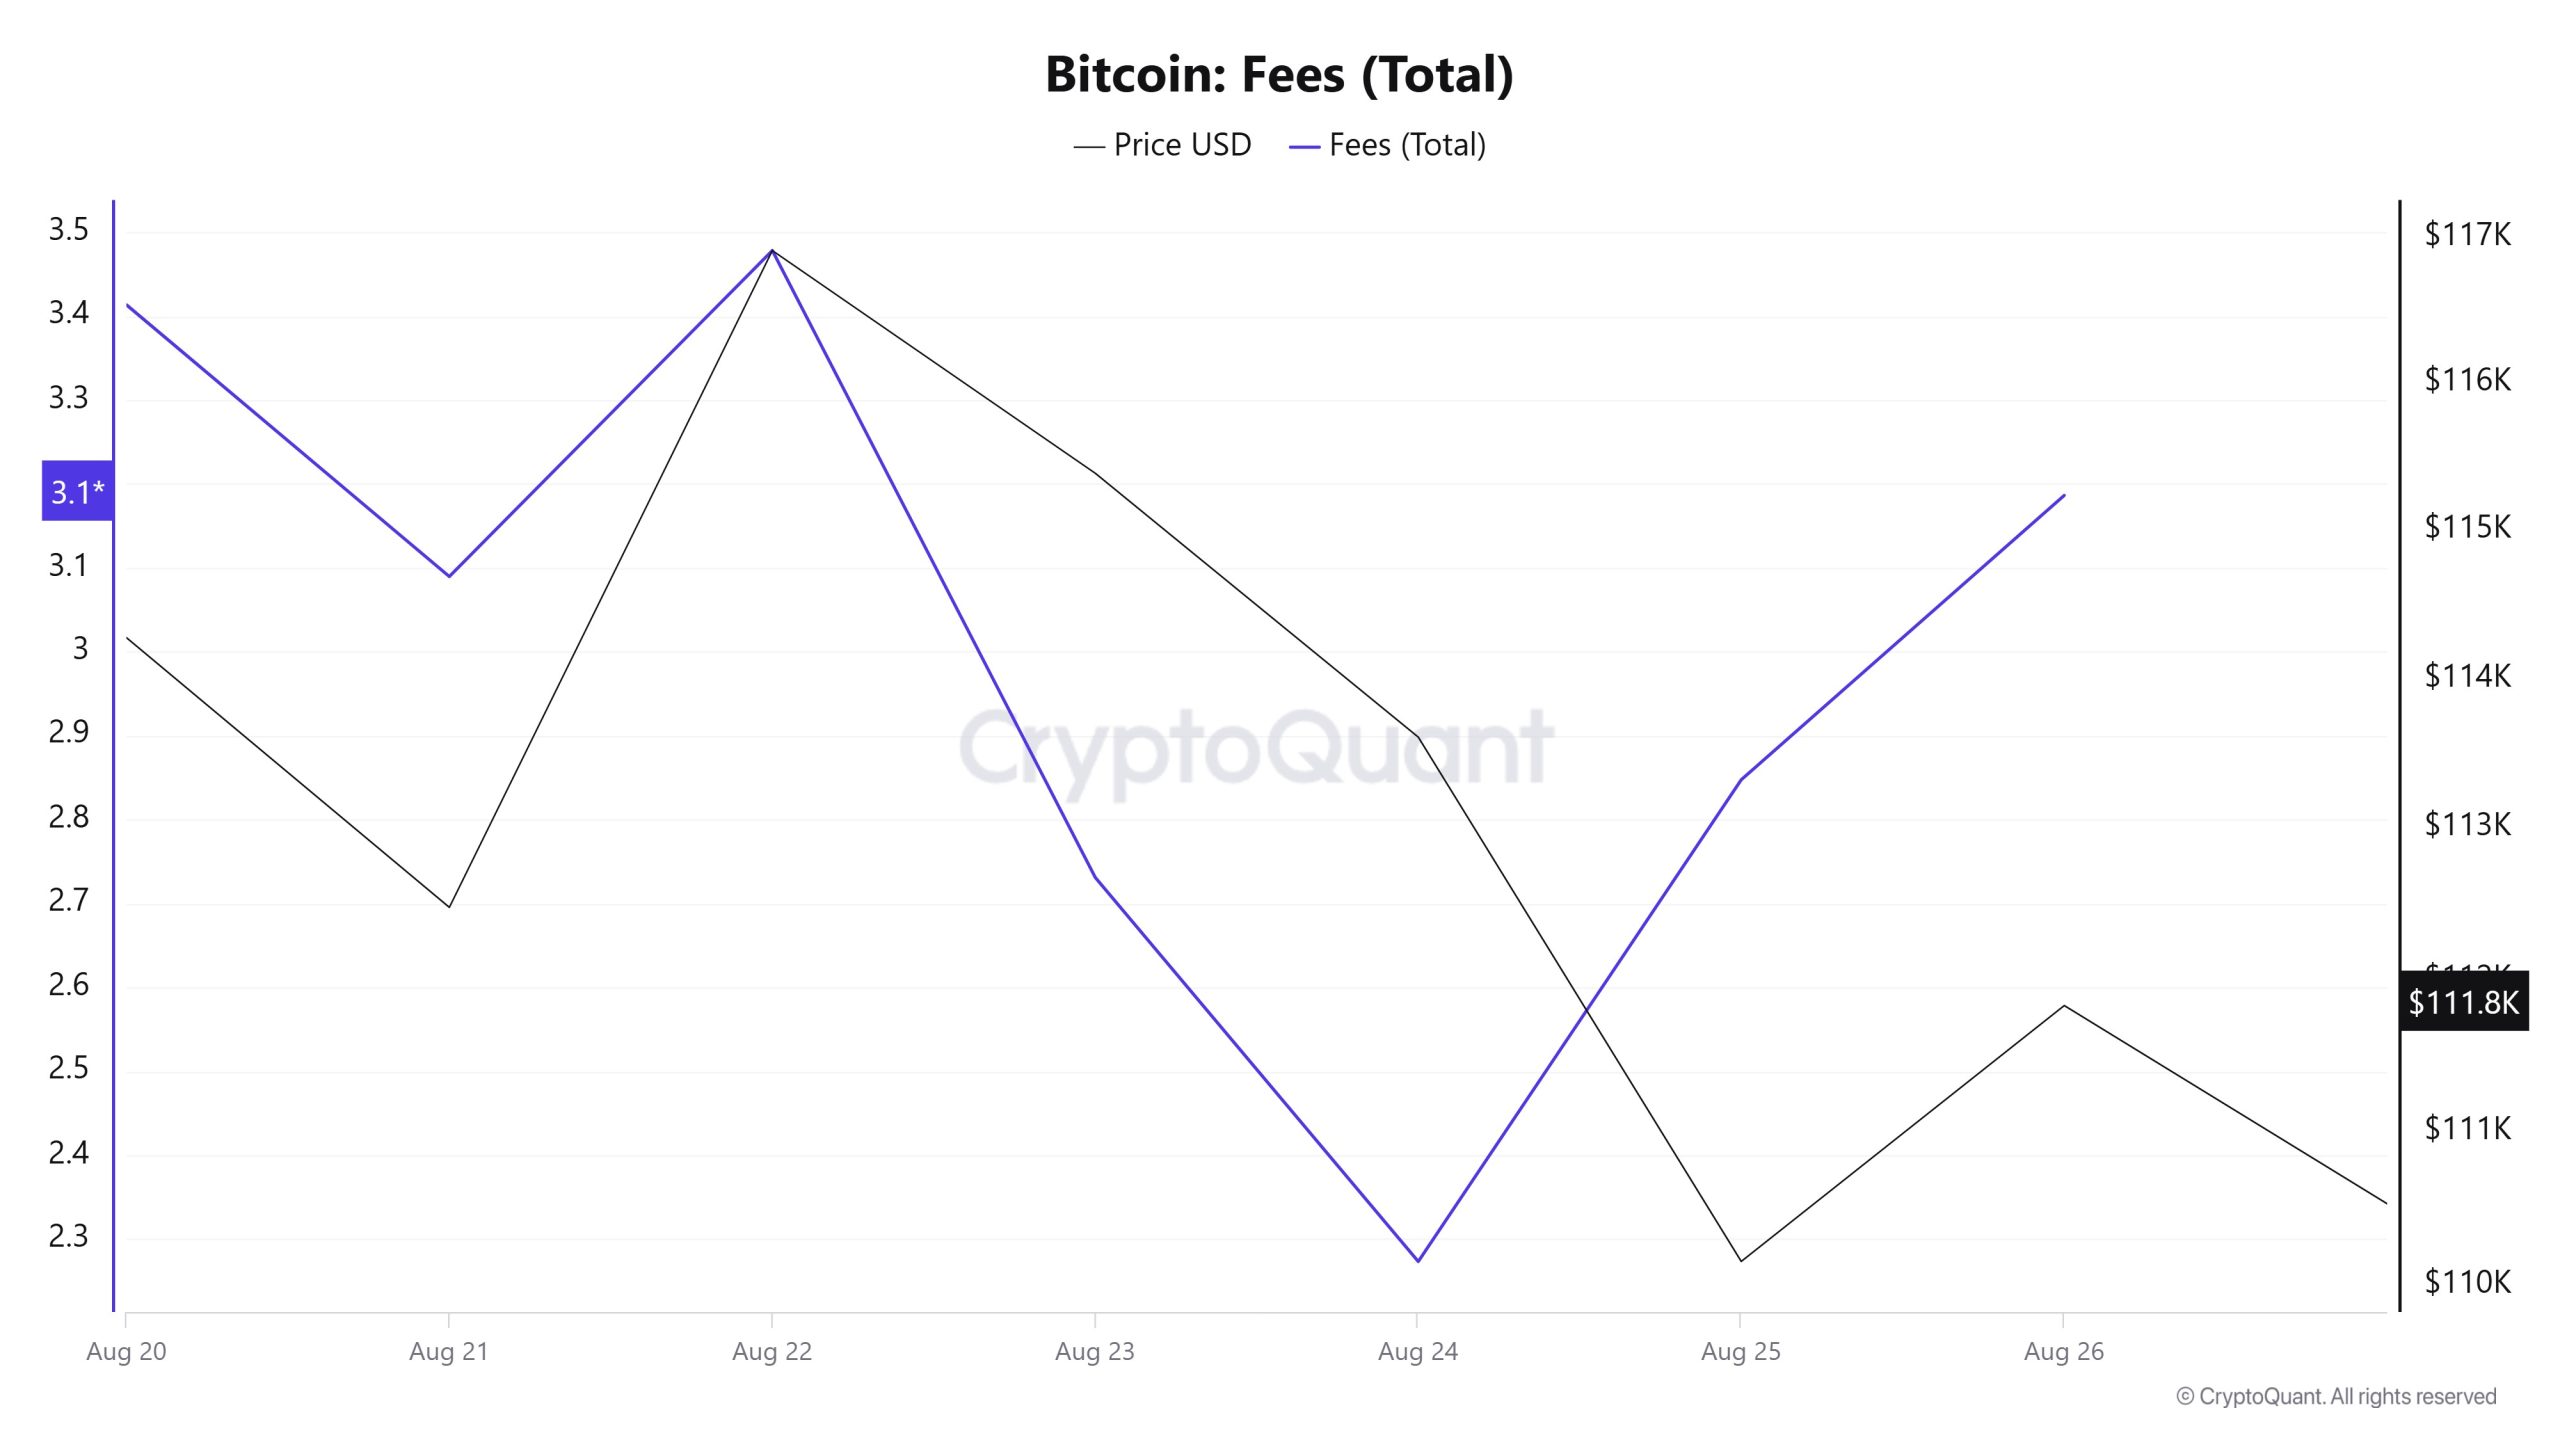
Similarly, an analysis of Bitcoin Fees (Total) data between August 20 and August 26 shows that this indicator was at 3.41356494 on August 20, the first day of the week.
Peaking on August 22, the value fluctuated due to the volatility in the Bitcoin price after this date, reaching a low of 2.27331775 on August 24, reaching the lowest level of the week.
In the following days, Bitcoin Fees (Total) started to rise again and closed at 3.18642722 on August 26, the last day of the week.
Miner Flows
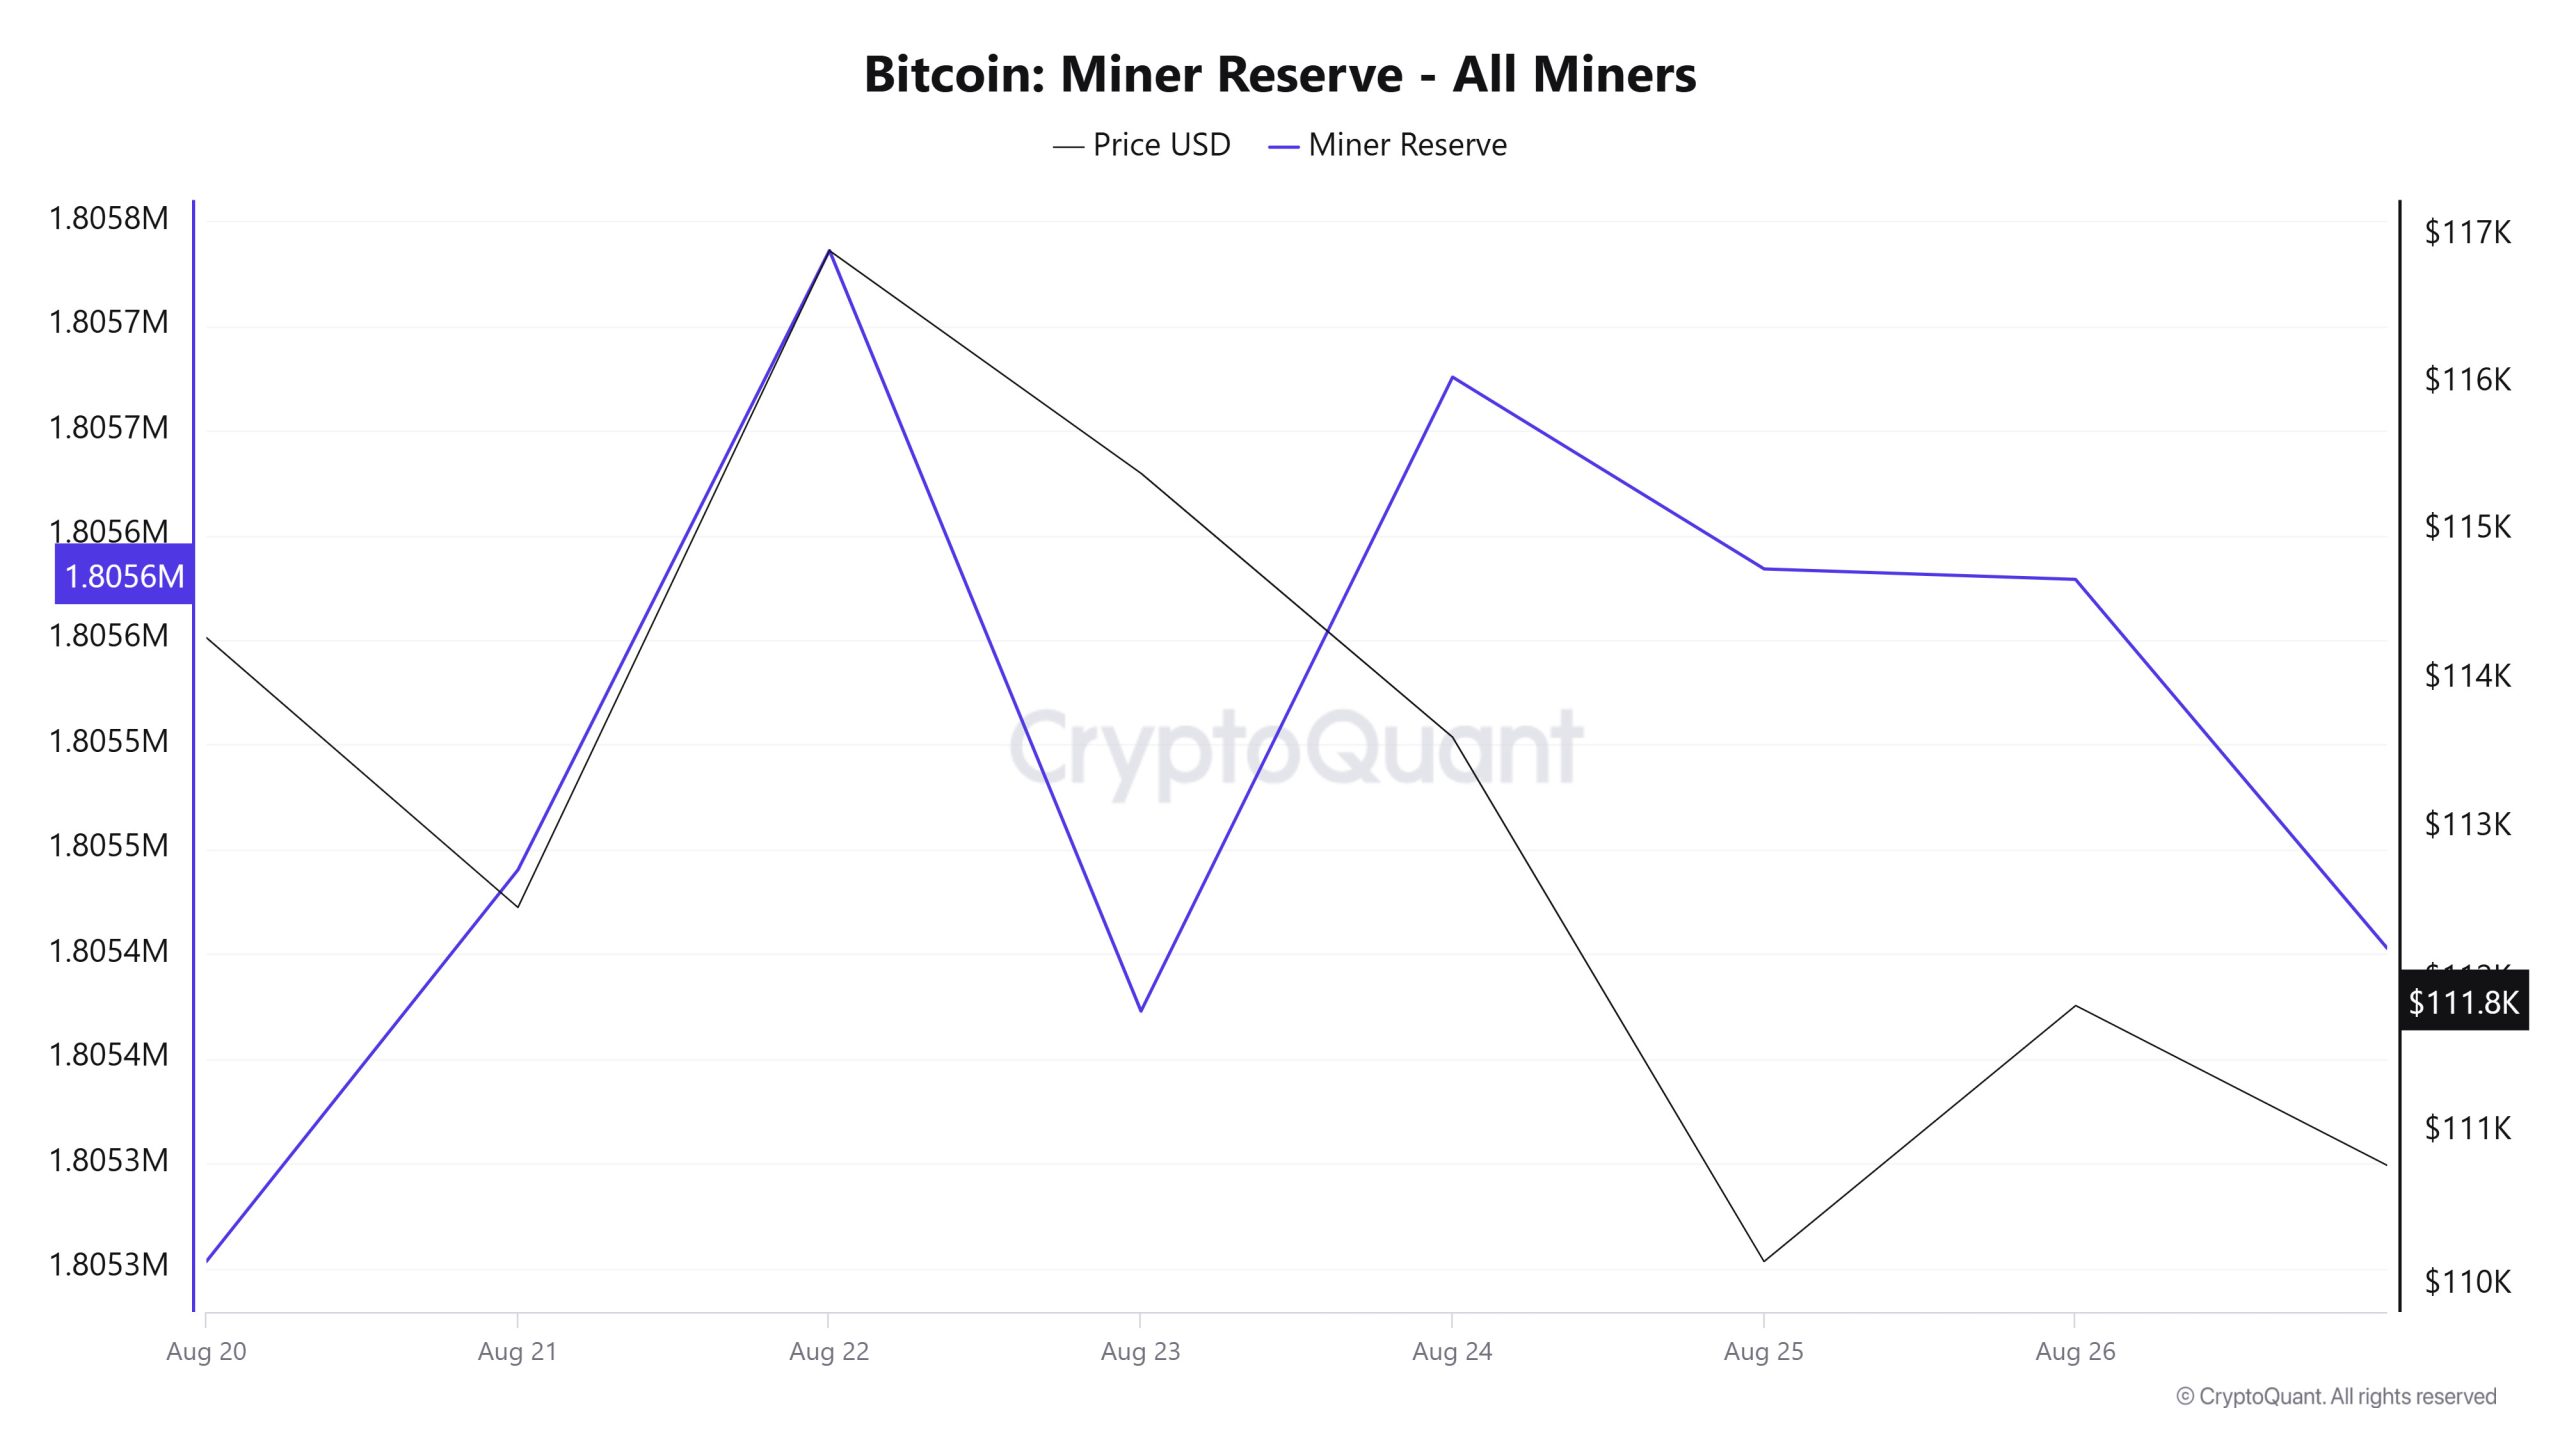
According to the data obtained from the Miner Reserve table, there has been an increase in Bitcoin reserves held in miners’ wallets this week. A time-varying correlation structure was observed between Bitcoin price and miner reserve over the time period analyzed. However, the general trend reveals that a positive correlation between these two variables is dominant.
Miner Inflow, Outflow and NetFlow
Between August 20 and August 26, 52,874 Bitcoins exited miners’ wallets, and 53,131 Bitcoins entered miners’ wallets between the same dates. The Miner Netflow for this week was 257 Bitcoin. Meanwhile, the Bitcoin price was $114,274 on August 20 and $111,828 on August 26.
For the week, the net flow (Miner NetFlow) was positive as Bitcoin inflow into miner wallets (Miner Inflow) was less than Bitcoin outflow from miner wallets (Miner Outflow).
| Date | Miner Inflow | Miner Outflow | Miner Netflow |
|---|---|---|---|
| 20-Aug | 5,258.44 | 5,326.96 | -68.52 |
| 21-Aug | 7,213.95 | 7,026.95 | 187.00 |
| 22-Aug | 9,758.13 | 9,462.27 | 295.86 |
| 23-Aug | 5,615.74 | 5,979.09 | -363.35 |
| 24-Aug | 9,424.66 | 9,121.76 | 302.90 |
| 25-Aug | 7,472.83 | 7,564.44 | -91.61 |
| 26-Aug | 8,387.88 | 8,392.90 | -5.02 |
Transaction
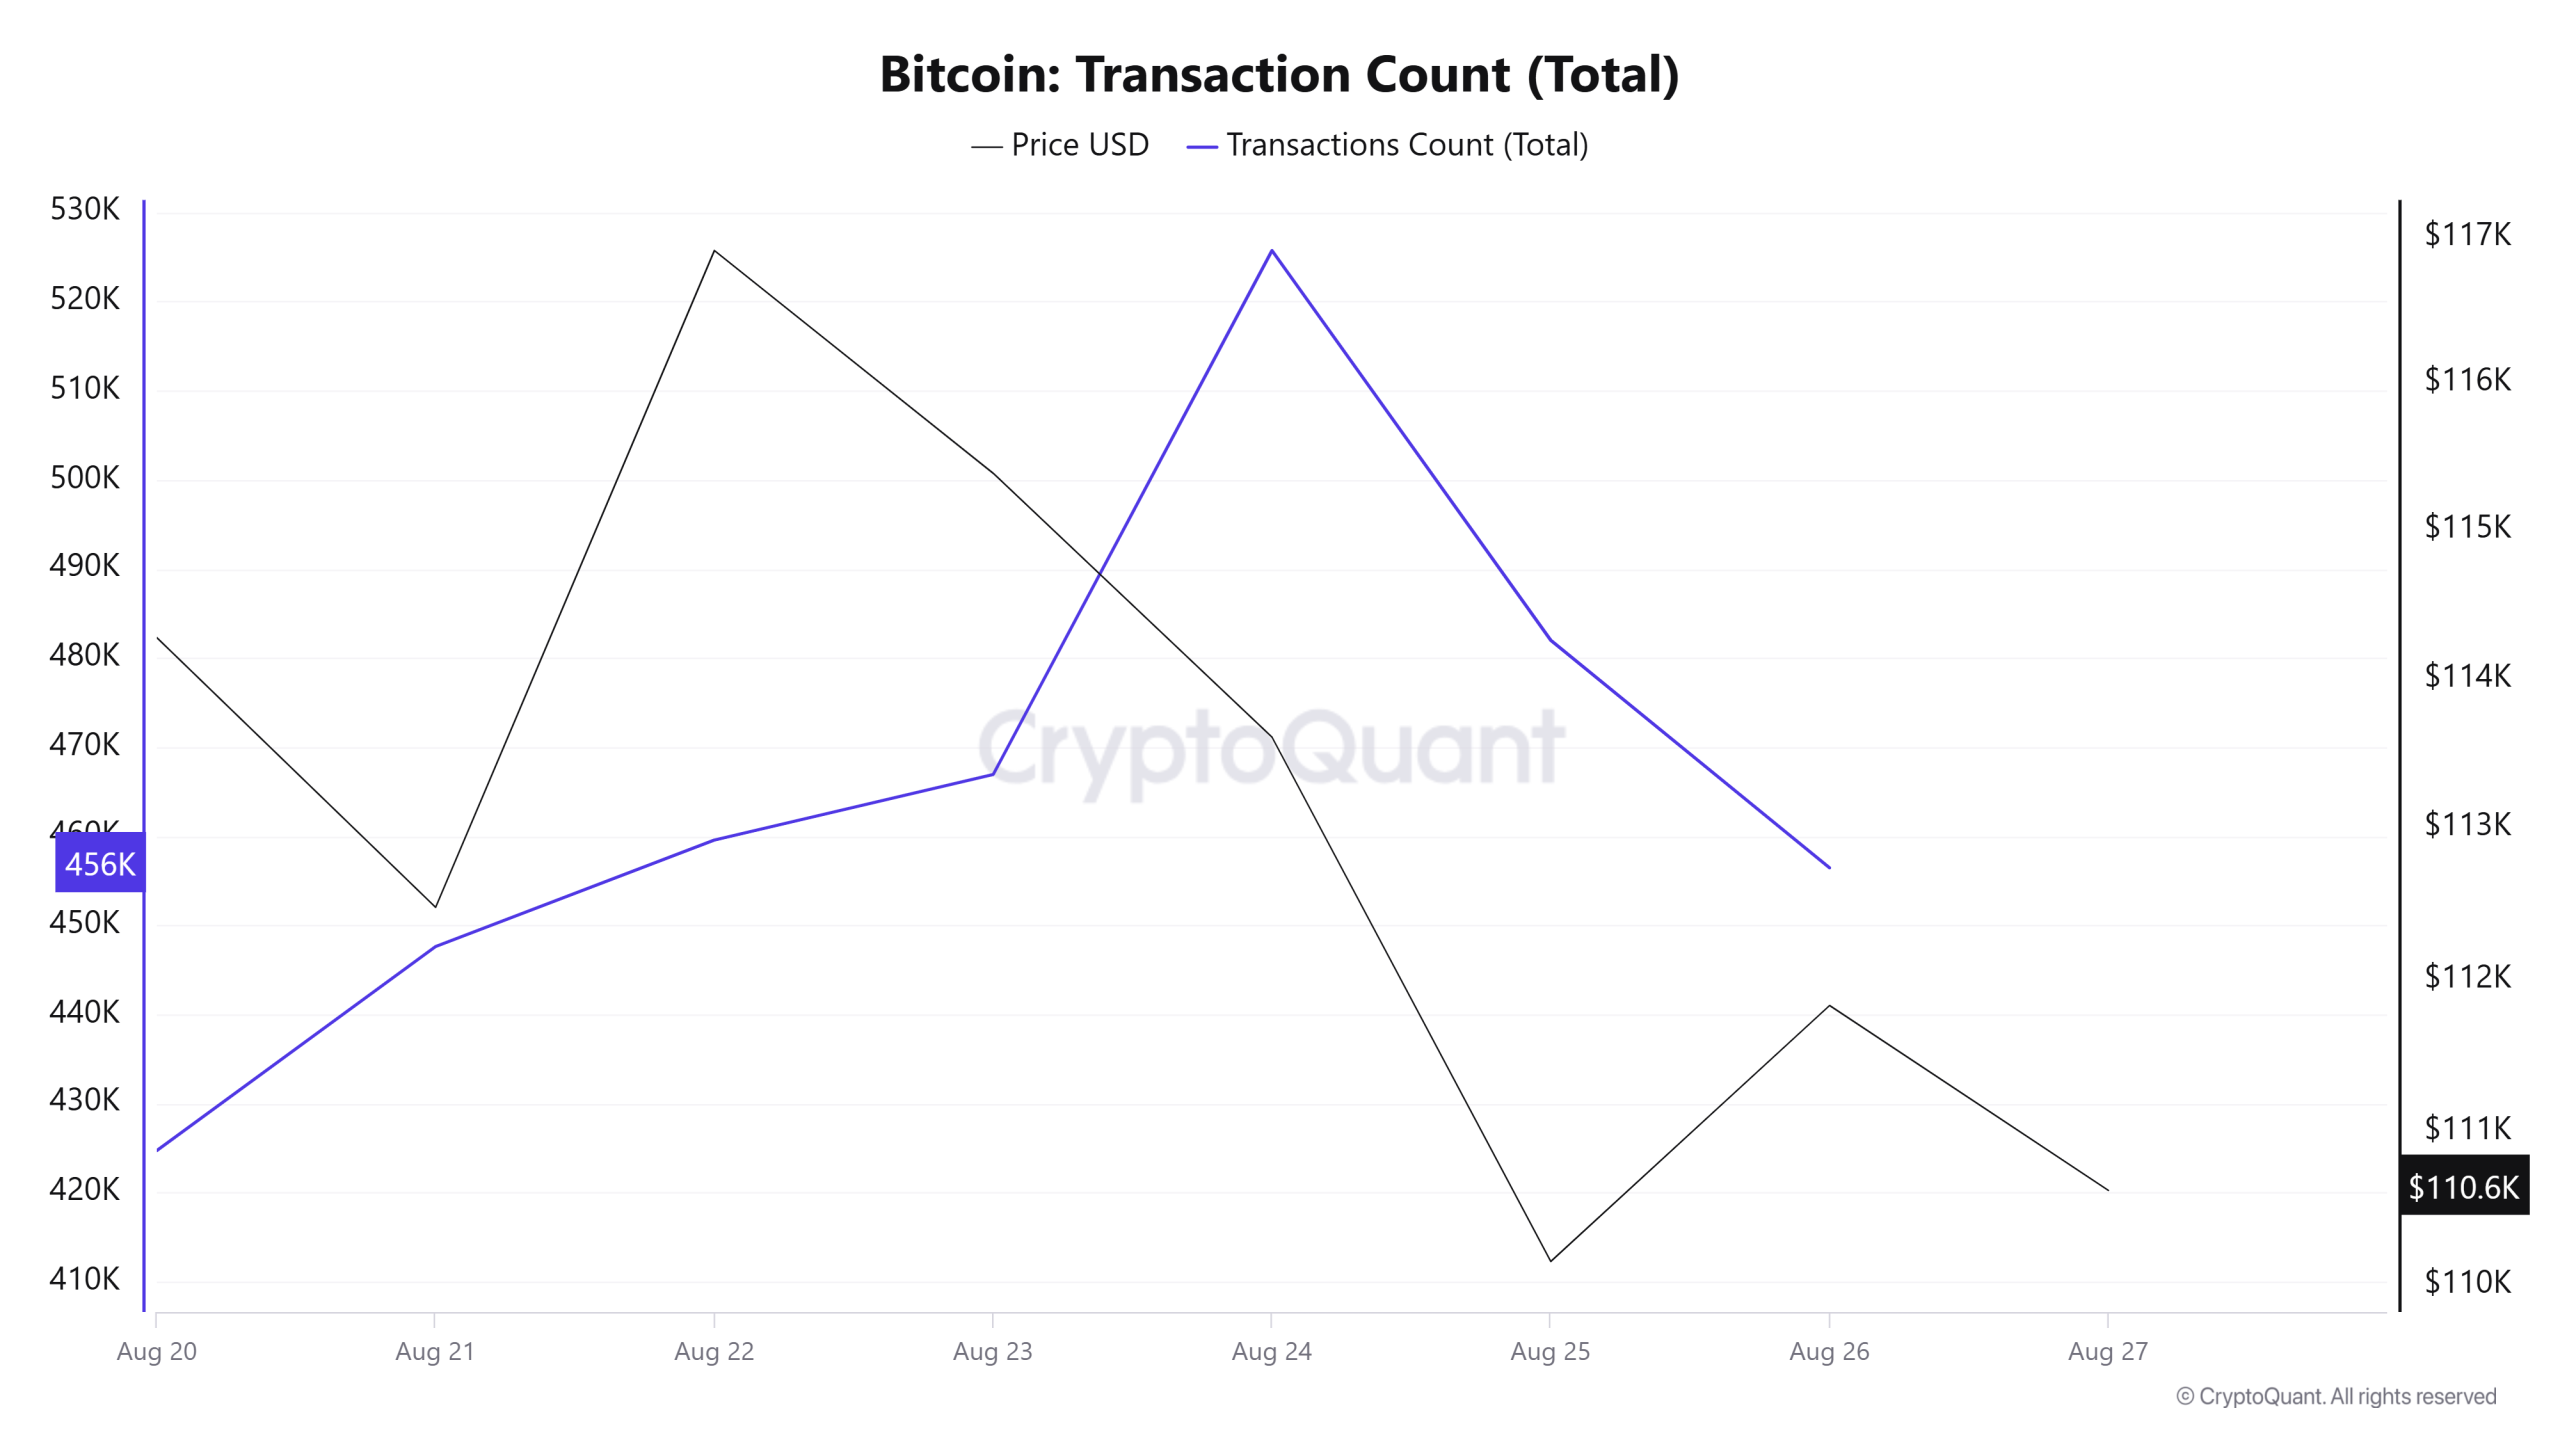
Last week, there were 3,082,959 transactions on the Bitcoin network, while this week there were 3,263,012 transactions, an increase of about 5.84%. The 525,726 transactions recorded on August 24 constituted the highest volume of the week, while the lowest number of transactions was 424,728 on August 20.
While there was a sharp rise in the number of transactions in the first half of the week (August 20-24), a rapid decline was observed in the second half (August 24-27). The fact that the inverse correlations between the number of transactions and price movements were high during the first half of the uptrend suggests that most of the transactions in this period were driven by selling pressure.
An overall assessment of the weekly trend reveals a positive outlook with the increase in network activity compared to the previous week, while the intensity of inverse correlations during the week can be interpreted negatively. In addition, the volatility in trading volumes makes it difficult for the market to determine a clear direction and increases uncertainty in the short term.
Tokens Transferred
Last week, 4,100,740 BTC was transferred, while this week it increased by 4% to 4,359,848 BTC. August 22 and August 26 were the highest transfer days of the week, with nearly 700,000 BTC transfers separately. On August 22, the transaction peak that took place on August 22 took the price up simultaneously, and then a big decline took place, and for August 26, the amount of Bitcoin transferred, which rose with the price, may create an equivalent structure by bringing a decline in the rest of the period. On August 23, the lowest daily transfer volume was recorded with 523,177 BTC. Volatility remains high, although the market direction is slightly downward, contrary to the general trend. Although large transfer fluctuations indicate that a lot of Bitcoins are changing hands, transfers are more likely to be weighted towards selling in the weeks when the price is down.
Whale Activities
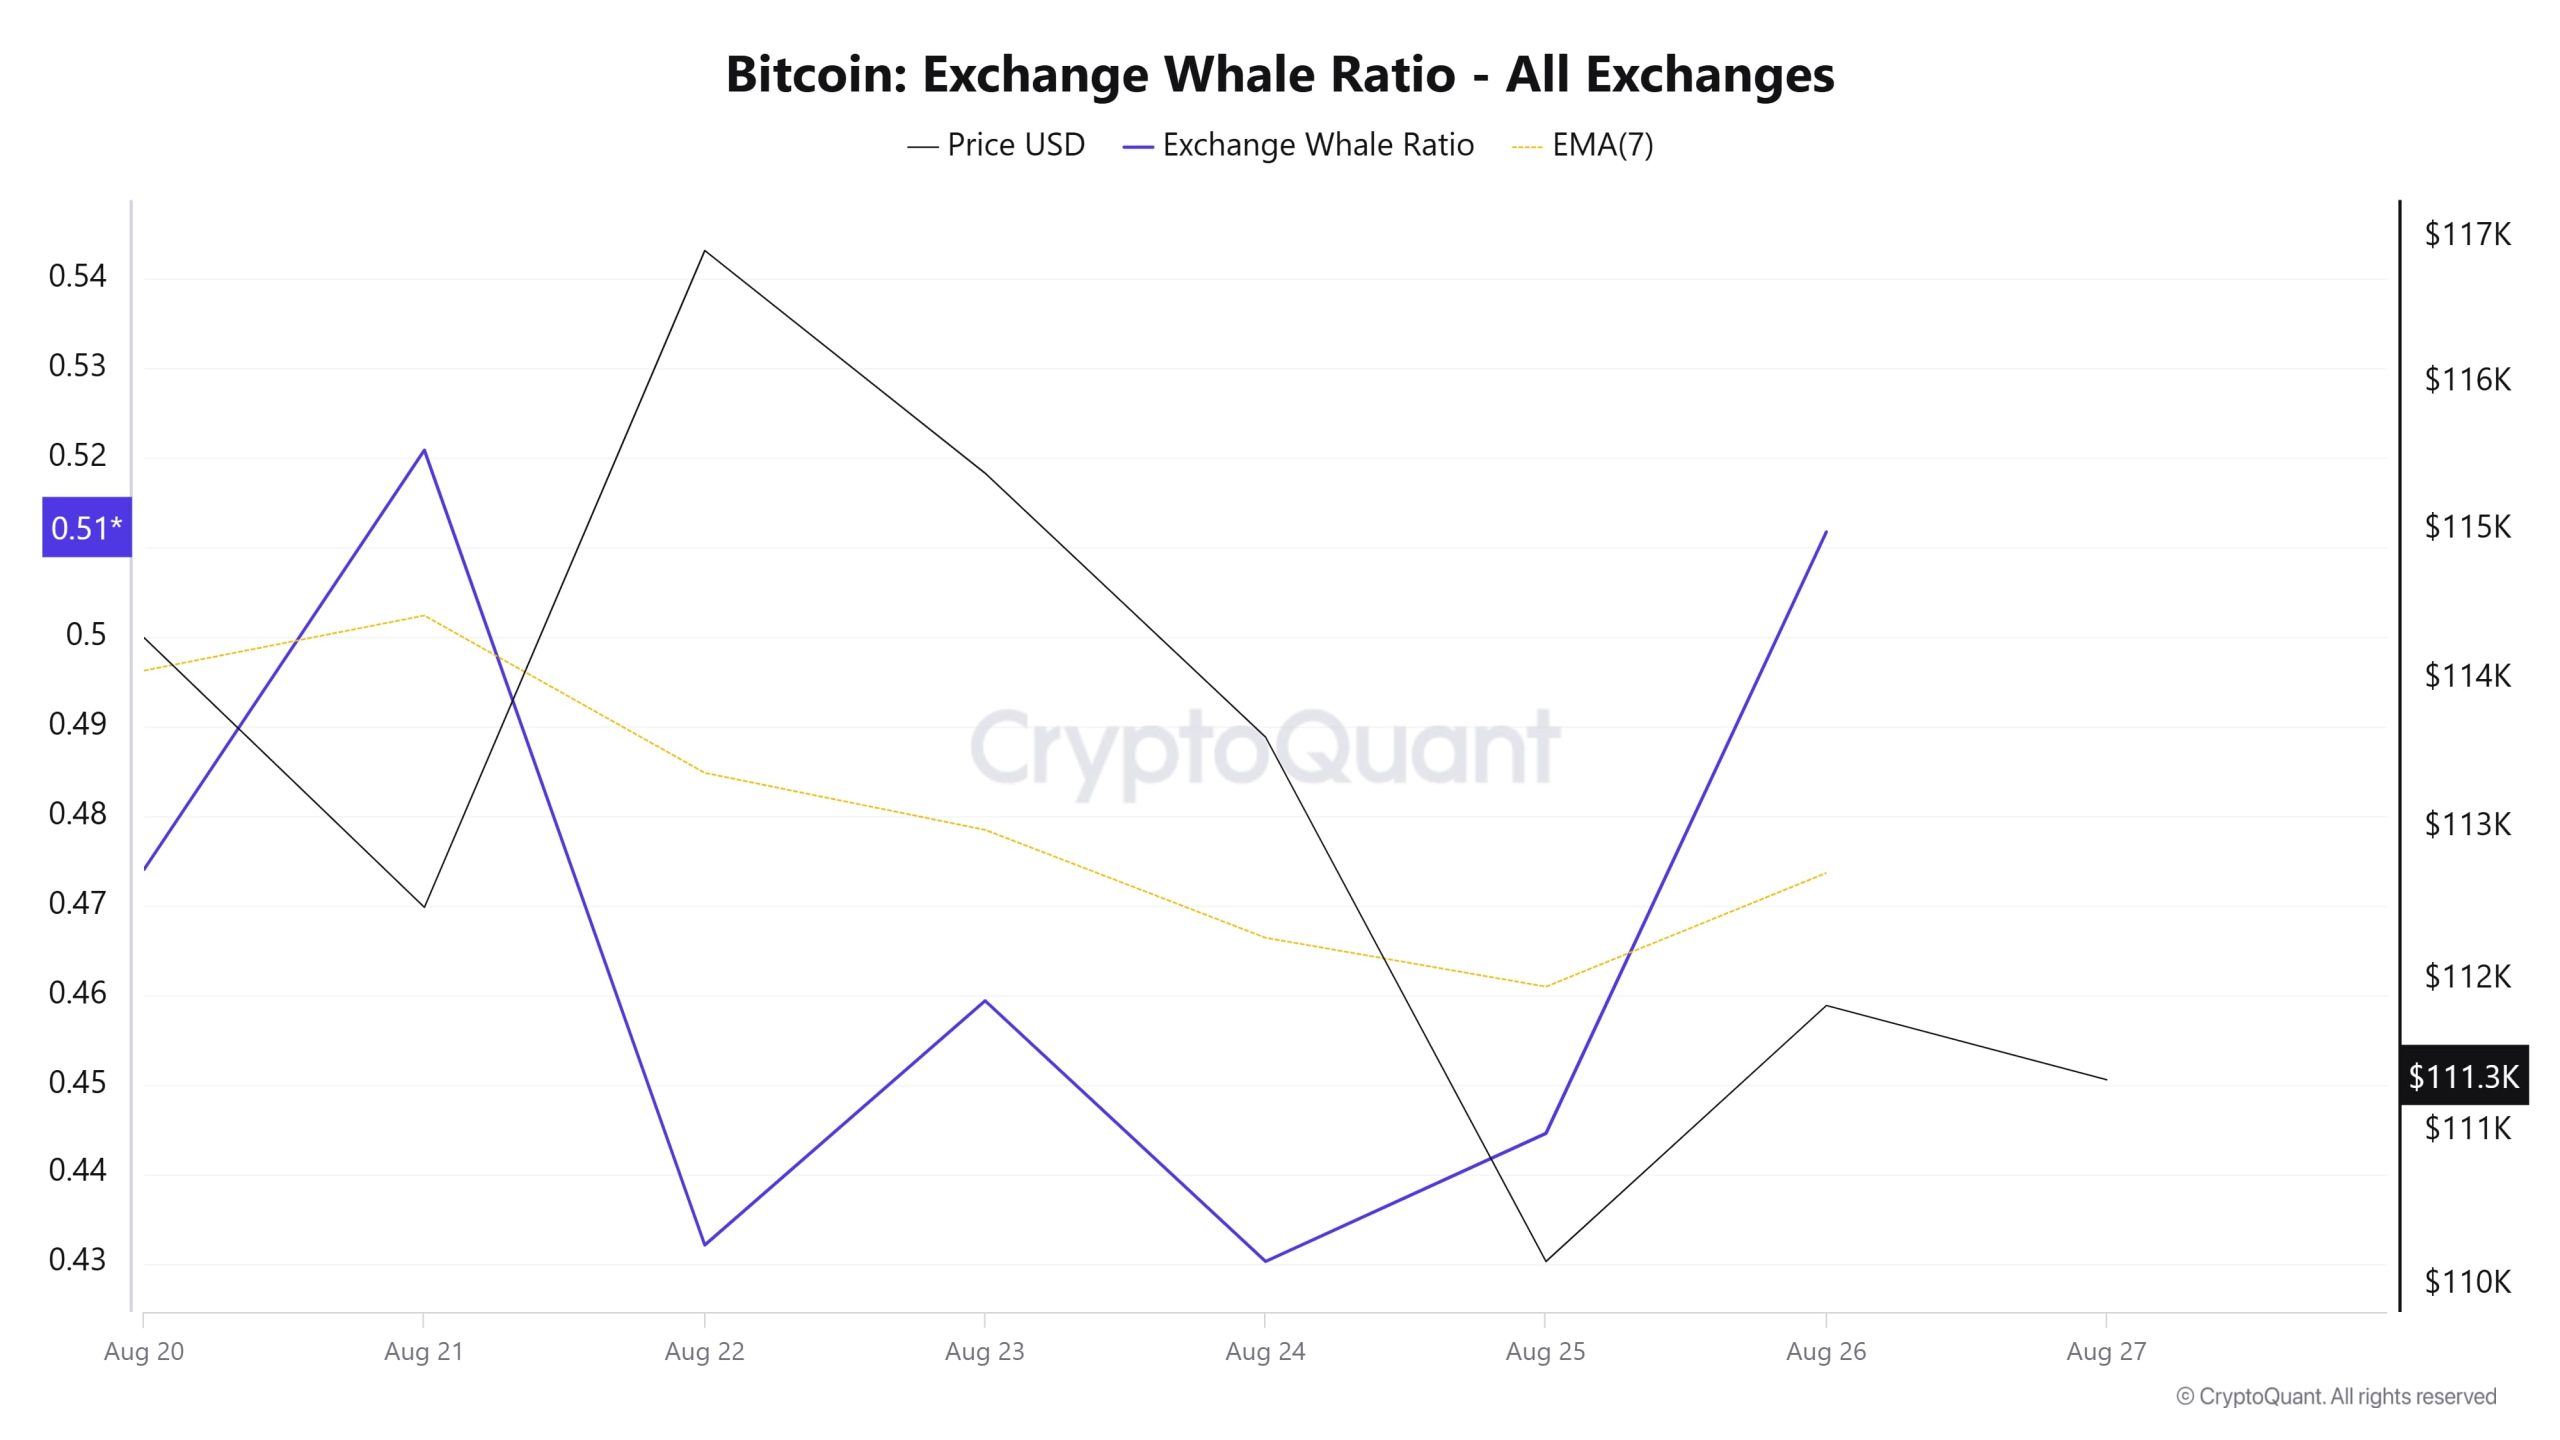
Whales Data
Over the last 7 days, according to data from the cryptocurrency market, whale activity on centralized exchanges has declined from the beginning to the middle of the period. When we look at the Exchange Whale Ratio metric, on August 20, the first day of the 7-day period, the rate of whales using central exchanges was 0.474. The lowest point of the process took place on August 24 and its value was 0.430. When this ratio is above 0.35, it usually means that whales use centralized exchanges frequently. The high point of the process was 0.520 on August 21. The metric currently stands at 0.511, indicating that whales continue to frequent centralized exchanges. BTC has remained between 109,000 and 116,000 during this period. This shows that whales or institutions are using centralized exchanges to sell BTC. At the same time, the total BTC transfer increased by about 6% compared to last week, with 4,359,848 BTC moving. When we look at the data, an important behavioral change has emerged. A single whale’s $2.6 billion in Bitcoin sales triggered liquidations and price corrections. This signaled a shift in the whales’ investment priorities by transferring their capital to Ethereum. This signaled a drop in BTC-bearing wallets. As a result, we are seeing long-term investors realizing profits on BTC and transferring them to other major altcoins. This suggests that there may be an uptrend in the overall market, but BTC is on a downward trend.
BTC Onchain Overall
| Metric | Positive 📈 | Negative 📉 | Neutral ➖ |
|---|---|---|---|
| Active Addresses | ✓ | ||
| Breakdowns | ✓ | ||
| Derivatives | ✓ | ||
| Supply Distribution | ✓ | ||
| Exchange Supply Ratio | ✓ | ||
| Fees & Revenues | ✓ | ||
| Miner Flows | ✓ | ||
| Transactions | ✓ | ||
| Whale Activities | ✓ |
*The metrics and guidance in the table do not, in and of themselves, describe or imply an expectation of future price changes for any asset. The prices of digital assets may vary depending on many different variables. The onchain analysis and related guidance are intended to assist investors in their decision-making process, and making financial investments based solely on the results of this analysis may result in harmful transactions. Even if all metrics produce a positive, negative or neutral result at the same time, the expected results may not be seen according to market conditions. Investors reviewing the report would be well advised to heed these caveats.
Legal Notice
The investment information, comments and recommendations contained in this document do not constitute investment advisory services. Investment advisory services are provided by authorized institutions on a personal basis, taking into account the risk and return preferences of individuals. The comments and recommendations contained in this document are of a general type. These recommendations may not be suitable for your financial situation and risk and return preferences. Therefore, making an investment decision based solely on the information contained in this document may not result in results that are in line with your expectations.
NOTE: All data used in Bitcoin onchain analysis is based on Cryptoqaunt.

