
Weekly Bitcoin Onchain Report
Active Addresses
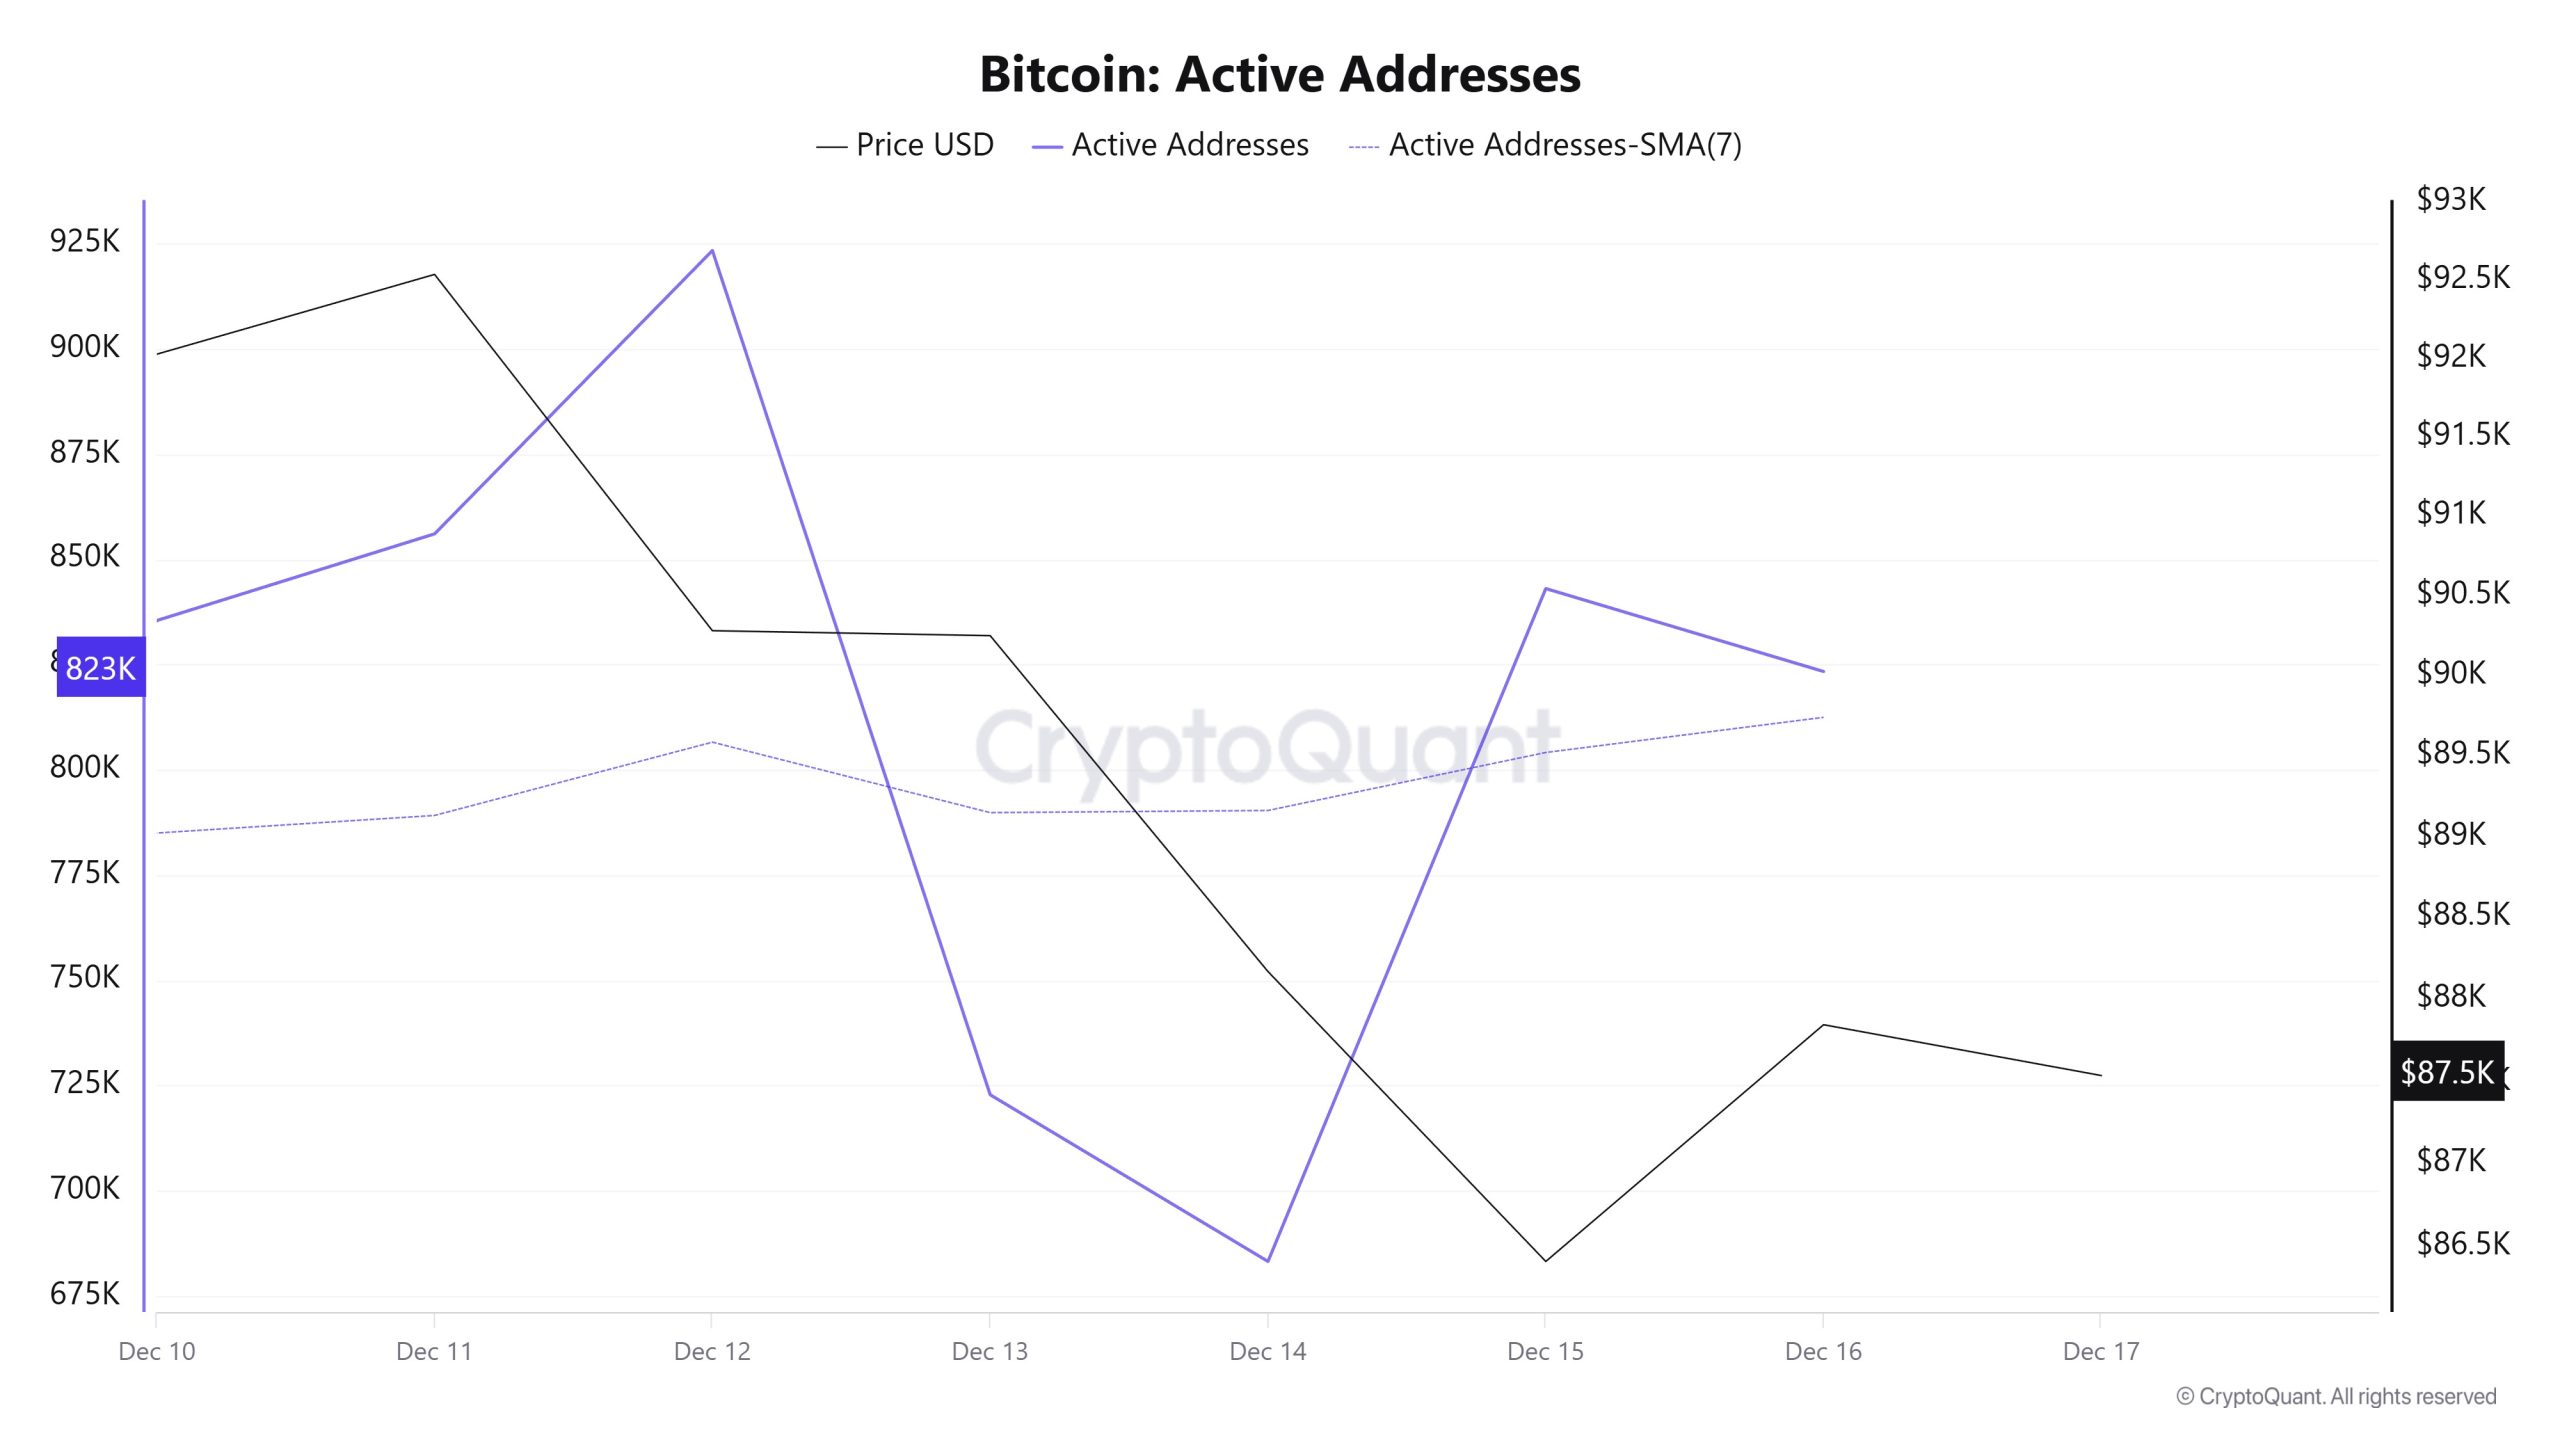
Between December 10 and December 17, 923,404 active addresses were added to the Bitcoin network. During this period, the Bitcoin price dropped to $86,000. From a technical perspective, the 7-day simple moving average (SMA) shows a downward trend.
Active Sending Addresses
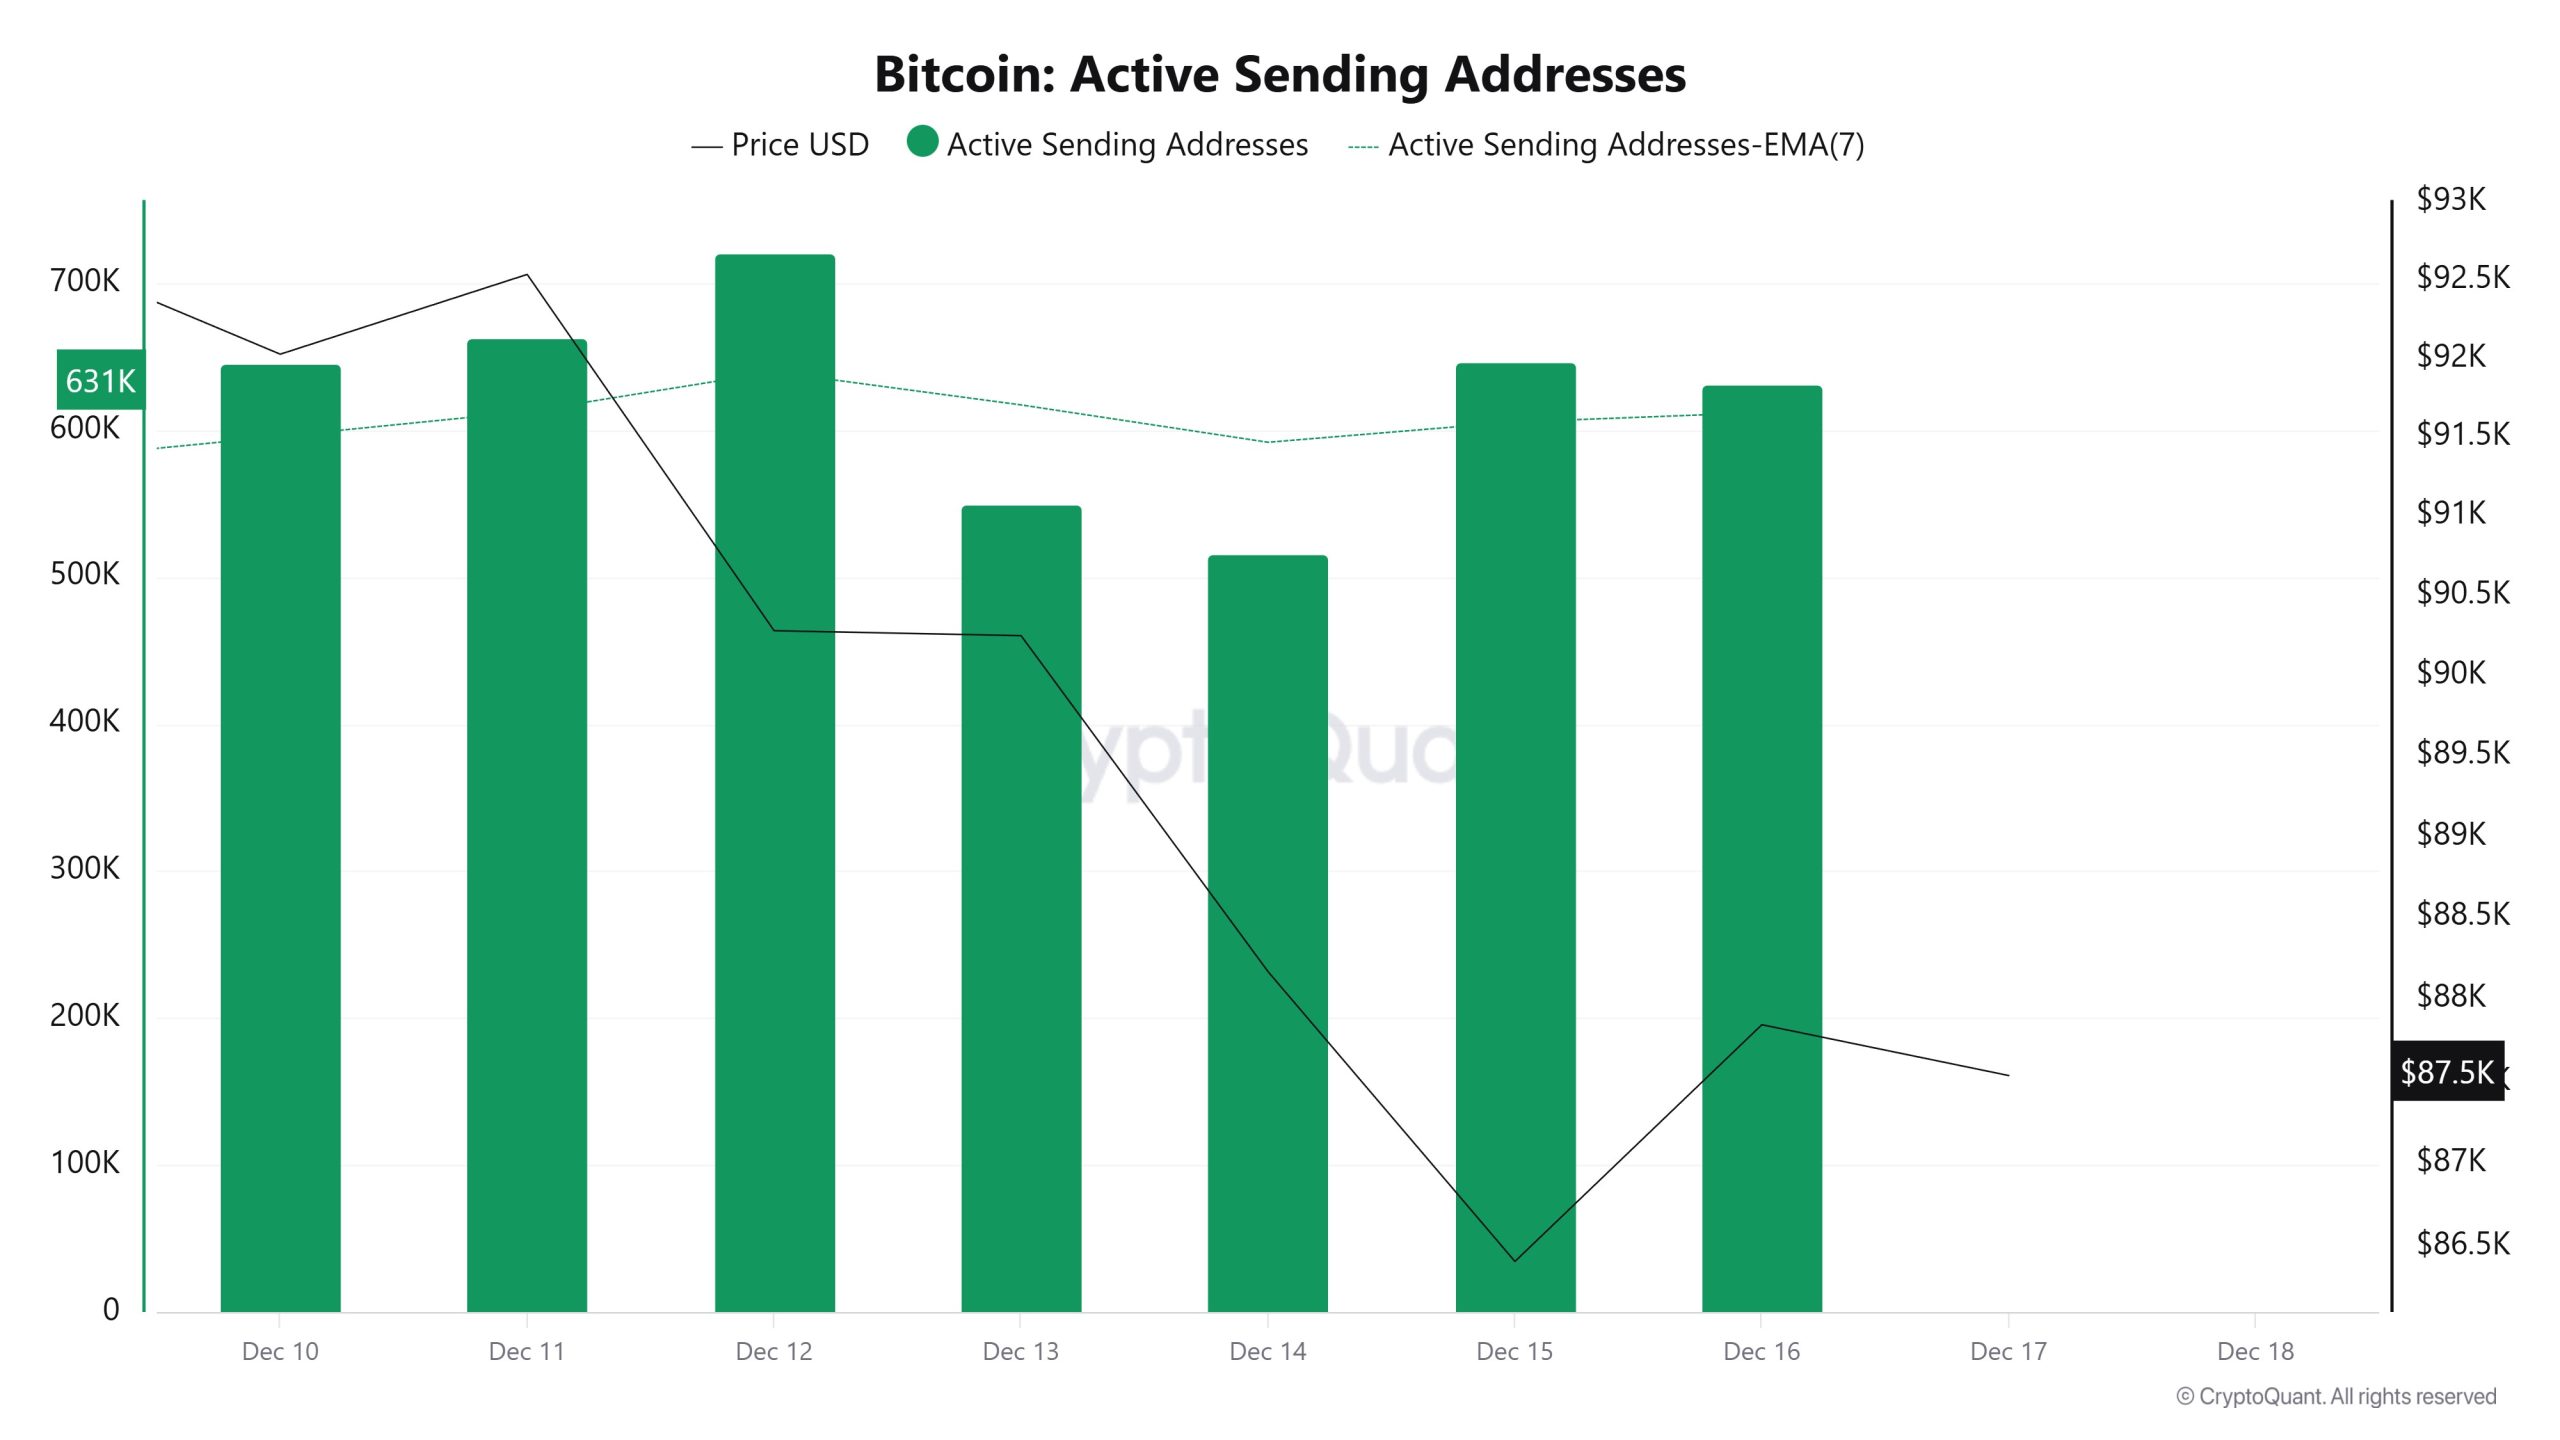
Between December 10 and December 17, an upward trend was observed in the “active sending addresses” metric. On the day the price reached its highest level, this metric stood at 720,678, indicating that user activity on the Bitcoin network was moving in parallel with the price. This data indicates that the $86,000 level is supported not only by price but also by on-chain address activity, which is sales-based. Overall, the Active Sending Addresses metric followed a high trajectory during this period.
Active Receiving Addresses
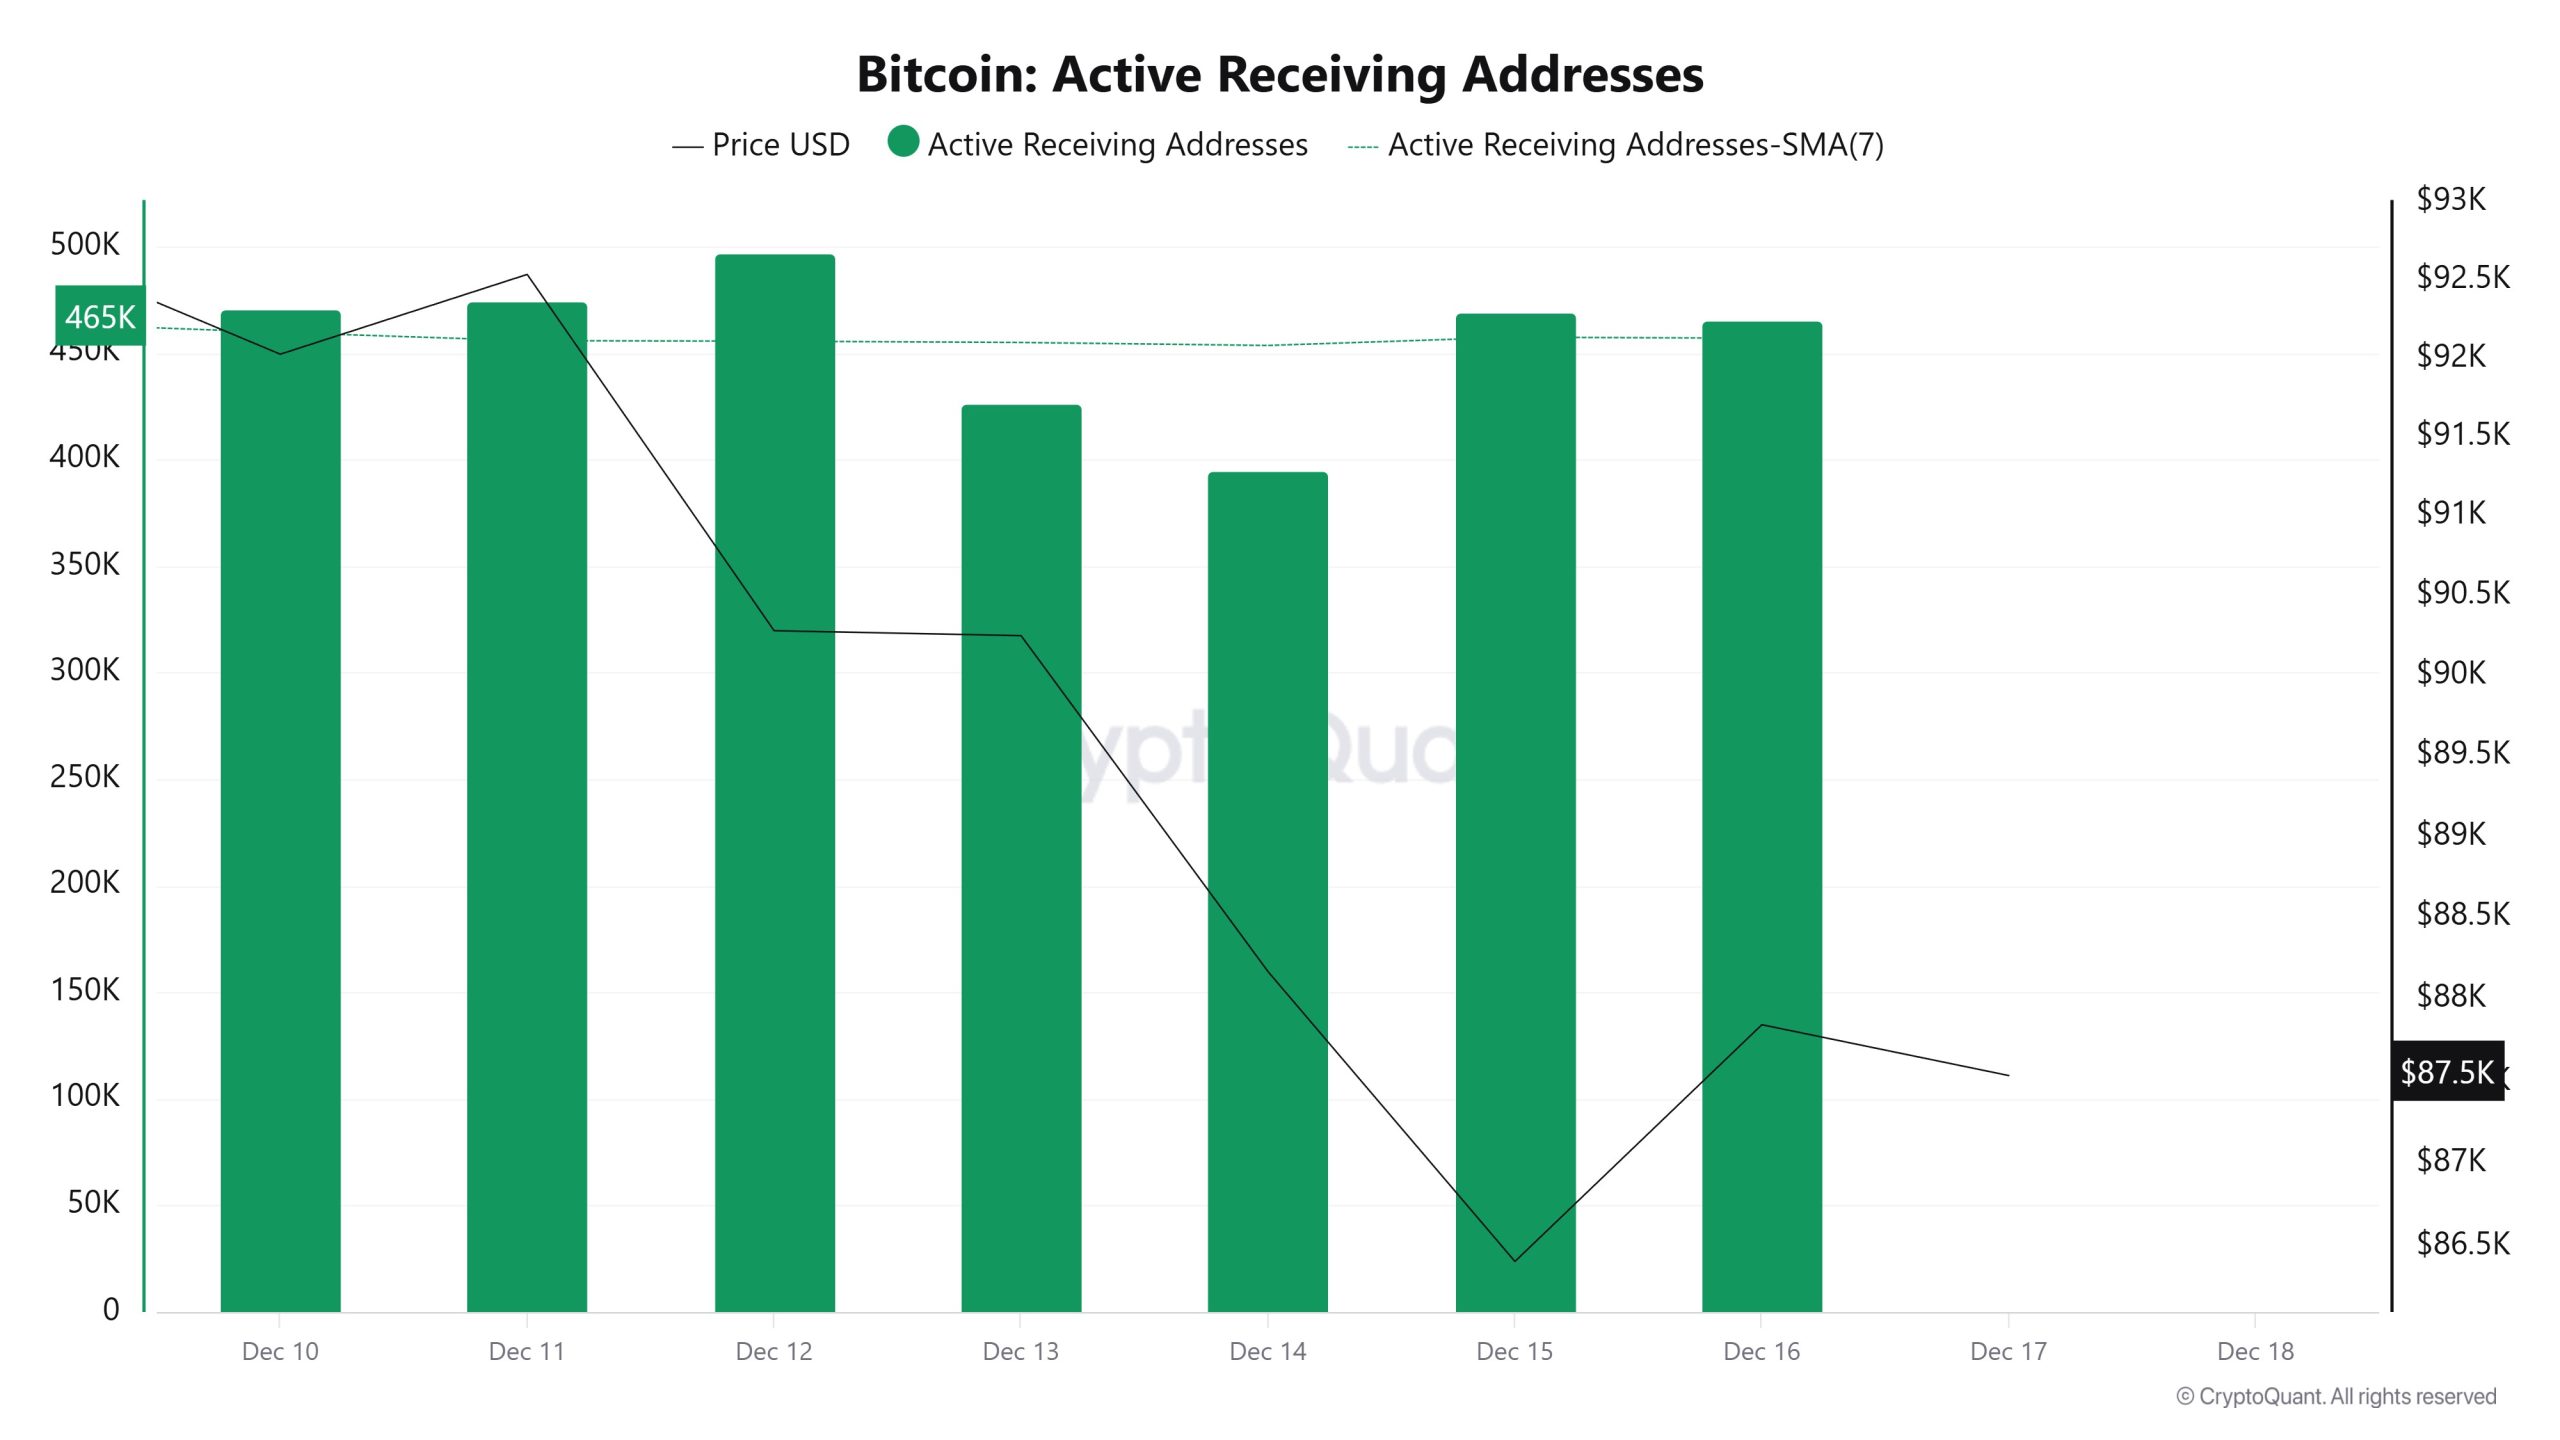
Between December 10 and December 17, active receiving addresses experienced a typical increase alongside the Black Line (price line). On the day the price reached its peak, active receiving addresses rose to 497,047 levels, indicating that buyers acquired Bitcoin at around the $86,000 level.
Breakdowns
MVRV
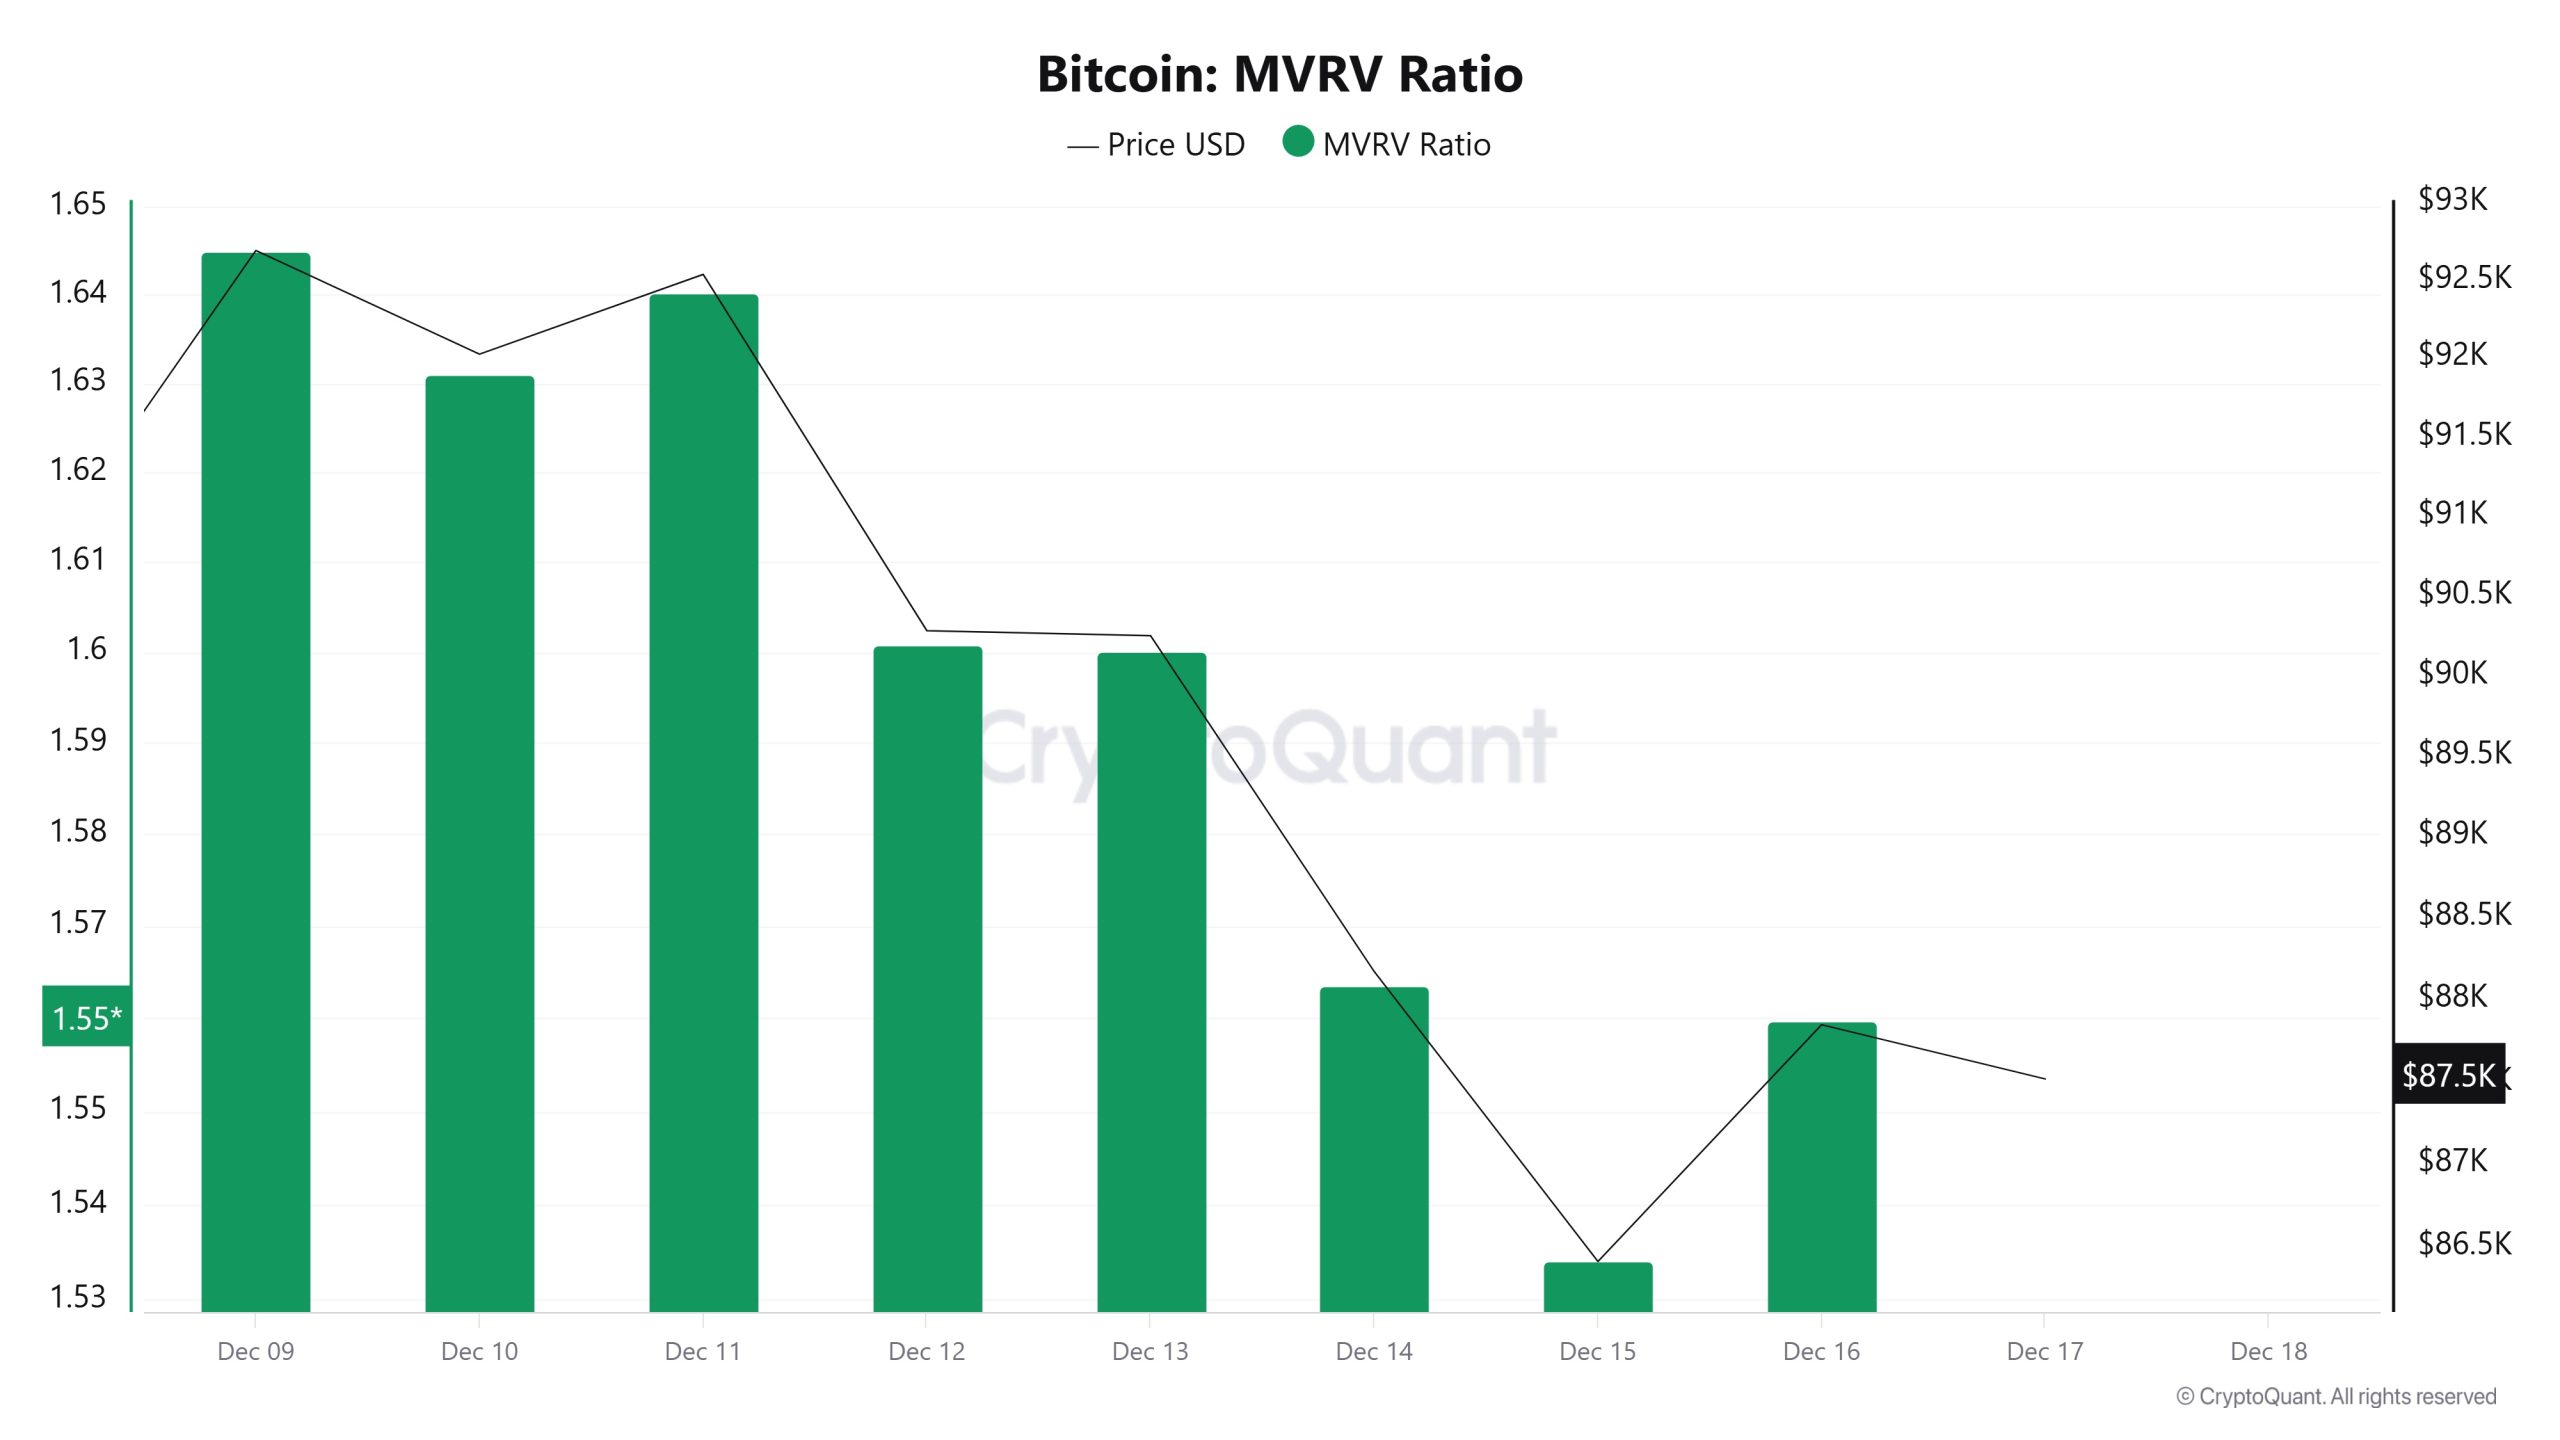
On December 10, while the Bitcoin price was trading at $92,026, the MVRV Ratio stood at 1.631.
As of December 16, the Bitcoin price fell to $87,847, recording a 4.54% decline, while the MVRV Ratio fell to 1.559, recording a 4.41% decline.
Realized Price
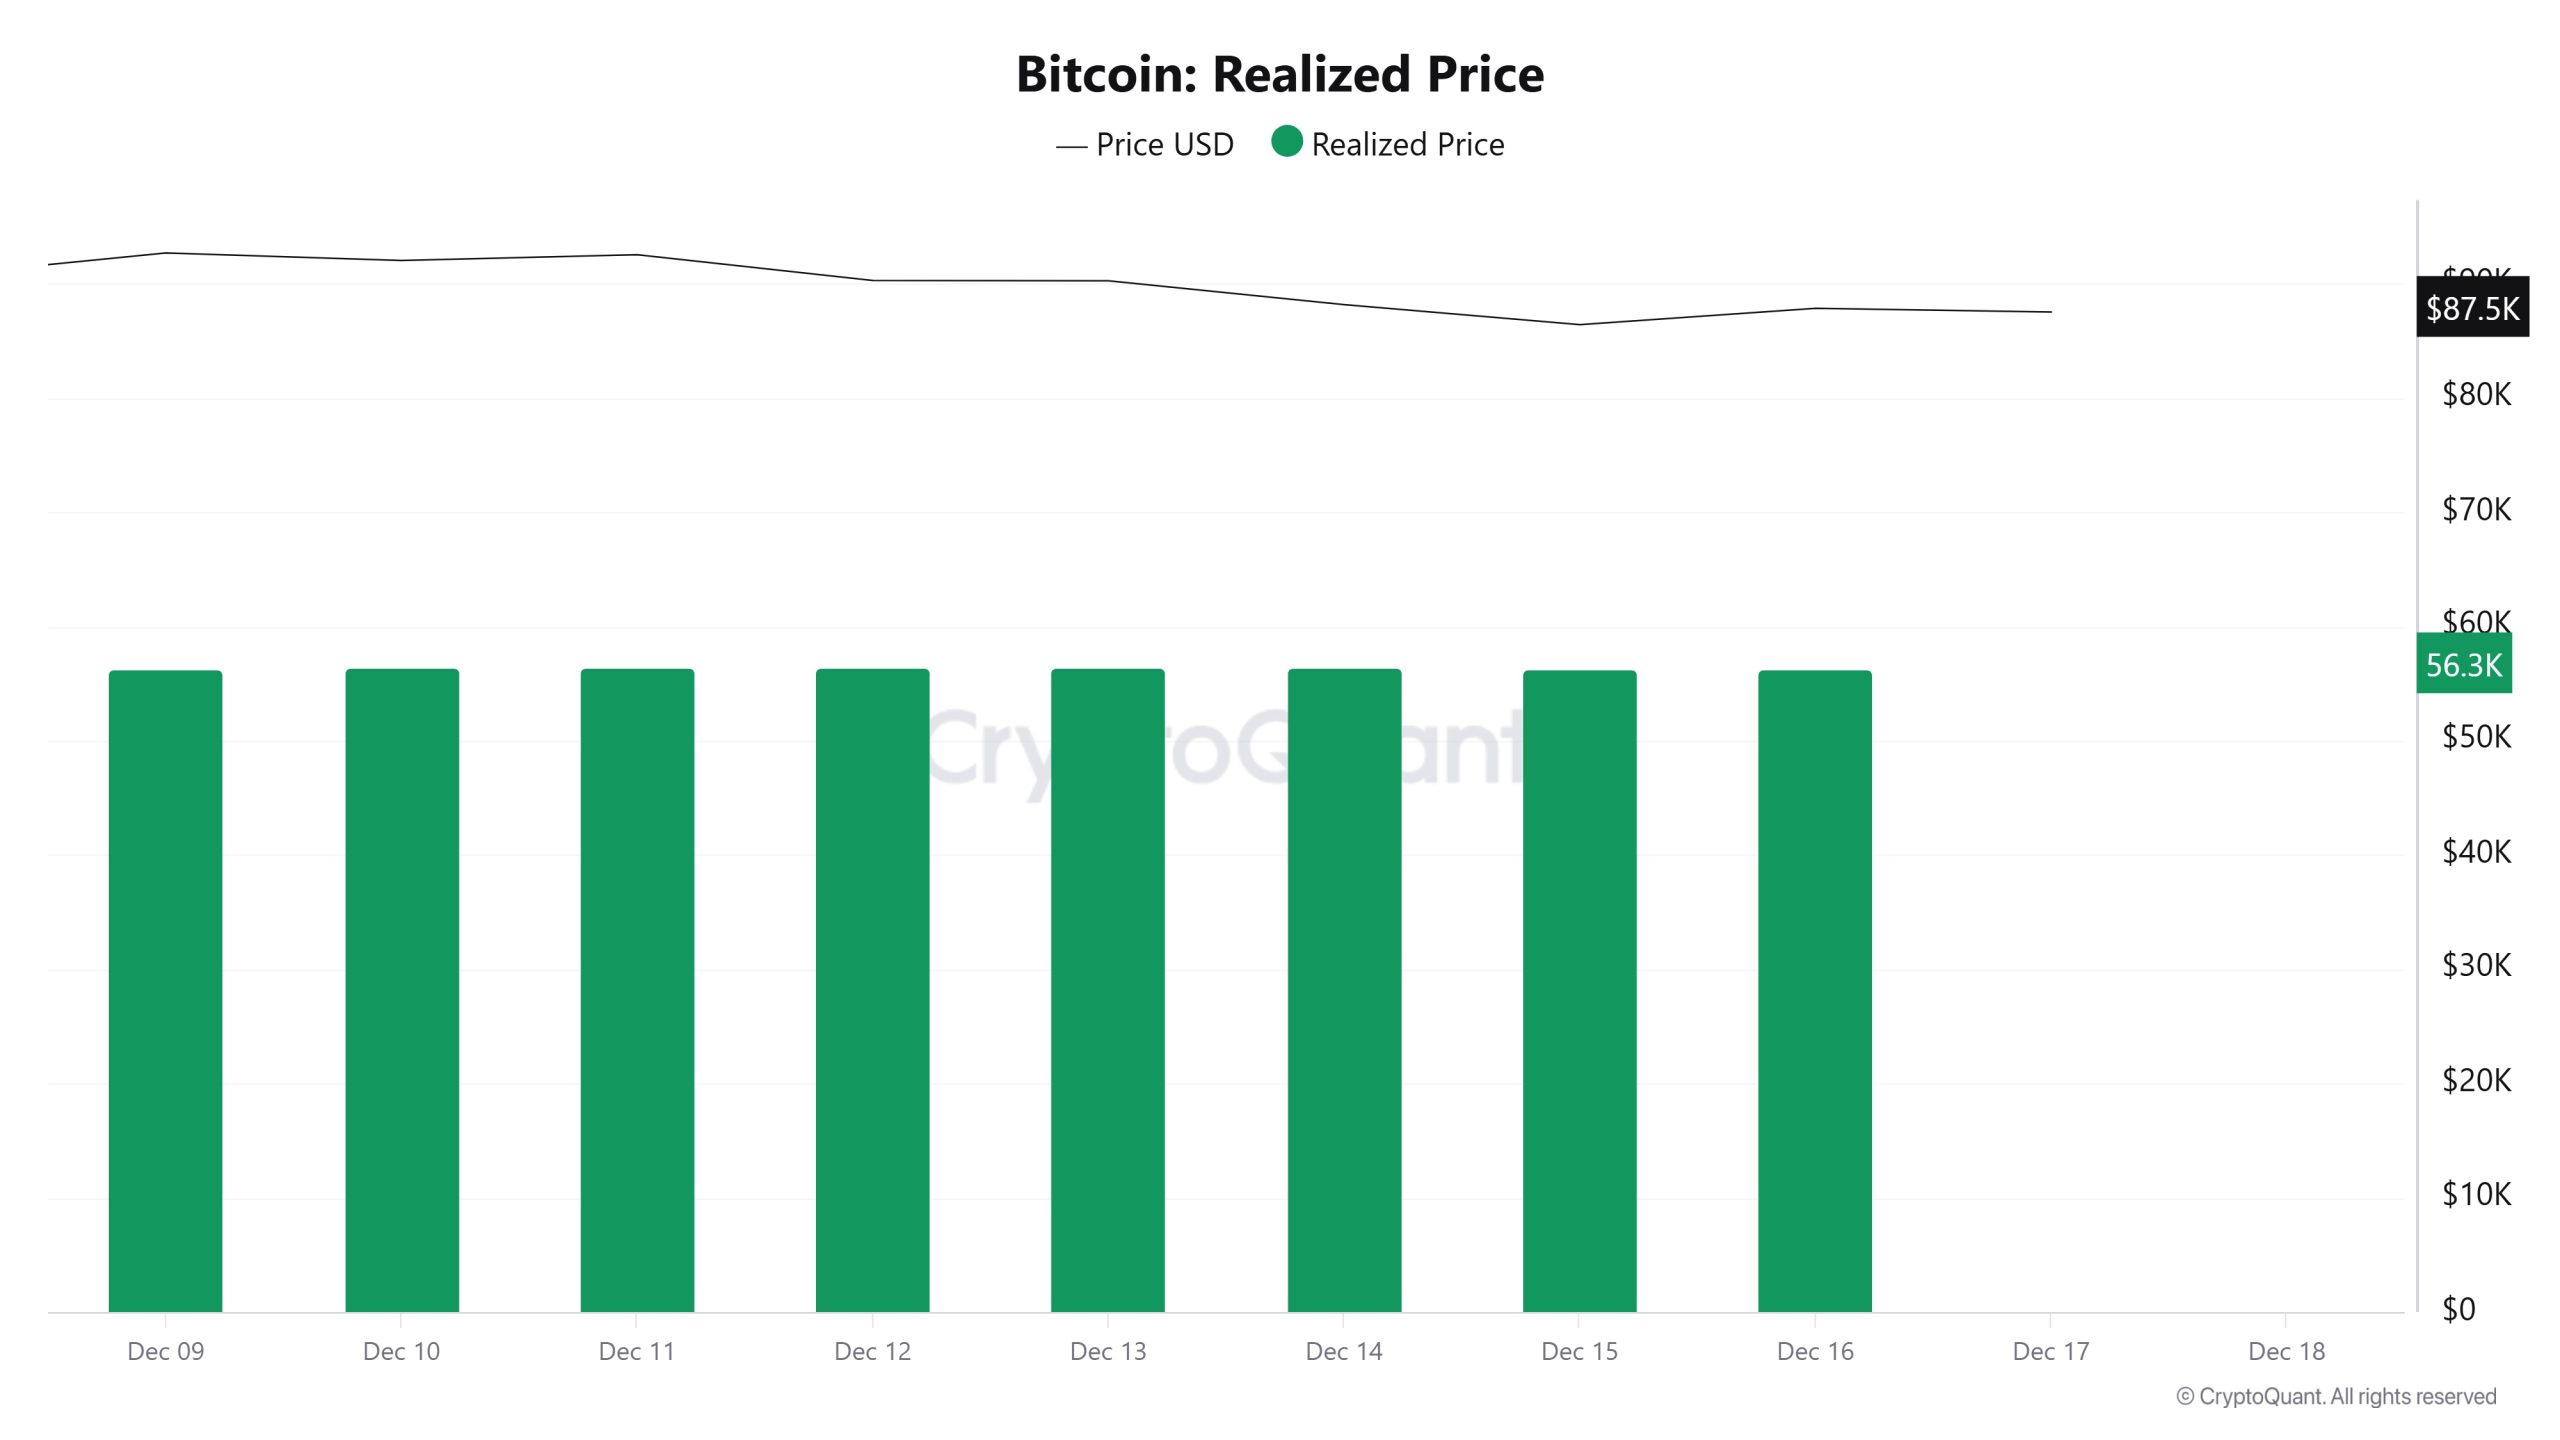
On December 10, Bitcoin was trading at $92,026, while the Realized Price was at 56,421.
As of December 16, the Bitcoin price fell to $87,847, while the Realized Price declined to $56,324, marking a 0.17% drop.
Spent Output Profit Ratio (SOPR)
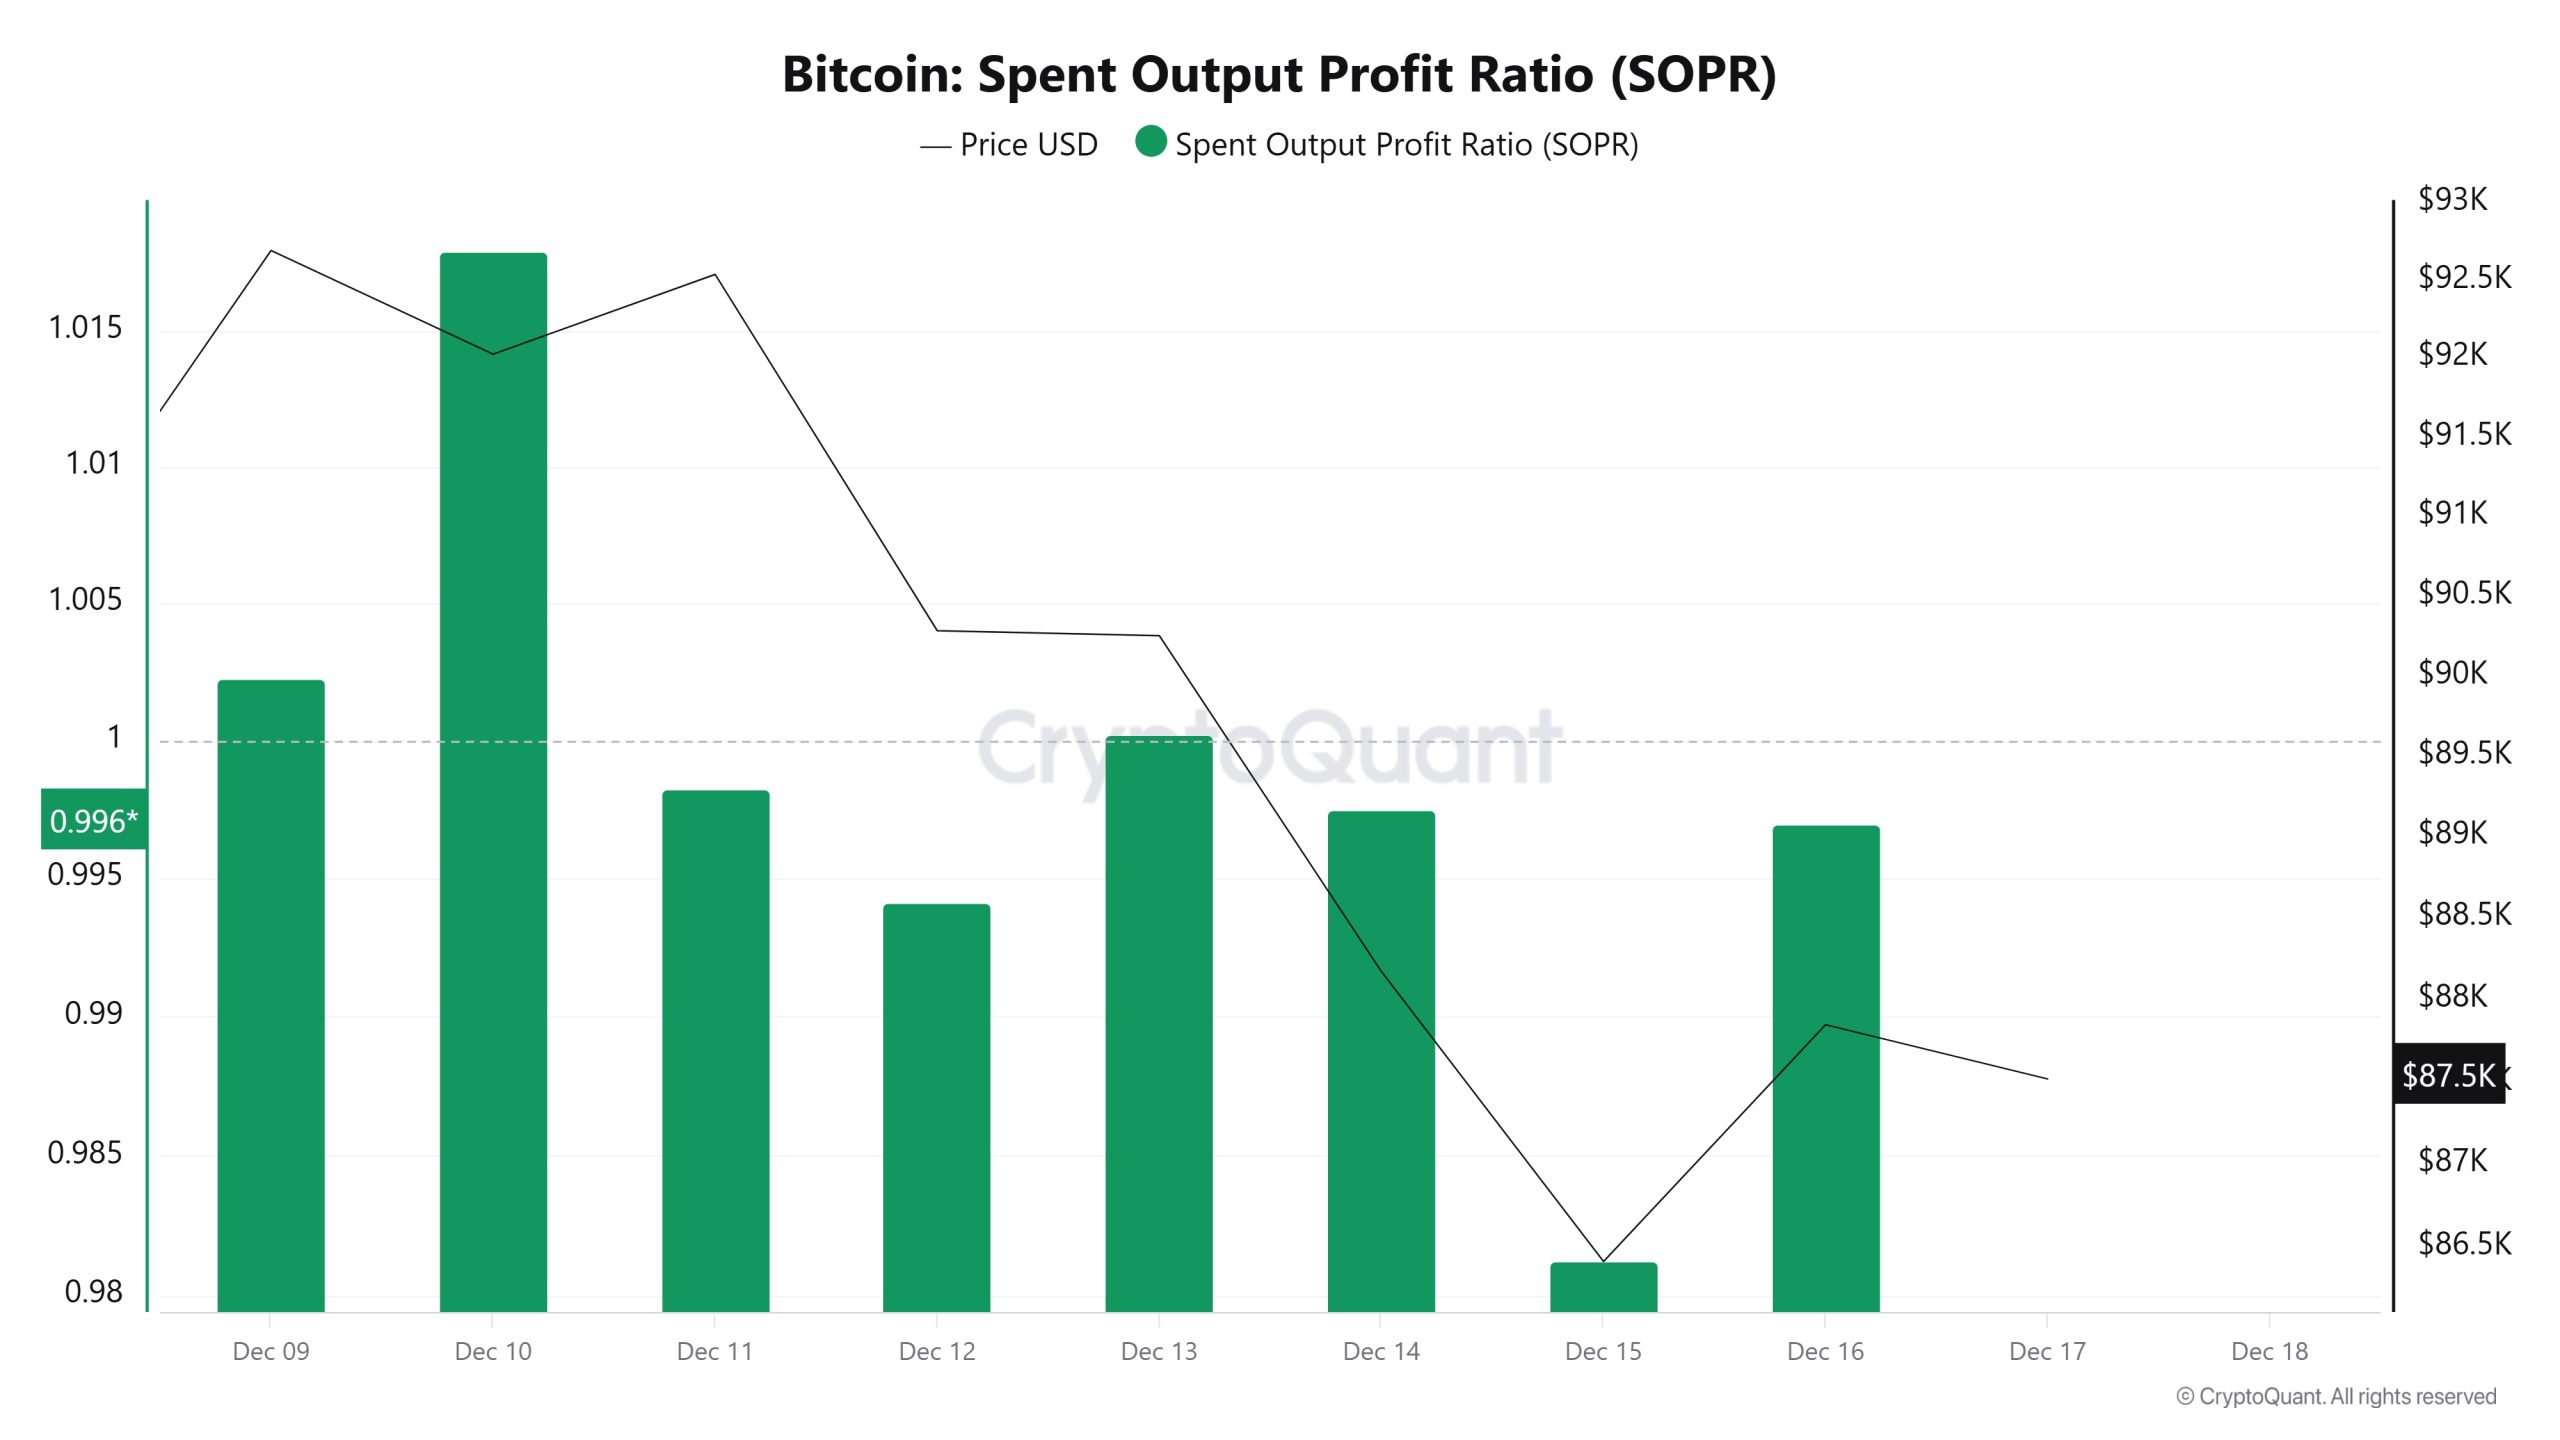
On December 10, while the Bitcoin price was trading at $92,026, the SOPR metric was at 1.017.
As of December 16, the Bitcoin price fell to $87,847, while the SOPR metric declined to 0.996, recording a 2.06% drop.
Derivatives
Open Interest
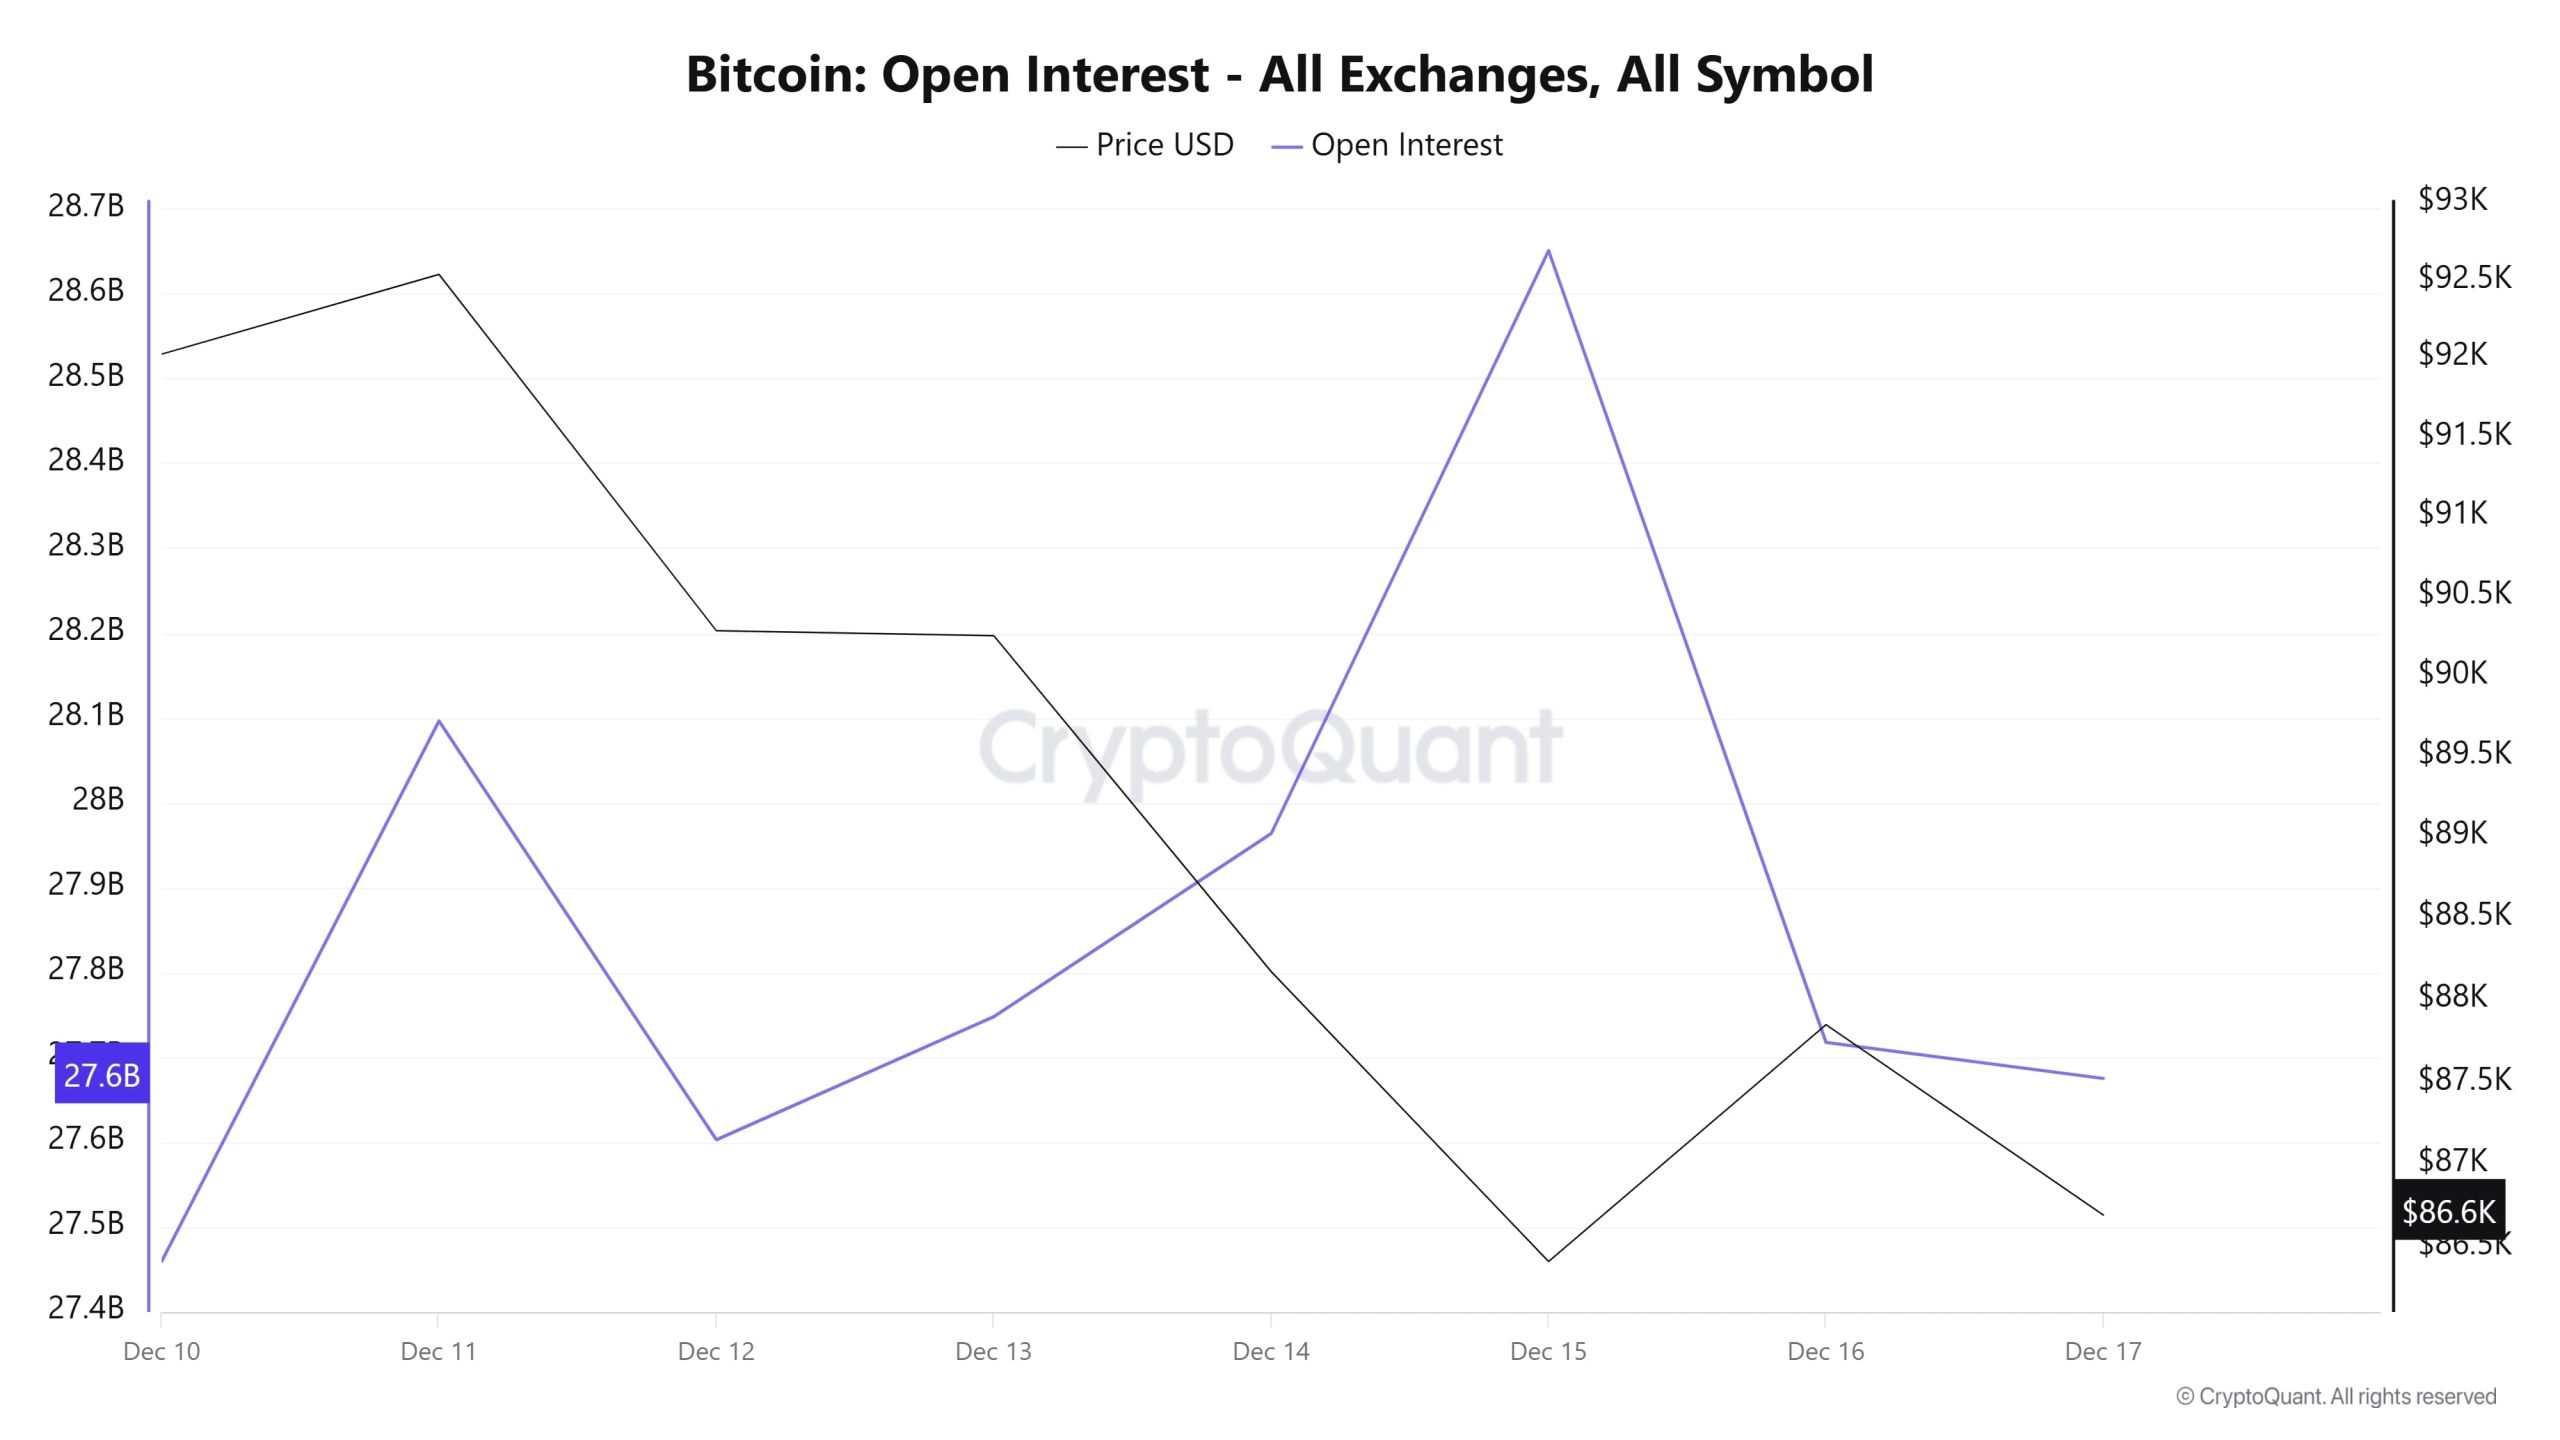
When examining the BTC open interest chart, there appears to be a clear divergence between price and open interest. Between December 10 and 11, open interest rose while the price fell. After December 12, until December 15, despite open interest continuing its upward movement, the sharp decline in price is noteworthy. This structure indicates an increase in short positions in the market, as well as a strengthening of spot sales. Subsequently, the decline in open interest and the slight upward movement in price indicate that these short positions are beginning to close.
The overall picture reveals that leverage usage is high in the market in the short term and that the price exhibits a fragile structure against this intense positioning.
Funding Rate
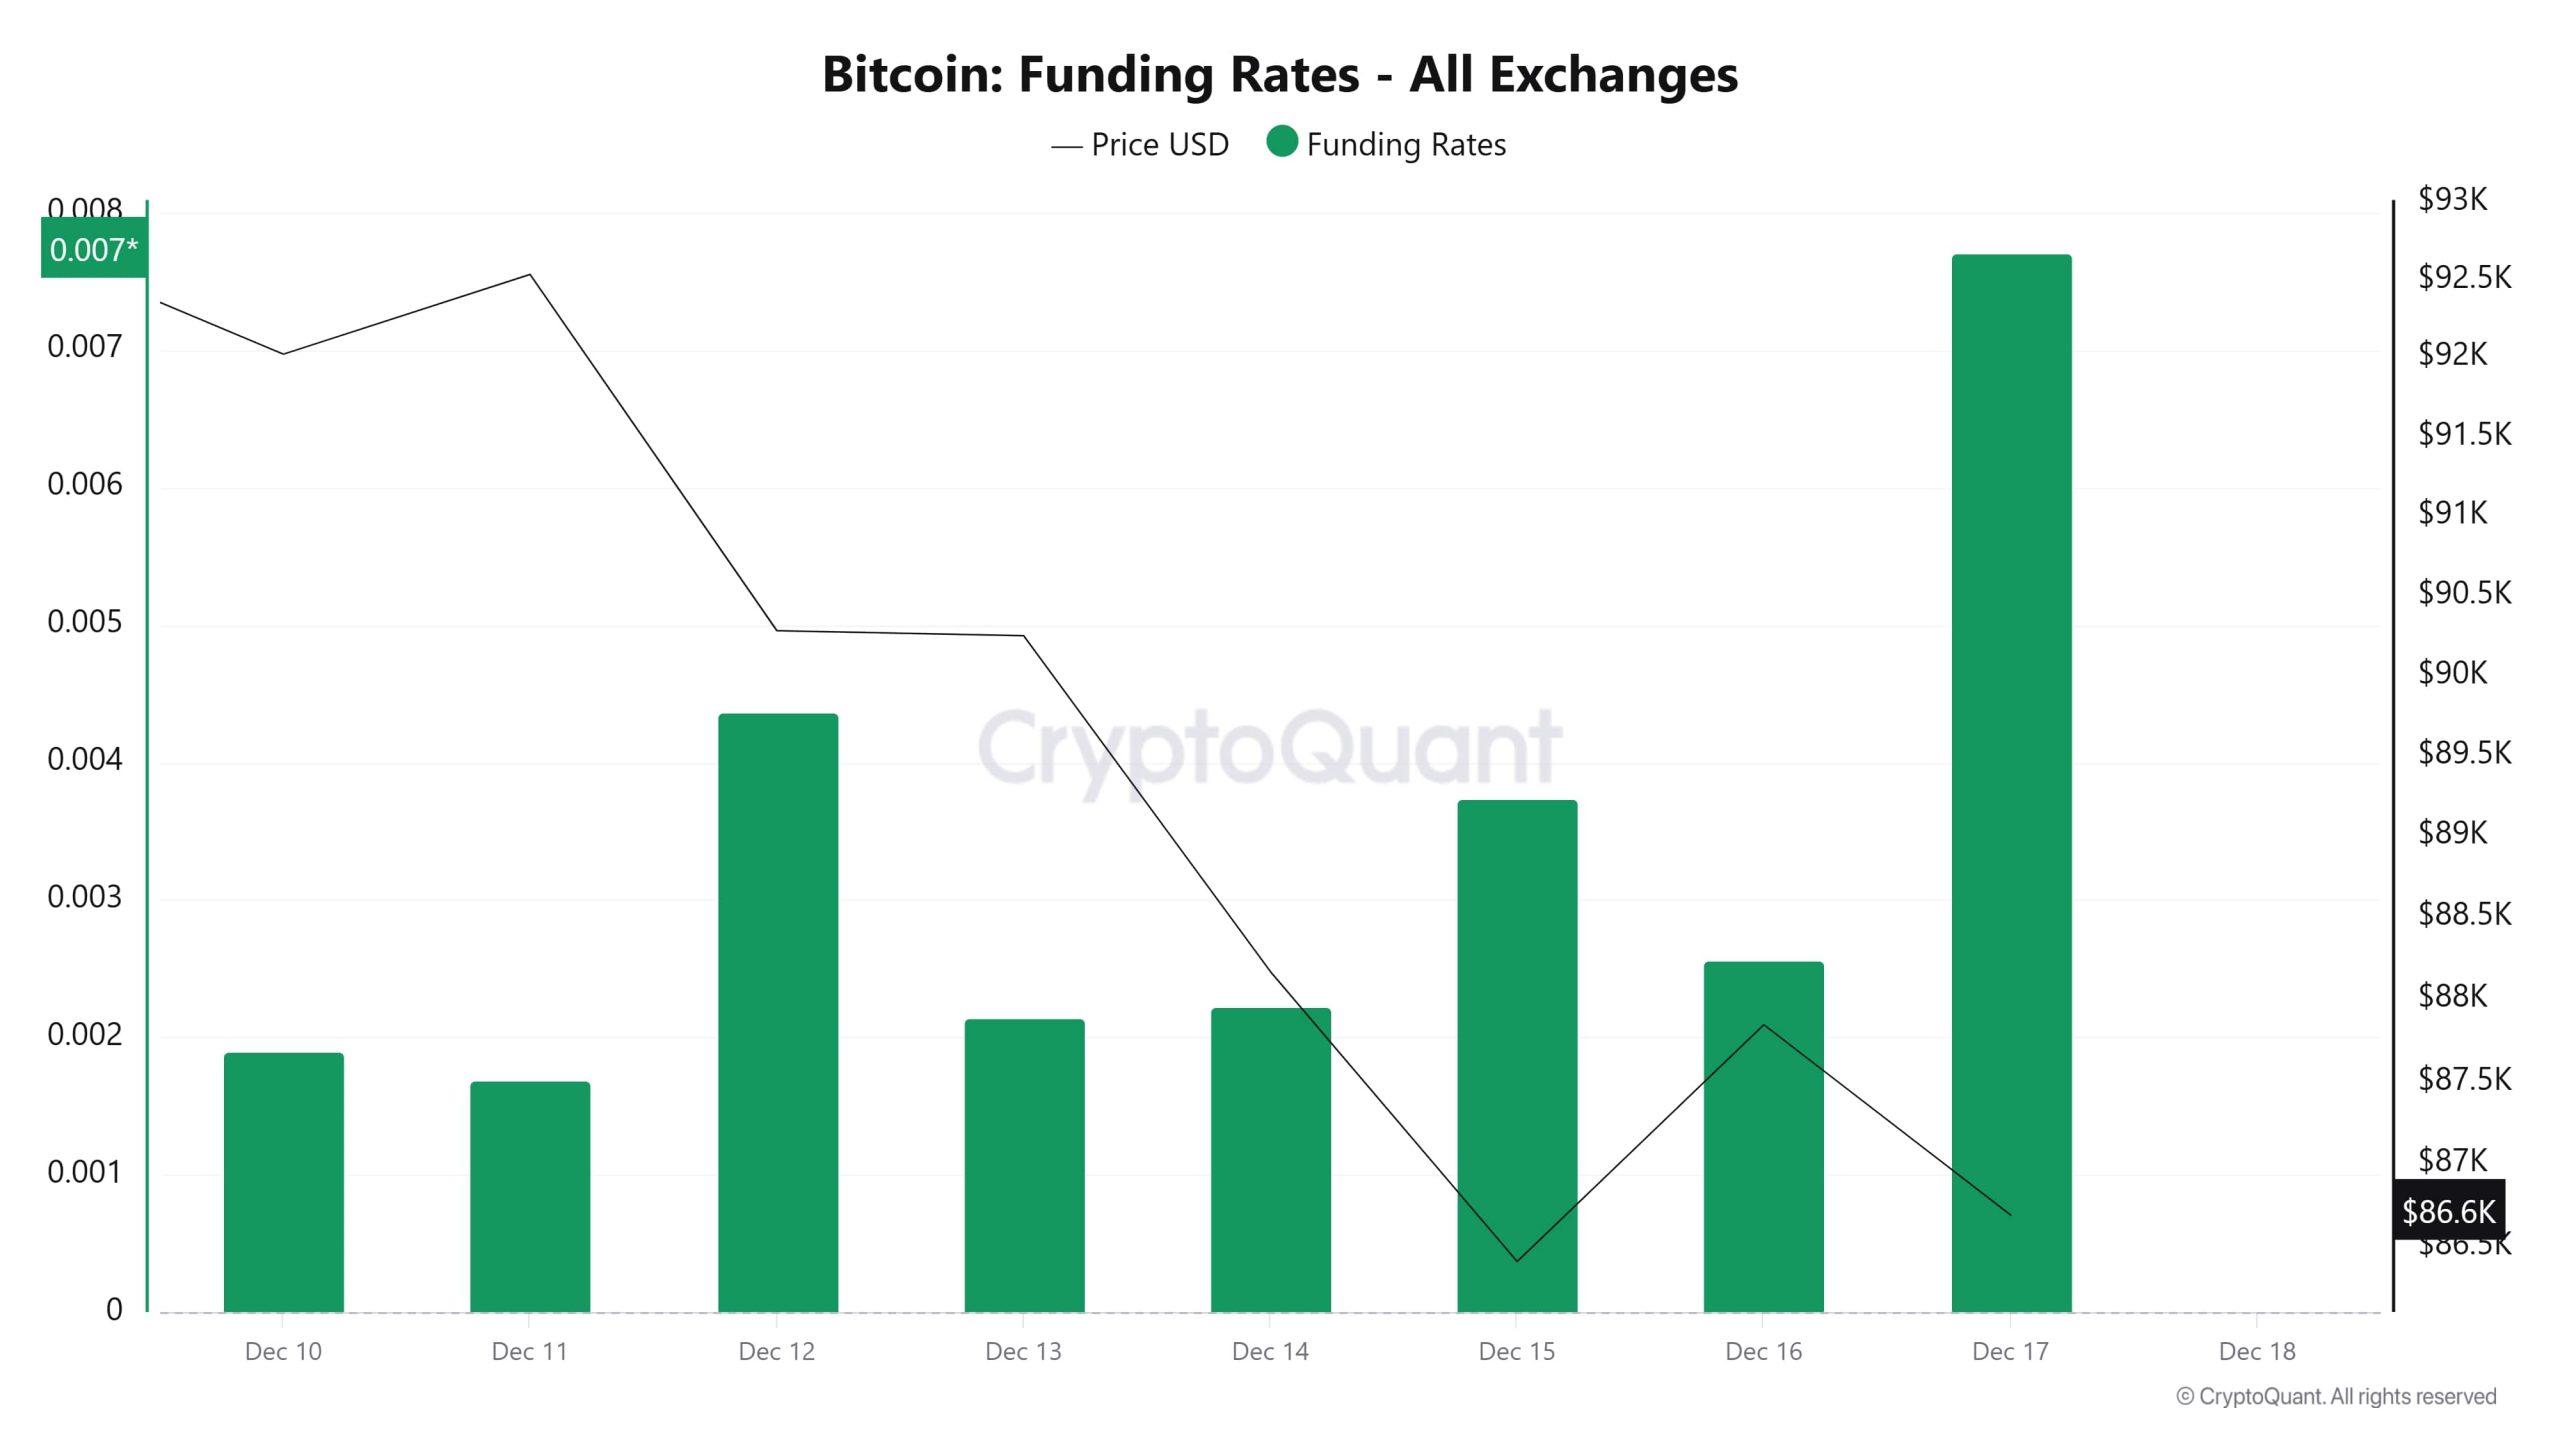
The chart shows that Bitcoin funding rates remained positive between December 10 and 17, indicating that long positions gained prominence in the market. In particular, the significant increase in the funding rate on December 17 signals an intensification of leveraged buy-side transactions.However, the price trend is downward, with Bitcoin falling from the $90,000 range to around $86,600. The weakening price despite the high funding rate indicates that long positions are under pressure and volatility may increase in the short term.
Long & Short Liquidations
Last week, the BTC price fell from $94,500 to $85,000, resulting in a total of $273 million in long liquidations and $230 million in short liquidations.
| Date | Long Amount (Million $) | Short Amount (Million $) |
|---|---|---|
| December 10 | 21.85 | 28.75 |
| December 11 | 54.23 | 53.04 |
| December 12 | 36.91 | 15.57 |
| December 13 | 4.64 | 1.15 |
| December 14 | 38.97 | 2.18 |
| December 15 | 102.54 | 27.10 |
| December 16 | 14.20 | 102.54 |
| Total | 273.34 | 230.33 |
Supply Distribution
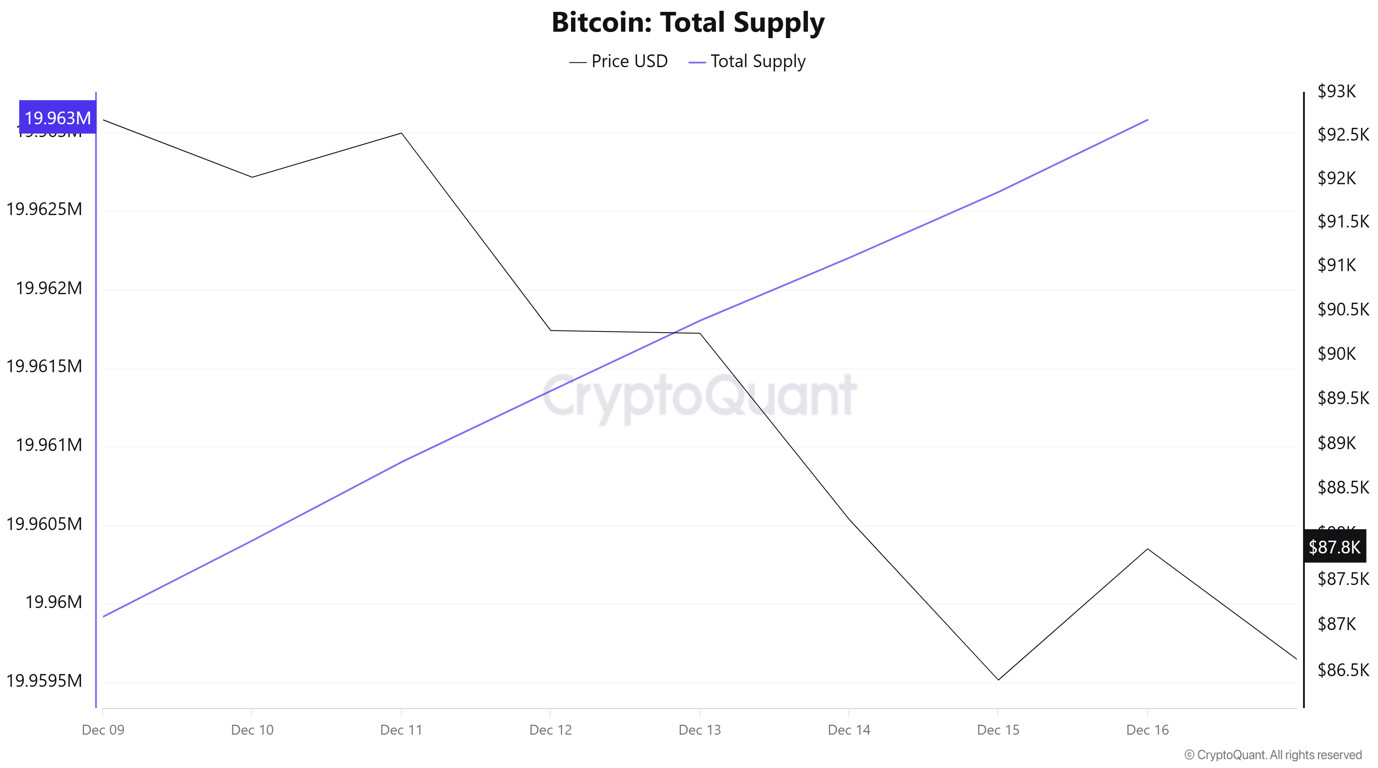
Total Supply: Reached 19,963,080 units, an increase of approximately 0.029% compared to last week.
New Supply: The amount of BTC produced this week was 5,822.
Velocity: The velocity, which was 12.29 last week, reached 12.28 as of December 16.
| Wallet Category | December 9, 2025 | 12/16/2025 | Change (%) |
|---|---|---|---|
| < 1 BTC | 8.4455% | 8.4463% | 0.0008 |
| 1 – 10 BTC | 11.3190% | 11.3183% | -0.0007% |
| 10 – 100 BTC | 23.1525% | 23.1963% | 0.0438% |
| 100 – 1k BTC | 28.0888% | 28.3483% | 0.2595% |
| 1k – 10k BTC | 20.9261% | 20.7914% | -0.1347% |
| 10k+ BTC | 8.0677% | 7.9881% | -0.0796% |
While limited changes were observed in the <1 BTC and 1–10 BTC groups, there was a slight increase in the 10–100 BTC band. The strongest positive divergence occurred in the 100–1,000 BTC range, and we see that the share increase in this segment indicates a tendency toward accumulation among medium-scale investors. In contrast, the pullback seen in the 1,000–10,000 BTC group indicates profit-taking or position reduction in this segment, while the limited decline in wallets of 10,000 BTC and above shows that large investors remain cautious but have not completely exited the market.
Exchange Supply Ratio
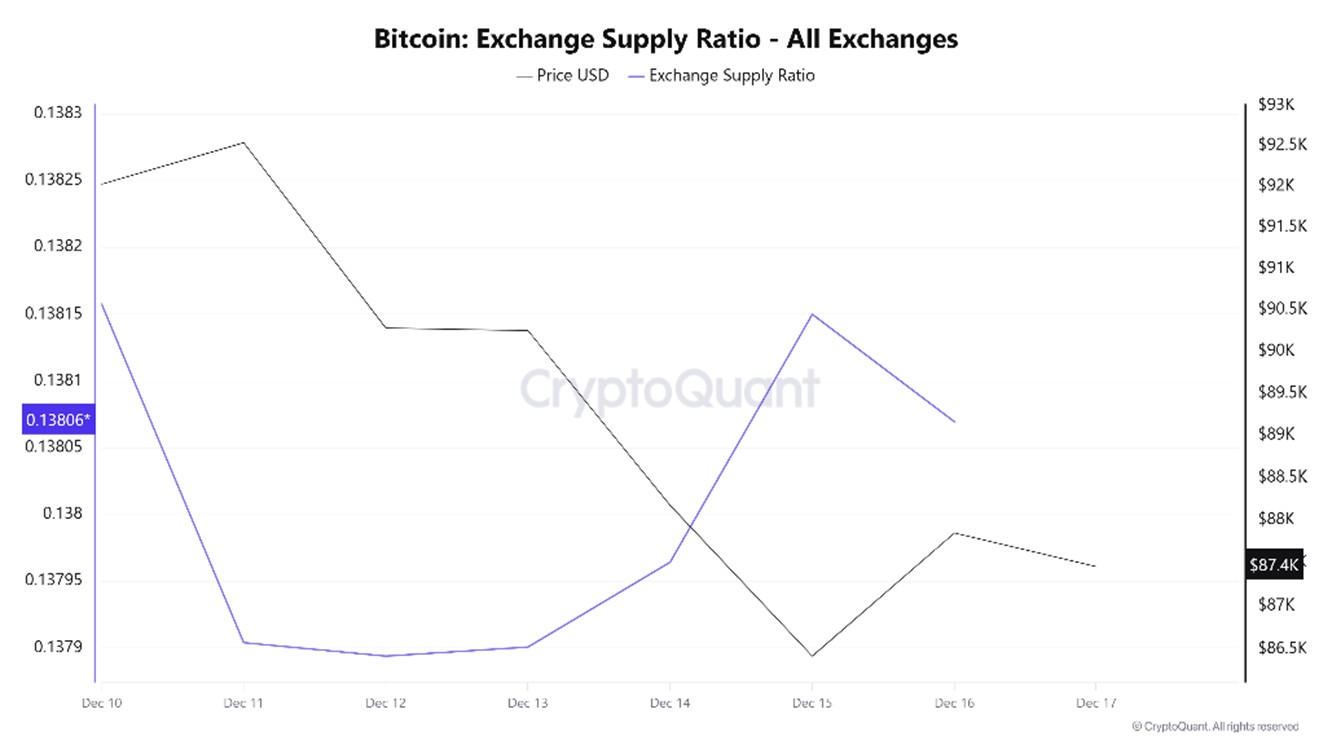
According to data obtained from the Bitcoin Exchange Supply Ratio table, which shows how much of the total supply of Bitcoins is held on exchanges, low rates have been observed this week. The general trend shows that as of December 14, there is a dominant positive correlation between the Bitcoin price and the supply rate entering exchanges. This indicates that most Bitcoins have started to be added to wallets and that the market is beginning to prepare to buy.
Between December 10 and December 17, the Bitcoin Exchange Supply Ratio decreased from 0.13815764 to 0.13806932. During this period, the Bitcoin price fell from $92,000 to $86,000. The fact that both variables moved in the same direction this week, despite the price decline, indicates a slight increase in the amount of Bitcoin supplied to exchanges and likely suggests that long-term investors have begun to increase their holdings here. It appears that an overall upward trend in the Bitcoin price may prevail.
Exchange Reserve
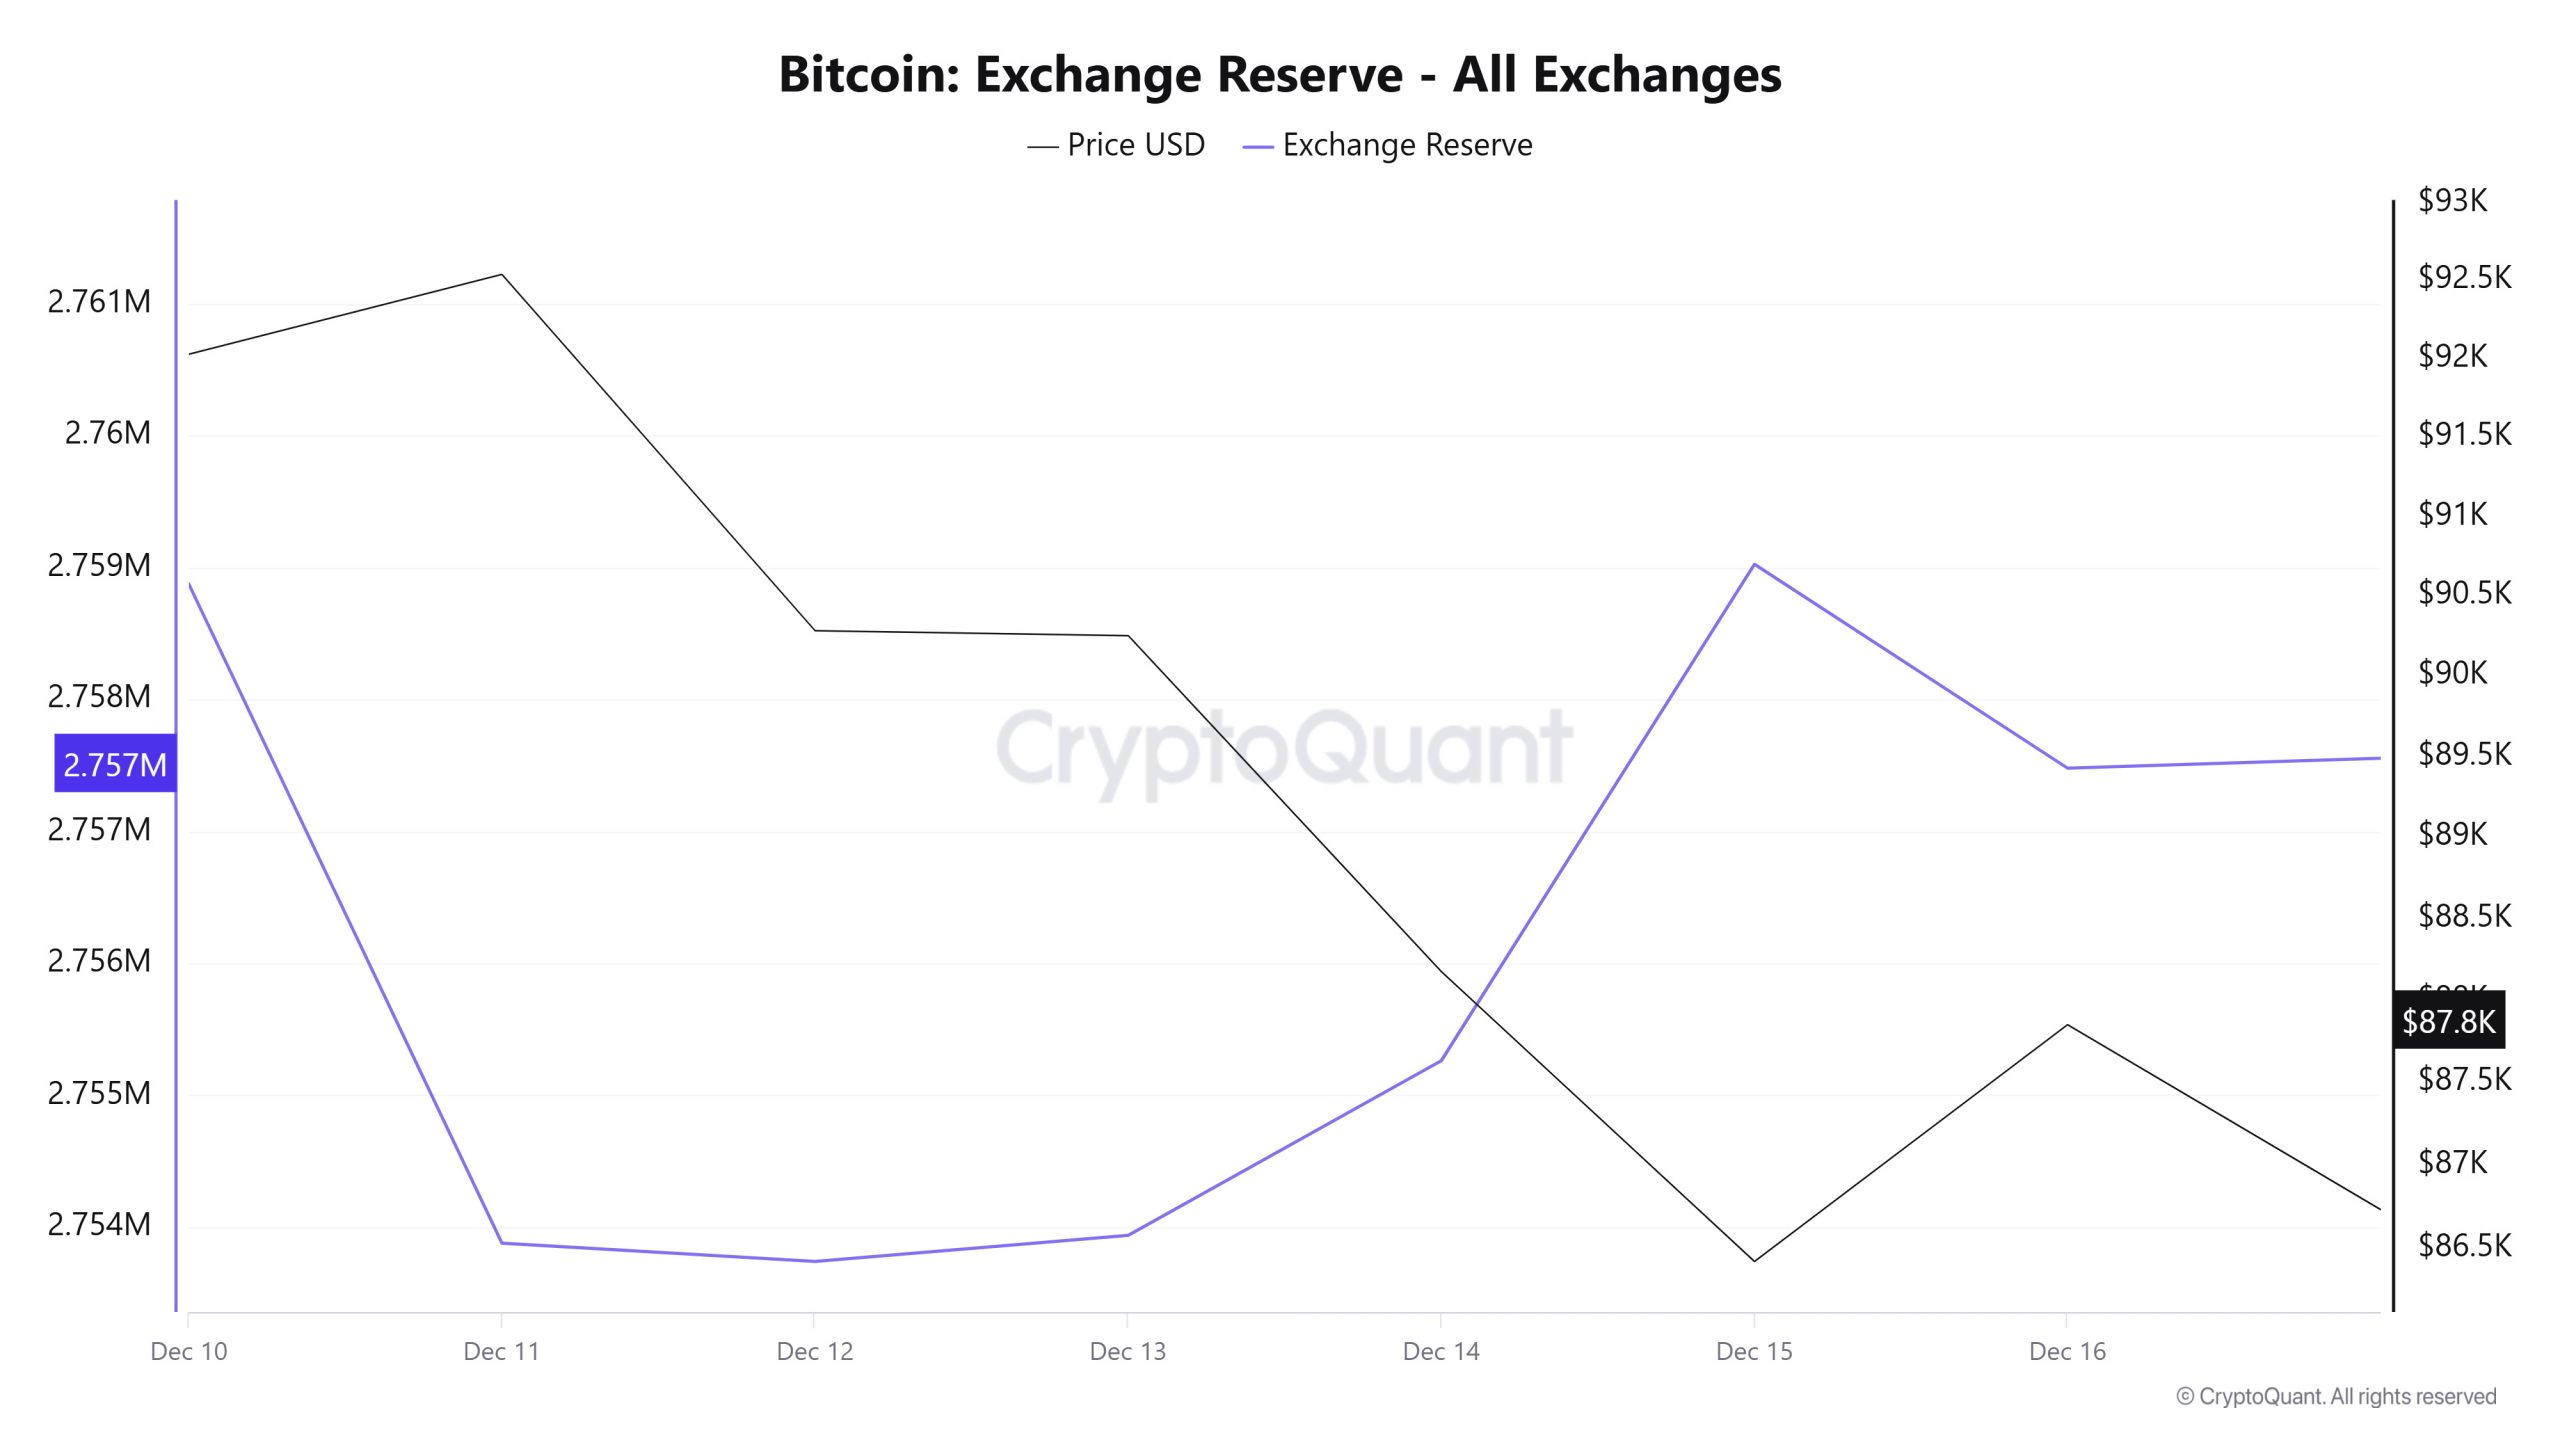
Between December 10-16, 2025, Bitcoin reserves on exchanges fell from 2,761,403 BTC to 2,757,478 BTC. A net outflow of 3,924 BTC occurred from exchange reserves, and reserves decreased by approximately 0.14%. During the same period, the price of BTC fell from $92,694 to $87,847, losing 5.23% of its value. The fact that the decline in reserves remained limited during this period of price pullback indicated that investors did not resort to panic selling and that selling pressure did not intensify on exchanges. Despite small net inflows seen on some days during this period, the general trend indicated that investors maintained a cautious stance. Pressure on the price may continue in the short term, and volatility may persist. However, the absence of a sharp increase in reserves suggests that a strong selling wave has not yet formed.
| Date | 10-Dec | 11-Dec | 12-Dec | 13-Dec | 14-Dec | 15-Dec | 16-Dec |
|---|---|---|---|---|---|---|---|
| Exchange Inflow | 39,769 | 38,645 | 33,966 | 12,336 | 15,117 | 32,059 | 31,369 |
| Exchange Outflow | 42,298 | 43,642 | 34,105 | 12,139 | 13,792 | 28,295 | 32,912 |
| Exchange Netflow | -2,528 | -4,998 | -139 | 198 | 1,325 | 3,764 | -1,543 |
| Exchange Reserve | 2,758,874 | 2,753,877 | 2,753,738 | 2,753,935 | 2,755,260 | 2,759,024 | 2,757,478 |
| BTC Price | 92,694 | 92,537 | 90,280 | 90,249 | 88,171 | 86,417 | 87,847 |
Fees and Revenues
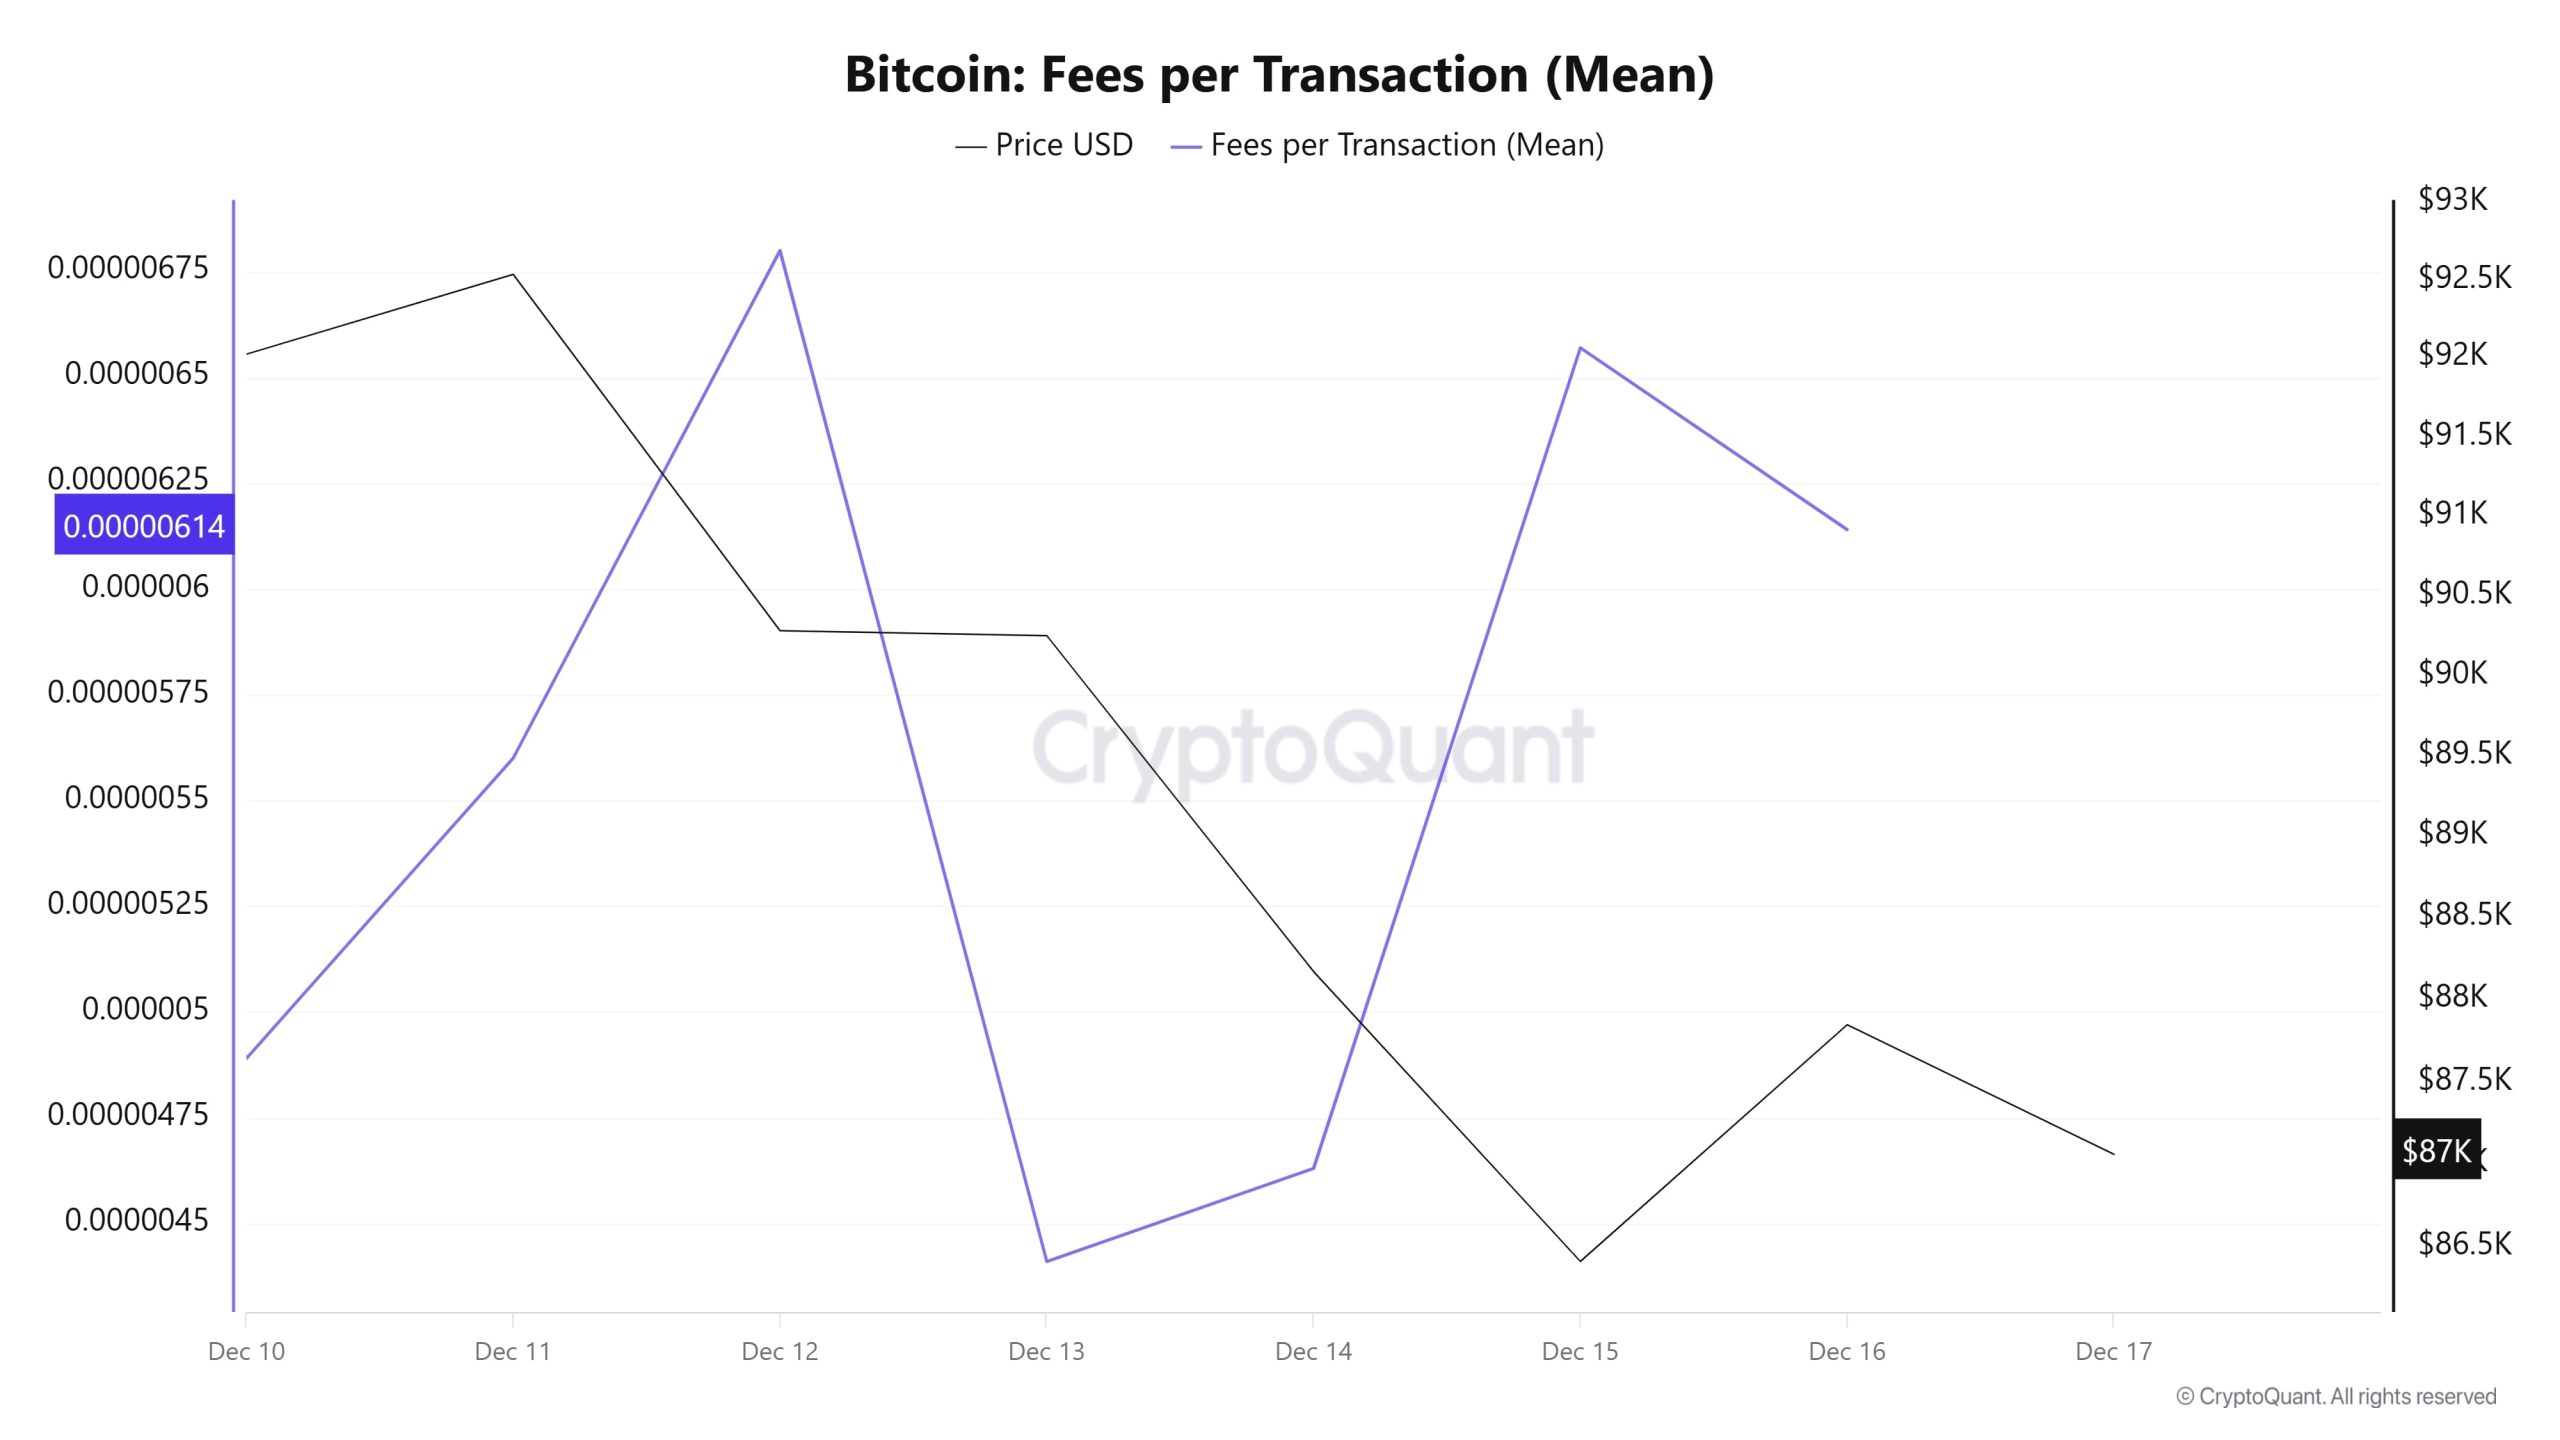
When examining the Bitcoin Fees per Transaction (Mean) data for the period between December 10-16, 2025, the indicator reached 0.00000489 on December 10, the first day of the week. The indicator followed a volatile trend until December 12, reaching the week’s highest value of 0.0000068 on that date. Following this level, the indicator retreated with the weakening of Bitcoin price volatility as of December 13 and reached the week’s lowest value at 0.00000441. On December 16, the last day of the weekly period, the indicator completed the week at 0.00000614.
Bitcoin: Fees (Total)
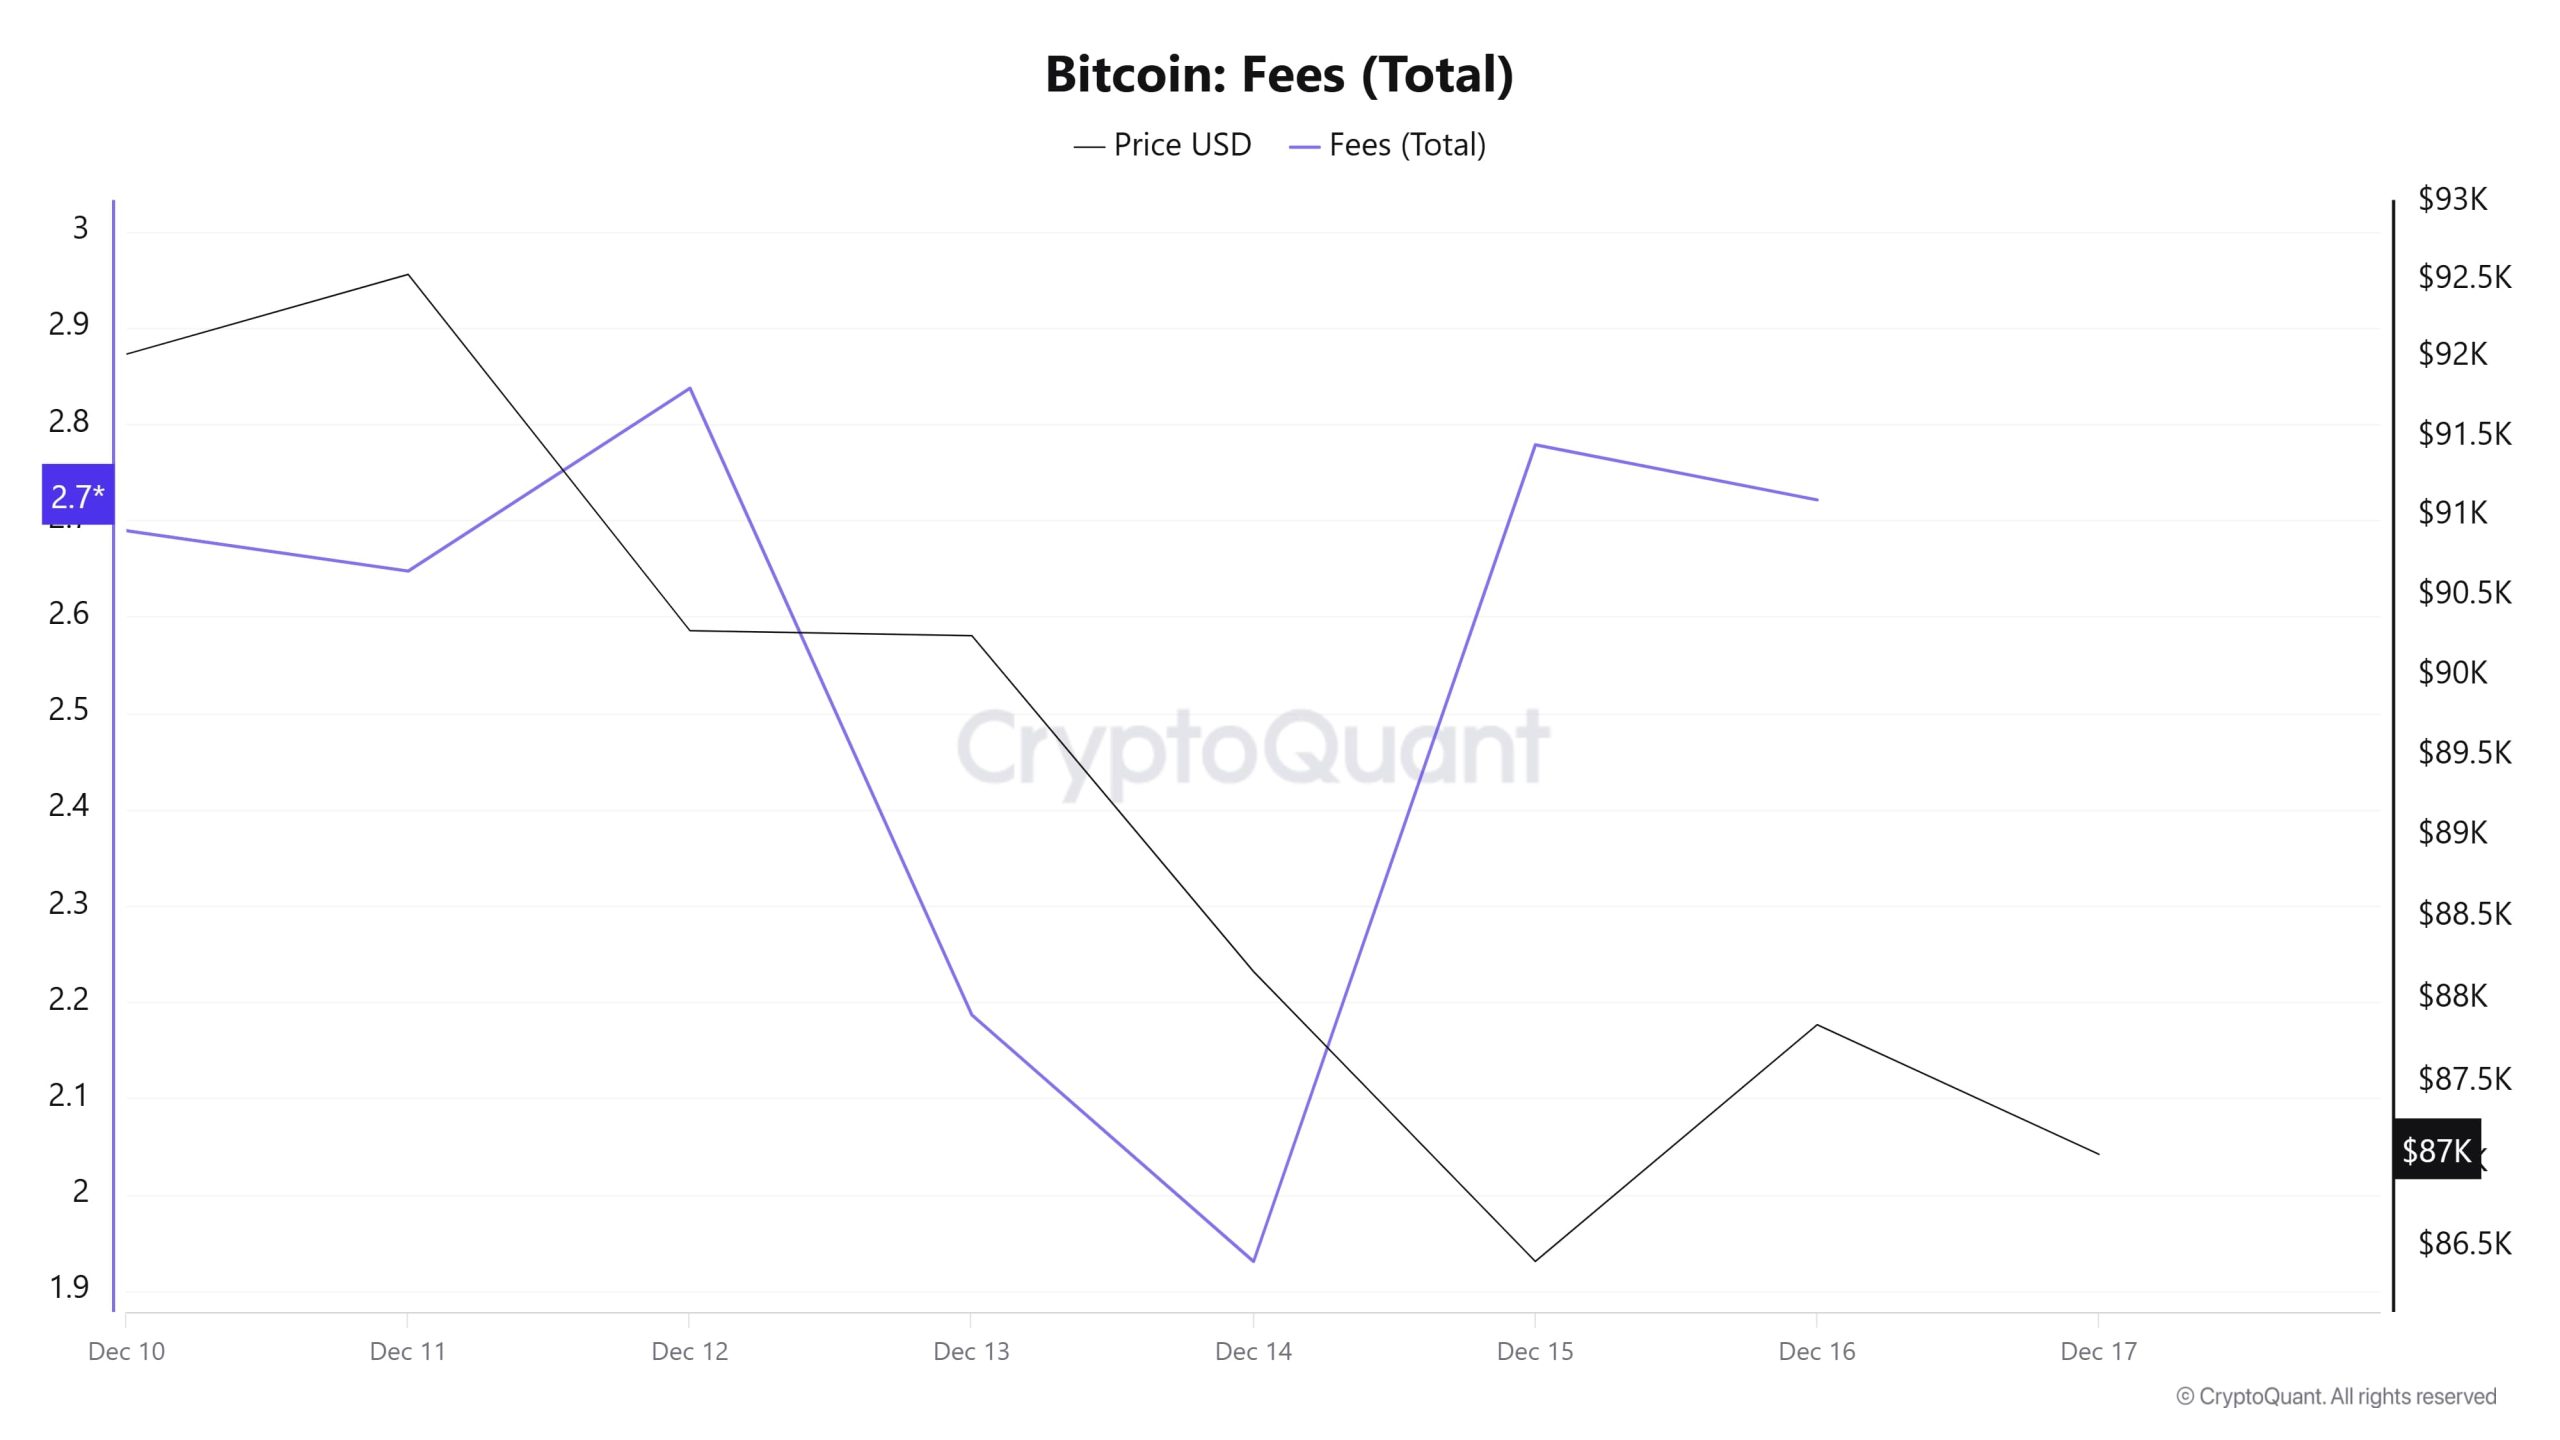
Similarly, when examining the Bitcoin Fees (Total) data between December 10-16, 2025, it was observed that on December 10, the first day of the week, the indicator stood at 2.68940365. A fluctuating trend was observed until December 14, and on this date, the indicator recorded the week’s lowest value at 1.93046116. In this context, as a result of the increase in Bitcoin price volatility as of December 14, the indicator regained momentum and followed a positive trend due to the impact of price volatility. On December 16, the last day of the weekly period, the indicator closed the week at 2.72140663.
Miner Flows
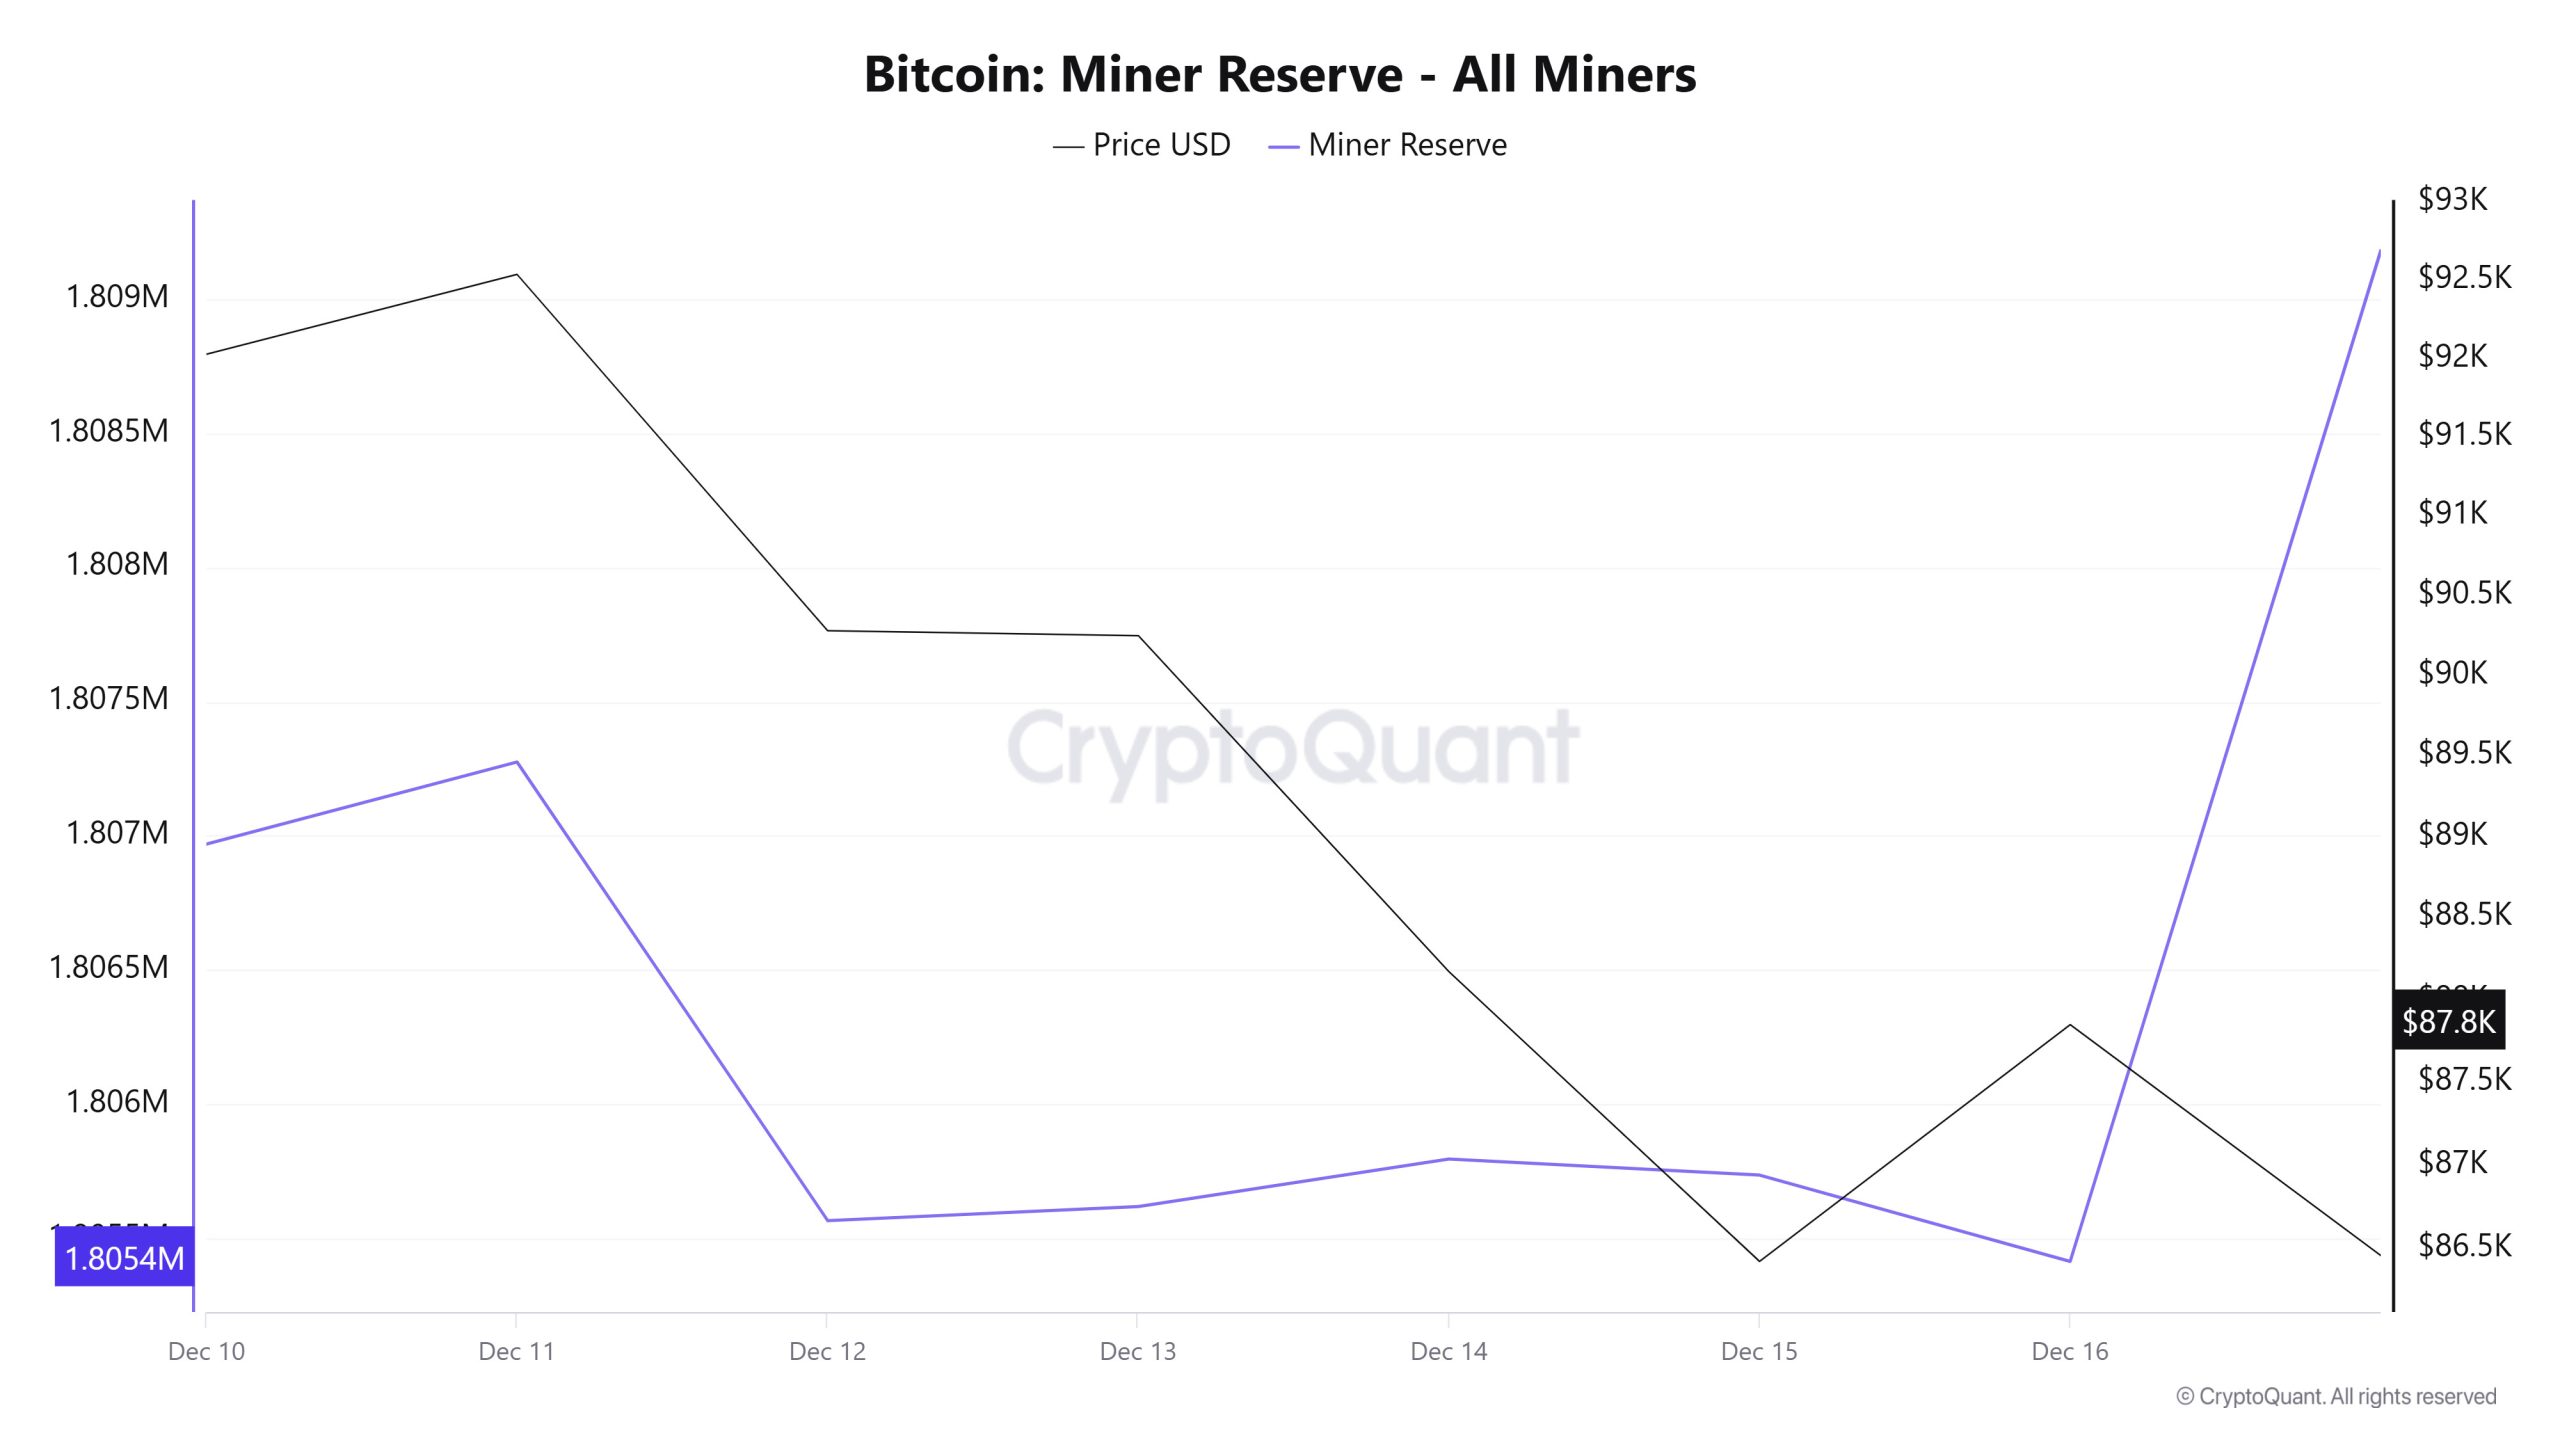
According to data obtained from the Miner Reserve table, a decrease in Bitcoin reserves held in miners’ wallets has been observed this week. During the period examined, a time-dependent correlation structure was observed between the Bitcoin price and miner reserves. However, the general trend indicates that a positive correlation between these two variables is dominant.
Miner Inflow, Outflow, and NetFlow
Between December 10 and 16, 49,683 Bitcoin were withdrawn from miners’ wallets, while 48,998 Bitcoin were deposited into miner wallets during the same period. This week’s Miner NetFlow was -685 Bitcoin. Meanwhile, the Bitcoin price was $92,026 on December 10 and $87,847 on December 16.
Throughout the week, Bitcoin inflows into miner wallets (Miner Inflow) were less than Bitcoin outflows from miner wallets (Miner Outflow), resulting in a negative net flow (Miner NetFlow).
| Date | Dec. 10 | Dec. 11 | Dec. 12 | Dec. 13 | Dec. 14 | Dec. 15 | Dec. 16 |
|---|---|---|---|---|---|---|---|
| Miner Inflow | 6,758.87 | 12,226.54 | 6,828.39 | 5,228.26 | 3,732.13 | 8,578.72 | 5,645.17 |
| Miner Outflow | 5,890.72 | 11,920.76 | 8,537.86 | 5,175.64 | 3,555.01 | 8,638.72 | 5,964.94 |
| Miner Netflow | 868.15 | 305.78 | -1,709.46 | 52.62 | 177.11 | -60.00 | -319.76 |
Transaction
![]()
Last week, 3,298,566 transactions took place on the Bitcoin network, while this week the number fell to 3,219,177, recording a decrease of approximately 2.4%. The highest transaction volume of the week was recorded on December 10 at 550,328, while the lowest transaction volume was recorded on December 14 at 416,558.
Looking at the transaction count graph, the sharp increases on Saturdays appear to be lower compared to the weekdays at the beginning of the period. While the unusual situation has continued steadily for the past few weeks, it seems to have ended as of this week. On the price and correlation side, the period appears balanced overall, suggesting that the alignment between trading activity and price movements is not one-sided.
Tokens Transferred
While a total of 4,765,182 BTC was transferred in the previous period, this week the volume progressed to 5,758,407 BTC, a 20.8% decrease. The highest daily transfer of the week was 914,384 BTC on December 10, while the lowest daily volume was 543,768 BTC on December 14. The correlation between the amount of BTC transferred and the price showed a balanced pattern of negative and positive movements throughout the week.
While the amount of Bitcoin transferred decreased significantly, the partial decrease in the number of transactions indicates that less consistent and lower-volume transactions intensified during this period. This picture may indicate that the impact of a larger number of smaller transactions on the price became more pronounced during this period.
Whale Activities
Whale Data:
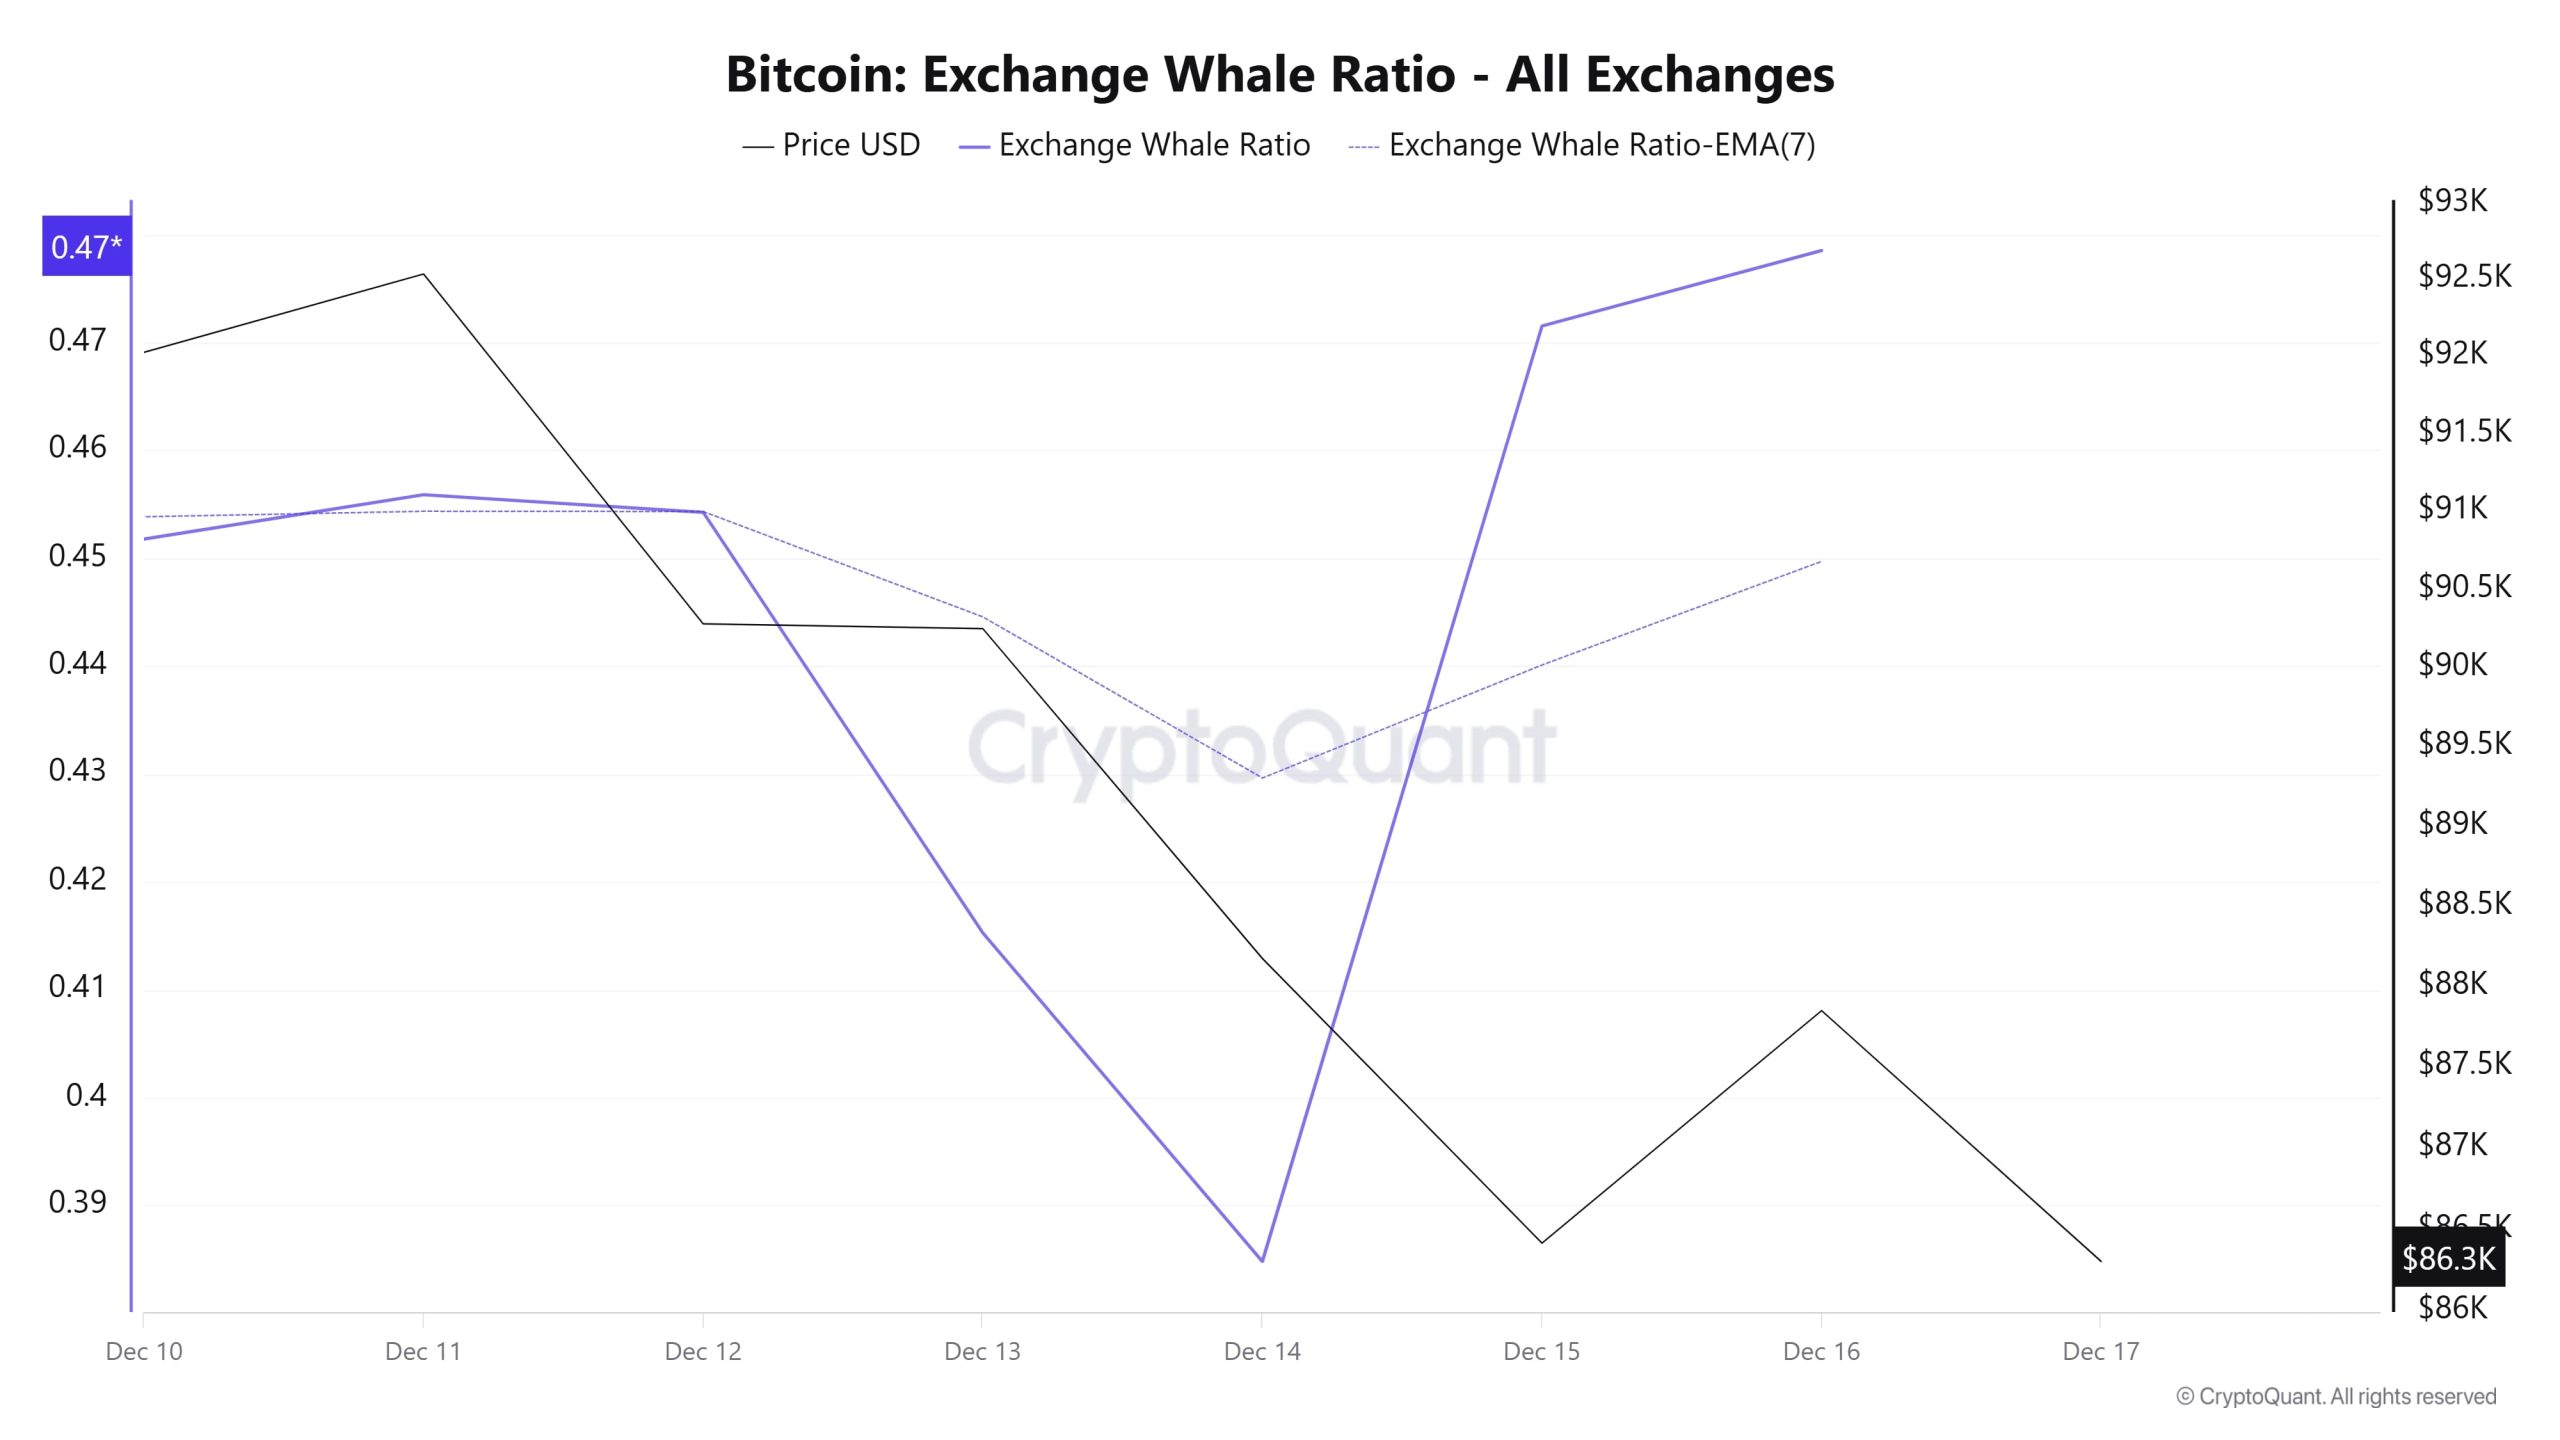
Looking at whale activity on centralized exchanges over the past 7 days based on cryptocurrency market data, we see that activity was flat at the beginning of the period, decreased in the middle, and then increased again towards the end. Looking at the Exchange Whale Ratio metric, on December 10, the first day of the 7-day period, the ratio of whales using centralized exchanges was 0.451. The metric then declined, reaching its lowest point on December 14, falling to 0.384. When this ratio is above the 0.35–0.45 range, it generally means that whales are frequently using centralized exchanges. Currently at 0.478, the metric corresponds to the period when whales most frequently used centralized exchanges. During this period, prices traded within a range between $92,800 and $85,000. This indicated that the selling side dominated the trading battle among whales on centralized exchanges. At the same time, total BTC transfers increased by 5% compared to last week, with 4,982,197 BTC moving. The data shows that since the beginning of December, Bitcoin whales holding between 10,000 and 100,000 BTC have sold more than 36,500 Bitcoin. This amount is worth approximately $3.28 billion. Such a significant amount of Bitcoin moving is important in the cryptocurrency market. In contrast, owners of 100 BTC and 1,000 BTC continued to accumulate. As a result, we can say that the very large whales caused the BTC’s value to decline, while the smaller whales were unable to compensate for this, creating pessimism.
BTC Onchain Overall
| Metric | Positive 📈 | Negative 📉 | Neutral ➖ |
|---|---|---|---|
| Active Addresses | ✓ | ||
| Breakdowns | ✓ | ||
| Derivatives | ✓ | ||
| Supply Distribution | ✓ | ||
| Exchange Supply Ratio | ✓ | ||
| Exchange Reserve | ✓ | ||
| Fees and Revenues | ✓ | ||
| Miner Flows | ✓ | ||
| Transaction | ✓ | ||
| Whale Activity | ✓ |
*The metrics and guidance provided in the table do not alone explain or imply any expectation of future price changes for any asset. Digital asset prices can fluctuate based on many different variables. The on-chain analysis and related guidance are intended to assist investors in their decision-making process, and basing financial investments solely on the results of this analysis may lead to unfavorable outcomes. Even if all metrics produce positive, negative, or neutral results simultaneously, the expected outcomes may not materialize depending on market conditions. It would be beneficial for investors reviewing the report to take these warnings into consideration.
Legal Notice
The investment information, comments, and recommendations contained in this document do not constitute investment advisory services. Investment advisory services are provided by authorized institutions on a personal basis, taking into account the risk and return preferences of individuals. The comments and recommendations contained in this document are of a general nature. These recommendations may not be suitable for your financial situation and risk and return preferences. Therefore, making an investment decision based solely on the information contained in this document may not result in outcomes that align with your expectations.
NOTE: All data used in Bitcoin on-chain analysis is based on CryptoQuant.
