
Weekly Bitcoin Onchain Report – September 03
Active Addresses
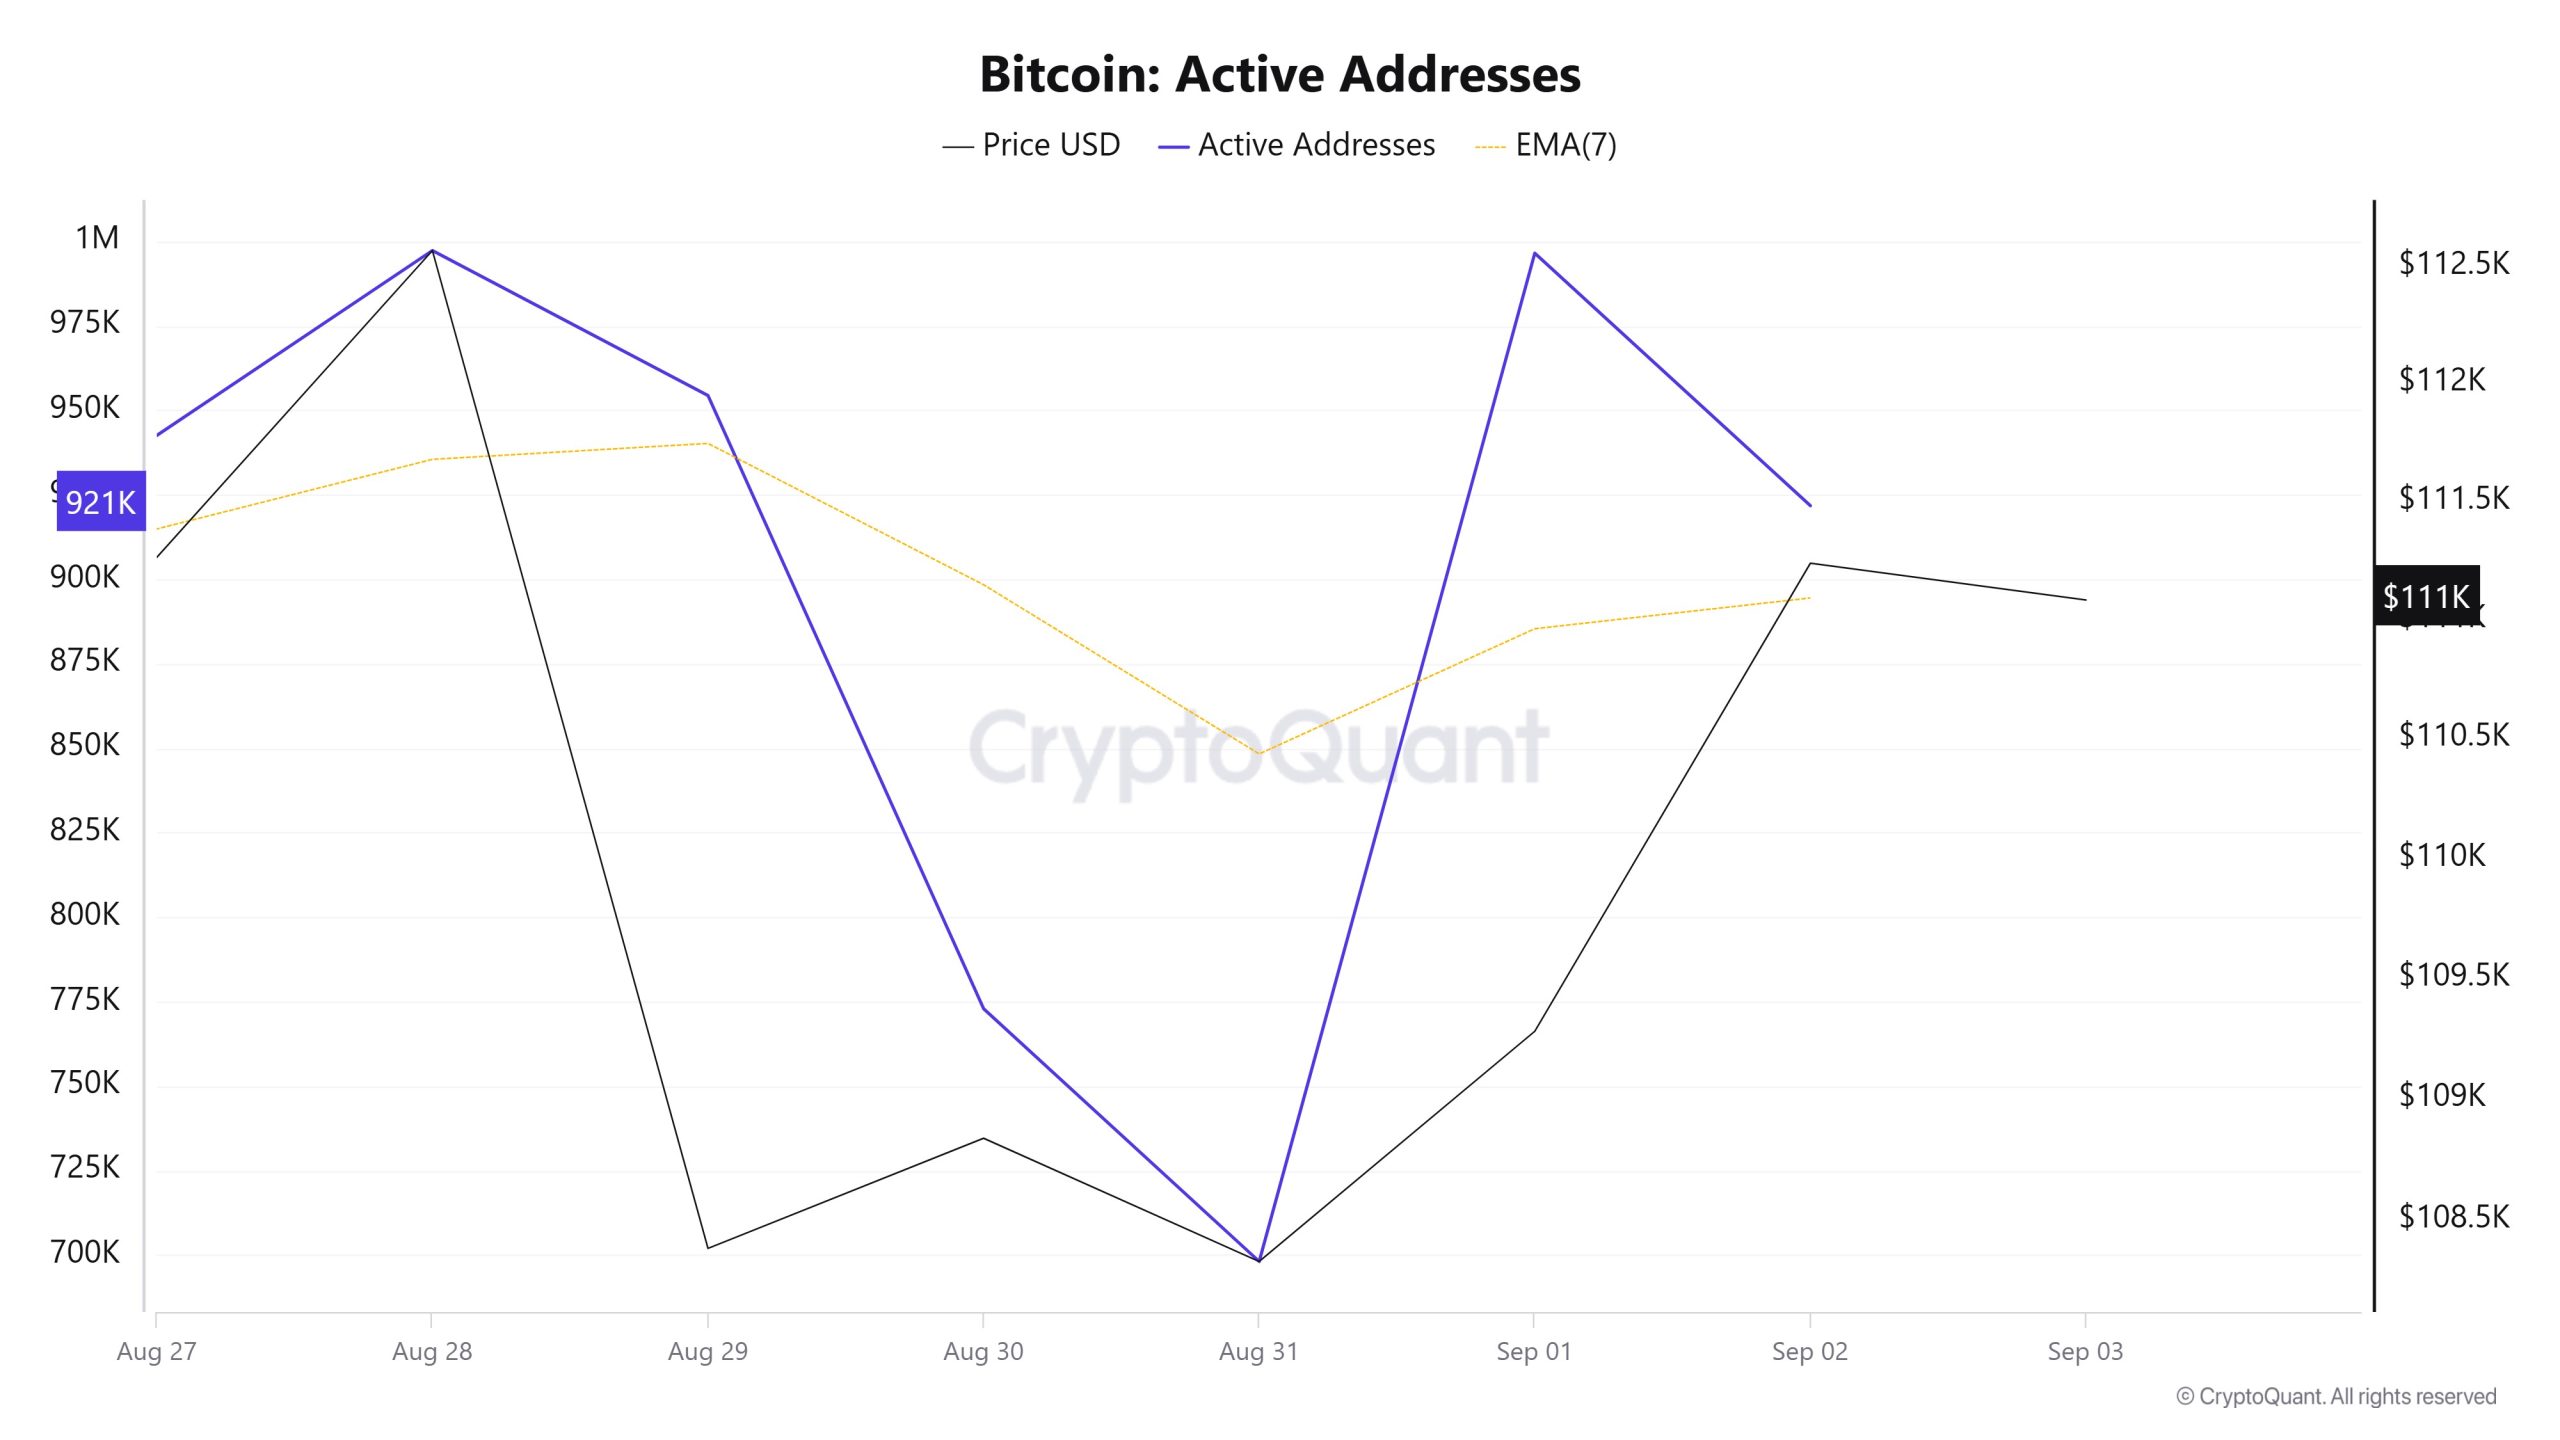
Between August 27 and September 3, 997,232 active addresses entered the Bitcoin network. In this process, the Bitcoin price fell to the level of $108,000. The decline in the number of active addresses, especially on August 30, was observed to move the price downwards towards $108,000. From a technical perspective, it is noteworthy that downward movements were experienced at the point where the 7-day simple moving average (SMA) intersected with the price on August 29. This technical signal indicates a sell-off on the market.
Active Sending Addresses
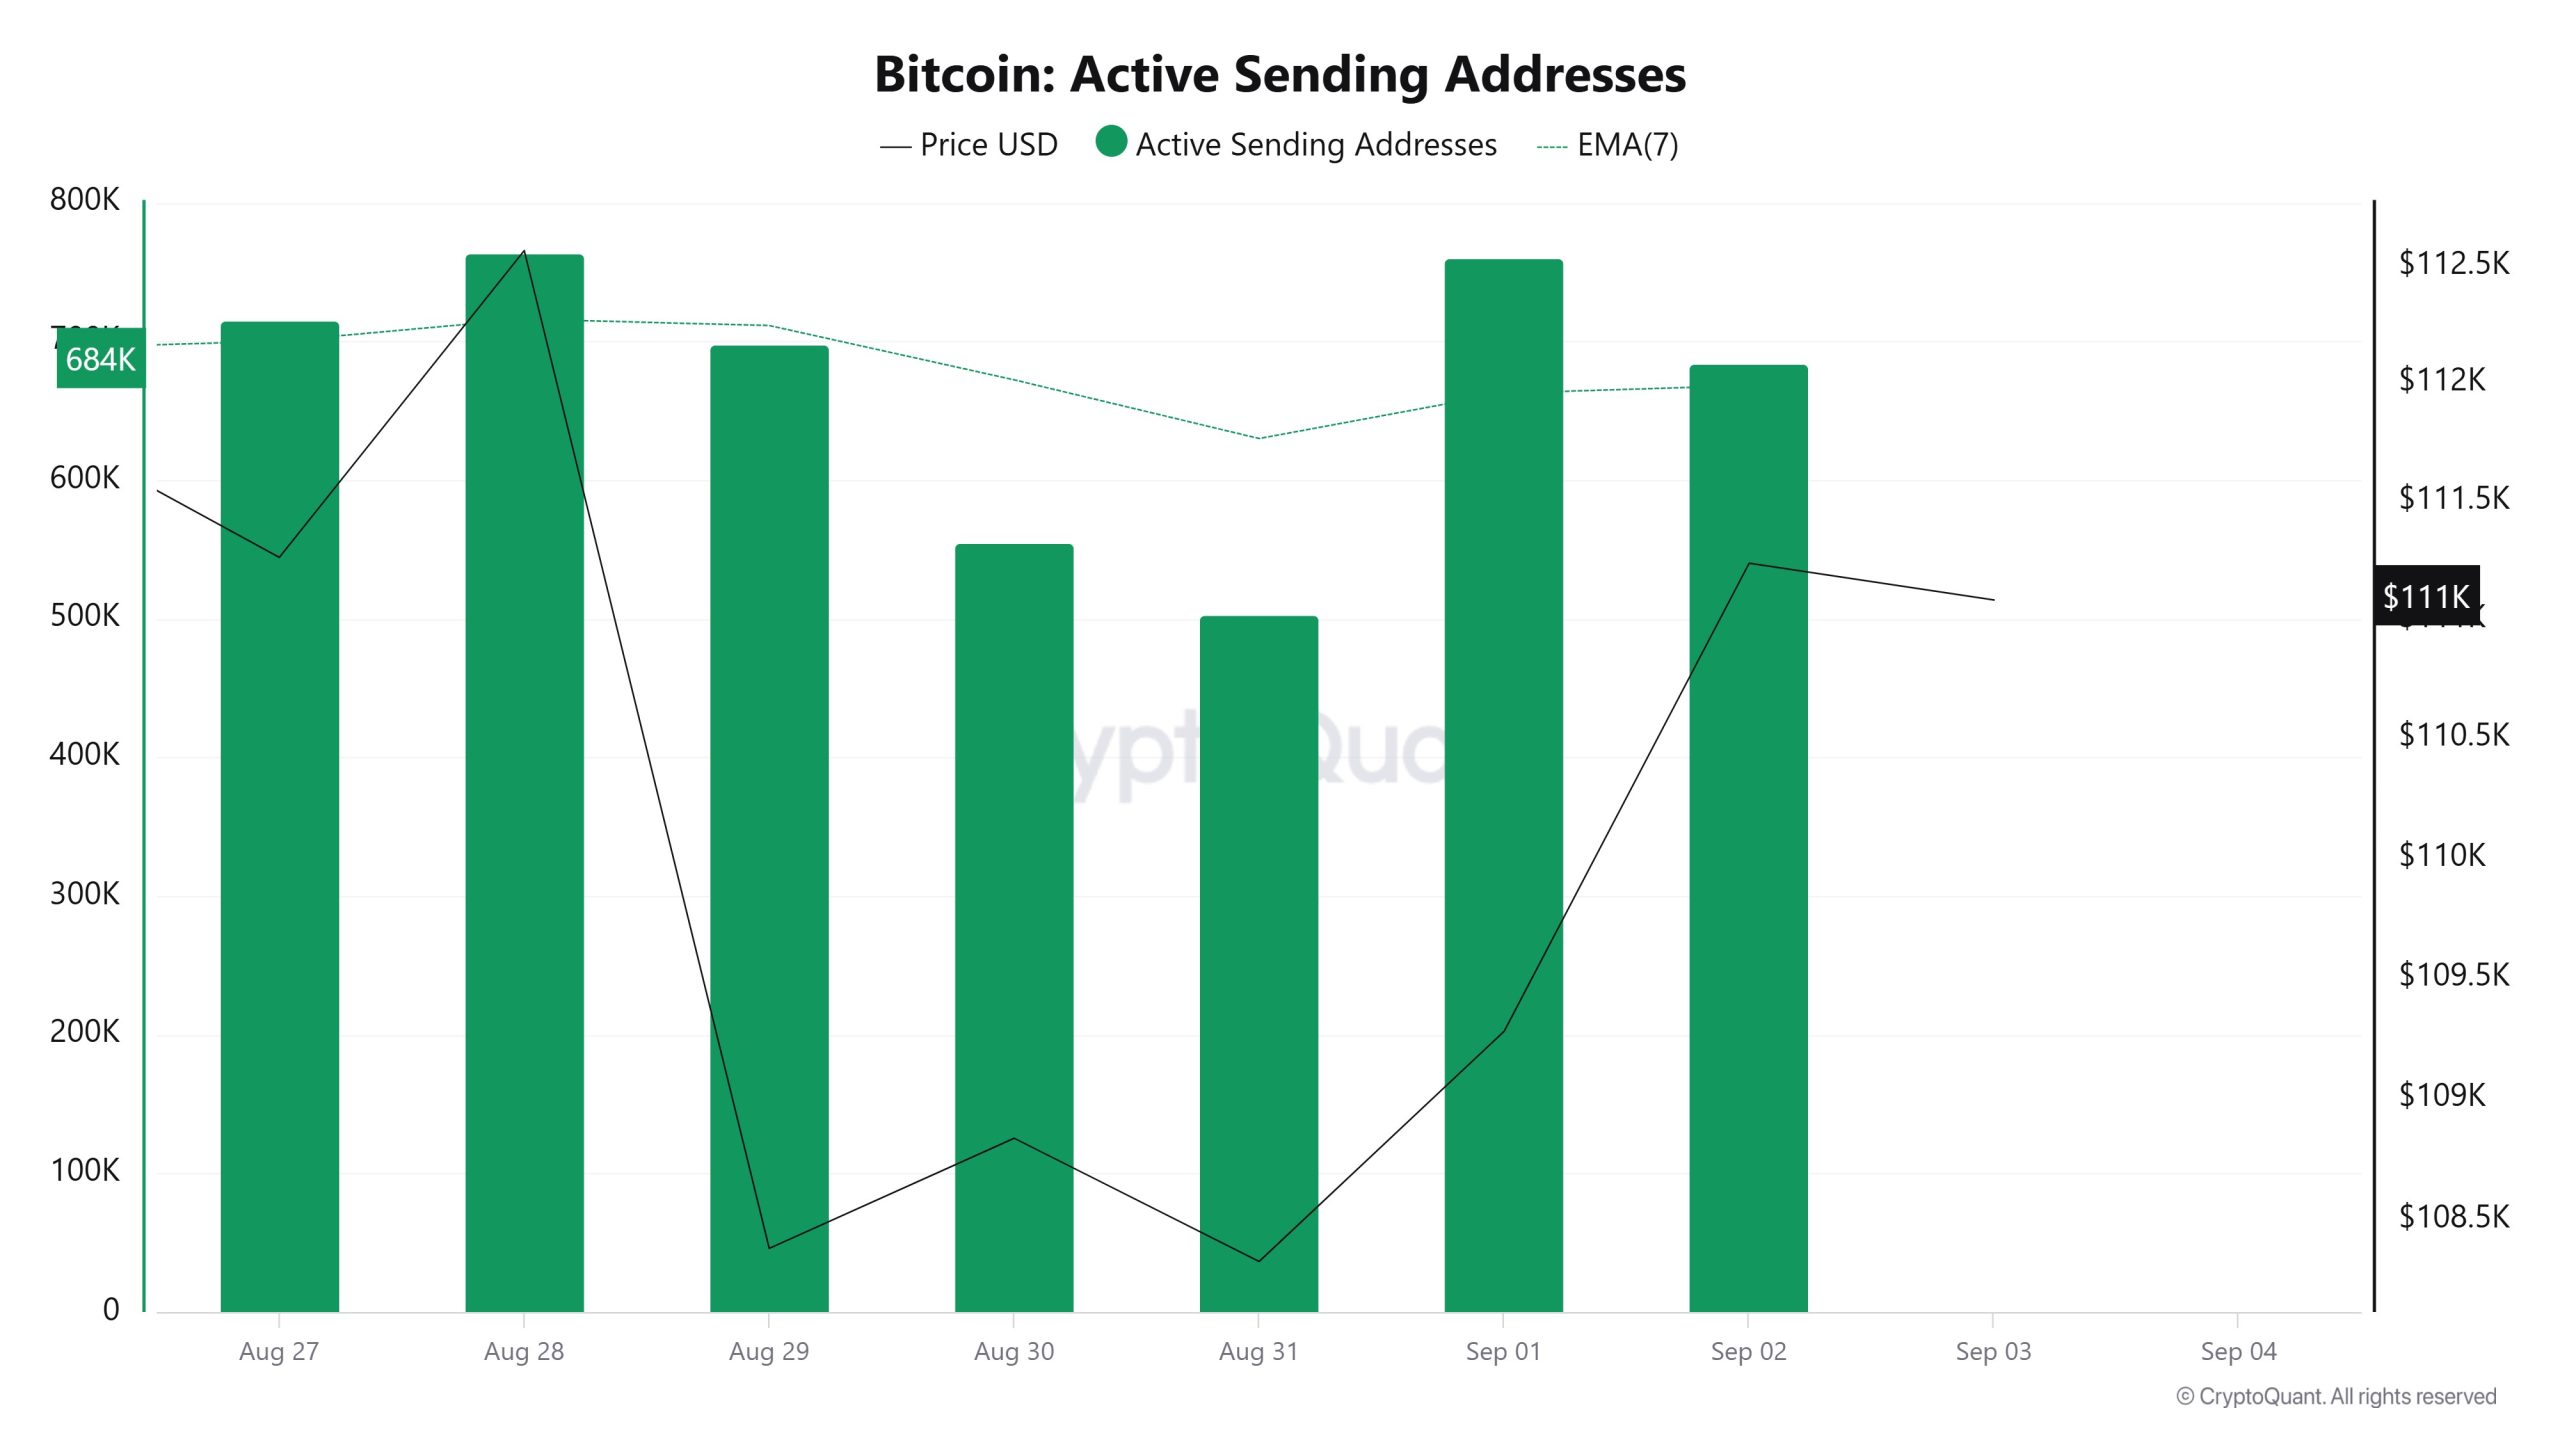
Between August 27 and September 3, a bearish trend was observed in the “Active Sending Addresses” metric. On the day of the price peak, this metric hovered at 763,663, indicating that user activity on the Bitcoin network has moved in tandem with the price. This data suggests that the $112,000 level is supported on a bearish basis, not only in terms of price, but also in terms of on-chain address activity. In general, the Active Sending Addresses metric followed a downward trend during this period.
Active Receiving Addresses
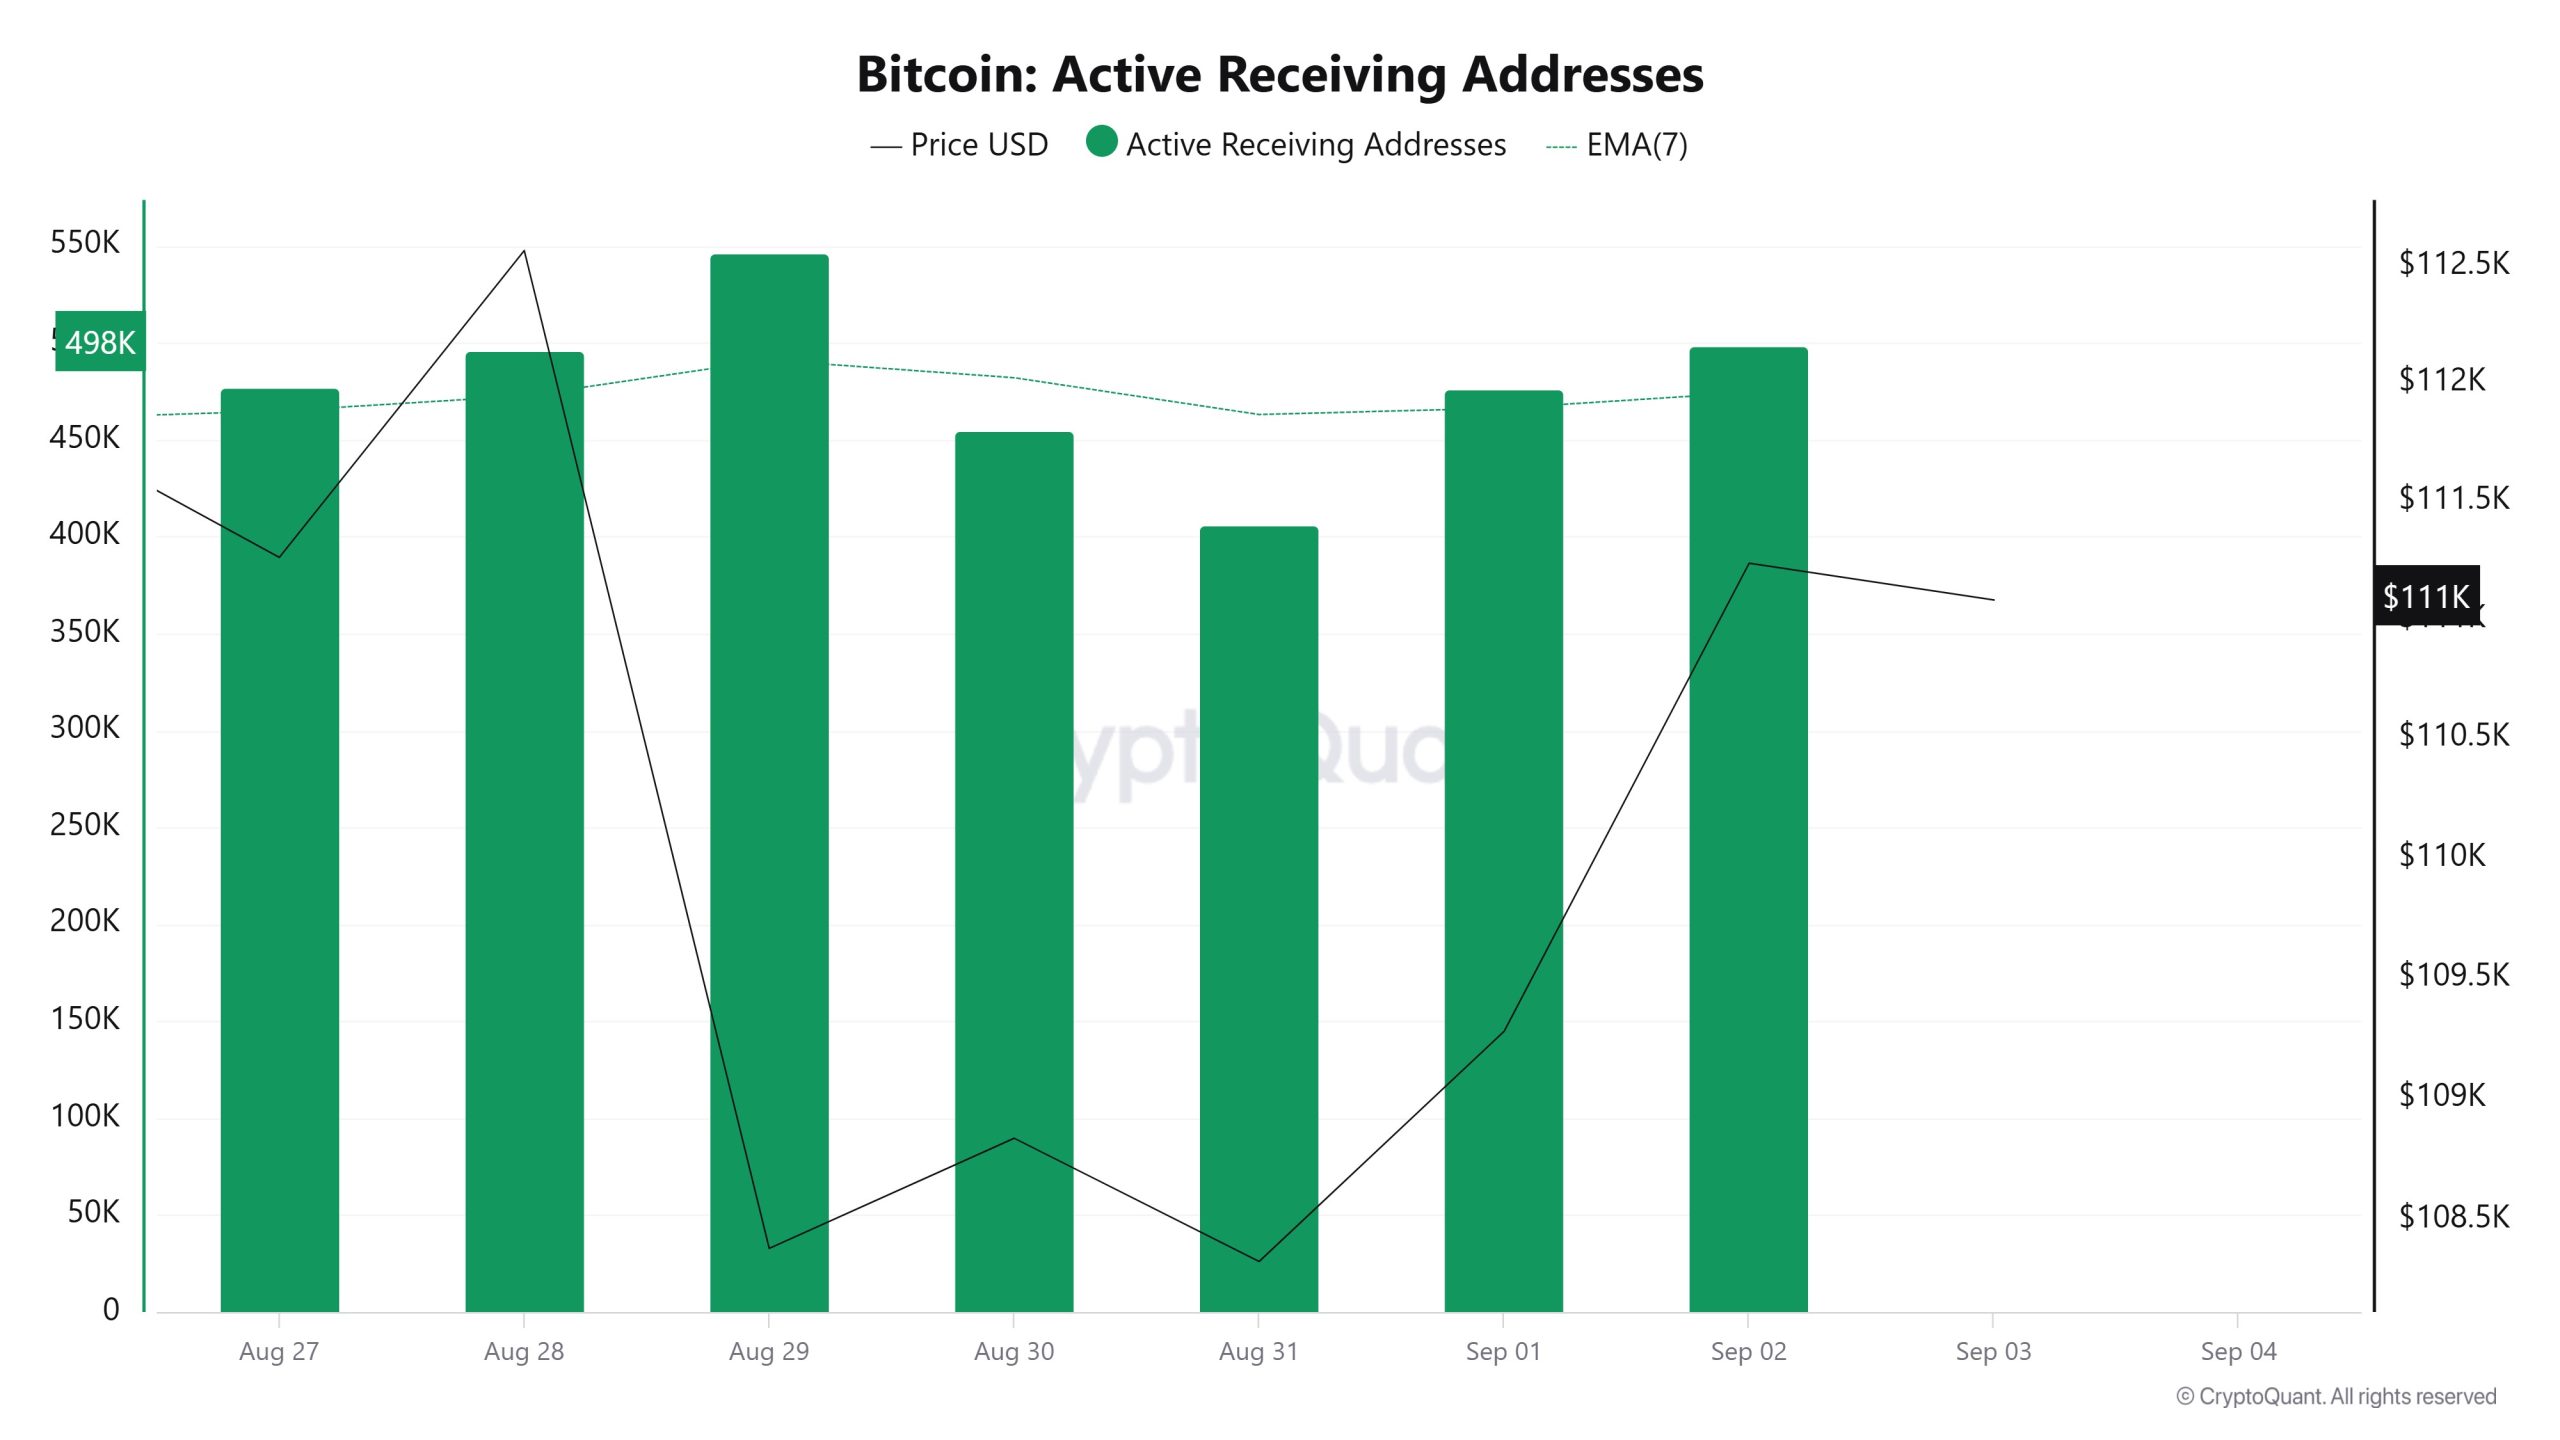
Between August 27th and September 3rd, there was a regular decline in active buy addresses with the Black Line (price line). On the day of the price low, active receiving addresses dropped to 546,456, indicating that sellers were selling Bitcoin at $108,000.
Breakdowns
MRVR
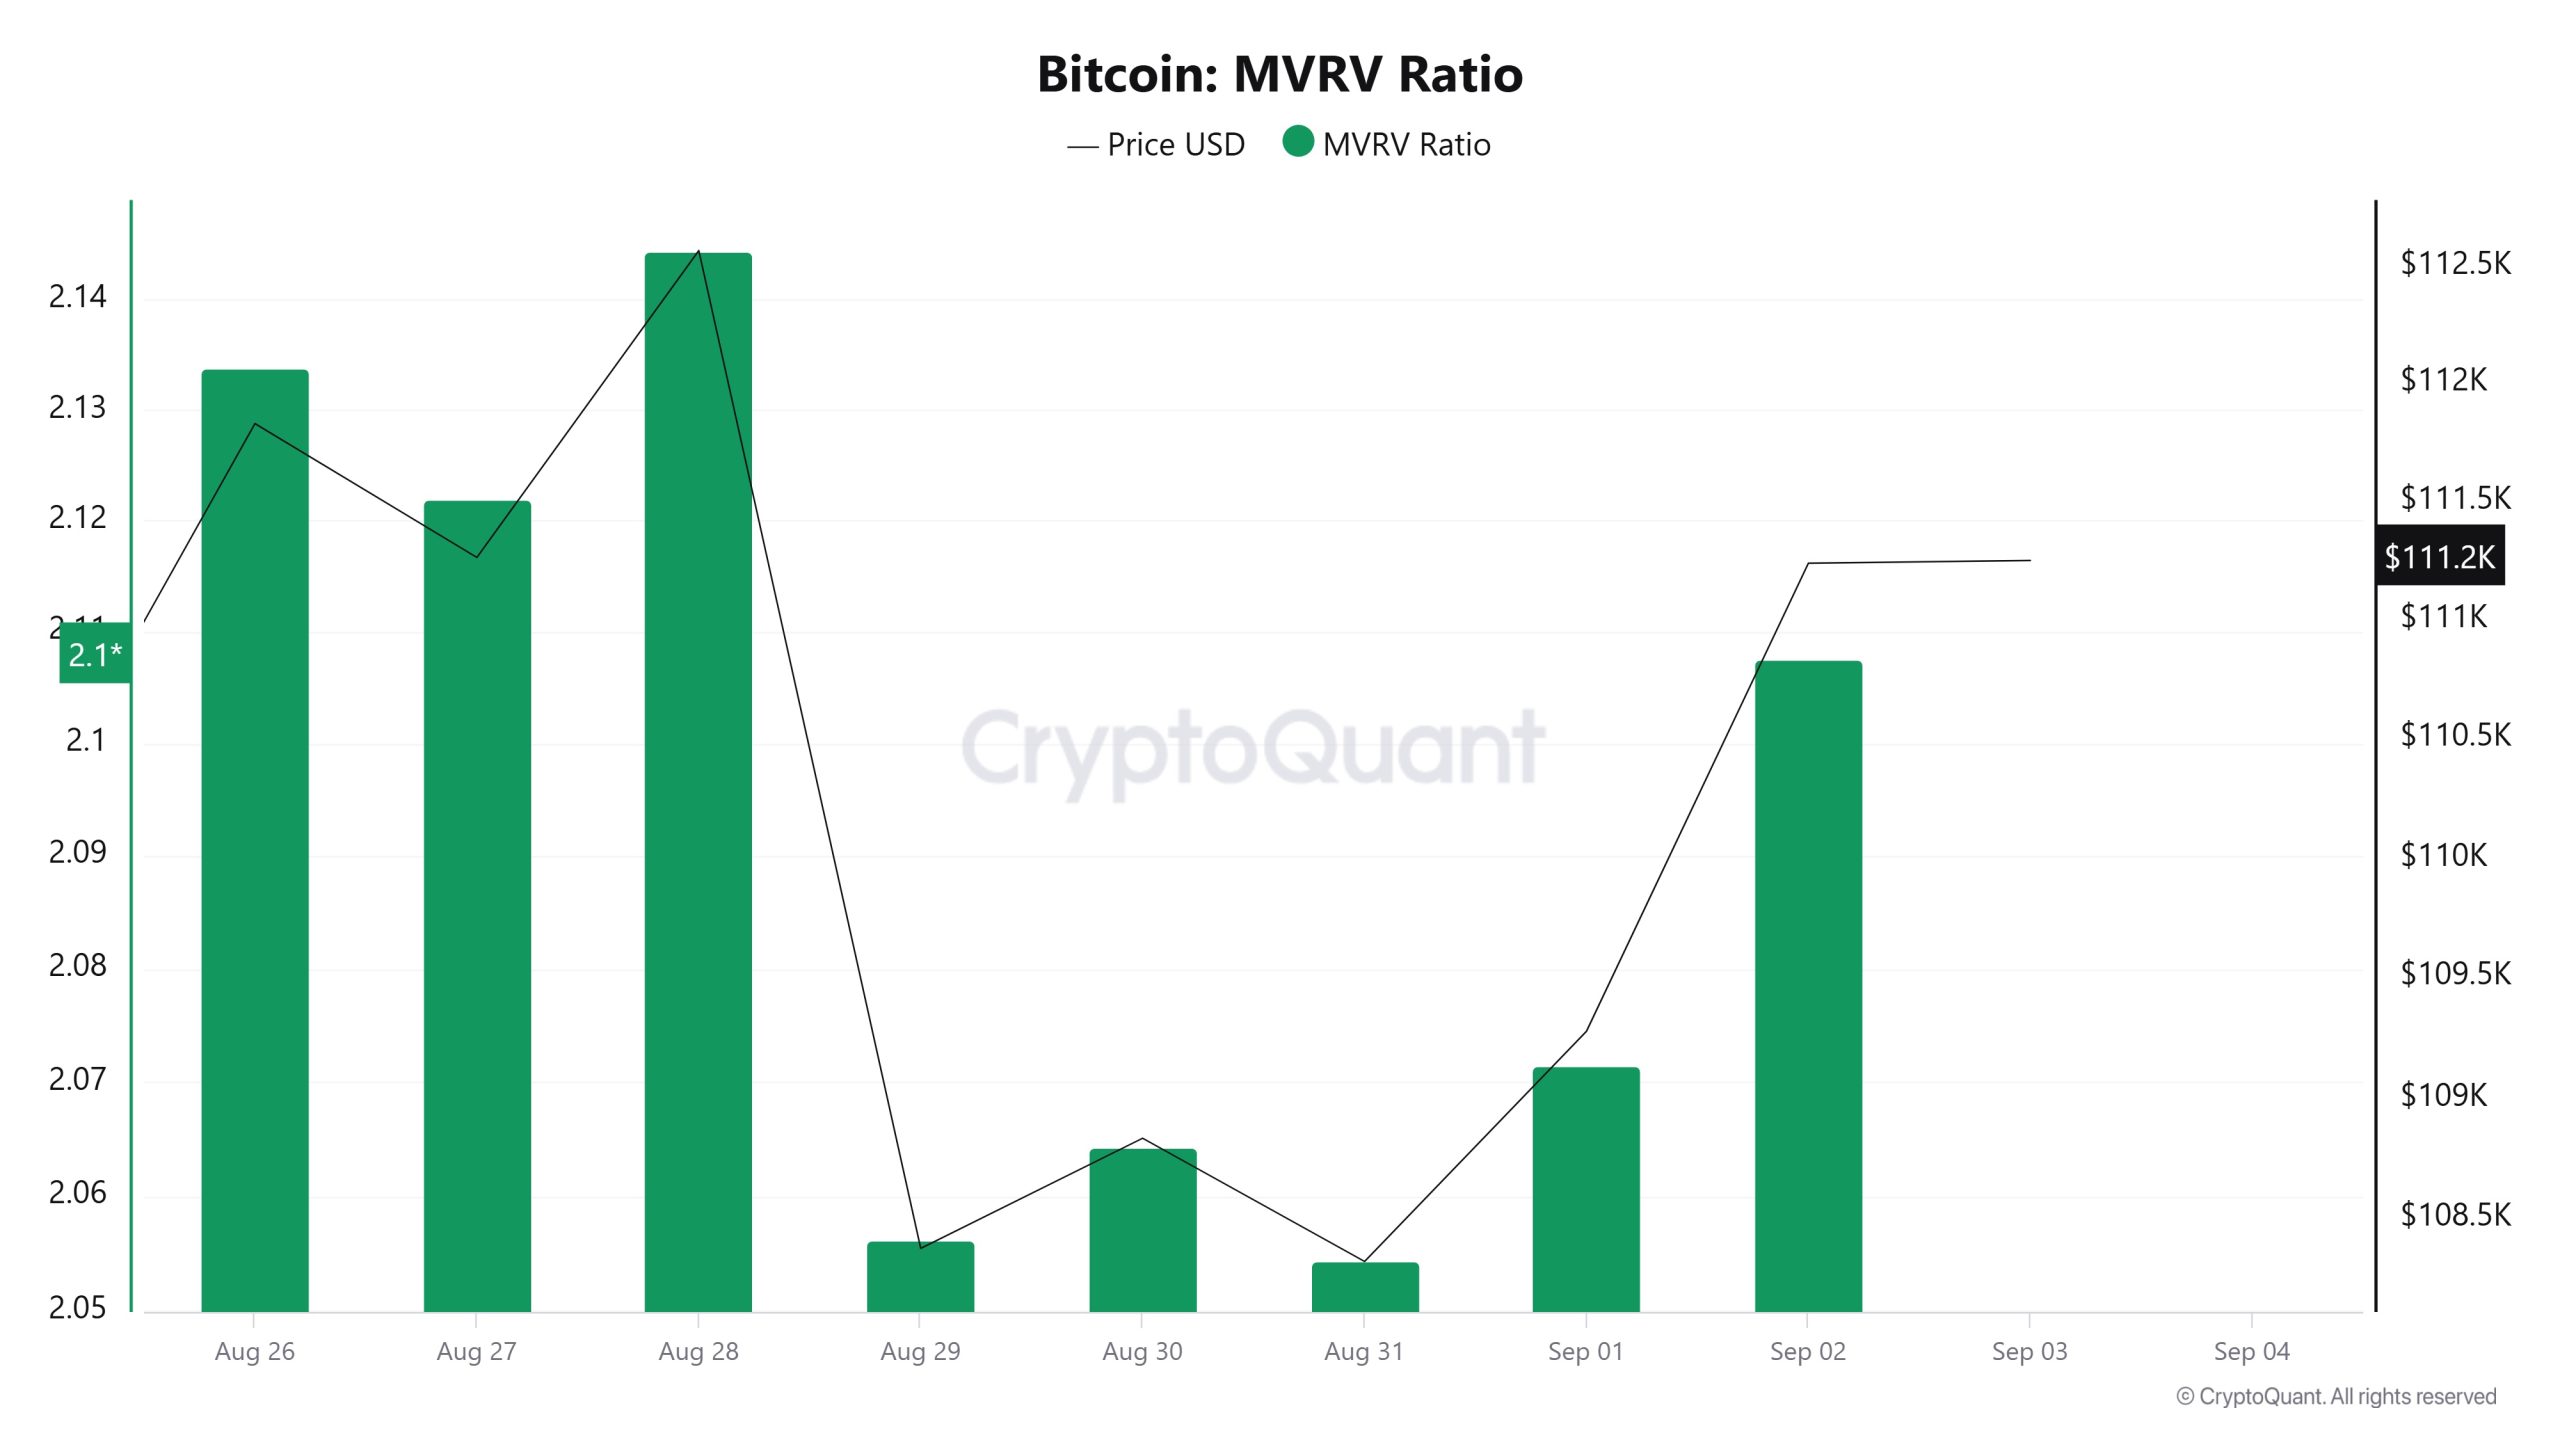
On August 27, the Bitcoin price was at $111,261 while the MVRV Ratio was at 2.121.
As of September 2, the Bitcoin price fell 0.02% to $111,237, while the MVRV Ratio fell 0.66% to 2.107.
Realized Price
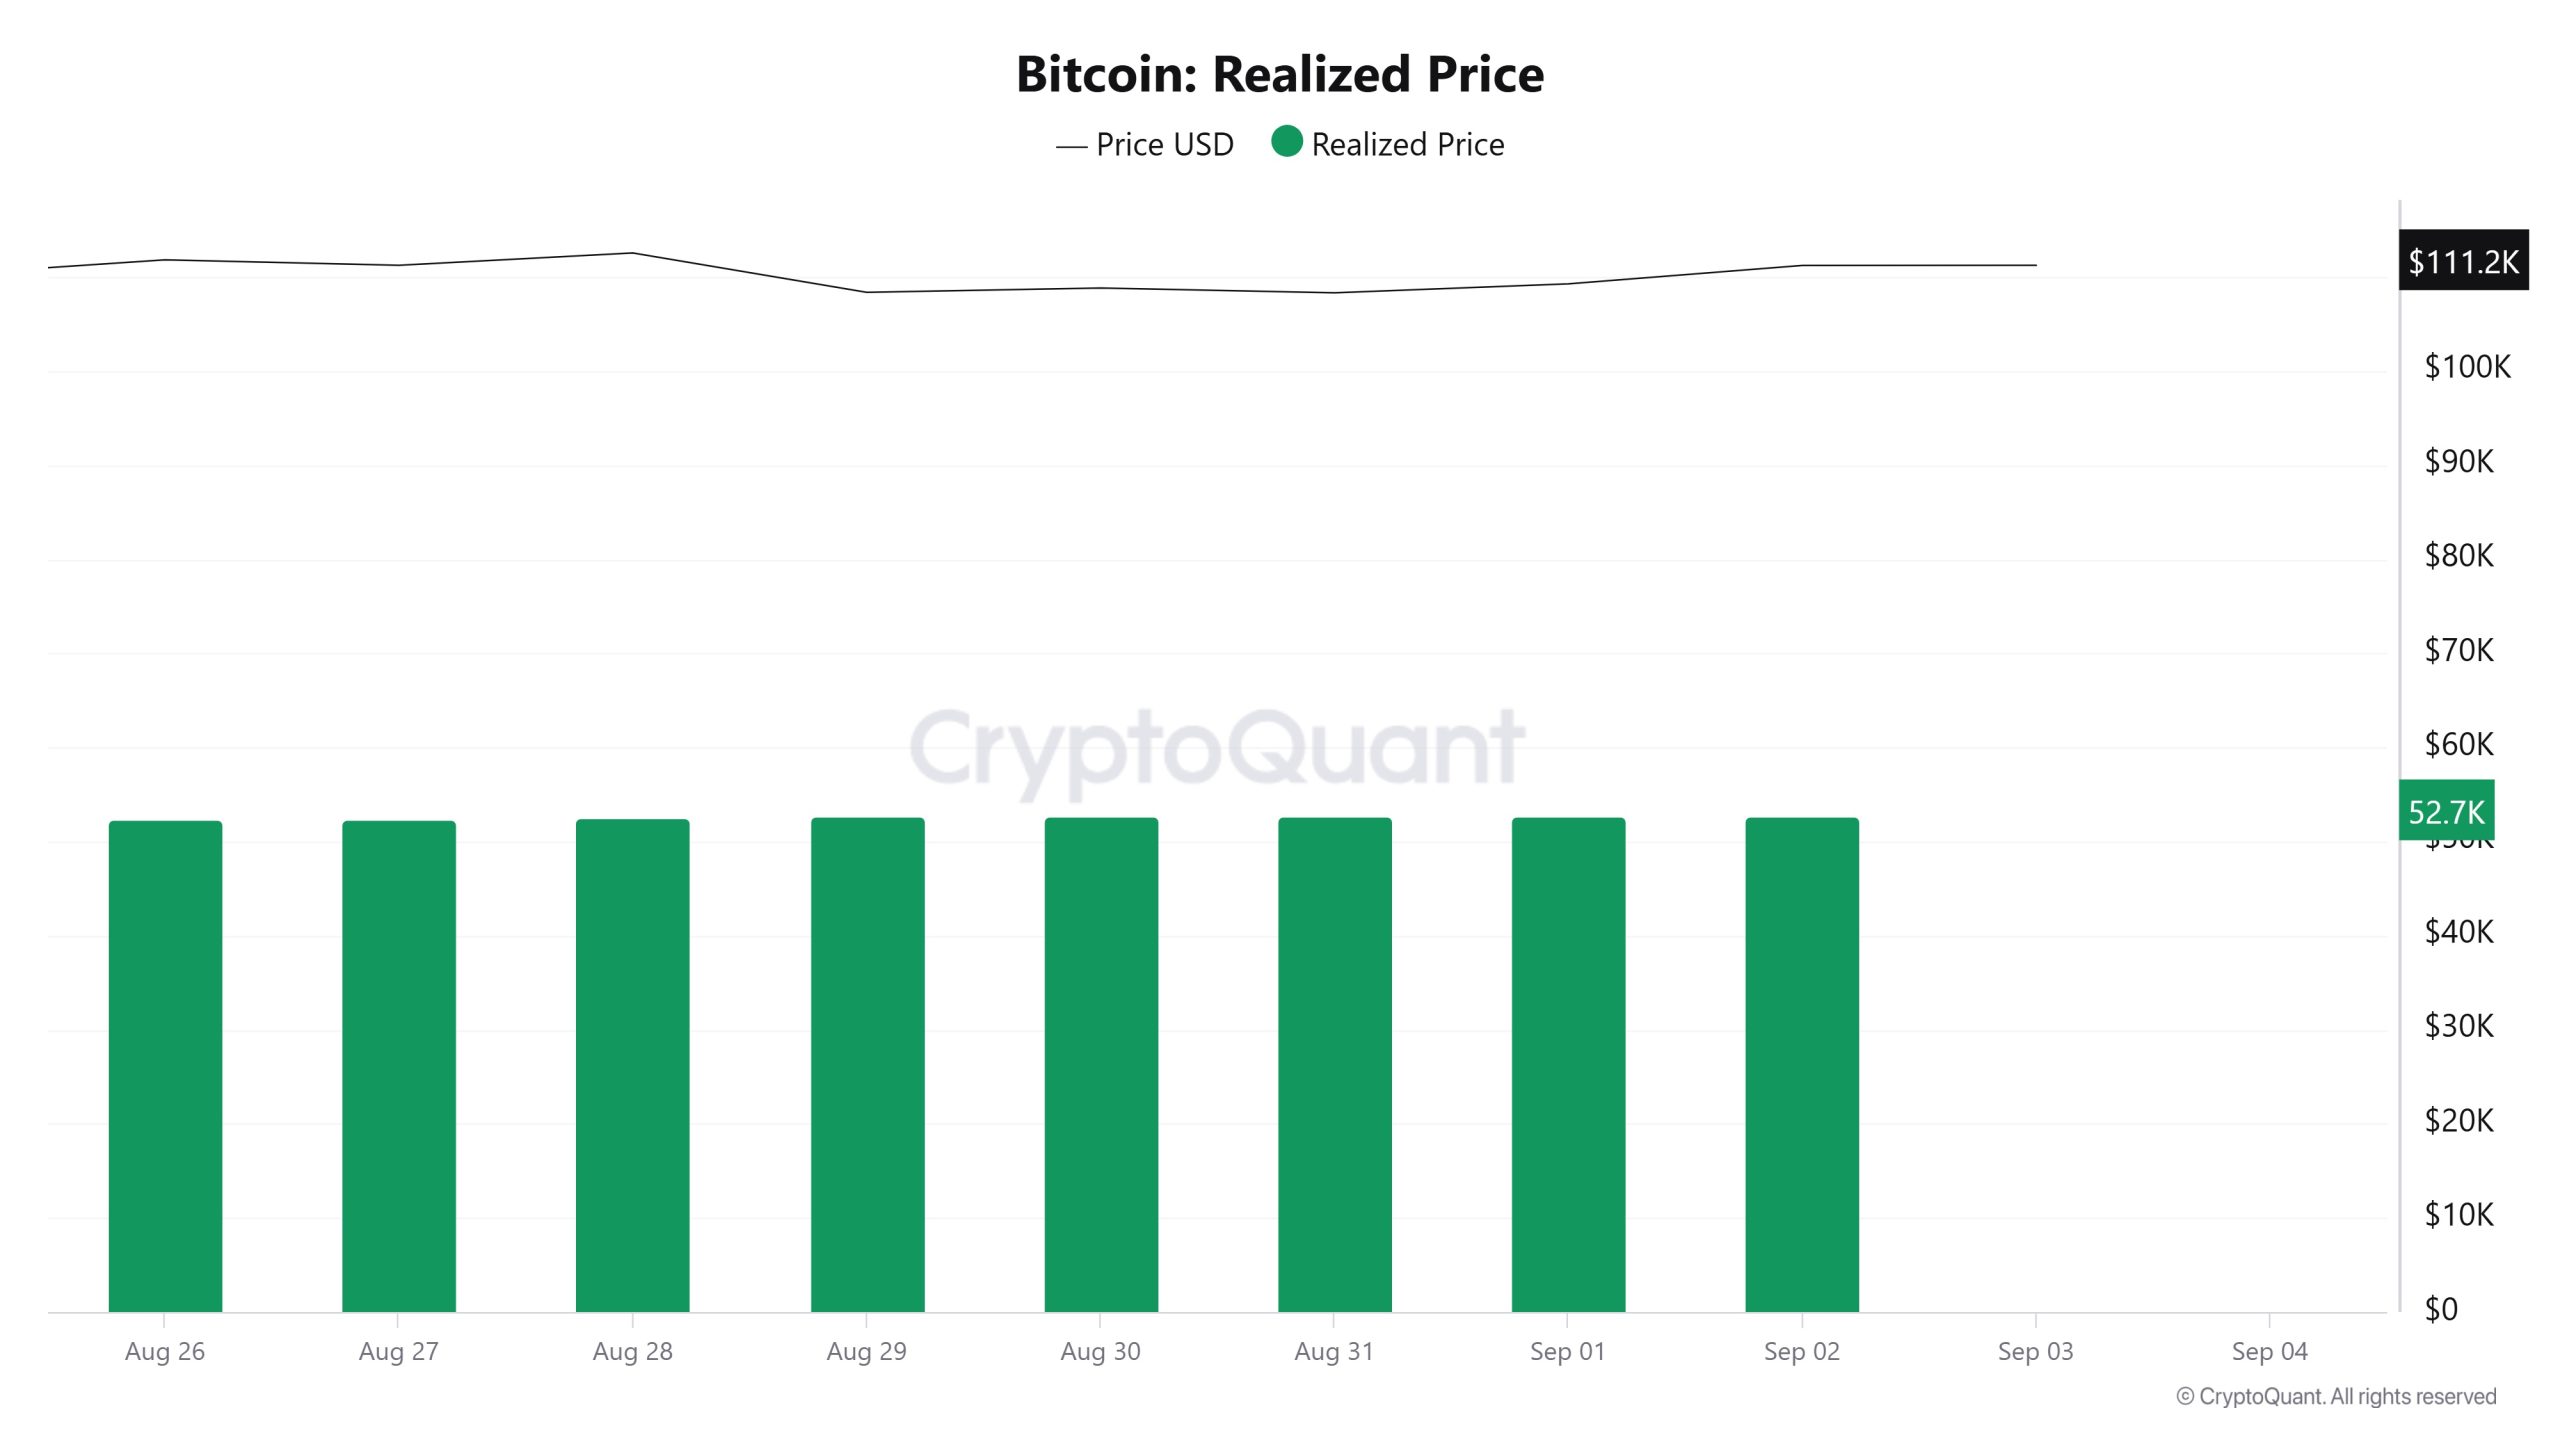
On August 27th, the Bitcoin price was at $111,261 while the Realized Price was 52,434.
As of September 2, Bitcoin price decreased by 0.02% to $111,237, while Realized Price increased by 0.66% to 52,778.
Spent Output Profit Ratio (SOPR)
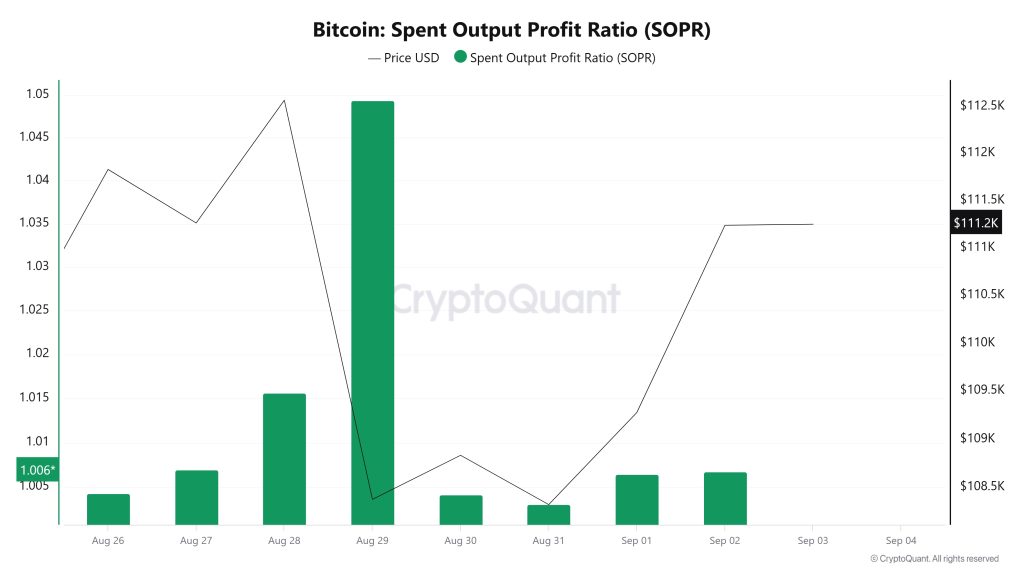

On August 27, the Bitcoin price was at $111,261 while the SOPR metric was at 1.006.
As of September 2, the Bitcoin price was down 0.02% at $111,237, while the SOPR metric was steady at 1.006.
Derivatives
Open Interest
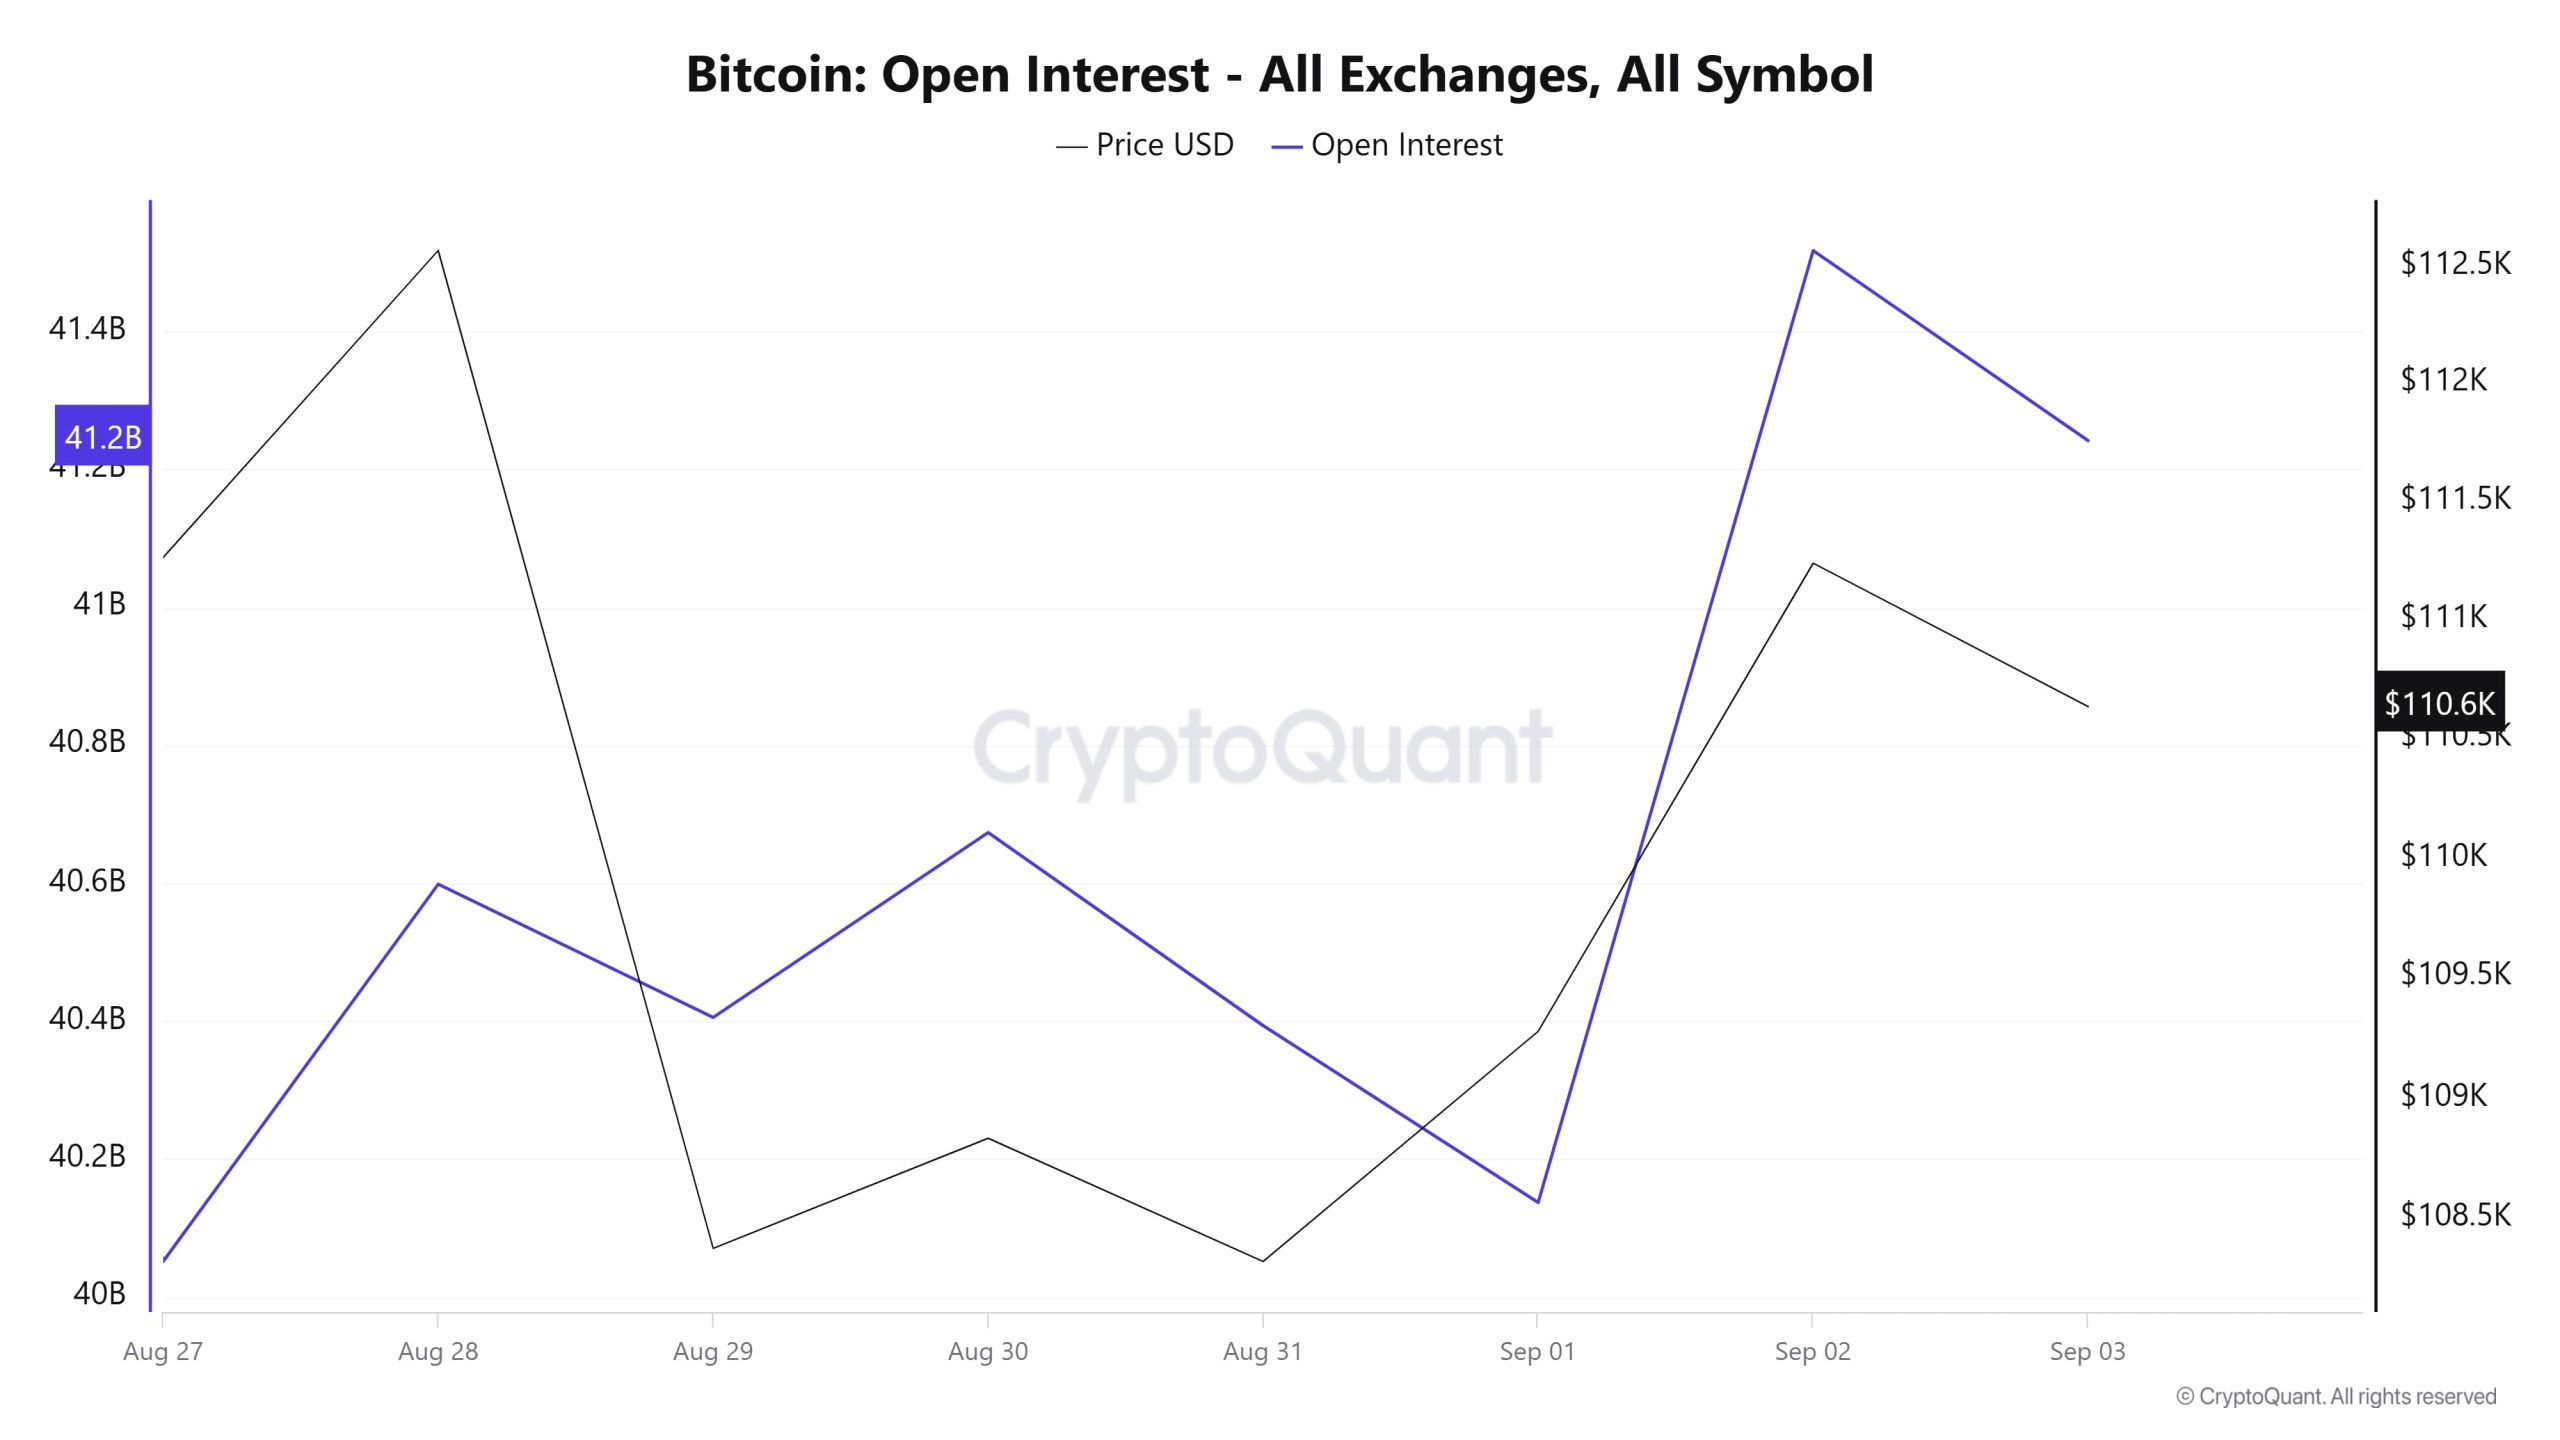
As the chart shows, on August 27, Bitcoin open interest was around $40 billion while the price was at $111,500. On August 28th, open interest quickly rose to 40.6 billion, while the price approached $112,000. The next day, however, the price fell sharply to below $109,000 and open interest retreated slightly, but not as sharply as the price. On August 30th and 31st, the open interest fluctuates but generally stays in the 40.2-40.6 billion band while the price searches for a horizontal ground at lower levels. Despite the weakness in the price during this period, open positions were not completely unwound, meaning that market participants maintained their positions.
As of September 1, price started to recover and open interest rose sharply to 41.5 billion after a short-lived pullback. On September 2, both the price and open interest move strongly upwards, with the price breaking above $111,000 and open interest reaching a multi-day high. On September 3, the price falls back to $110,600, but open interest maintains its high level. This table reveals that although price movements fluctuate up and down, open positions have been increasing in recent days and the market continues to position heavily.
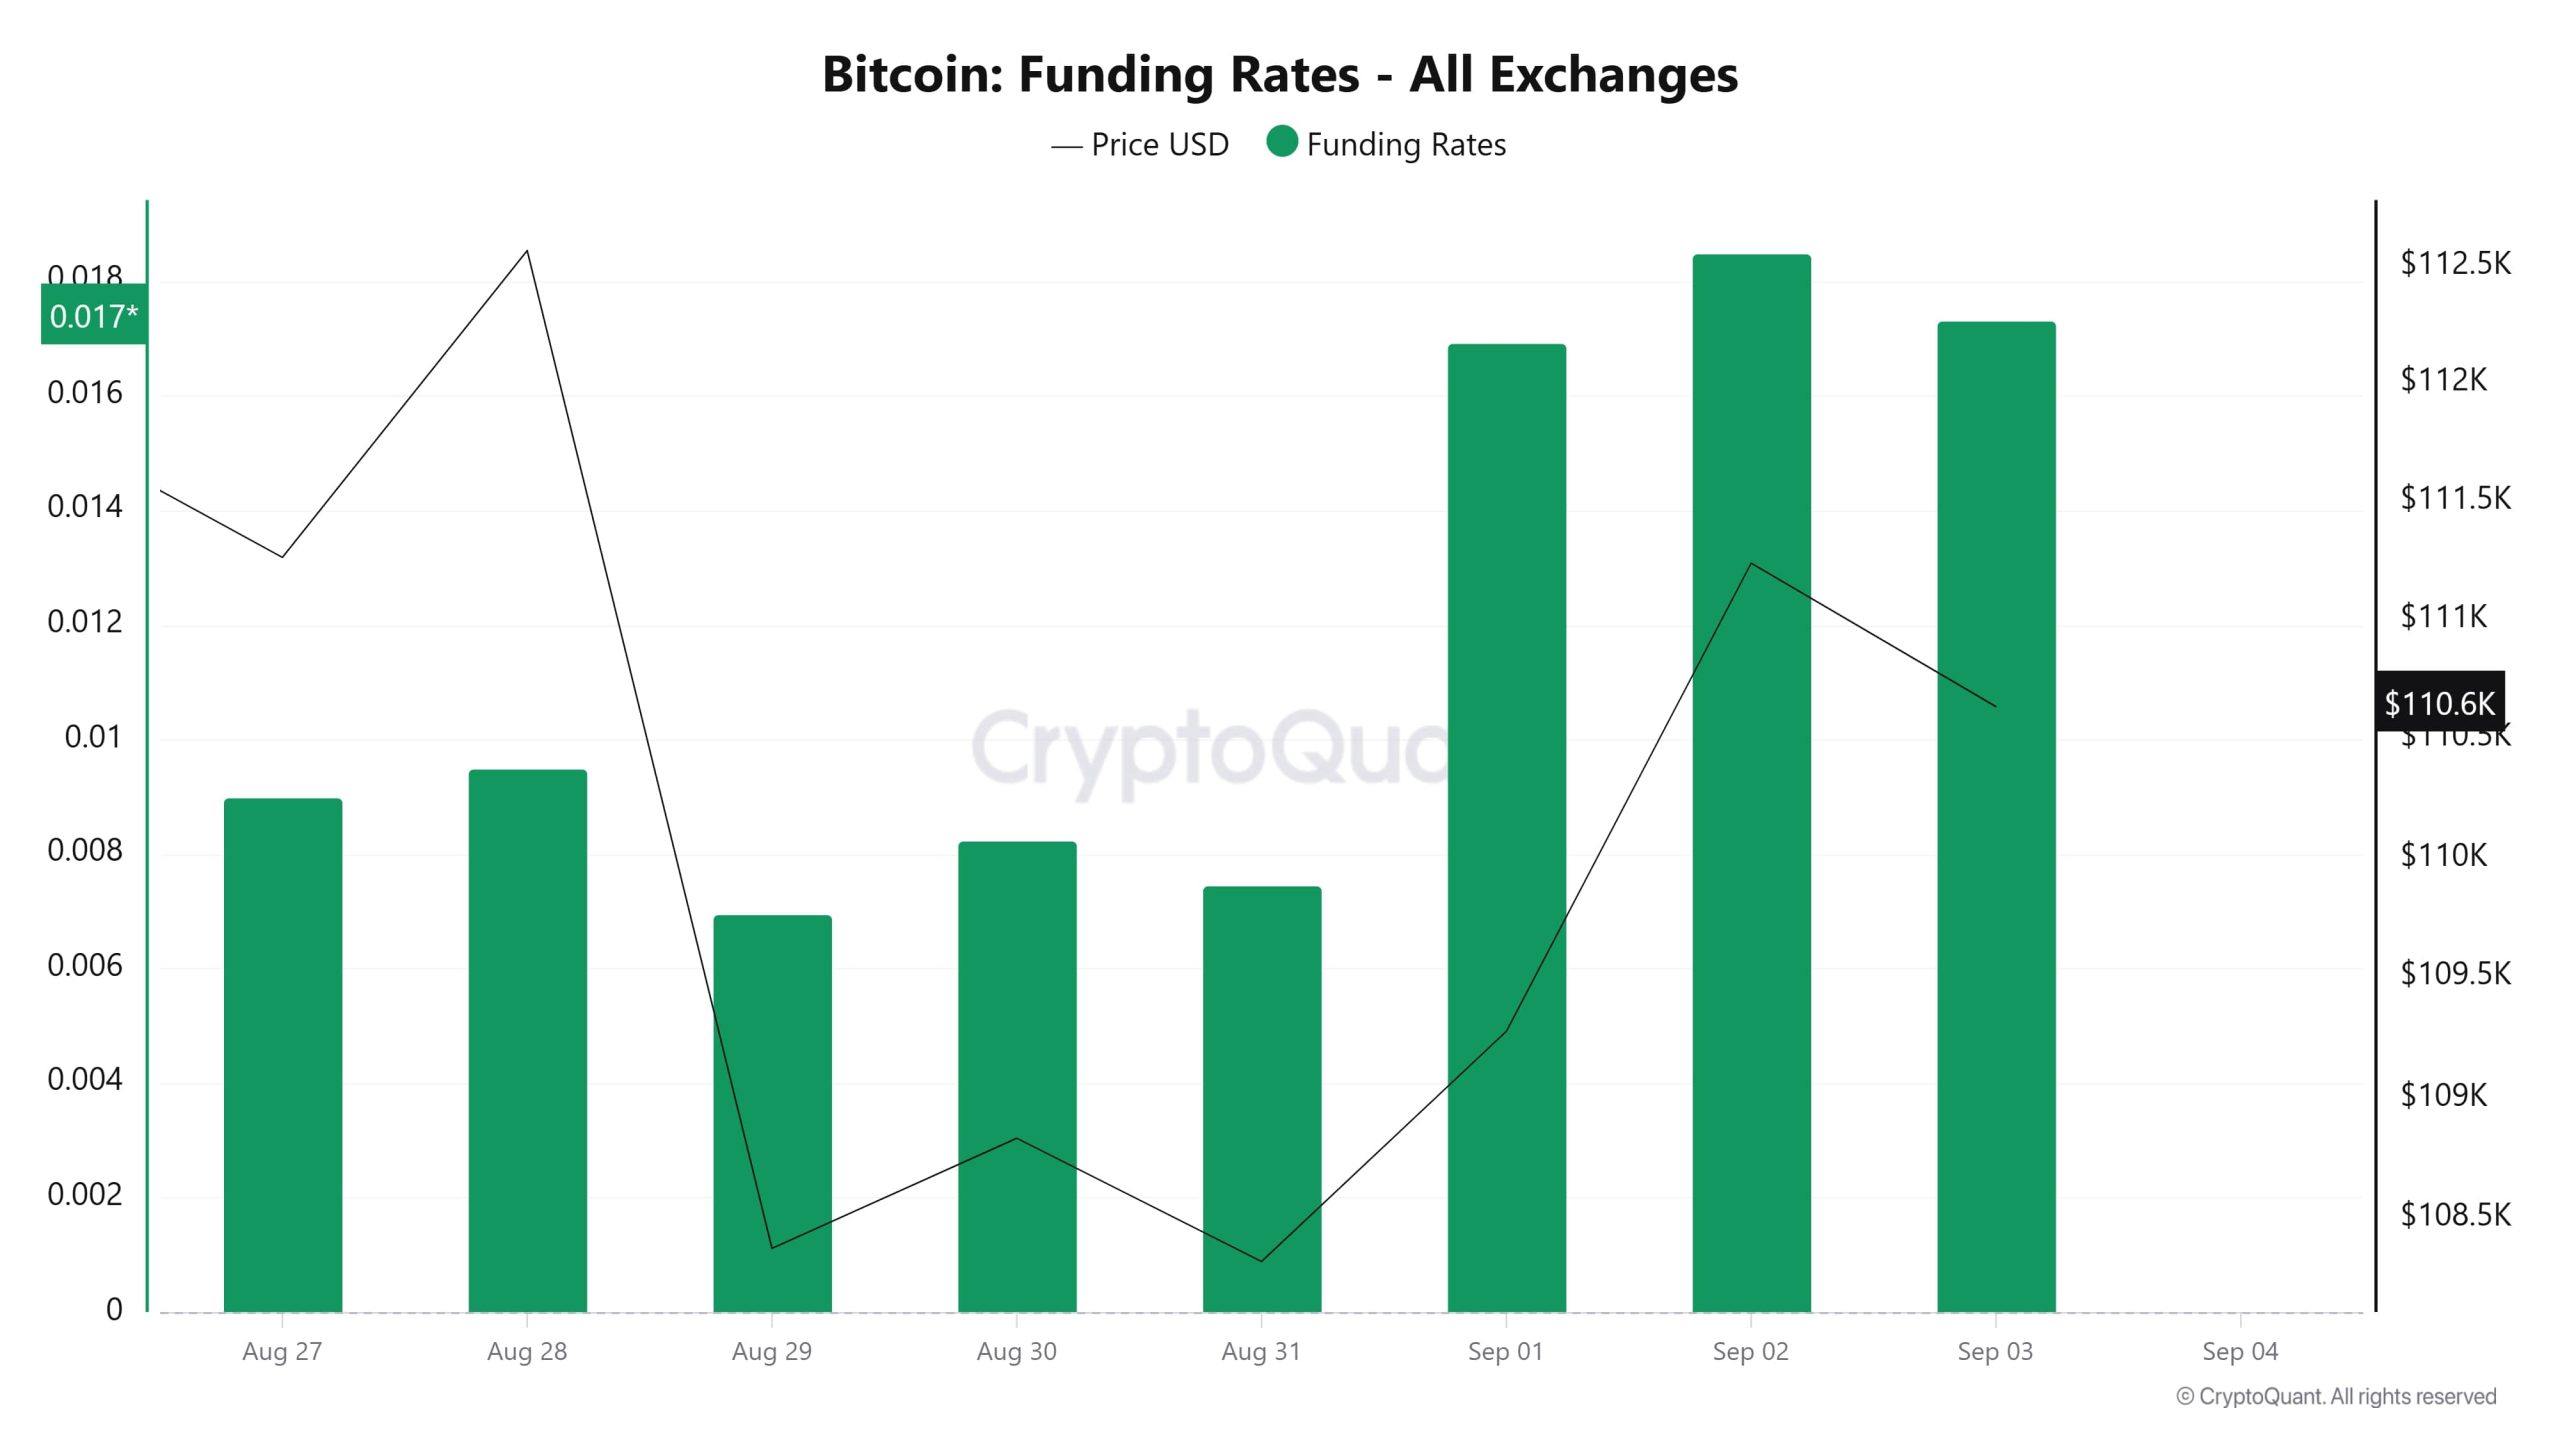
The chart shows the price of Bitcoin and the funding rate across exchanges. On August 27, the price was hovering around 111,500 while the funding rate was around 0.009. On August 28, as the price rallied towards 112,000, the funding rate similarly increased, meaning that long positions were dominated. Between August 29 and 31, the price drops below $109,000 and the funding rate falls slightly. From September 1, the price starts to rebound and the funding rate rises sharply, reaching as high as 0.017. On September 2 and 3, the funding rate remains high as the price approaches $111,000. The overall picture shows that the funding rate declines rapidly during price declines and rises aggressively again during price rises, and that the market is driven by strongly leveraged trades that change direction in short periods of time.
Long & Short Liquidations
With the BTC price falling from $112,400 to $107,250 last week, mainly long positions were liquidated. Approximately 430 million dollars of long and 157 million dollars of short trades were liquidated.
| Date | Long Amount (Million $) | Short Amount (Million $) |
|---|---|---|
| August 27 | 19.32 | 11.58 |
| August 28 | 24.39 | 8.67 |
| August 29 | 262.30 | 12.14 |
| August 30 | 9.95 | 4.59 |
| August 31 | 23.08 | 8.43 |
| September 01 | 72.37 | 73.30 |
| September 02 | 19.20 | 38.56 |
| Total | 430.61 | 157.27 |
Exchange Supply Ratio
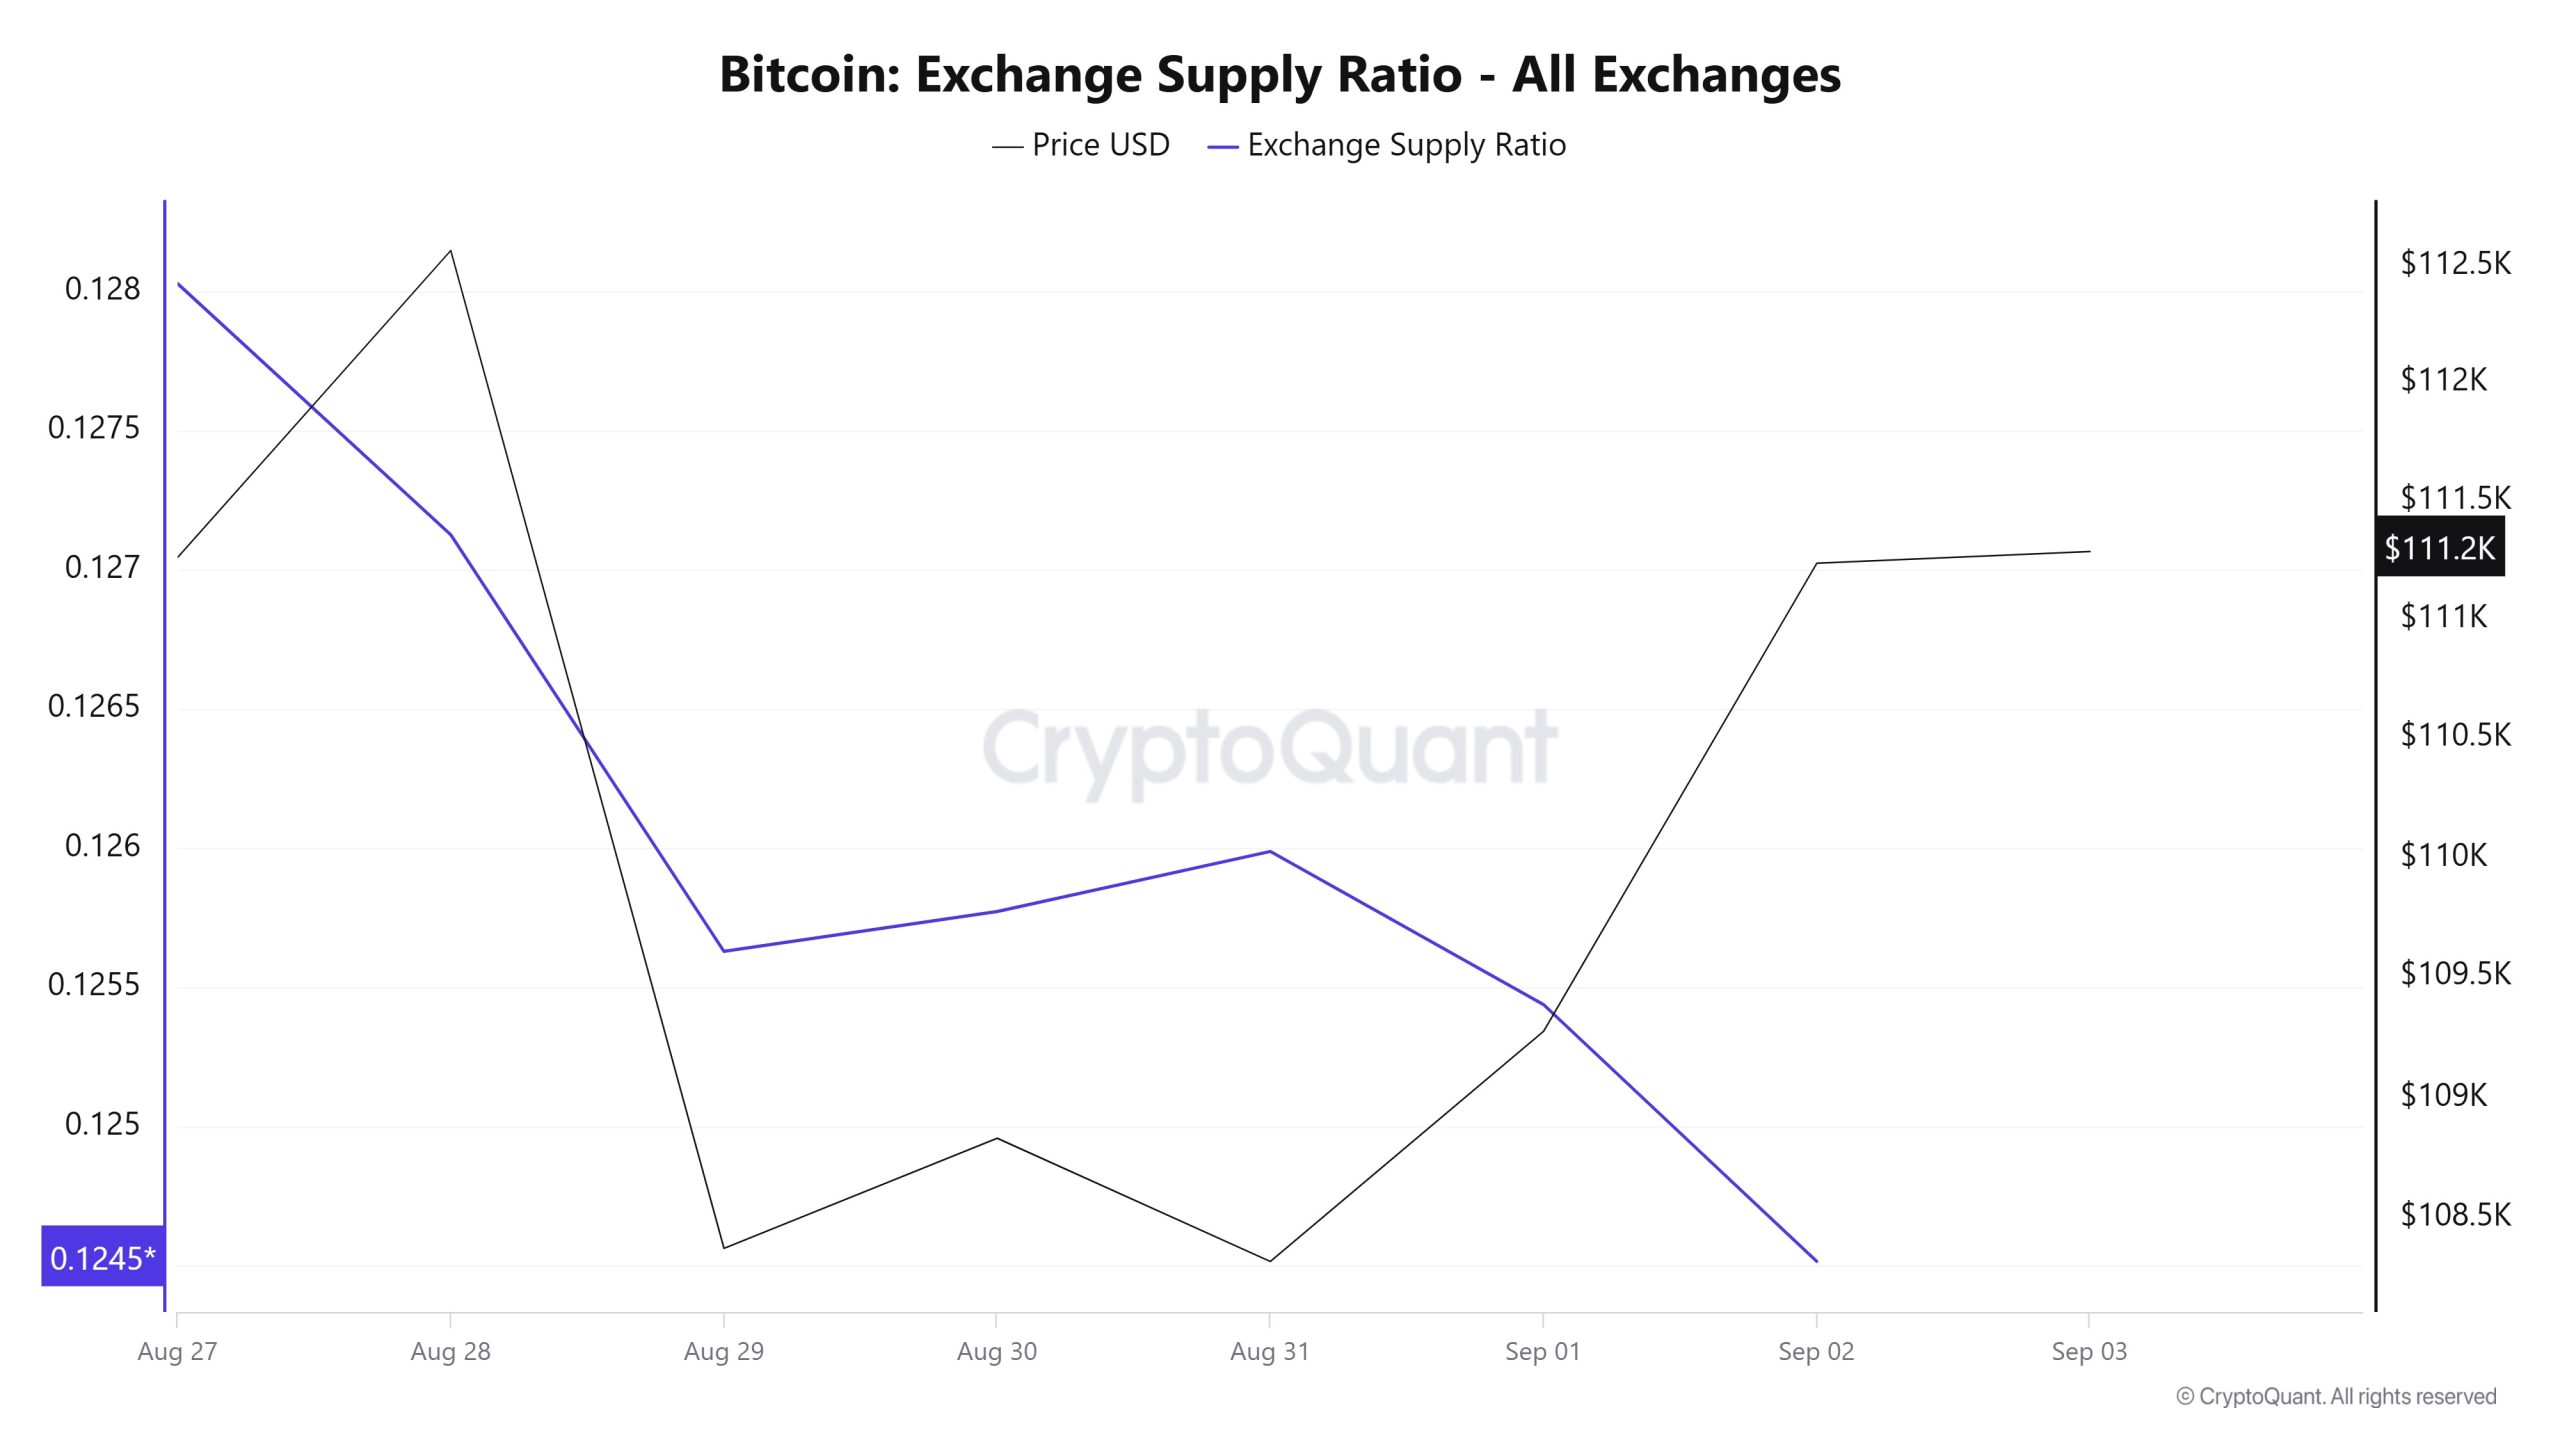
Data from the Bitcoin Exchange Supply Ratio table, which shows how much of Bitcoins are held on exchanges compared to the total supply of Bitcoins, showed low rates this week. This week’s data reveals that the general trend is for a negative correlation between the price of Bitcoin and the rate of supply entering exchanges, dominated by a negative correlation in these two variables. It shows that most Bitcoins continue to be sold out of wallets and are not ready for sale in the market.
Between August 27 and September 3, the Bitcoin Exchange Supply Ratio decreased from 0.12712636 to 0.12541718. During this period, the Bitcoin price dropped from $112,000 to $109,000. Notably, on September 1, at the intersection of the price and the Exchange Supply Ratio, there was a significant increase in the Exchange Supply Ratio as the price continued to fall. This suggests that, despite the price decline, the amount of Bitcoin supplied to exchanges has increased, possibly indicating that long-term investors have stopped holding their holdings. Bitcoin price is generally on a downward trend.
Exchange Reserve
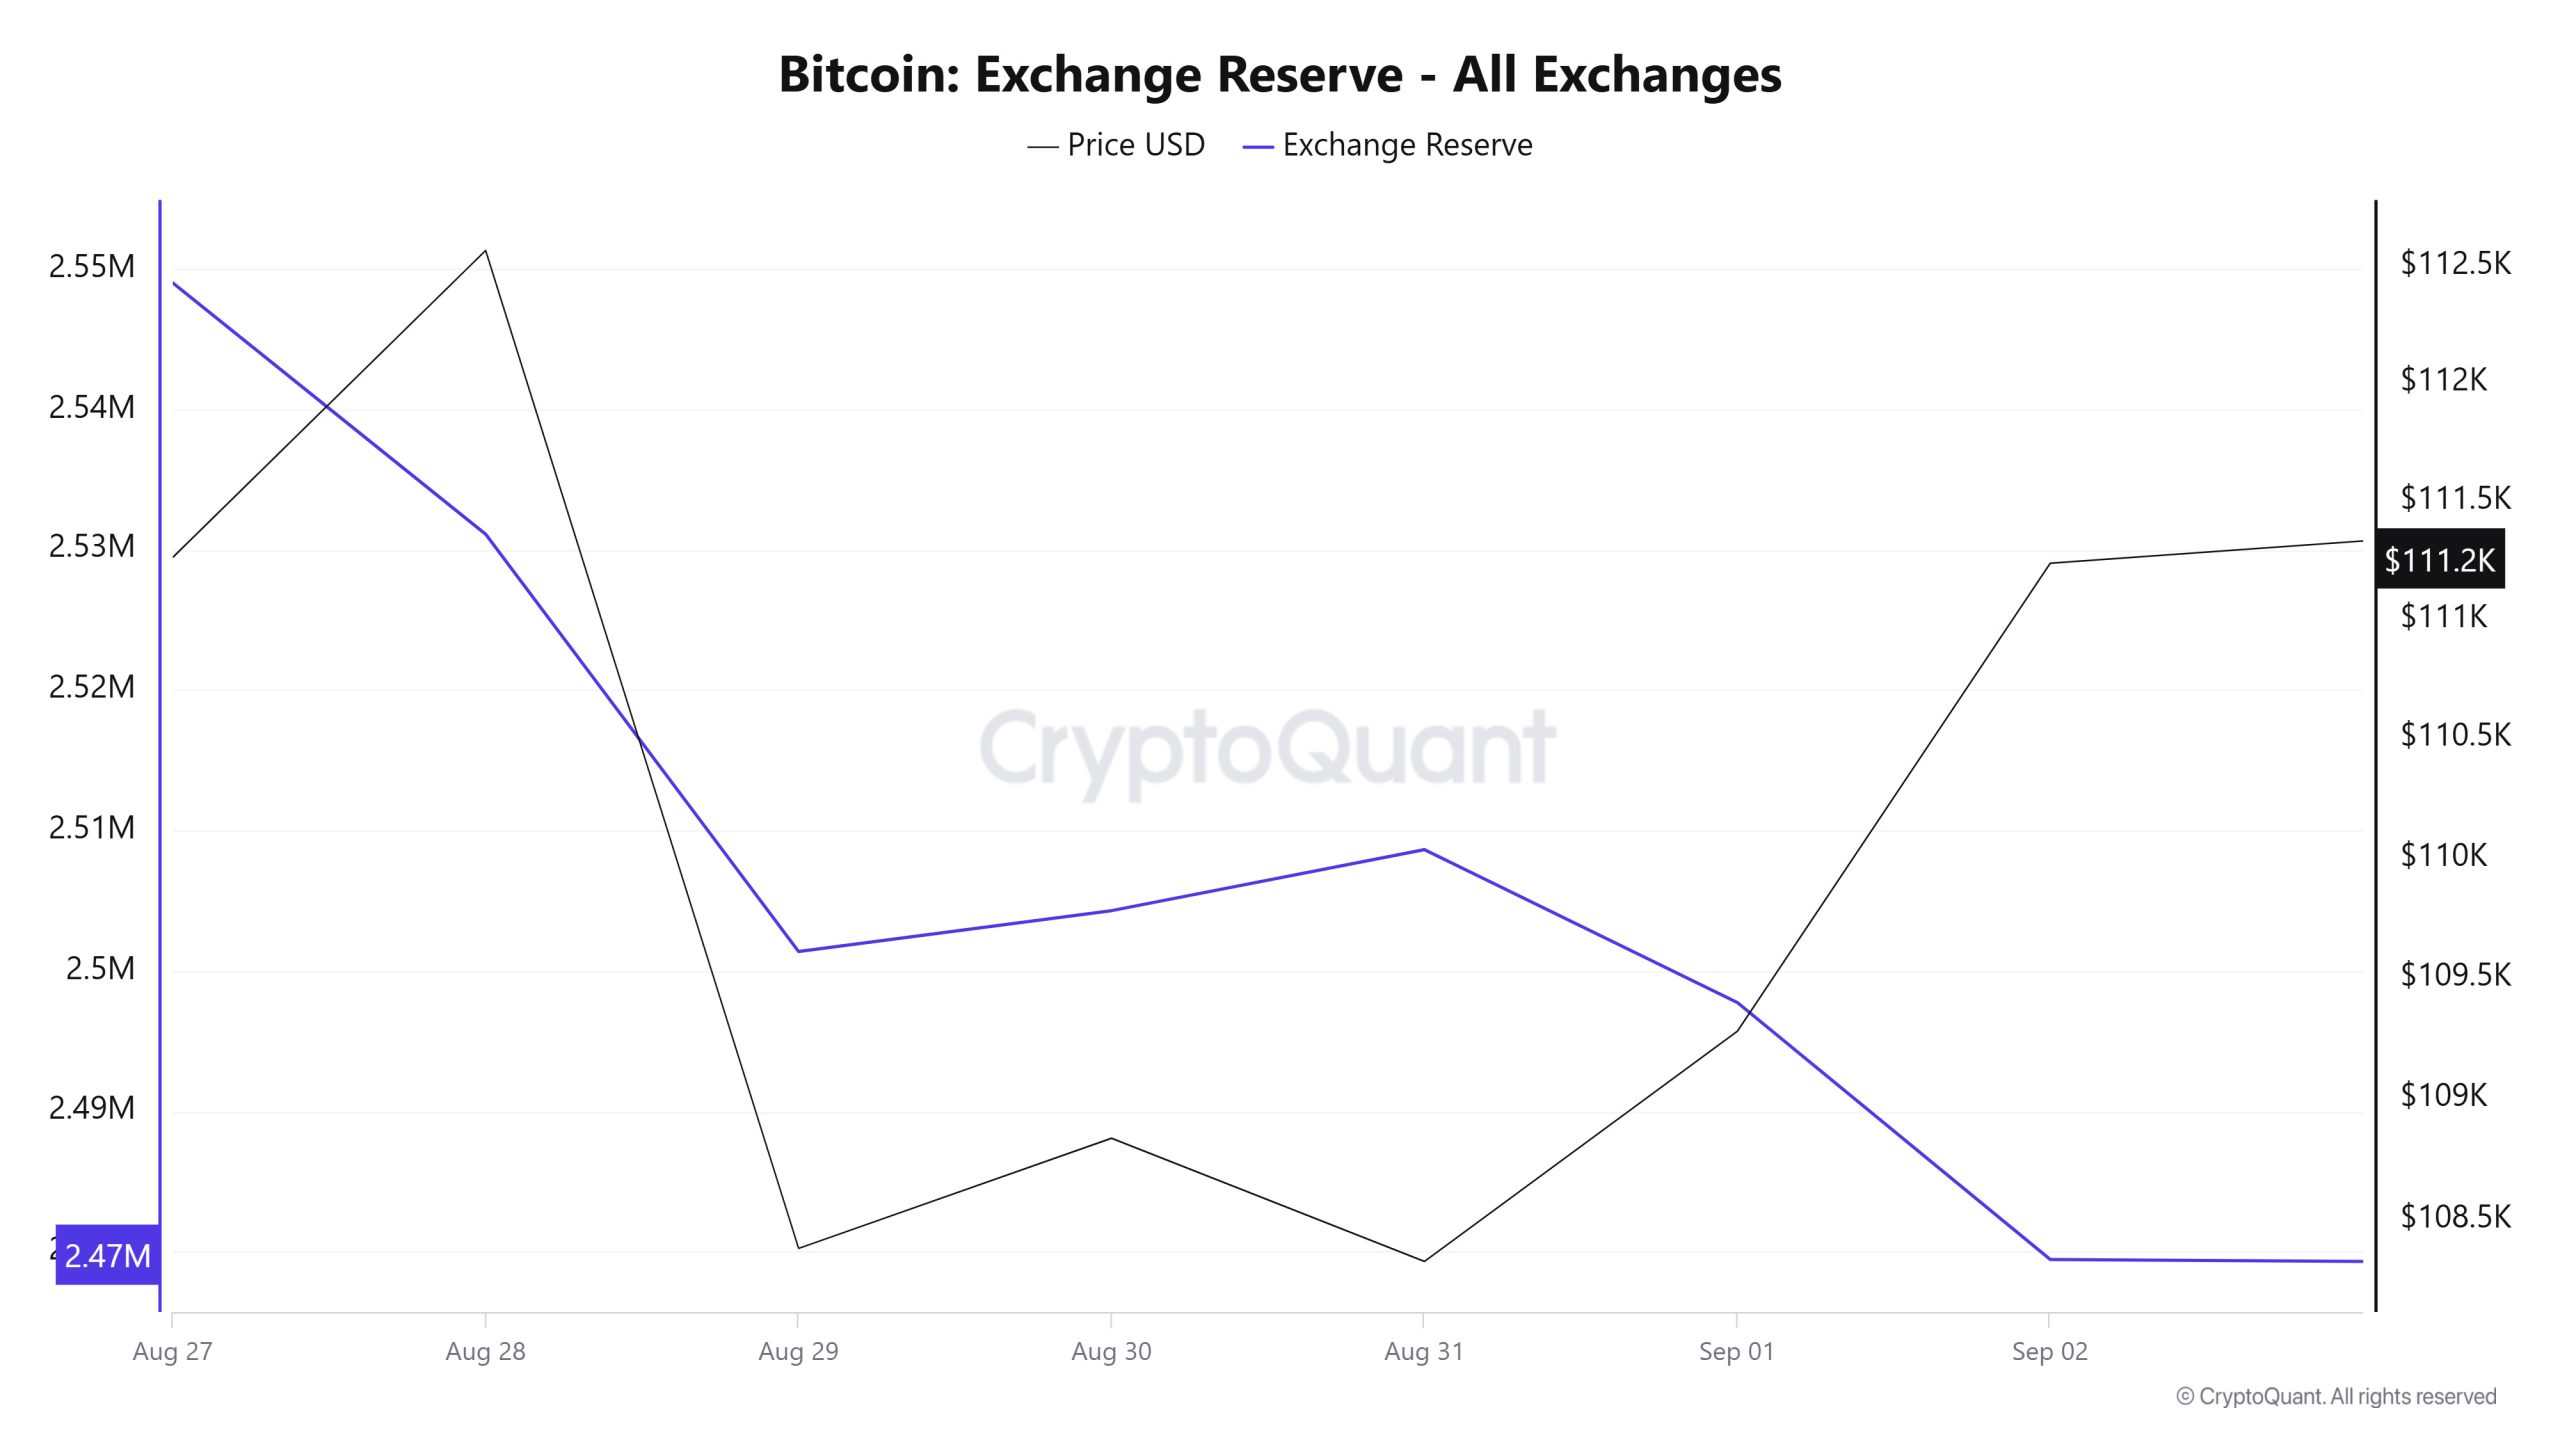
Between August 27 and September 2, 2025, Bitcoin reserves on exchanges decreased from 2,549,015 BTC to 2,479,457 BTC. During this period, there was a total net outflow of 69,558 BTC, a decrease in reserves of about 2.73%. In the same period, the BTC price experienced a limited pullback from $111,807 to $111,237, losing about 0.51%. The drop in exchange reserves while the price remained flat indicates that investors are taking a long-term attitude away from selling pressure. Continuation of this situation may cause an increase in the short term.
| Date | Long Amount (Million $) | Short Amount (Million $) |
|---|---|---|
| August 27 | 19.32 | 11.58 |
| August 28 | 24.39 | 8.67 |
| August 29 | 262.30 | 12.14 |
| August 30 | 9.95 | 4.59 |
| August 31 | 23.08 | 8.43 |
| September 01 | 72.37 | 73.30 |
| September 02 | 19.20 | 38.56 |
| Total | 430.61 | 157.27 |
Fees and Revenues
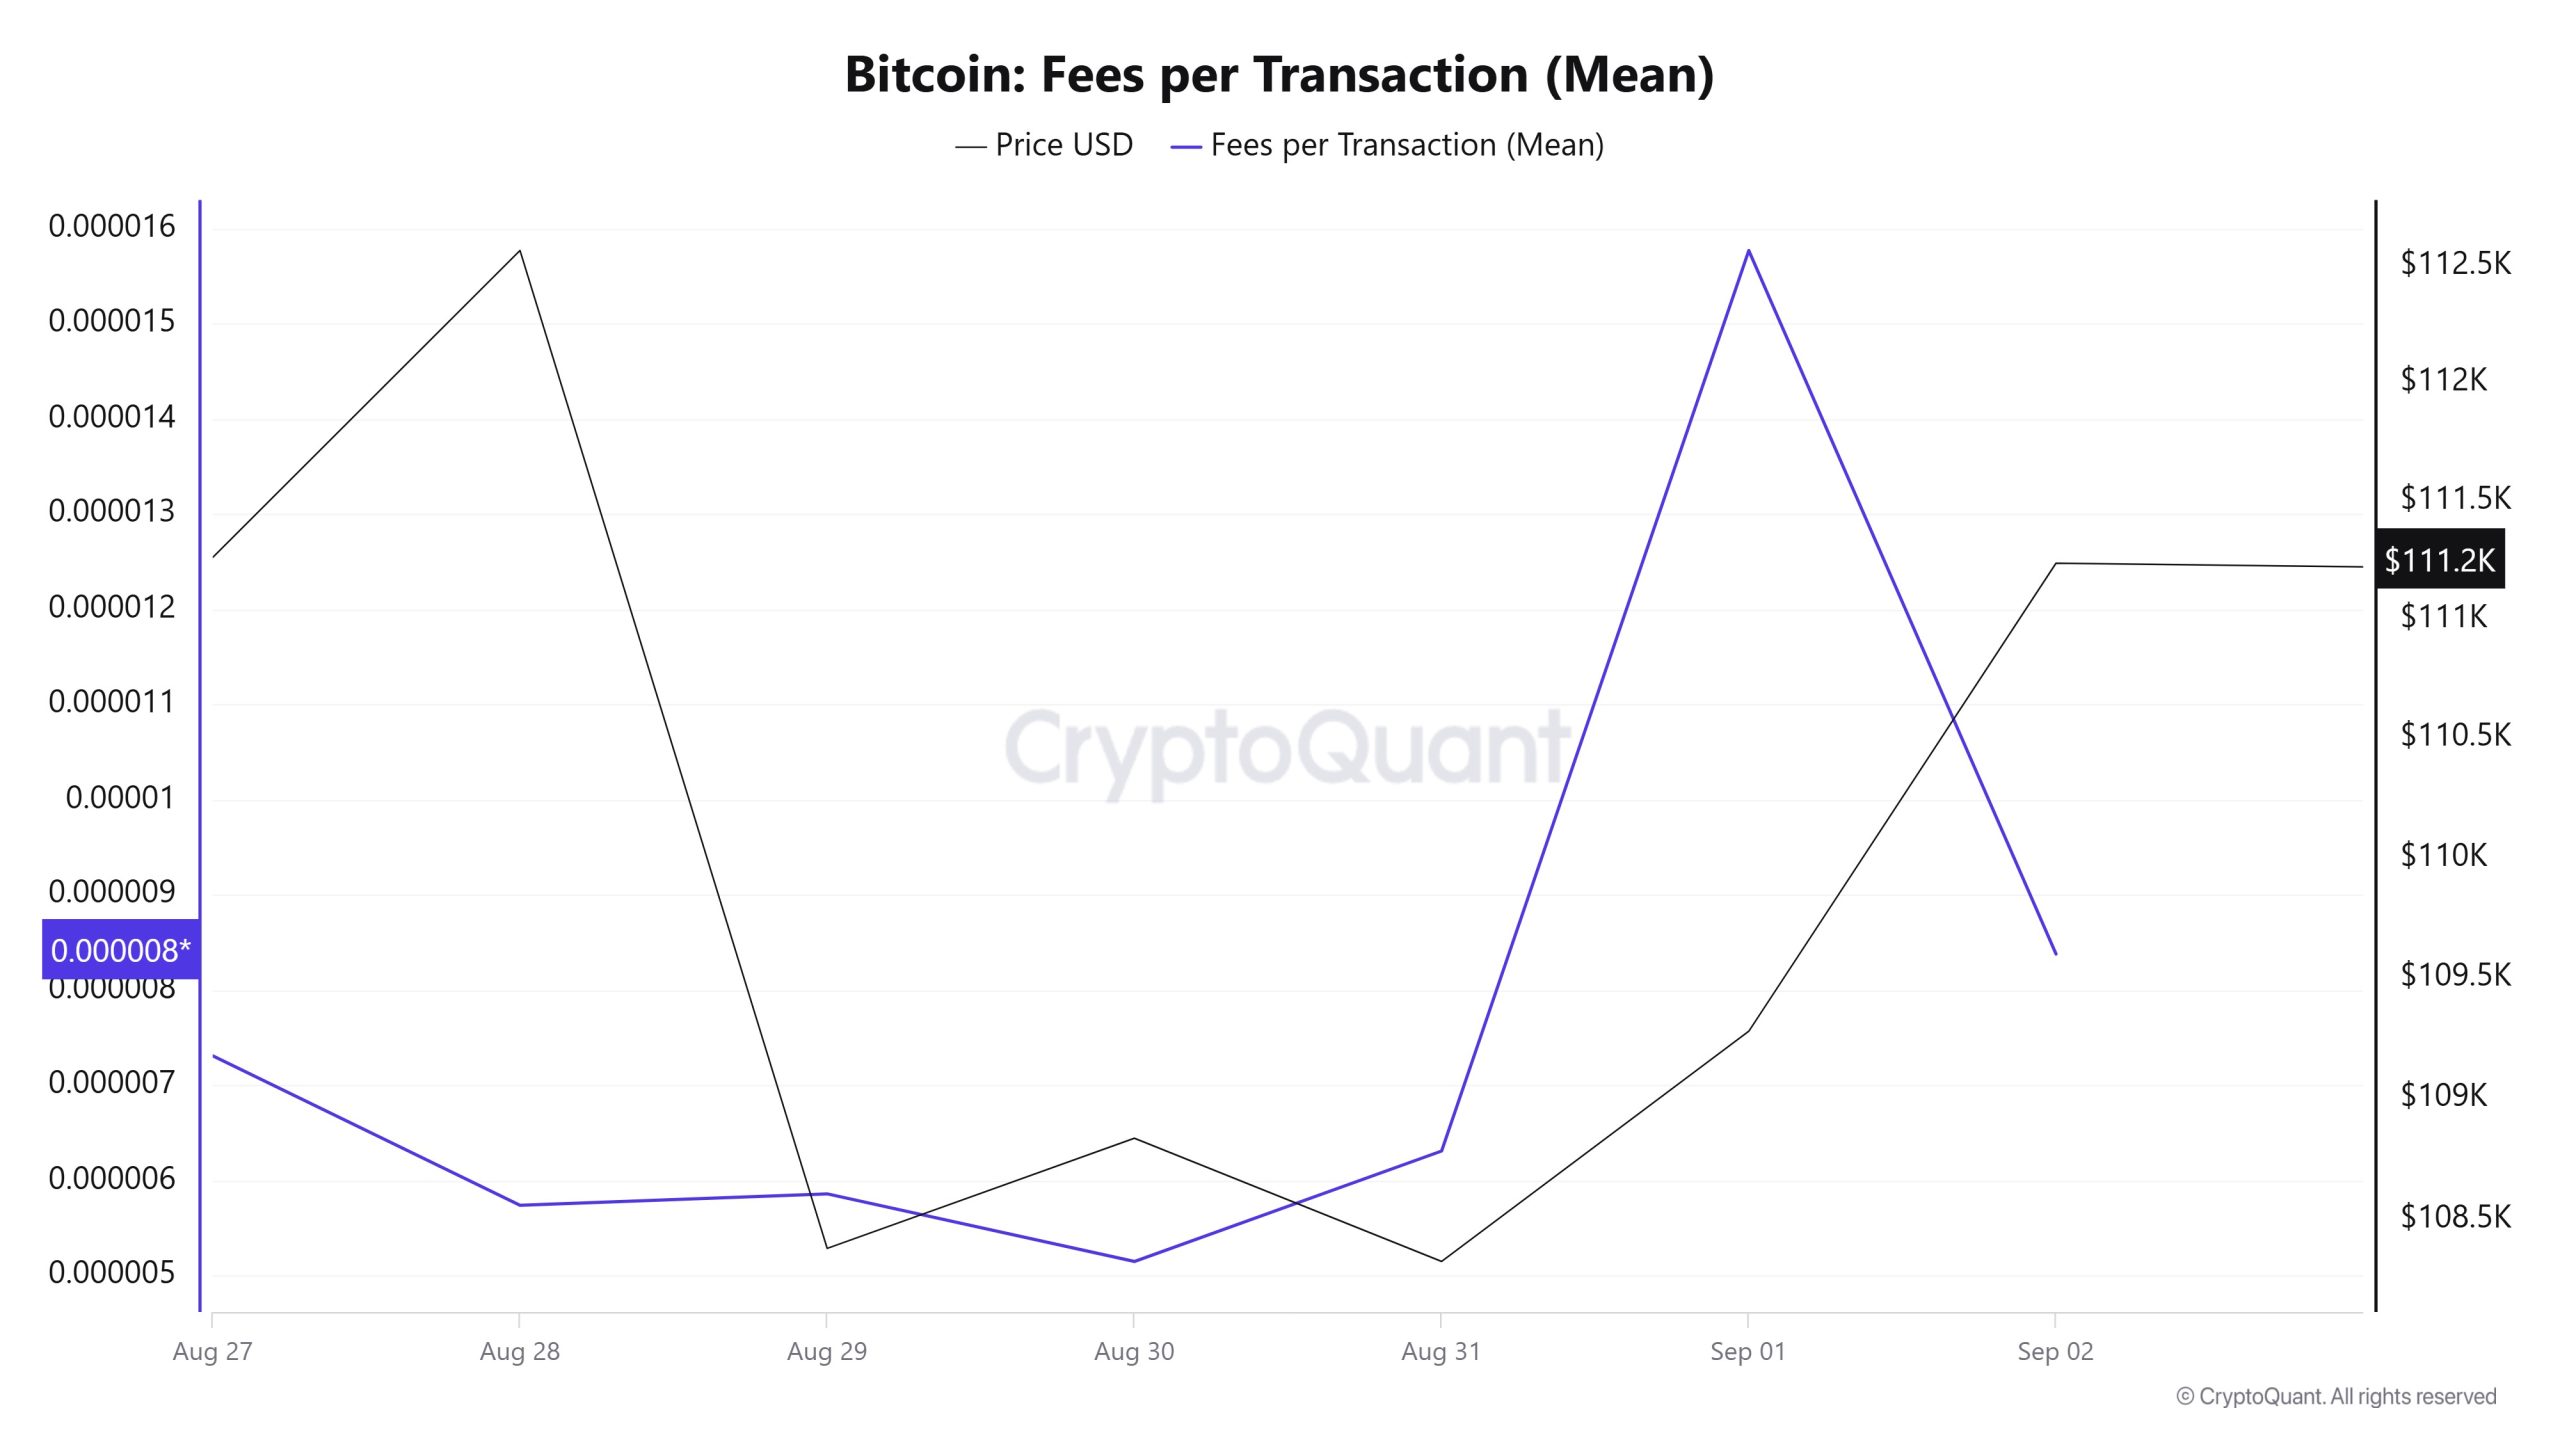
Between August 27 and September 2, Bitcoin Fees per Transaction (Mean) data shows that the indicator was at 0.00000731 on August 27, the first day of the week.
As of August 30, the value in question, which saw its low level on August 30, followed a fluctuating course due to the volatility in Bitcoin price until this date. On September 1, it rose to 0.00001577, recording the highest value of the week.
In the following days, the Bitcoin Fees per Transaction (Mean) indicator resumed its downward trend and closed at 0.00000838 on September 2, the last day of the week.
Bitcoin: Fees (Total)
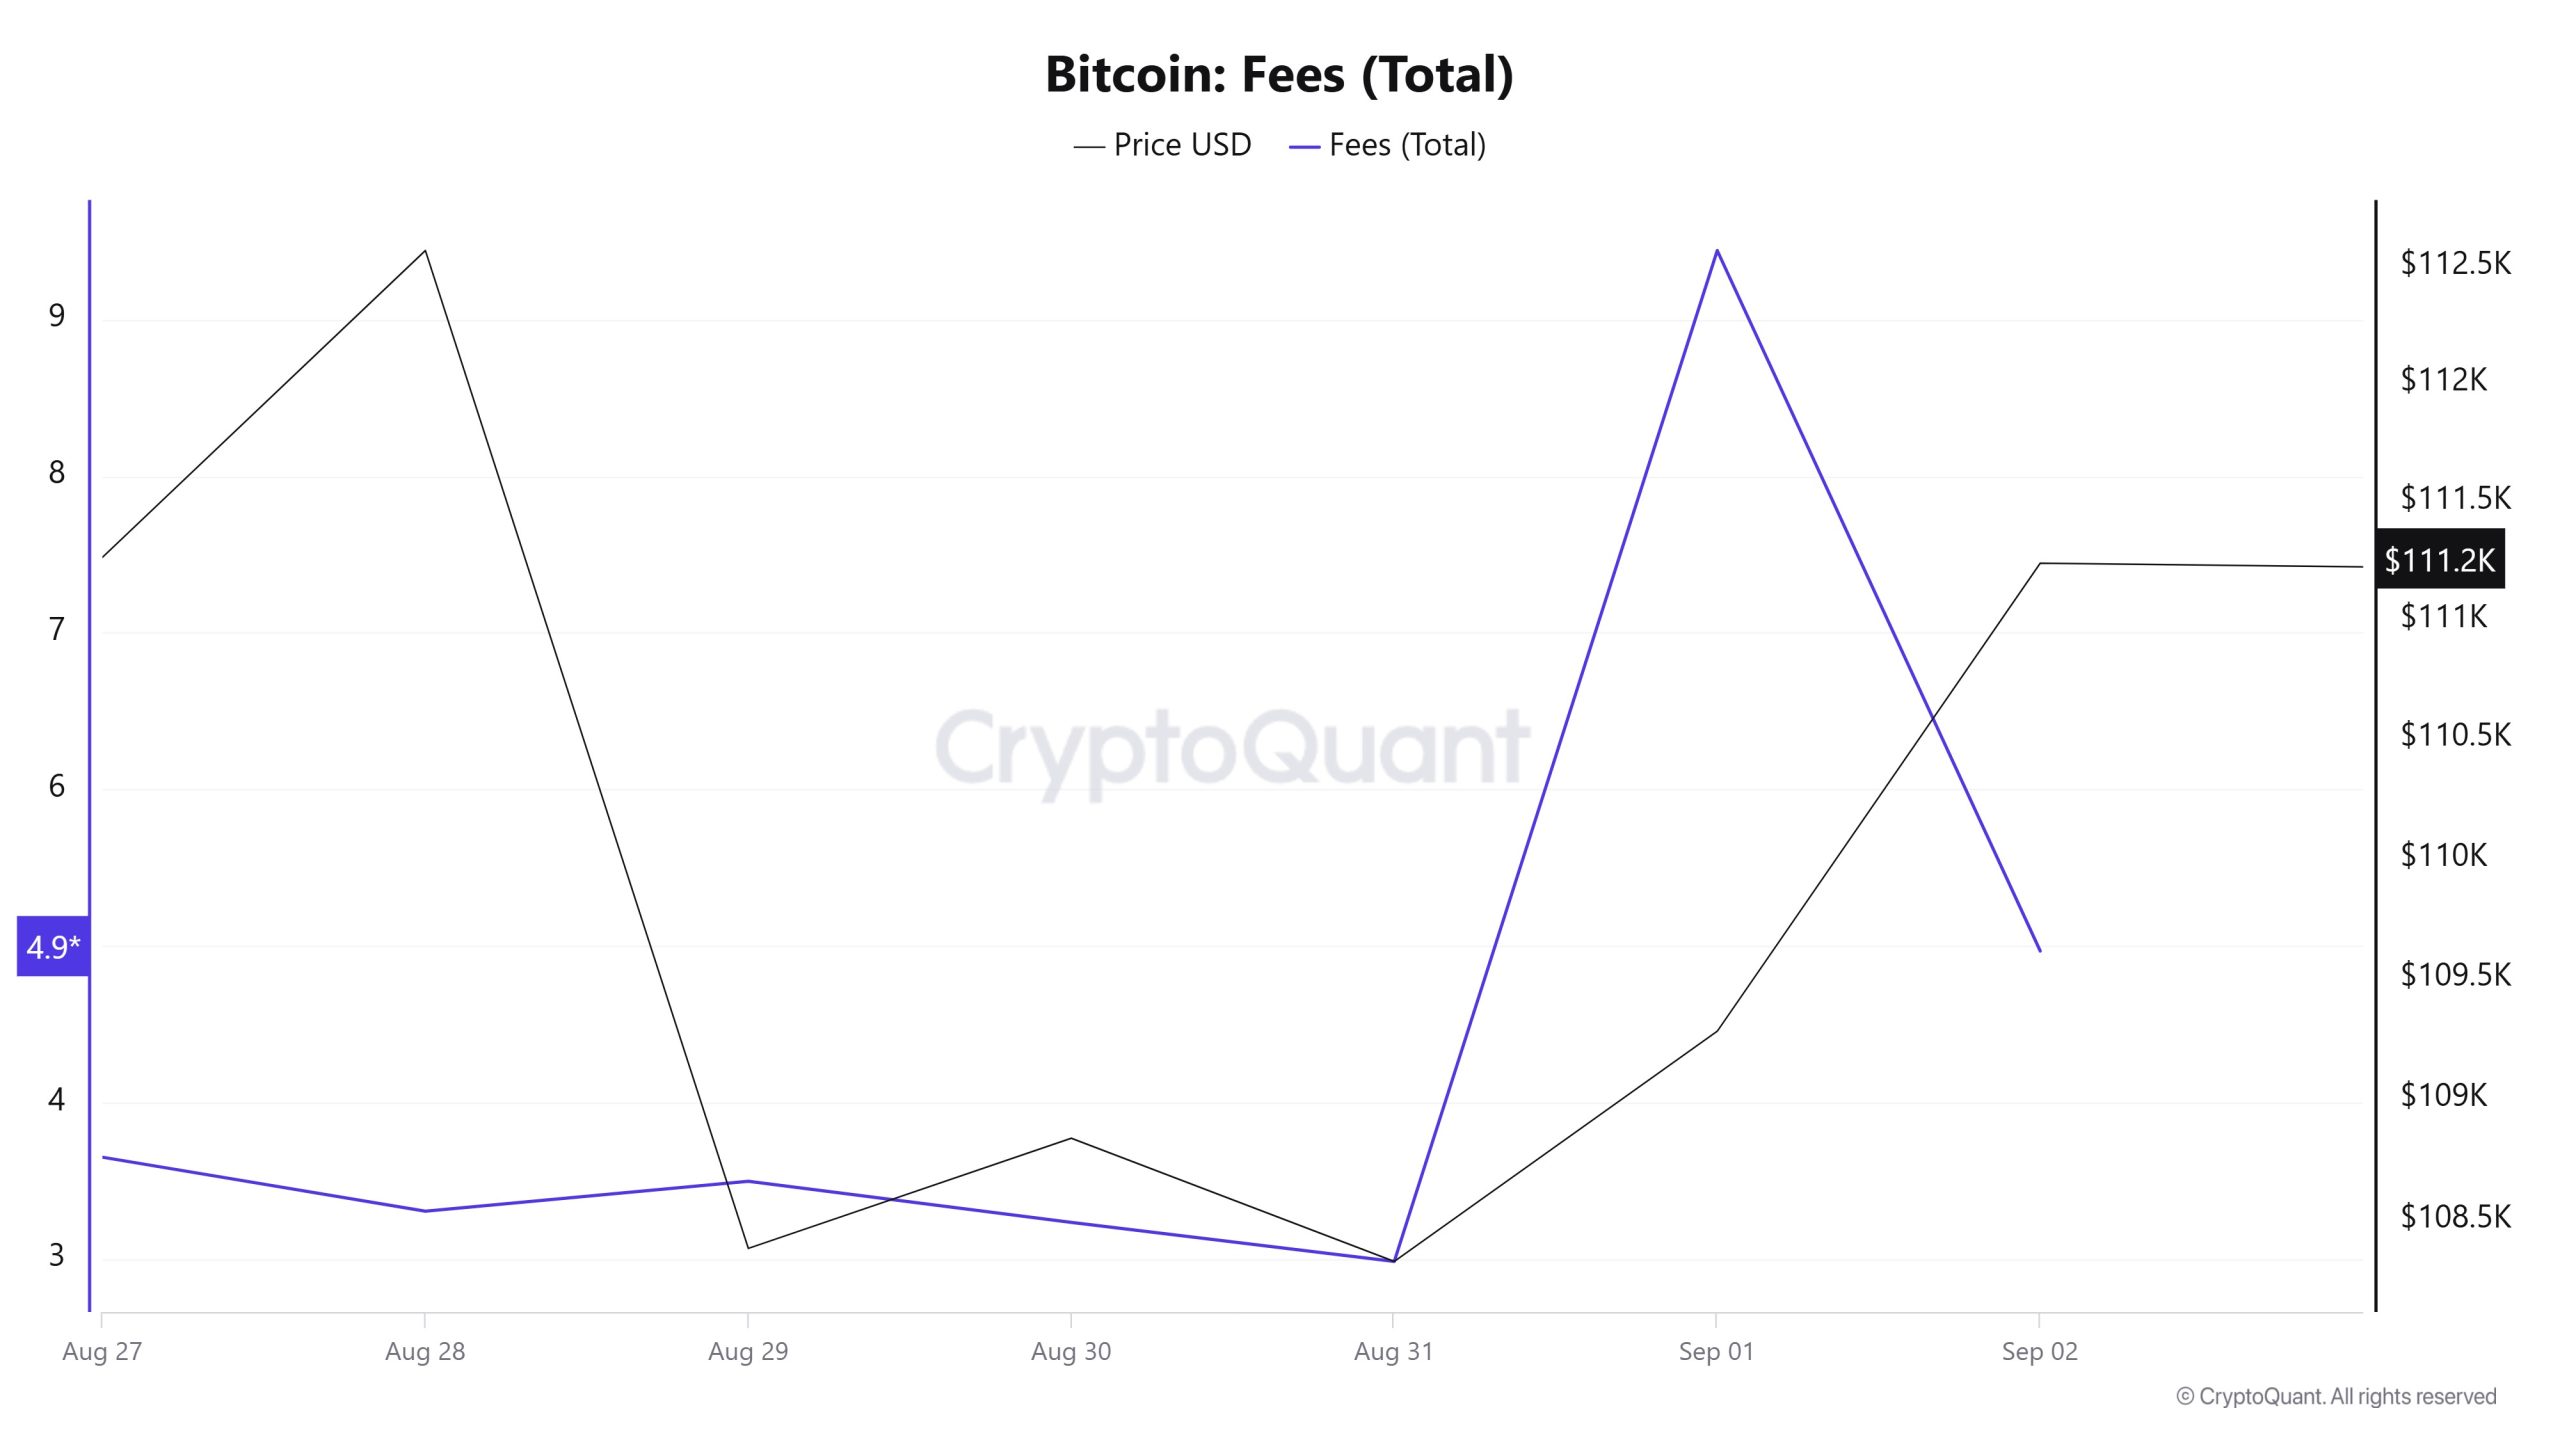
Similarly, an analysis of Bitcoin Fees (Total) data between August 27 and September 2 shows that the indicator was at 3.64918434 on August 27, the first day of the week.
As of August 30, the value in question, which hit its low level on August 30, followed a fluctuating course due to the volatility in Bitcoin price until this date. On September 1, it rose to 9.44095697, recording the highest value of the week.
In the following days, the Bitcoin Fees (Total) indicator resumed its downtrend and closed at 4.96663496 on September 2, the last day of the week.
Miner Flows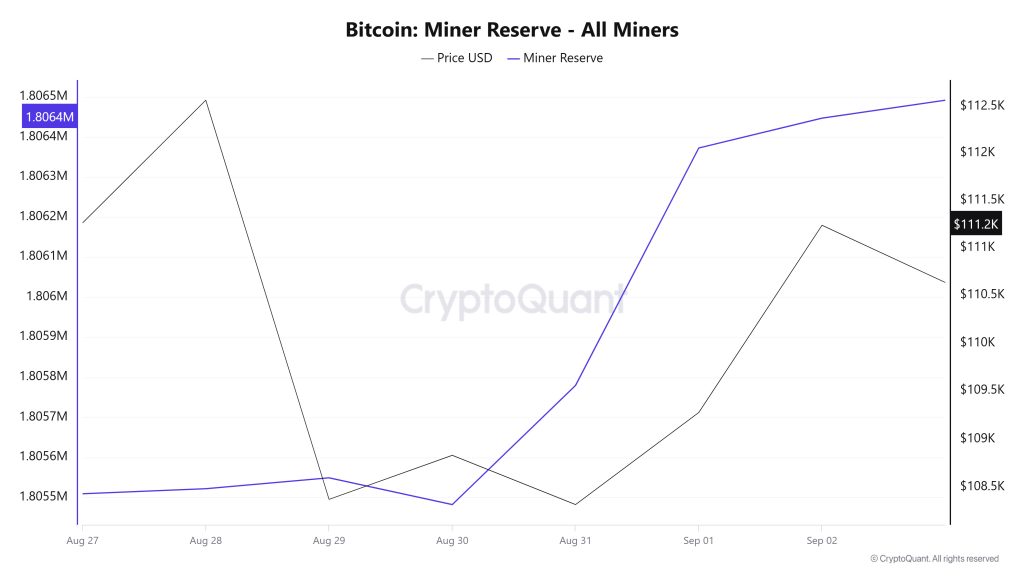
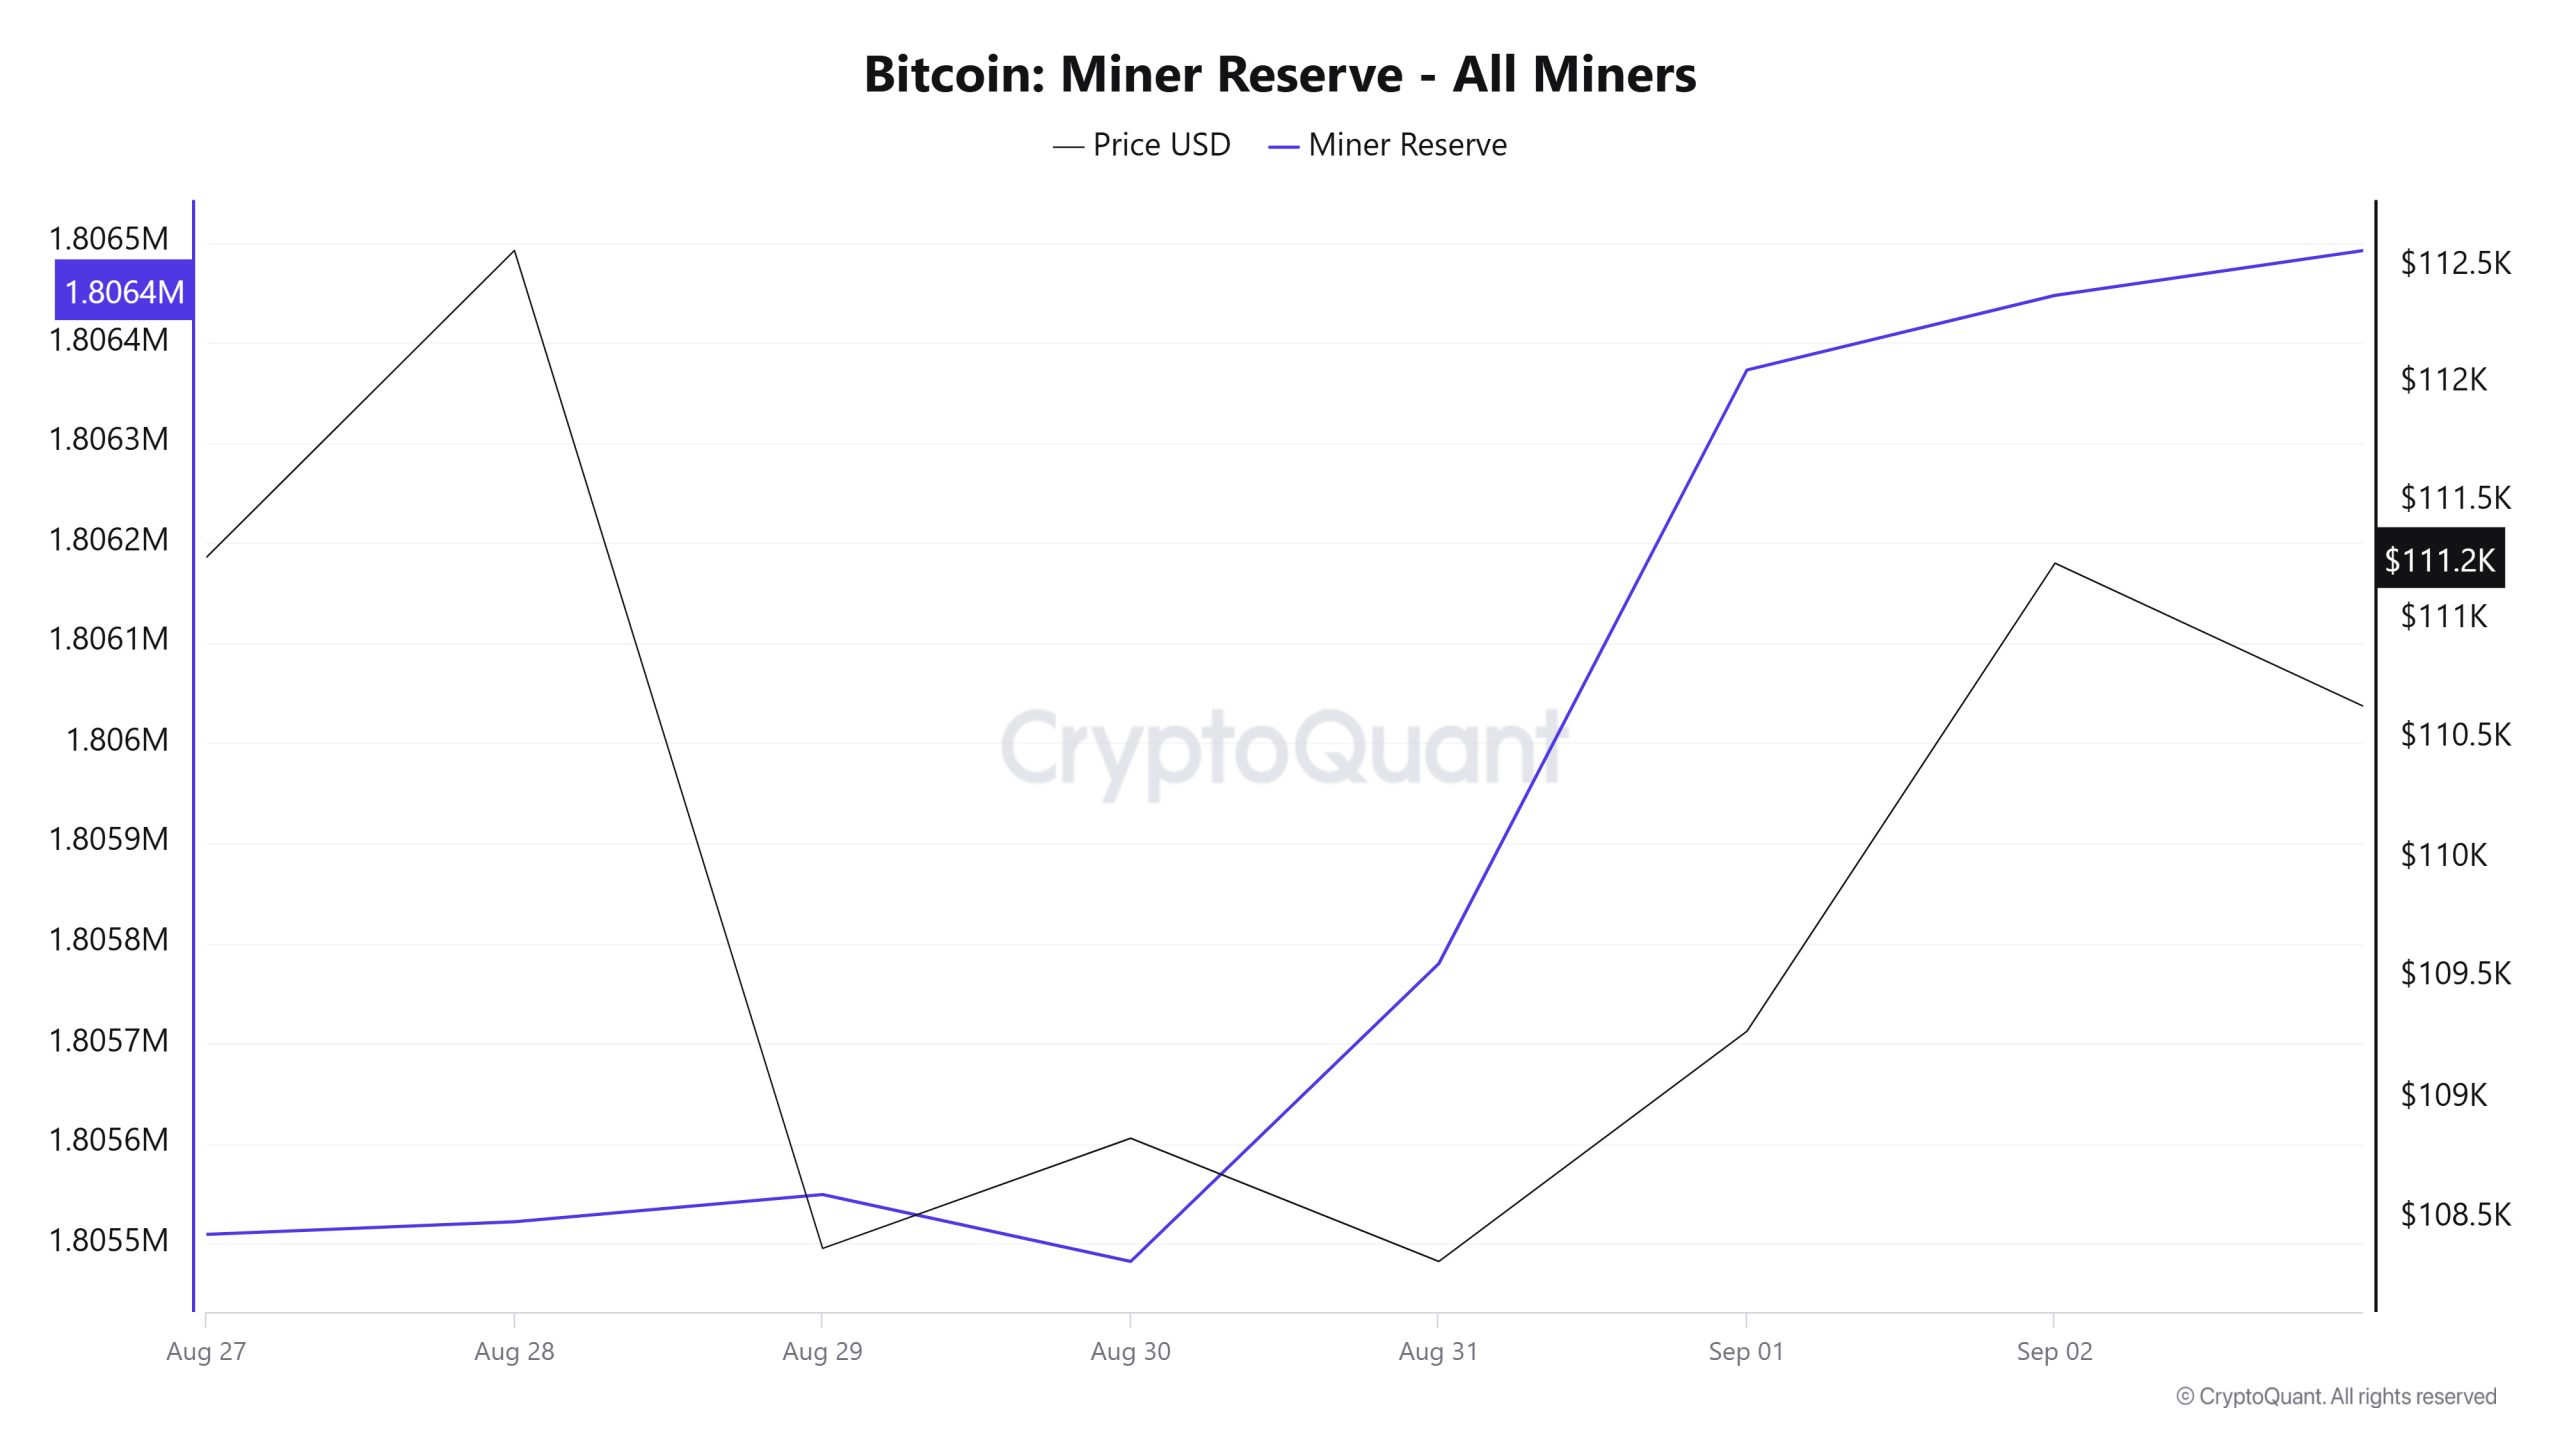
According to the data obtained from the Miner Reserve table, there has been an increase in Bitcoin reserves held in miners’ wallets this week. A time-varying correlation structure was observed between Bitcoin price and miner reserve over the time period analyzed. However, the general trend suggests that a positive correlation between these two variables is dominant.
Miner Inflow, Outflow and Netflow
Between August 27 and September 02, 46,774 Bitcoins exited miners’ wallets and 47,592 Bitcoins entered miners’ wallets between the same dates. The Miner Netflow for this week was 818 Bitcoin. Meanwhile, the Bitcoin price was $111,261 on August 27 and $111,237 on September 02.
For the week, the net flow (Miner Netflow) was positive as Bitcoin inflow into miner wallets (Miner Inflow) was less than Bitcoin outflow from miner wallets (Miner Outflow).
| Date | Miner Inflow | Miner Outflow | Miner Netflow |
|---|---|---|---|
| August 27 | 6,092.79 | 6,212.70 | -119.91 |
| August 28 | 6,212.39 | 6,199.67 | 12.71 |
| August 29 | 7,657.98 | 7,630.89 | 27.09 |
| August 30 | 6,004.84 | 6,071.65 | -66.81 |
| August 31 | 6,881.79 | 6,584.07 | 297.72 |
| September 01 | 8,580.72 | 7,987.68 | 593.04 |
| September 02 | 6,162.48 | 6,087.83 | 74.65 |
Transaction
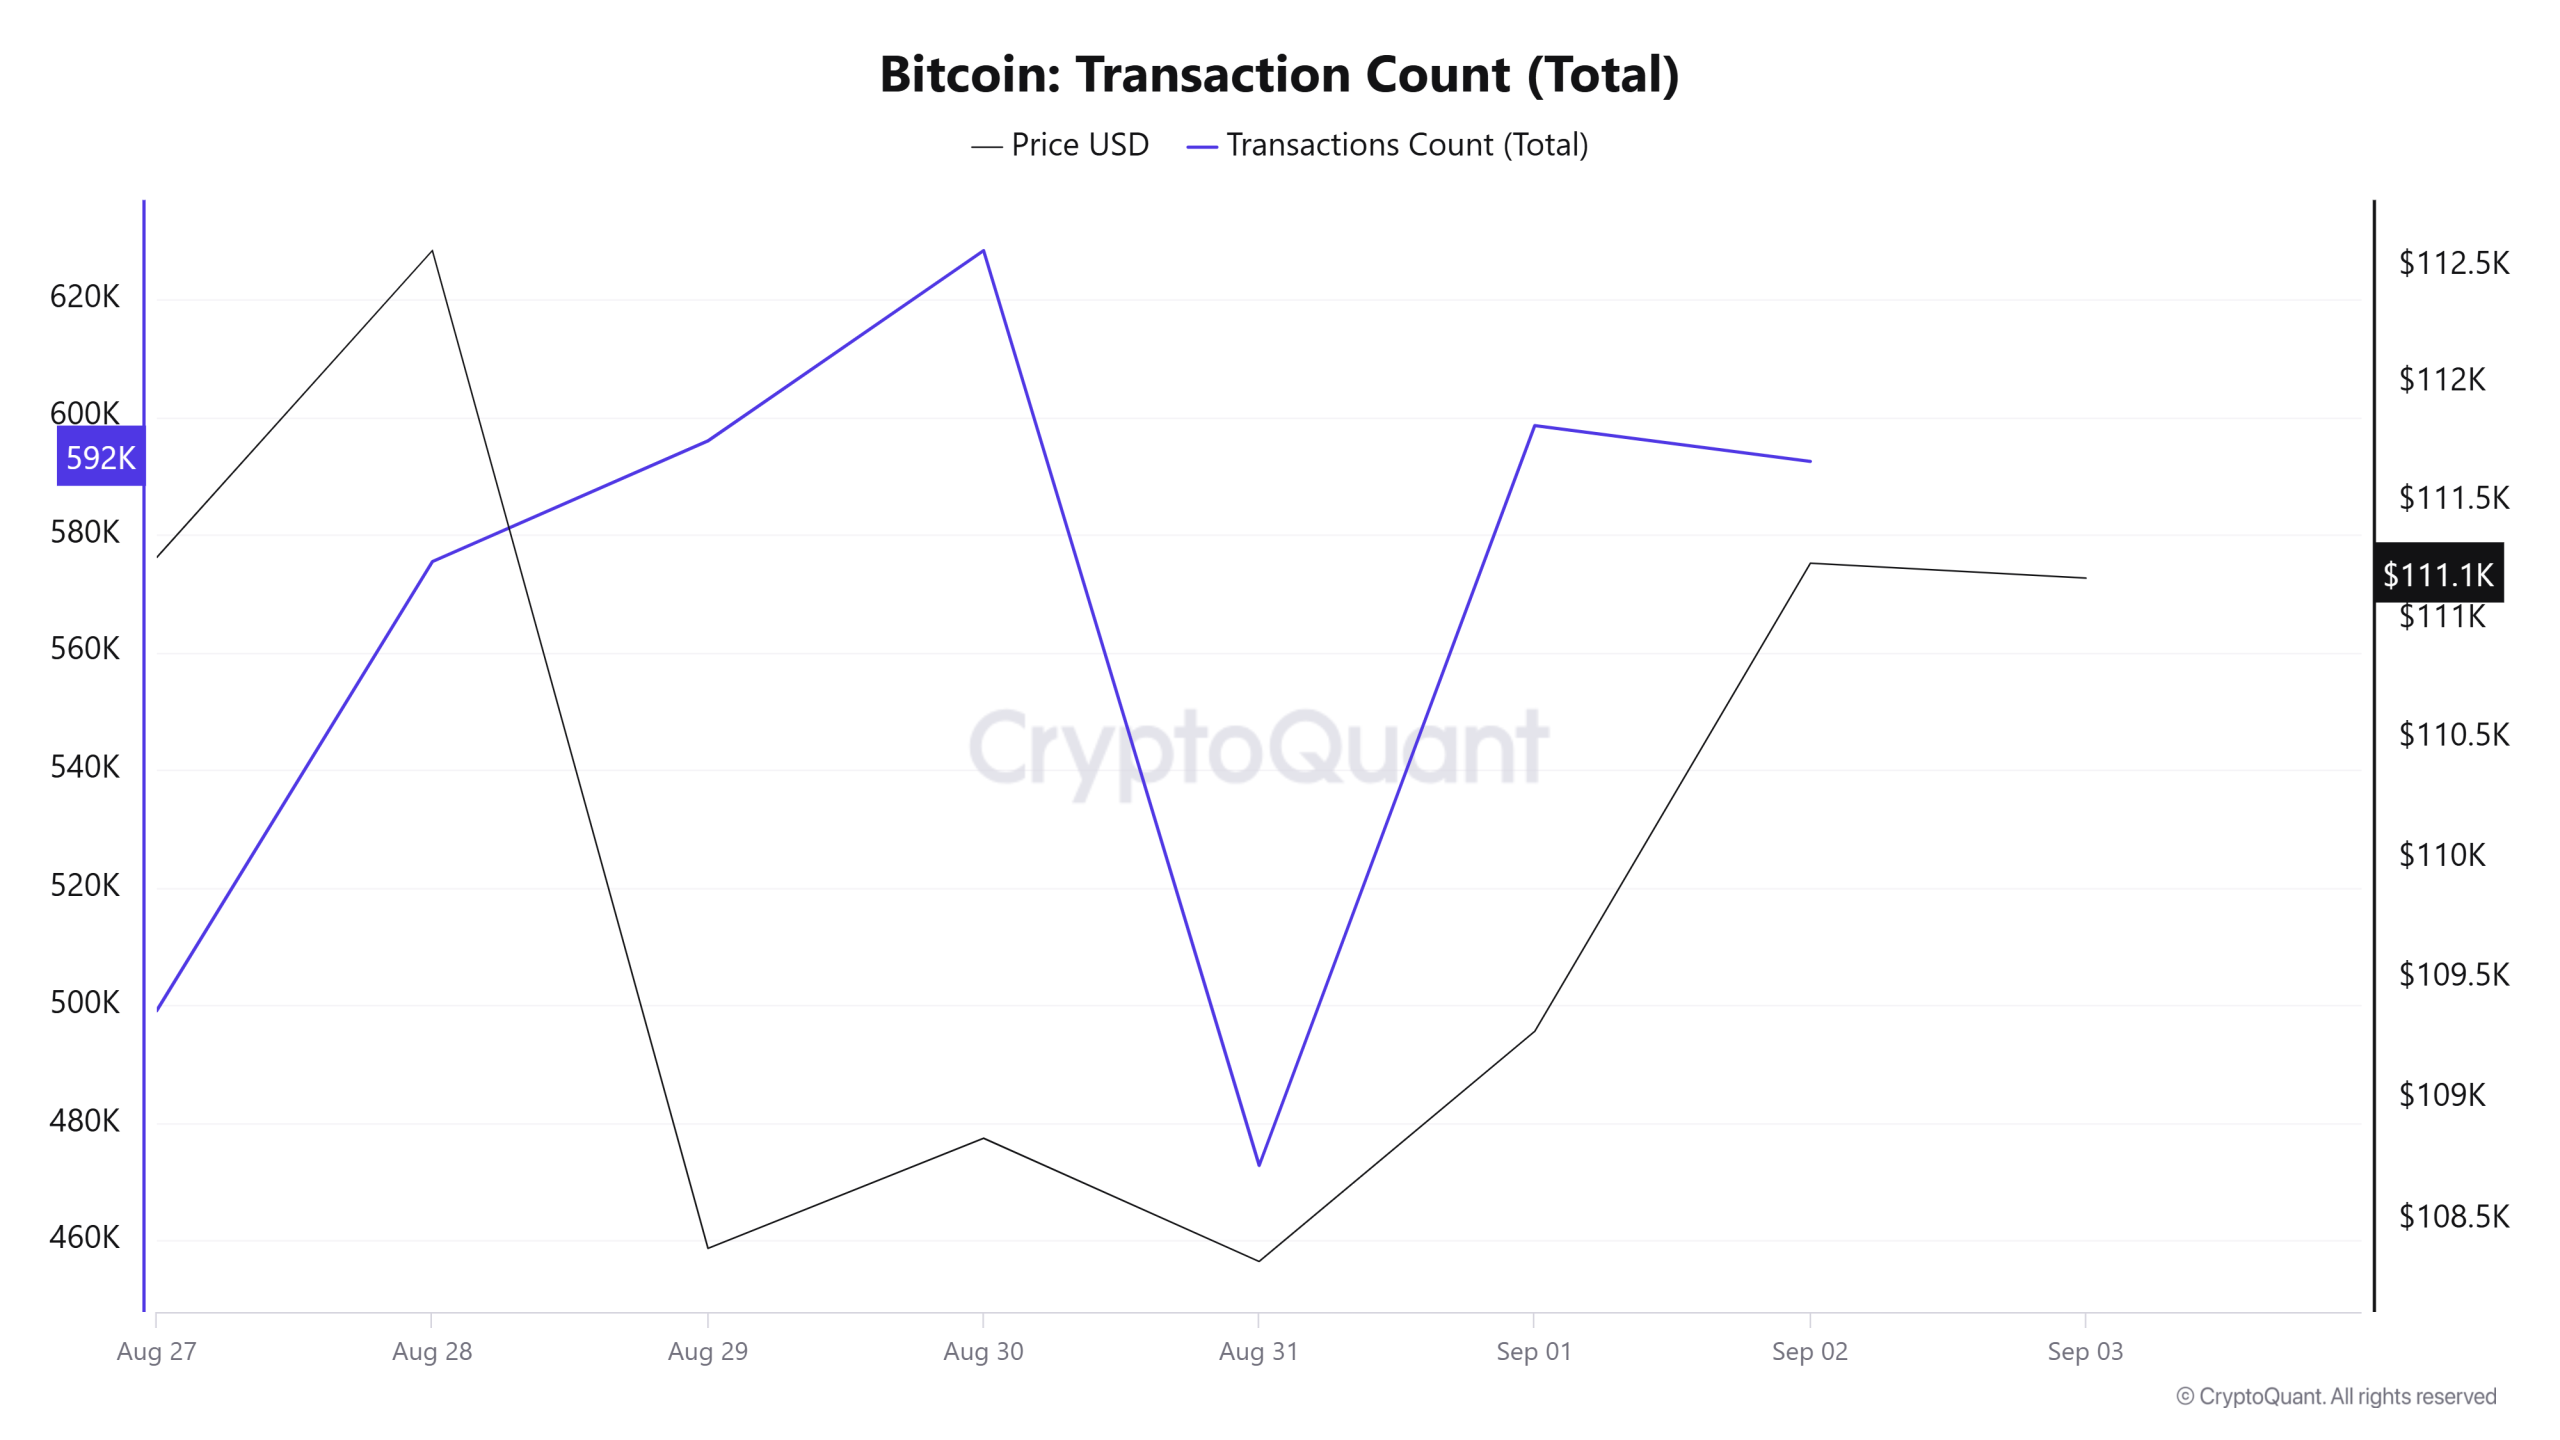
Last week, there were 3,263,012 transactions on the Bitcoin network, while this week there were 3,962,794 transactions, an increase of about 21.5%. The highest transaction volume of the week was 628,355 on August 30, while the lowest was 472,776 on August 31. While there was a sharp rise in the number of transactions in the first half of the week (August 27-30), a rapid decline was observed in the second half. The strong correlations between the number of transactions and price movements across the period suggest that most of the transactions were natural. In terms of the weekly trend, the increase in network activity compared to last week provides a positive outlook and the correlations during the week support this view. However, sharp fluctuations in trading volumes complicate the stability of the market in the short term and increase uncertainty.
Tokens Transferred
A total of 4,359,848 BTC was transferred last week, up 0.5% to 4,381,695 BTC this week. The highest daily transfer of the week and August was 829,622 BTC on August 29, while the lowest was 523,177 BTC on August 31. While these large transfer fluctuations suggest that Bitcoin is changing hands heavily, it seems more likely that the transfers are sales-heavy in these downwardly trending weeks.
Whale Activities
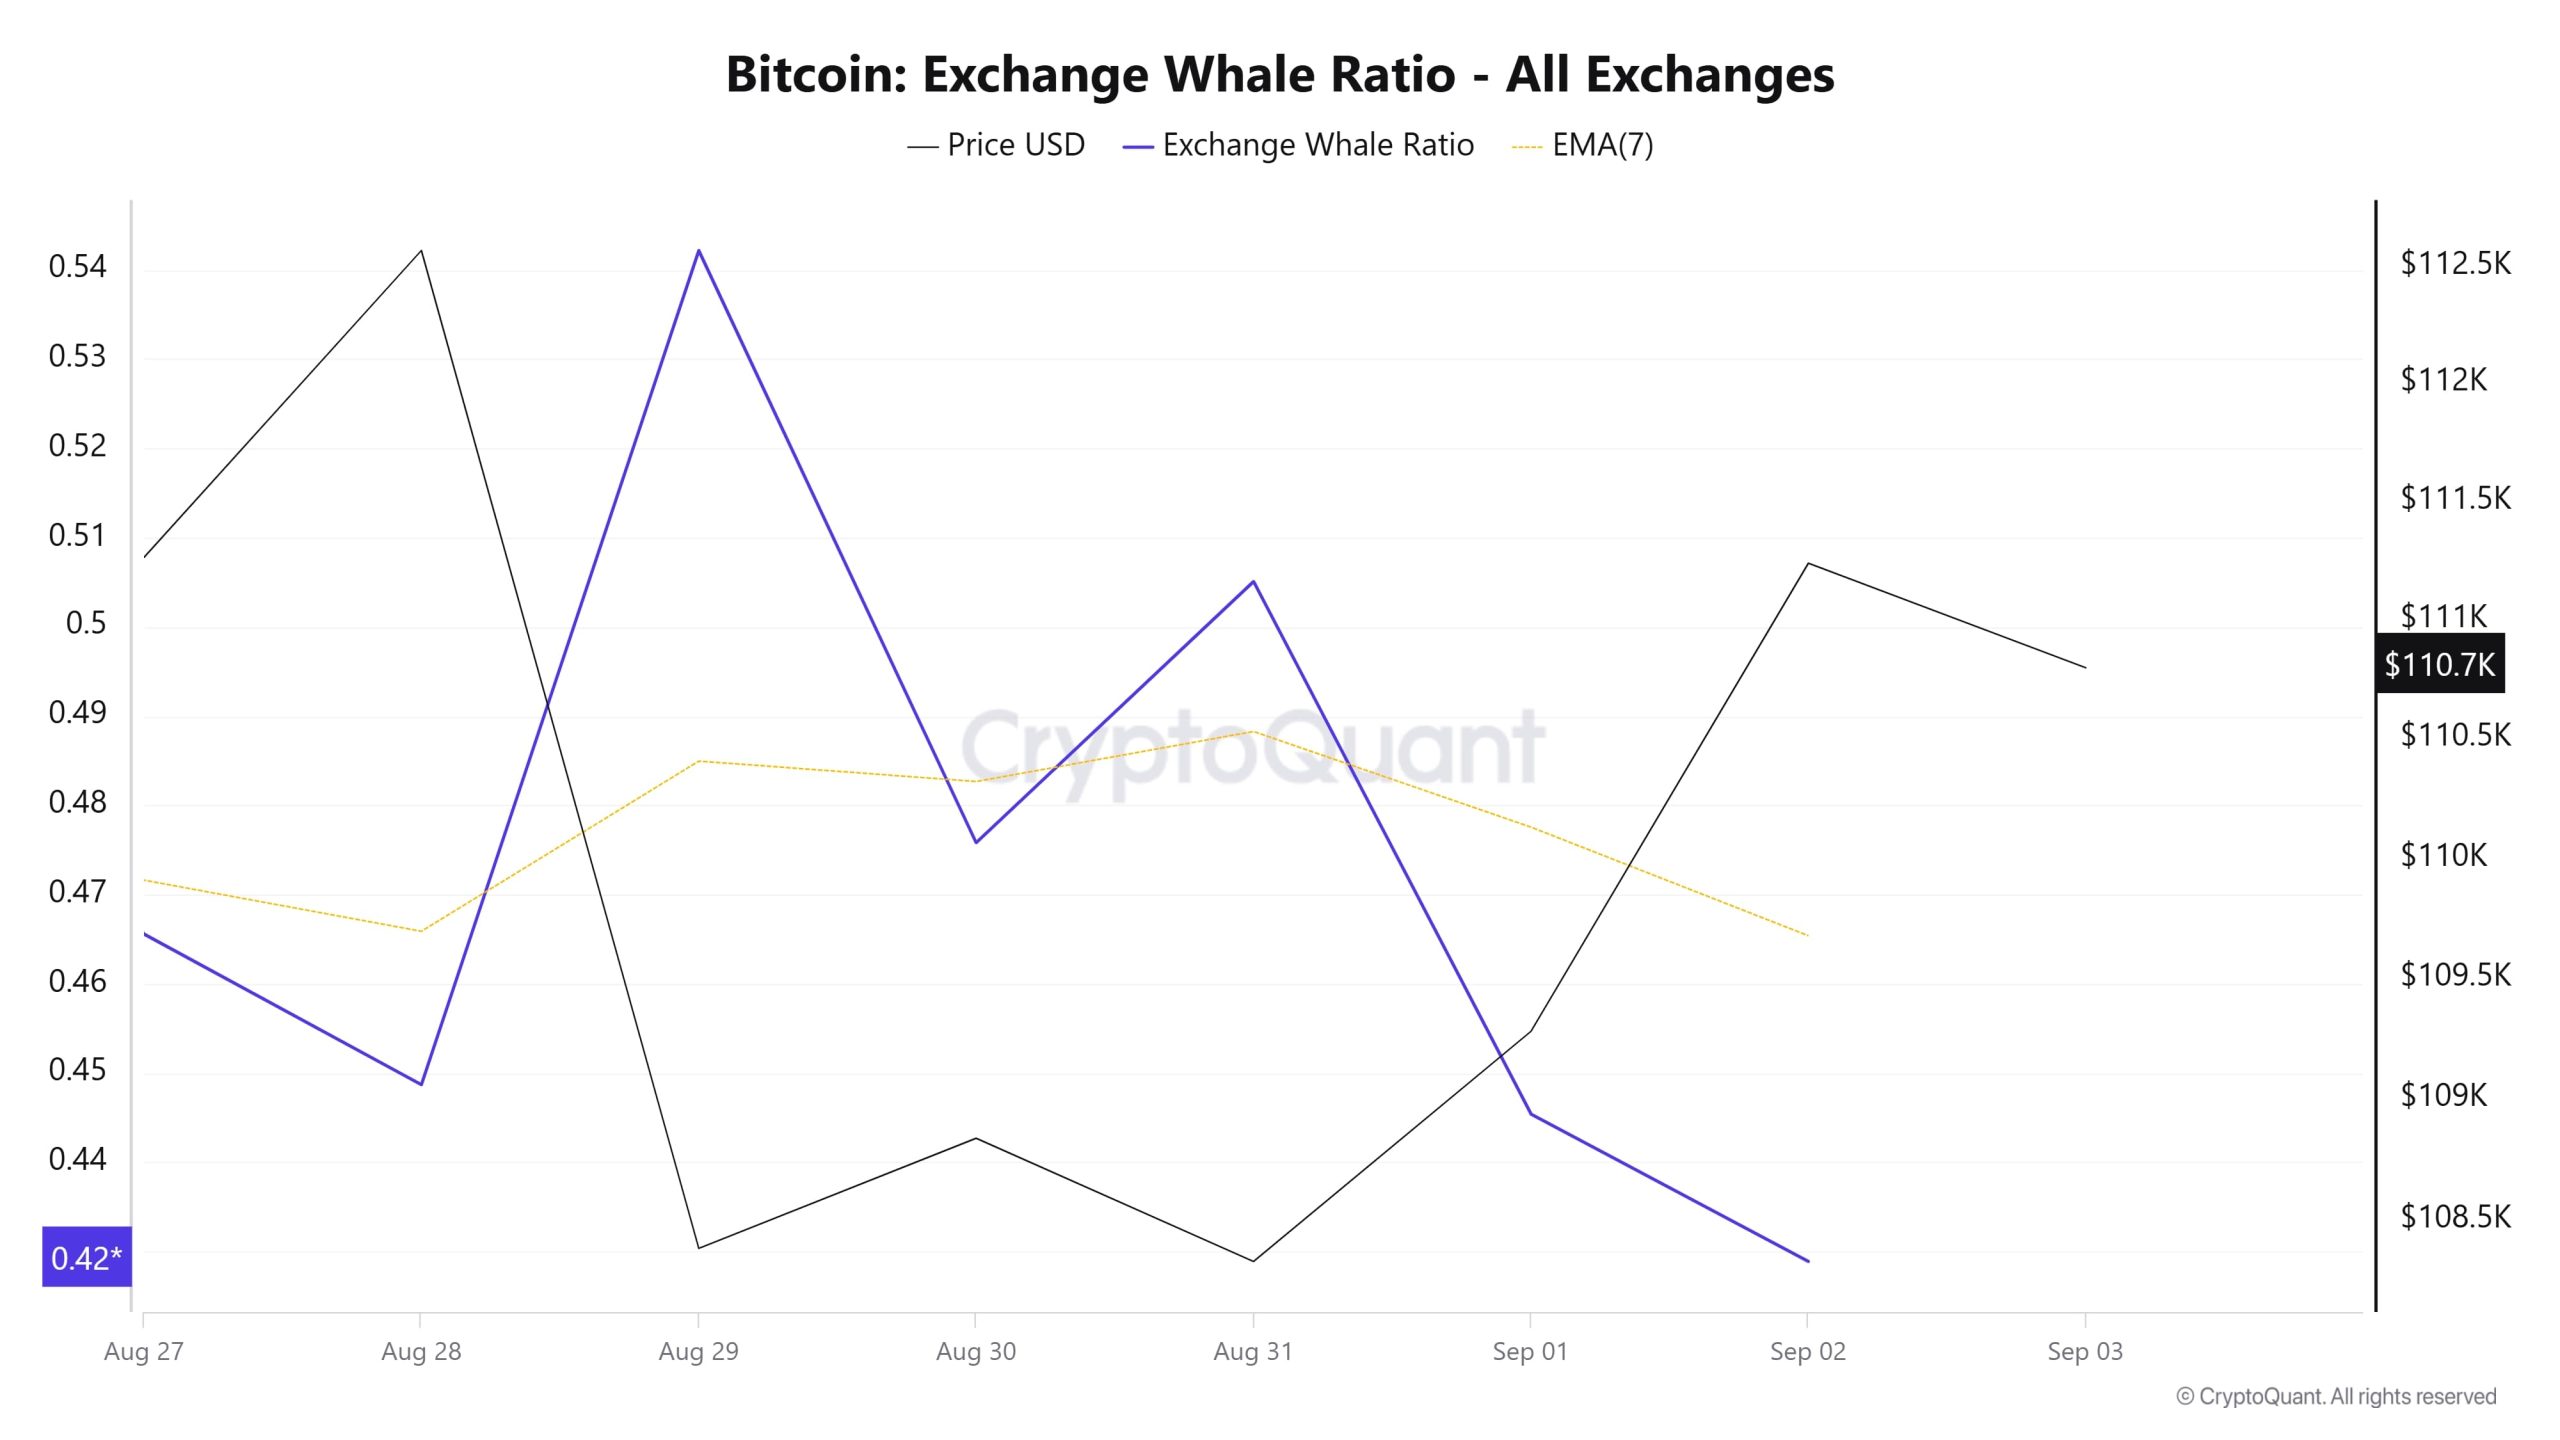
Whales Data:
In the last 7 days, according to the data in the cryptocurrency market, whale activity on the central exchange has increased from the beginning to the middle of the process. When we look at the Exchange Whale Ratio metric, on August 27, the first day of the 7-day period, the rate of whales using central exchanges was 0.465. The peak of the process took place on August 29 and the value was 0.542. When this ratio is above 0.35, it usually means that whales use centralized exchanges frequently. The metric, which currently has a value of 0.428, also realized the lowest point of the process. It is seen that BTC remained between 107,500 and 112,000 in this process. At the same time, in the total BTC transfer, it is seen that 4,381,695 BTC moved in parallel with last week. When we look at the data, an important behavioral change has emerged. Bitcoin whales, who turned billions of dollars into Ether, emphasize that the belief in Bitcoin’s support of $ 108,000 among major players is weakening. The whales’ shift towards altcoins may signal the start of the season of undervalued tokens, which we call the subseason. As a result, we see long-term investors realizing profits on the BTC side and transferring them to other major altcoins. This suggests that the overall market may be bullish, but BTC is on a downward trend.
BTC Onchain Overall
| Metric | Positive 📈 | Negative 📉 | Neutral ➖ |
|---|---|---|---|
| Active Addresses | ✓ | ||
| Breakdowns | ✓ | ||
| Derivatives | ✓ | ||
| Exchange Supply Ratio | ✓ | ||
| Exchange Reserve | ✓ | ||
| Fees and Revenues | ✓ | ||
| Miner Flows | ✓ | ||
| Transaction | ✓ | ||
| Whale Activities | ✓ |
*The metrics and guidance in the table do not, in and of themselves, describe or imply an expectation of future price changes for any asset. The prices of digital assets may vary depending on many different variables. The onchain analysis and related guidance are intended to assist investors in their decision-making process, and making financial investments based solely on the results of this analysis may result in harmful transactions. Even if all metrics produce a positive, negative or neutral result at the same time, the expected results may not be seen according to market conditions. Investors reviewing the report would be well advised to heed these caveats.
Legal Notice
The investment information, comments and recommendations contained in this document do not constitute investment advisory services. Investment advisory services are provided by authorized institutions on a personal basis, taking into account the risk and return preferences of individuals. The comments and recommendations contained in this document are of a general type. These recommendations may not be suitable for your financial situation and risk and return preferences. Therefore, making an investment decision based solely on the information contained in this document may not result in results that are in line with your expectations.
NOTE: All data used in Bitcoin onchain analysis is based on Cryptoqaunt.

