Weekly Bitcoin Onchain Report
Active Addresses
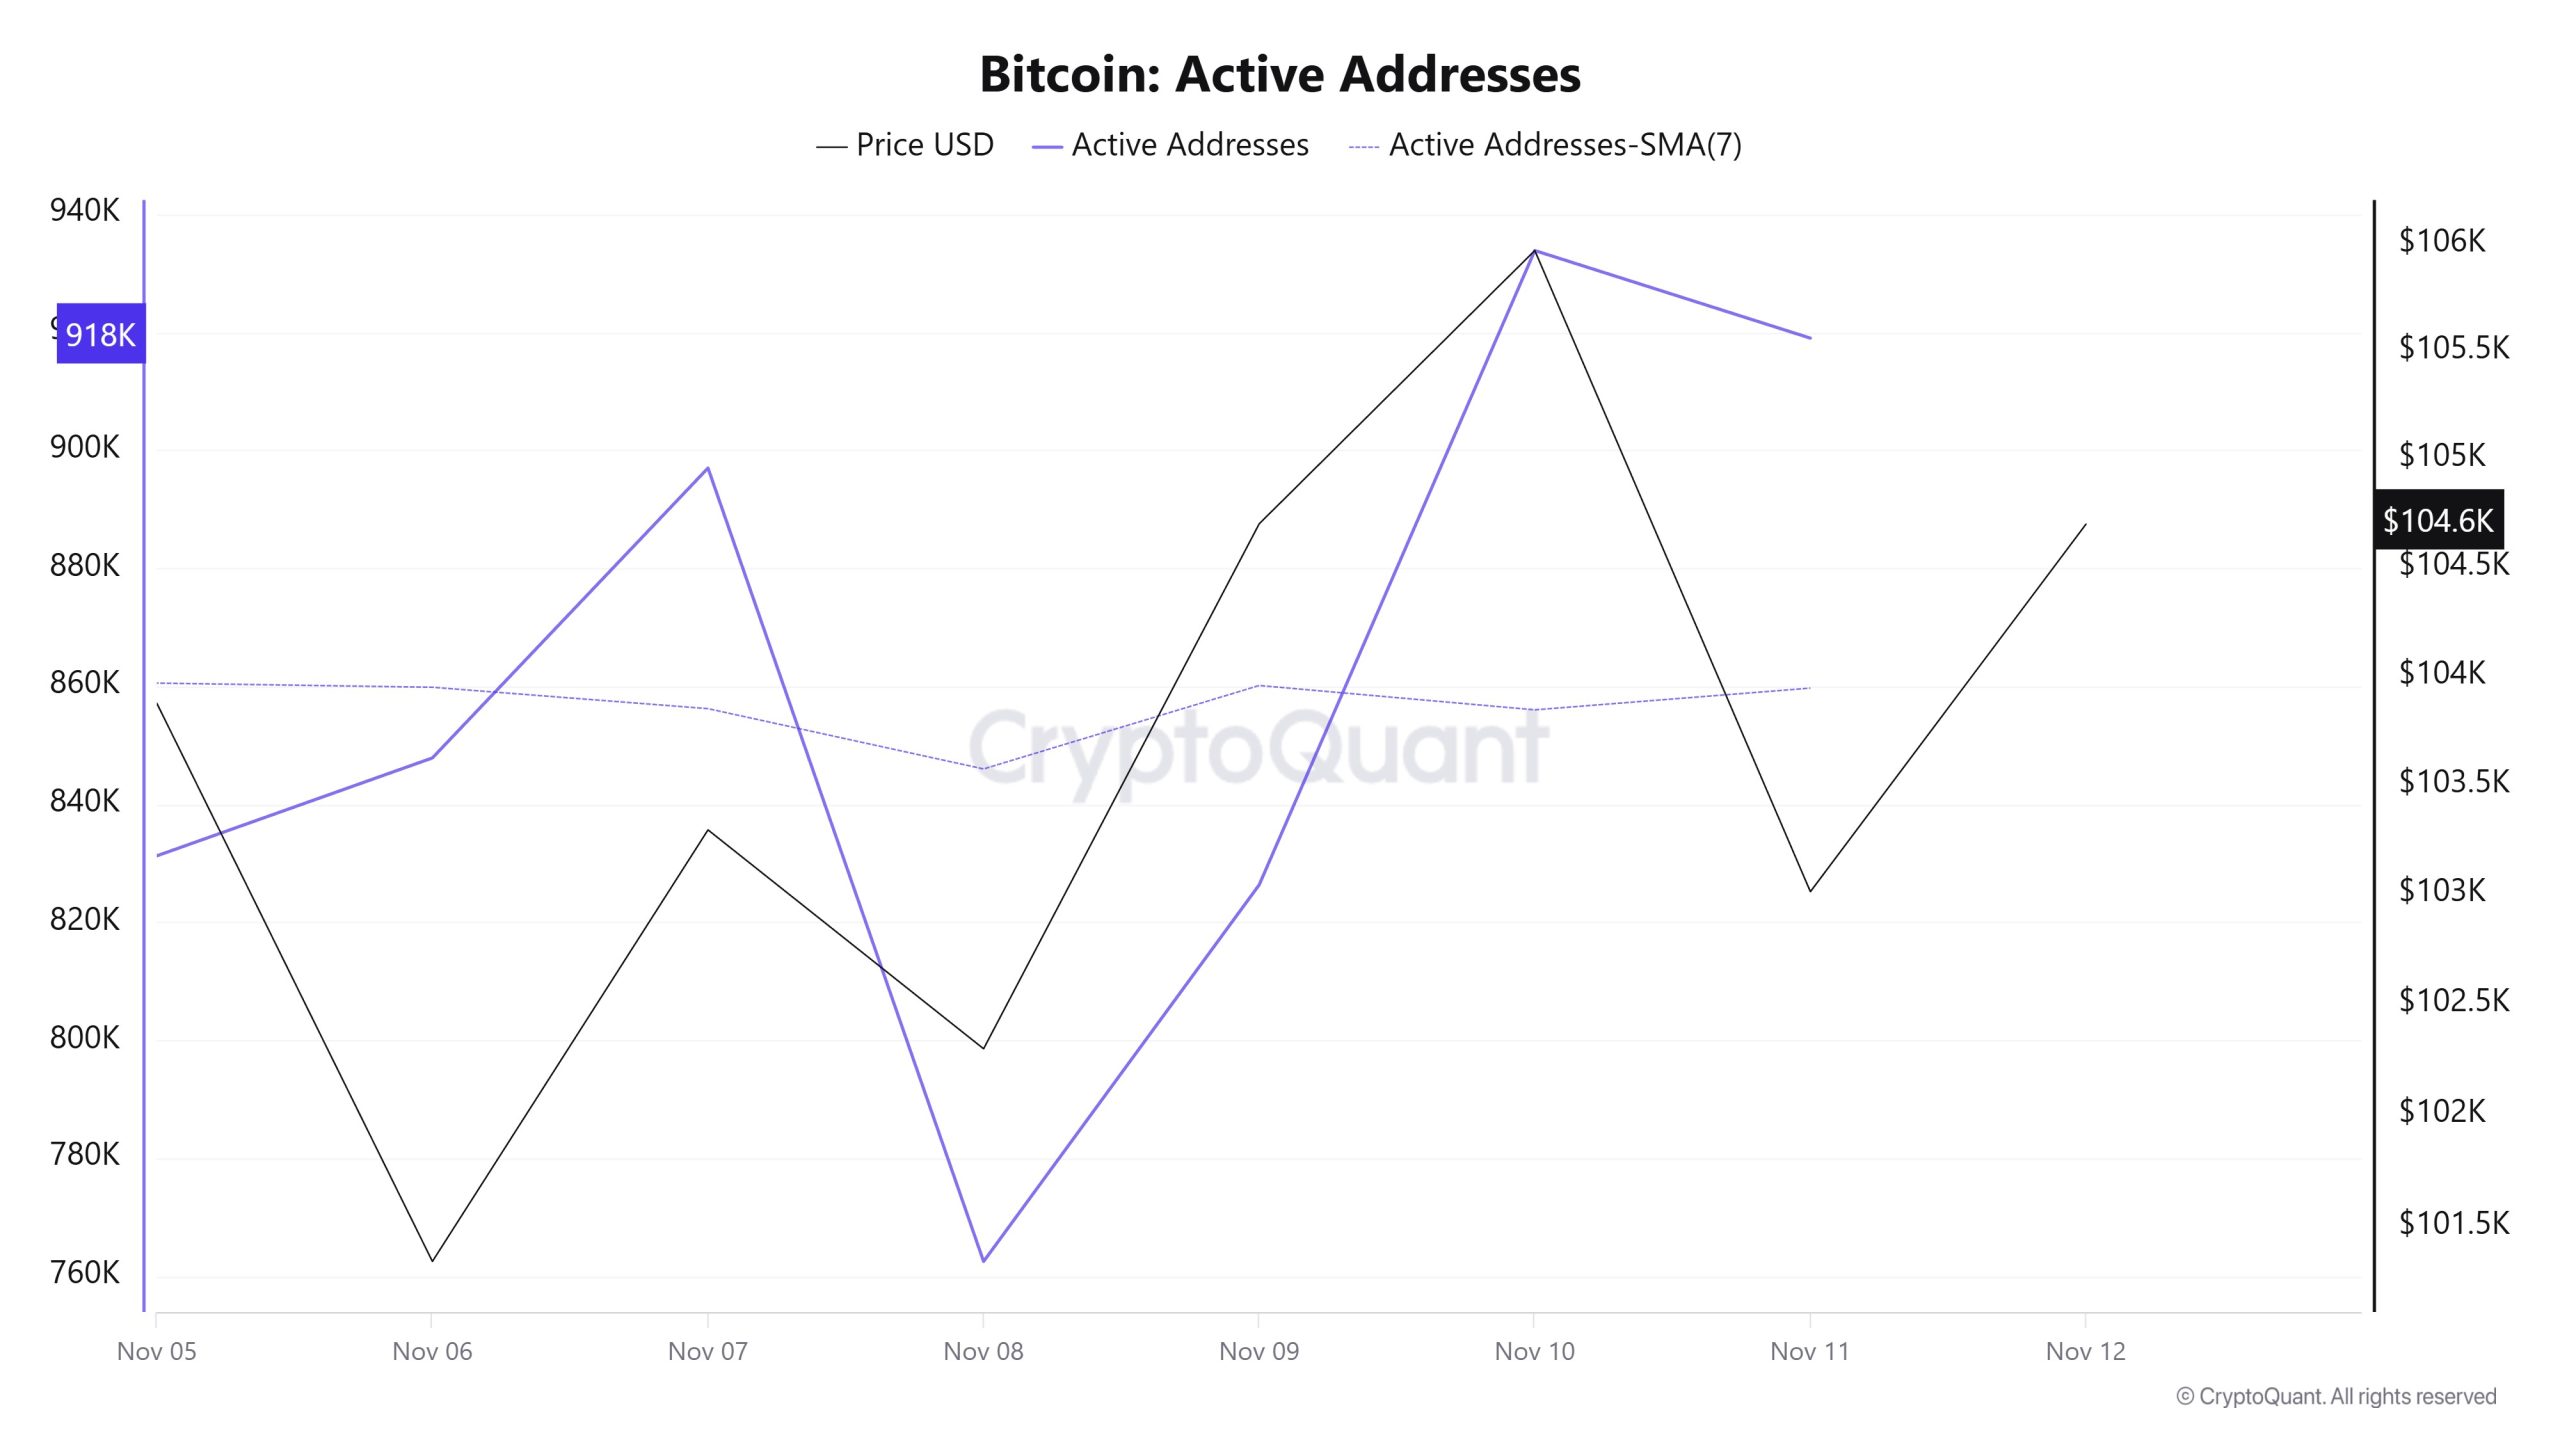
Between November 5 and November 12, 933,812 active addresses were added to the Bitcoin network. During this period, the Bitcoin price fell to $101,000. From a technical perspective, the 7-day simple moving average (SMA) shows horizontal movement.
Active Sending Addresses
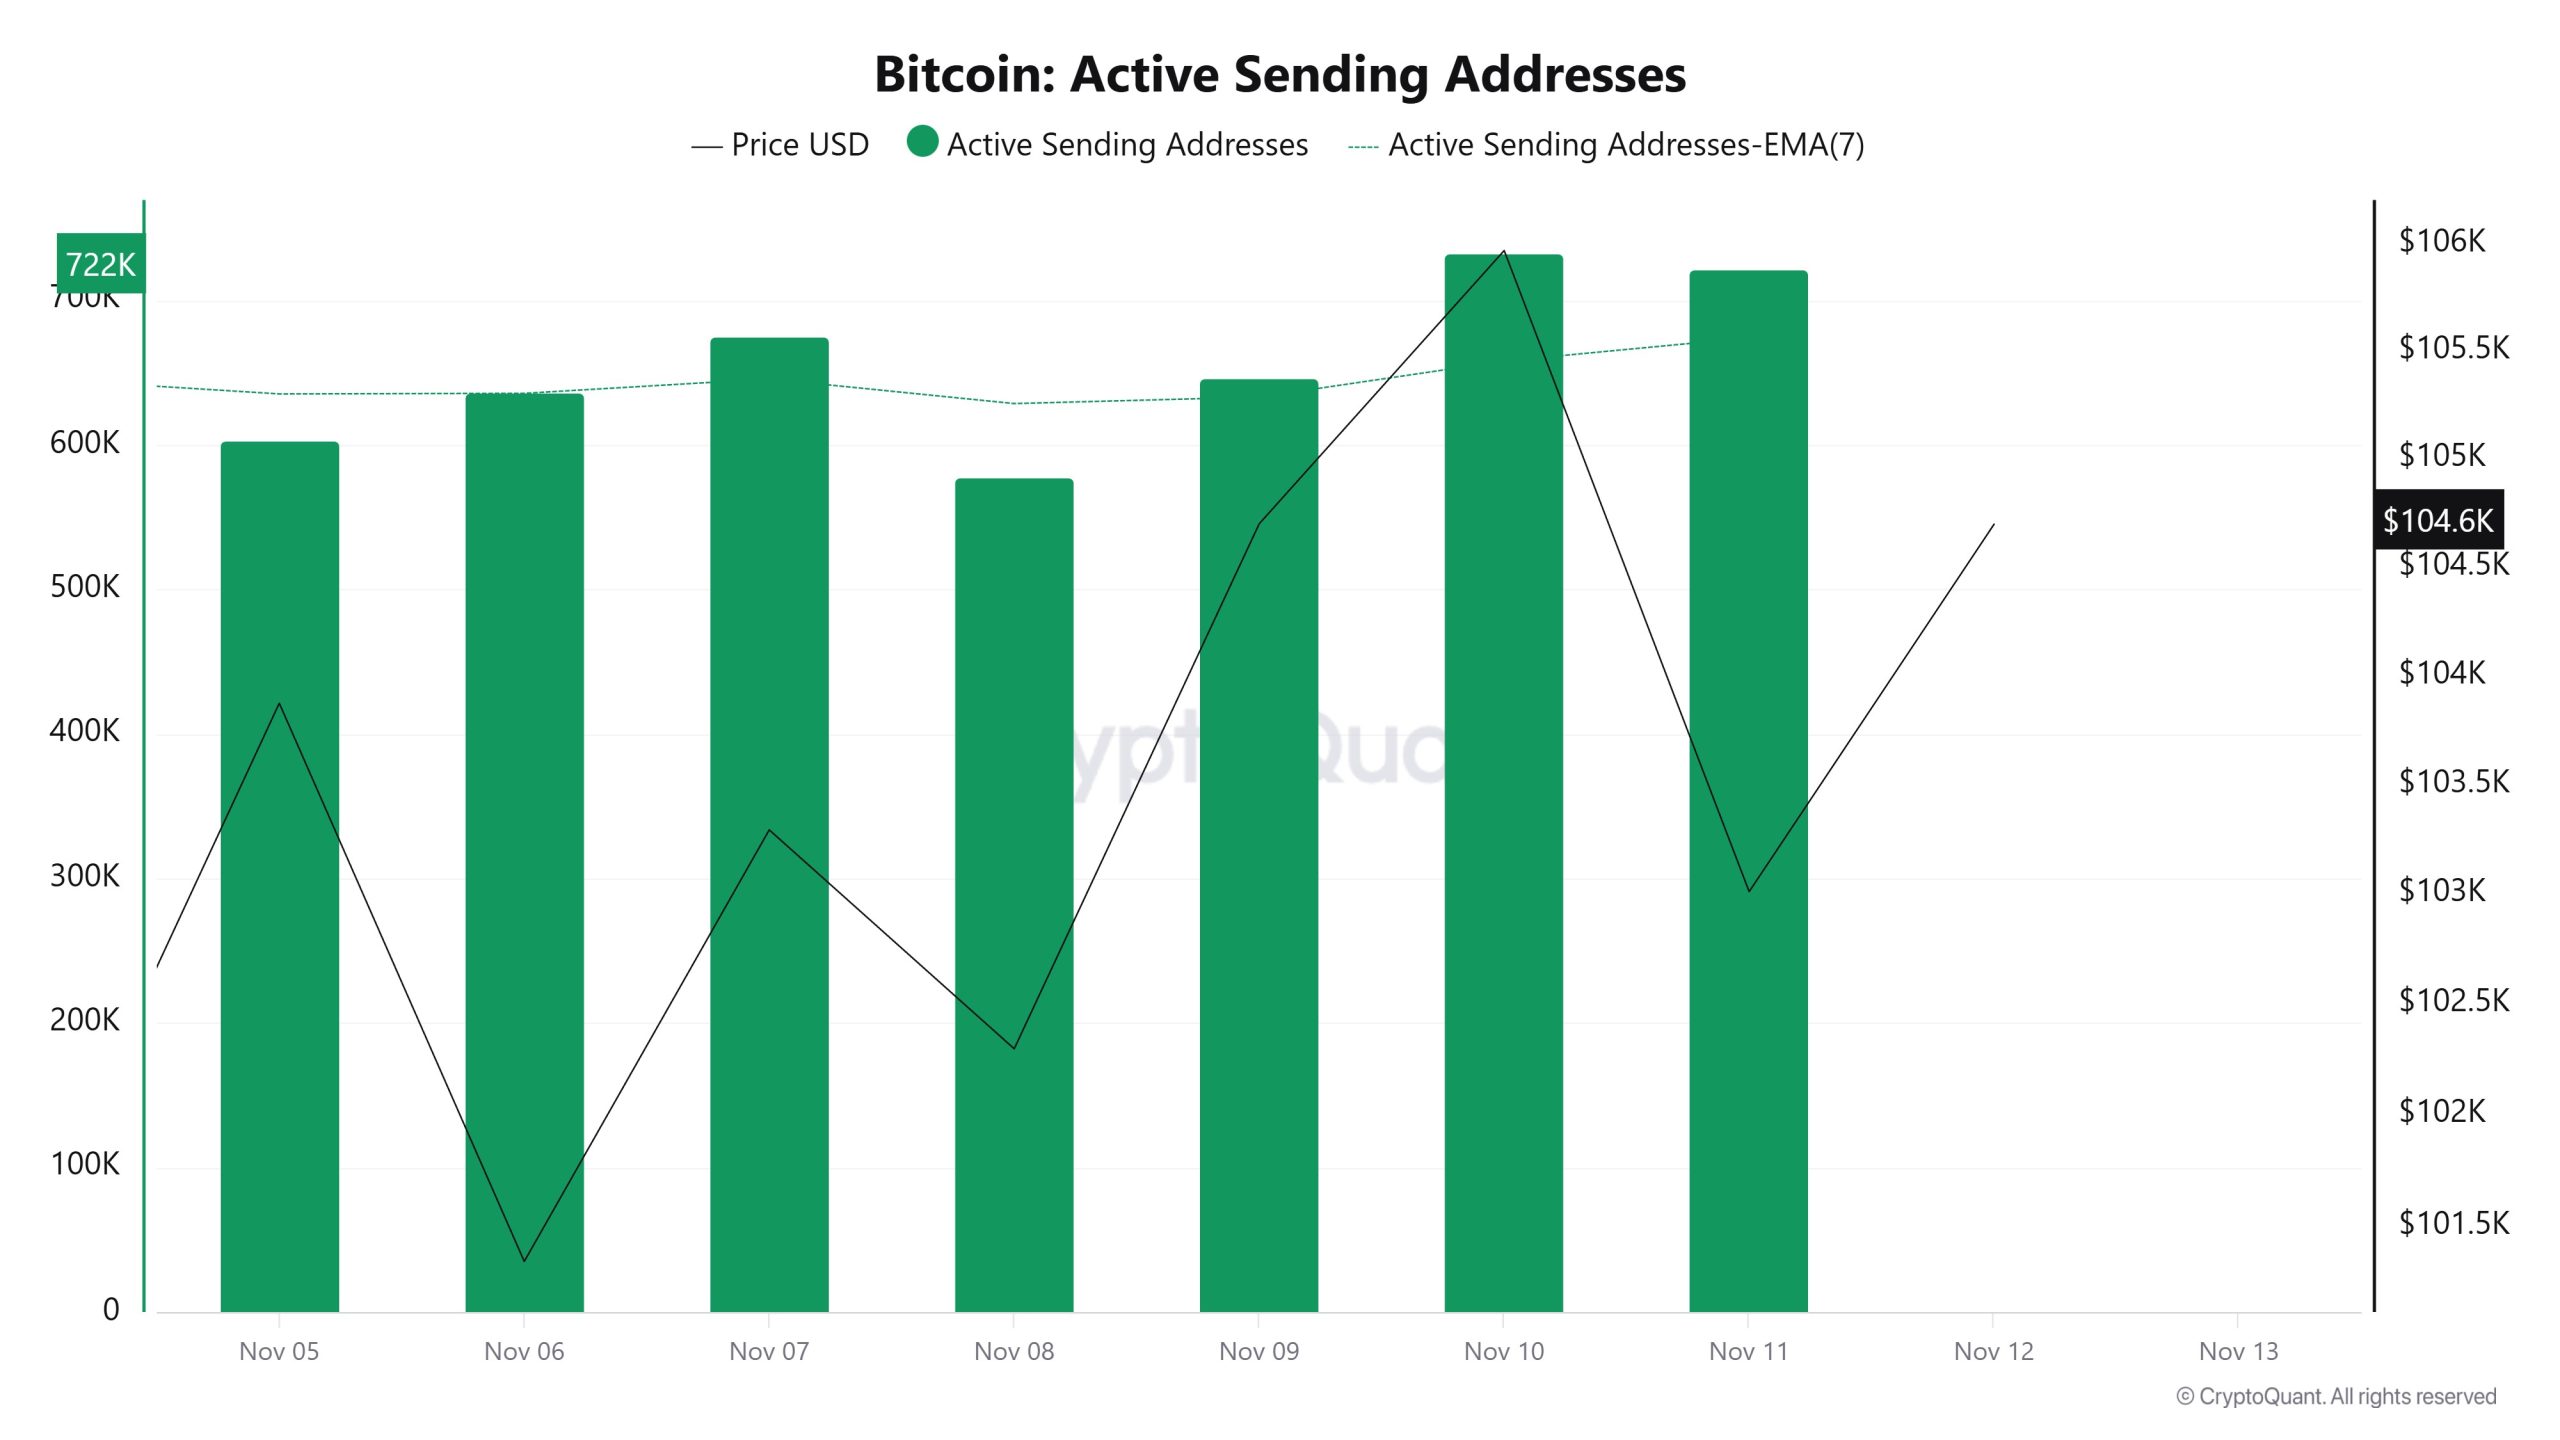
Between November 5 and November 12, an upward trend was observed in the “active sending addresses” metric. On the day the price reached its highest level, this metric stood at 732,595, indicating that user activity on the Bitcoin network was moving in parallel with the price. This data shows that the $105,000 level is supported not only by price but also by on-chain address activity, which is sales-based. Overall, the Active Sending Addresses metric followed a high trajectory during this period.
Active Receiving Addresses
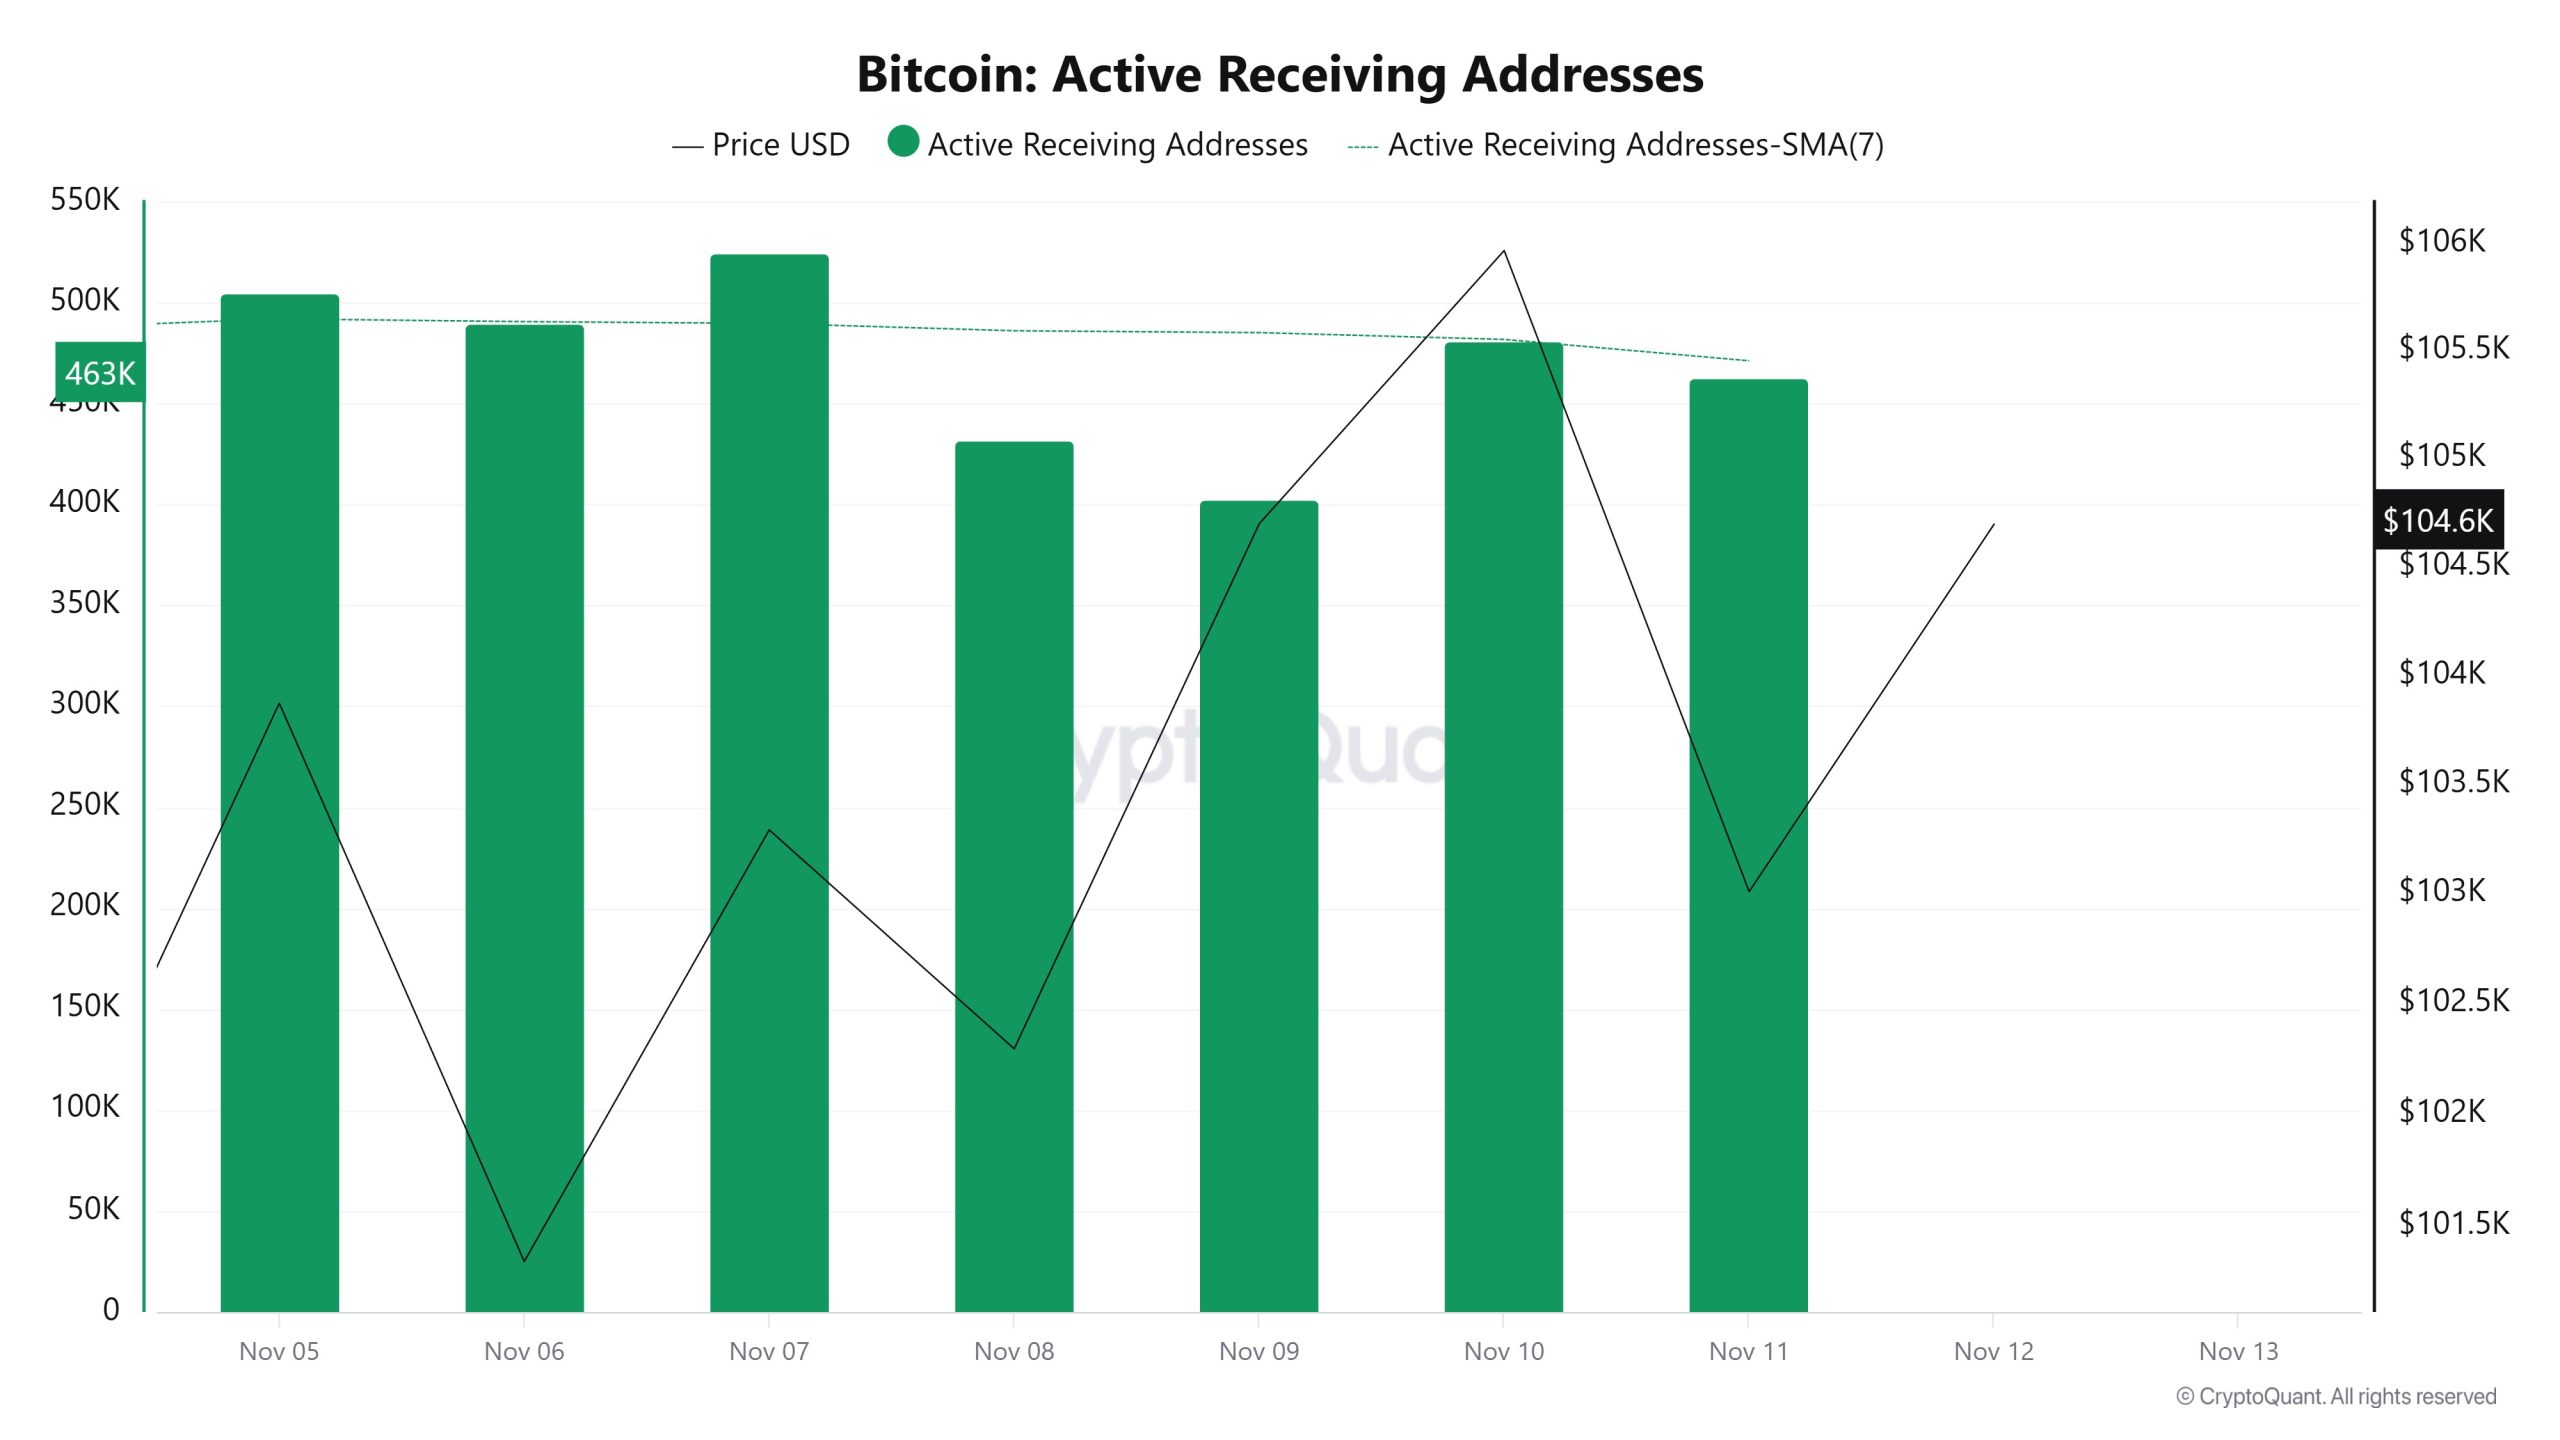
Between November 5 and November 12, active receiving addresses experienced a typical increase alongside the Black Line (price line). On the day the price reached its peak, active receiving addresses rose to 524,608 levels, indicating that buyers acquired Bitcoin at around the $103,000 level.
Breakdowns
MVRV

On November 5, while the Bitcoin price was trading at $103,870, the MVRV Ratio stood at 1.855.
As of November 11, the Bitcoin price fell to $103,008, while the MVRV Ratio declined to 1.832, recording a 1.24% drop.
Realized Price

On November 5, Bitcoin was trading at $103,870, while the MVRV Ratio stood at 1.855.
As of November 11, the Bitcoin price fell to $103,008, while the MVRV Ratio declined to 1.832, recording a 1.24% drop.
Spent Output Profit Ratio (SOPR)
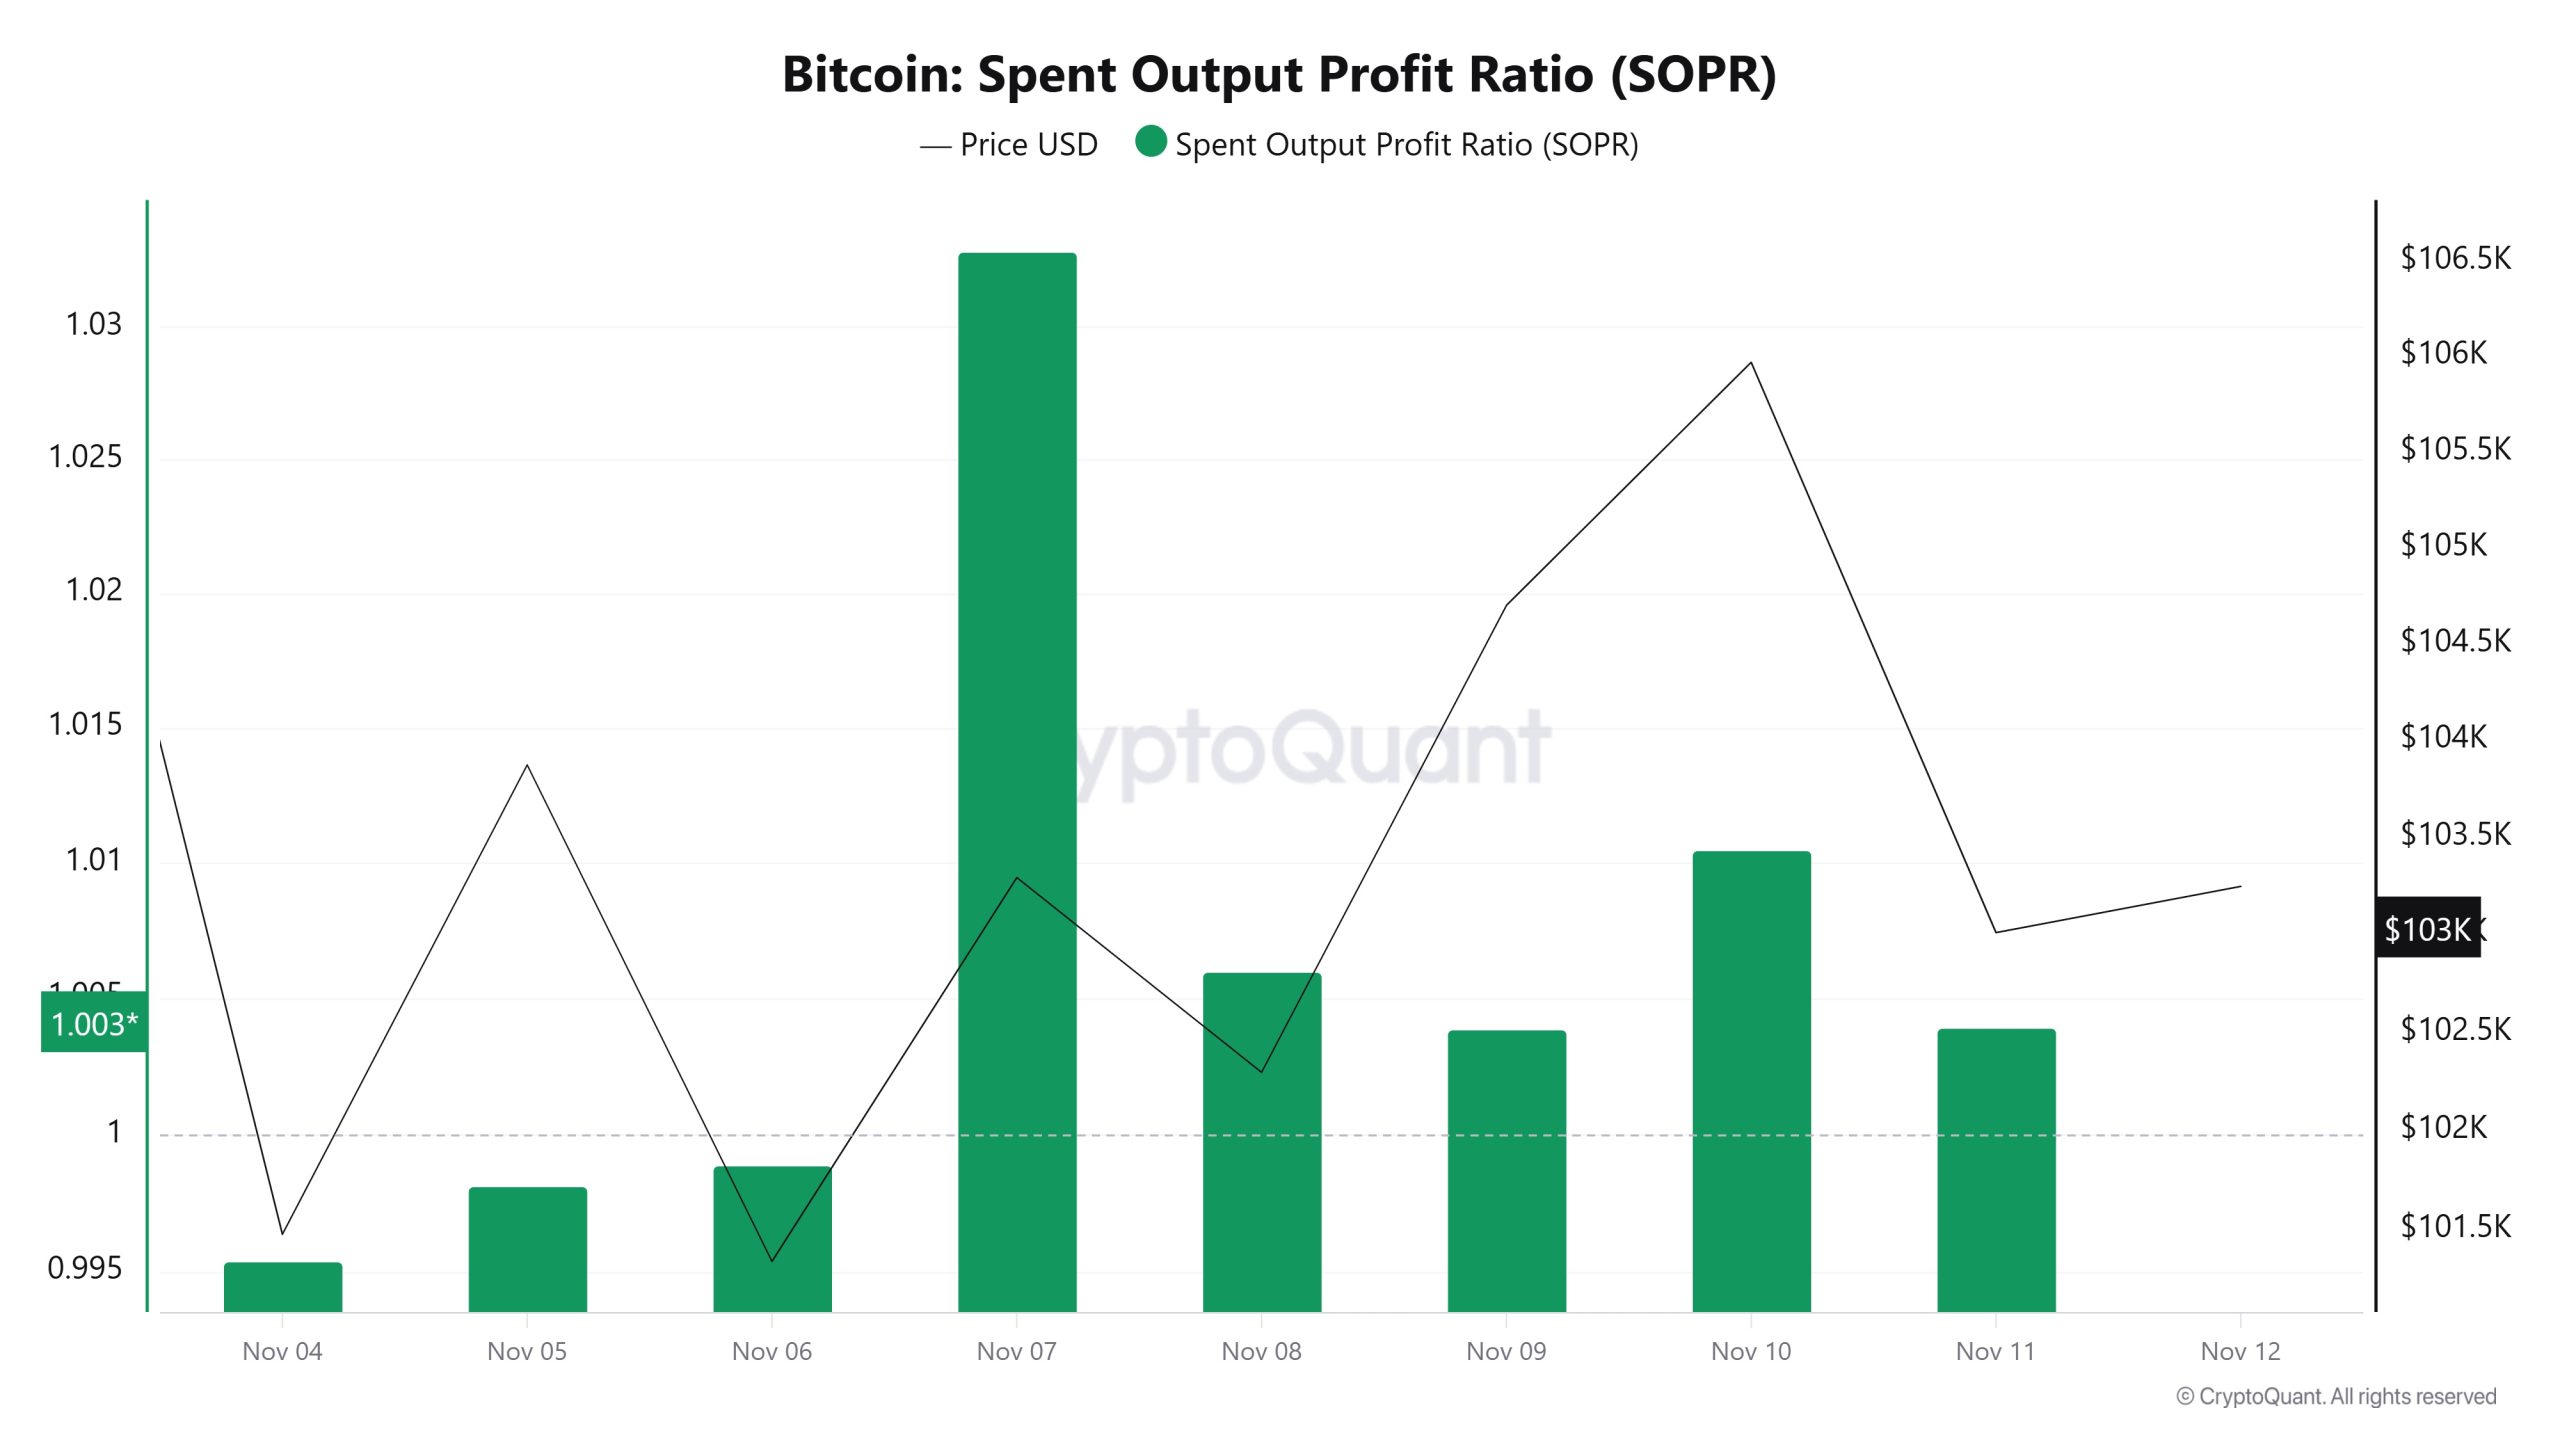
On November 5, Bitcoin was trading at $103,870, while the SOPR metric stood at 0.998.
As of November 11, while the Bitcoin price fell to $103,008, the SOPR metric rose to 1.003, recording a 0.50% increase.
Derivatives
Open Interest
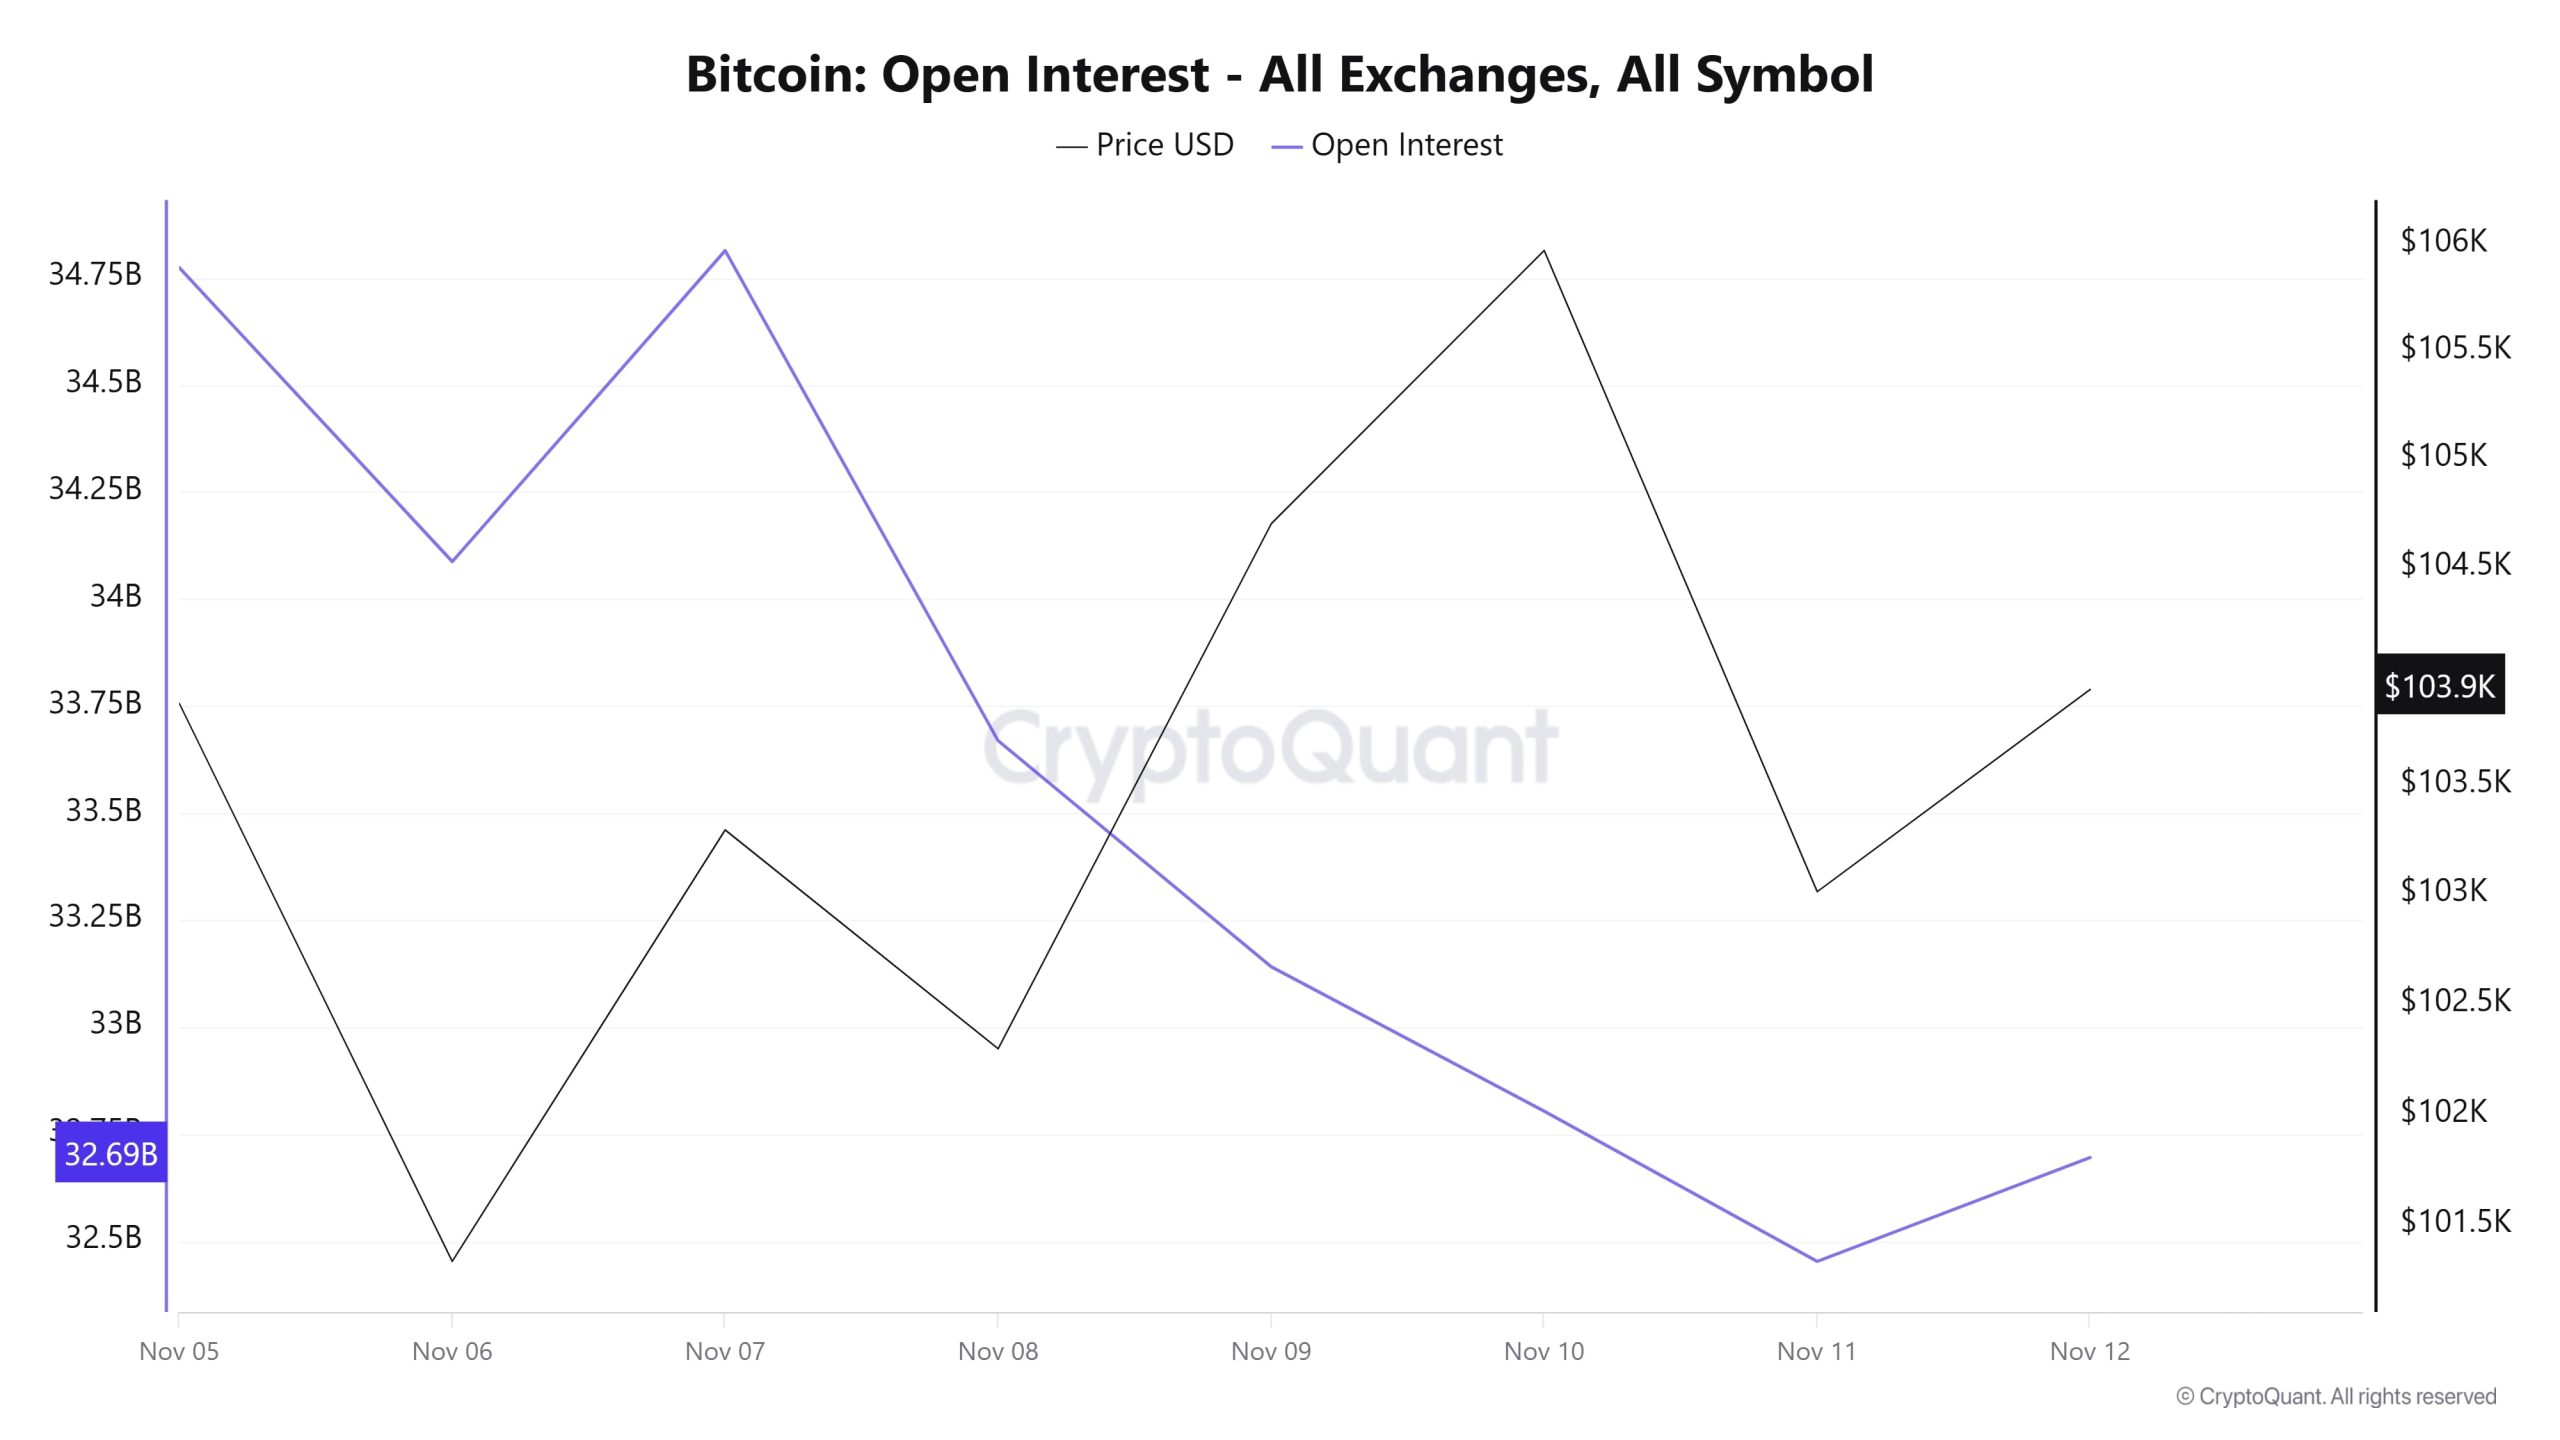
In the first days of the week, open interest stood at approximately $34.7 billion, but then fluctuated over the following days, gradually falling to $32.7 billion. This decline suggests that positions in the futures markets are being closed or that investors are avoiding risk.
On the price front, significant fluctuations are noteworthy. Although there was a sharp decline on November 6, the price rebounded between November 9 and 10, only to retreat again. As of November 12, the price has stabilized around $104,000. Overall, the chart indicates that the market is searching for direction, that interest in futures trading has declined despite price movements, and that a cautious investment atmosphere prevails.
Funding Rate
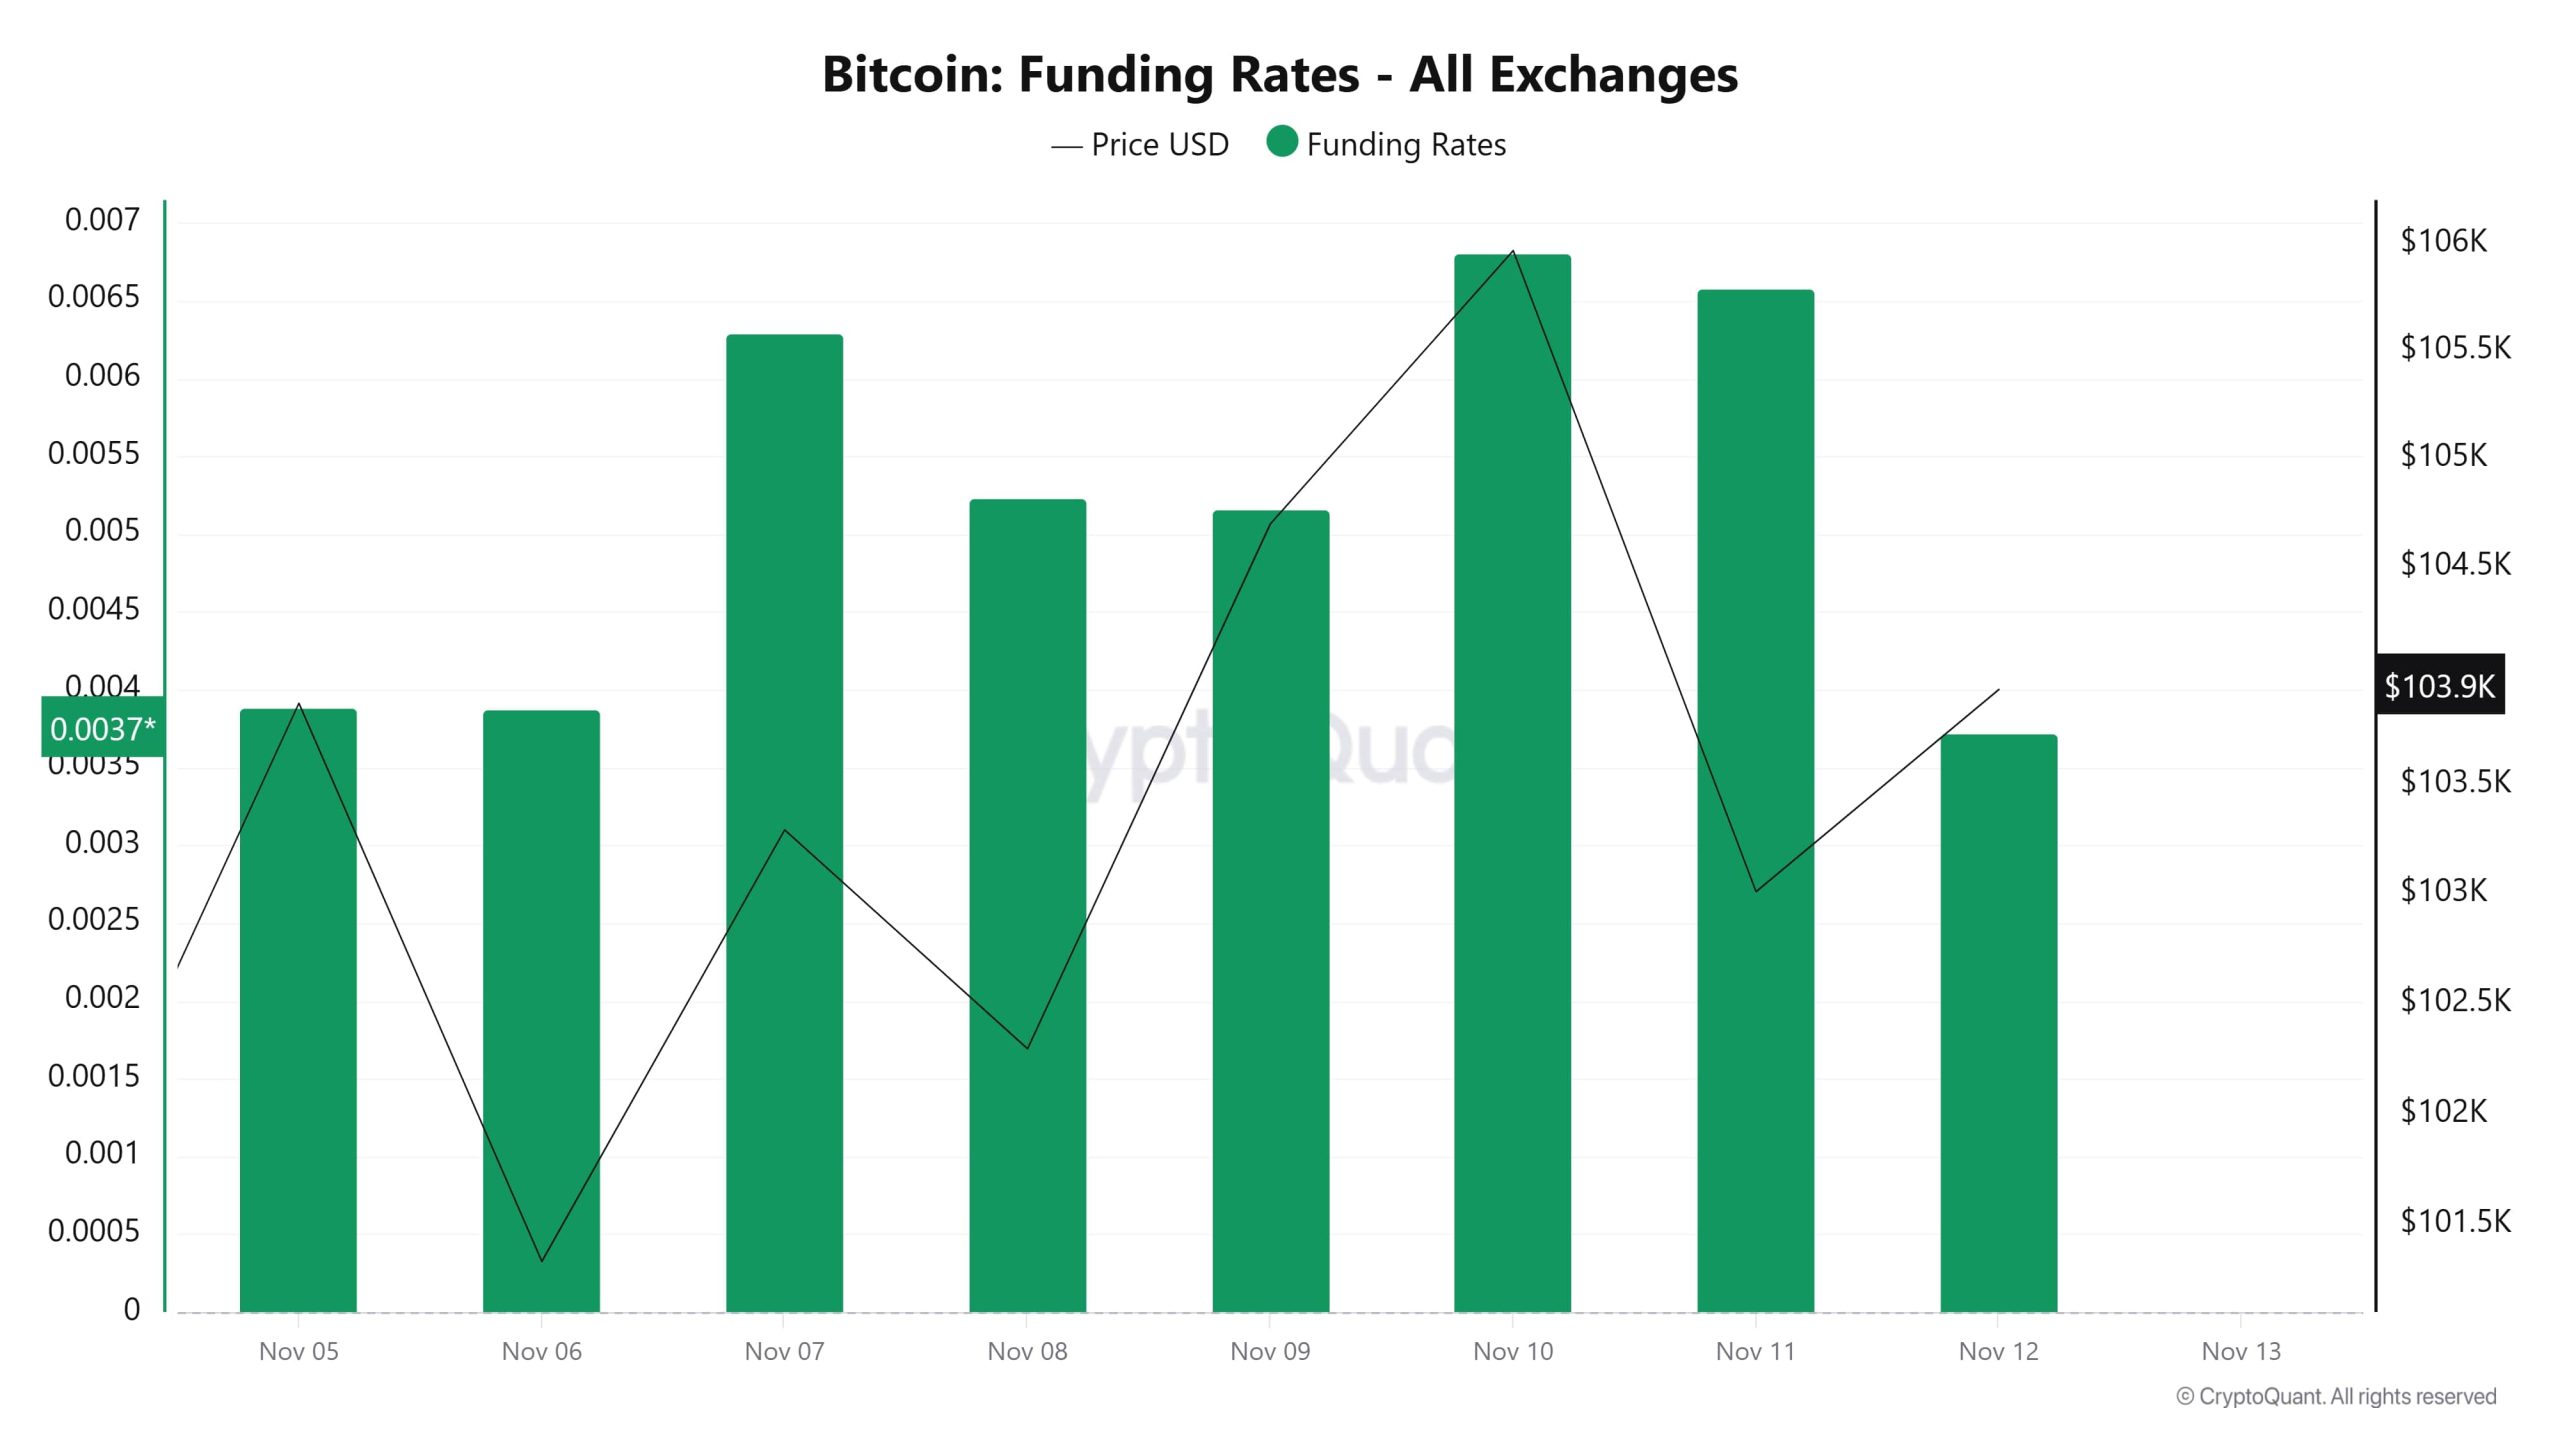
Funding rates remained flat at around 0.003–0.004% during the first days of the week, but gradually increased starting November 7, reaching 0.007% on November 10. The price increase during this period indicates that long positions became dominant in the market.
After November 10, both the price and the funding rate entered a slight downward trend. On November 12, the funding rate stabilized around 0.0037%, while the price appeared to have settled at the $104,000 level. Overall, the chart shows that the market experienced a short-term wave of optimism, but investors began to take a more cautious stance after the high rates.
Long & Short Liquidations
Following the BTC price’s decline from $104,500 to $99,000 and subsequent rise to $107,400 last week, the market saw $647 million in long and $756 million in short positions liquidated.
| Date | Long Volume (Million $) | Short Volume (Million $) |
|---|---|---|
| November 5 | 29.54 | 55.32 |
| November 6 | 56.87 | 20.72 |
| November 7 | 48.40 | 50.66 |
| November 8 | 23.10 | 482.03 |
| November 9 | 10.85 | 65.94 |
| November 10 | 123.39 | 46.91 |
| November 11 | 355.04 | 34.74 |
| Total | 647.19 | 756.32 |
Supply Distribution
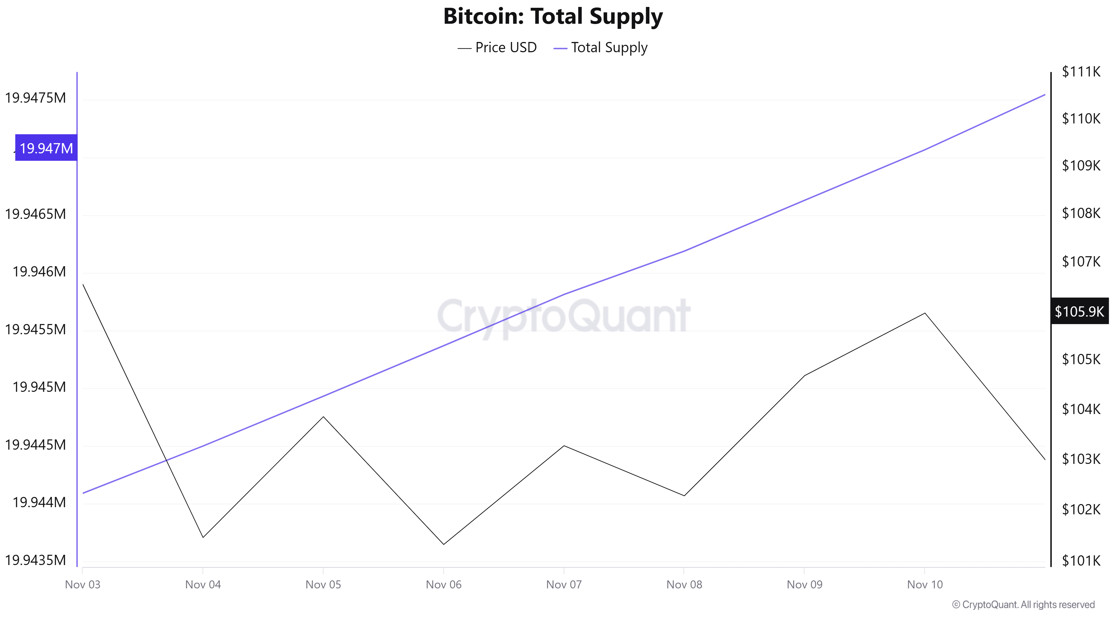
Total Supply: Reached 19,947,064 units, an increase of approximately 0.0149% compared to last week.
New Supply: The amount of BTC produced this week was 2,975.
Velocity: The velocity, which was 12.28 last week, remained the same as of November 10.
| Wallet Category | November 3, 2025 | November 10, 2025 | Change (%) |
|---|---|---|---|
| < 1 BTC | 8.4476% | 8.4488% | +0.0142 |
| 1 – 10 BTC | 11.3848% | 11.3700% | −0.1301% |
| 10 – 100 BTC | 24.6740% | 24.6430% | −0.1258% |
| 100 – 1k BTC | 30.3240% | 30.1280% | −0.65% |
| 1k – 10k BTC | 17.2279% | 17.2920% | +0.37 |
| 10k+ BTC | 7.9825% | 8.1177% | +1.69 |
According to the latest weekly data, the Bitcoin wallet distribution showed a mixed picture. The share of wallets with a balance of less than 1 BTC rose from 8.4476% to 8.4488%, showing a limited increase of approximately 0.01%. The proportion of wallets in the 1–10 BTC range fell from 11.3848% to 11.3700%, a decrease of approximately 0.13%. The share of wallets in the 10–100 BTC range fell from 24.6740% to 24.6430%, showing a decline of approximately 0.13%. The share of wallets in the 100–1,000 BTC range fell from 30.3240% to 30.1280%, a decrease of approximately 0.65%. The share of wallets in the 1,000–10,000 BTC range ( ) increased from 17.2279% to 17.2920%, showing an increase of approximately 0.37%. Finally, the share of wallets with balances of 10,000 BTC and above increased from 7.9825% to 8.1177%, recording an increase of approximately 1.69%. Overall, while a slight decrease was observed in small and medium-sized investor groups, a gradual accumulation trend was noted in large wallet categories.
Exchange Supply Ratio
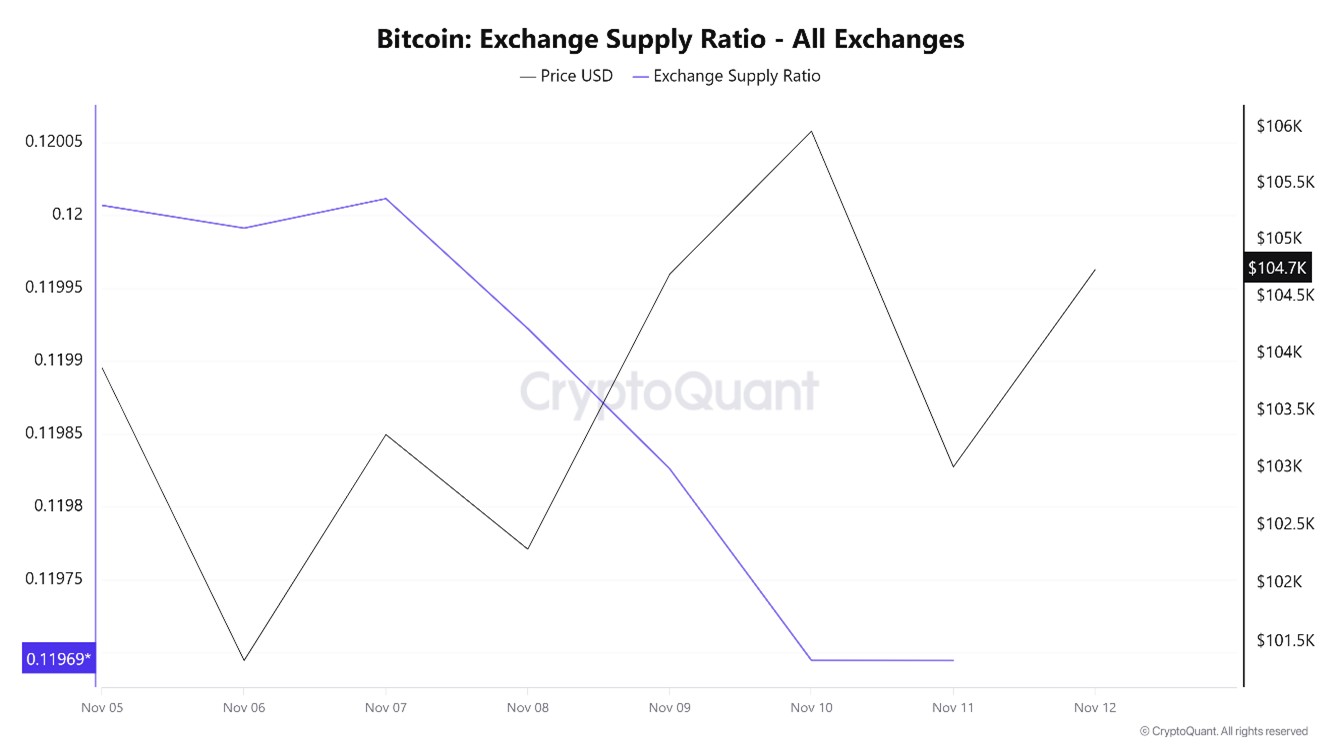
According to data obtained from the Bitcoin Exchange Supply Ratio table, which shows how much of the total supply of Bitcoins is held on exchanges, low rates were observed this week. The general trend reveals a dominant negative correlation between the Bitcoin price and the supply rate entering exchanges. This indicates that most Bitcoins are beginning to be withdrawn from wallets and that the market is not ready to buy.
Between November 5 and November 12, the Bitcoin Exchange Supply Ratio decreased from 0.12000661 to 0.11969446. During this period, the Bitcoin price rose from $101,000 to $103,000. In particular, the fact that these two variables moved in different directions this week indicates that, despite the price decline, there has been a decrease in the amount of Bitcoin supplied to exchanges and that long-term investors have likely begun to reduce their holdings. It appears that a general decline in the Bitcoin price may prevail.
Exchange Reserve
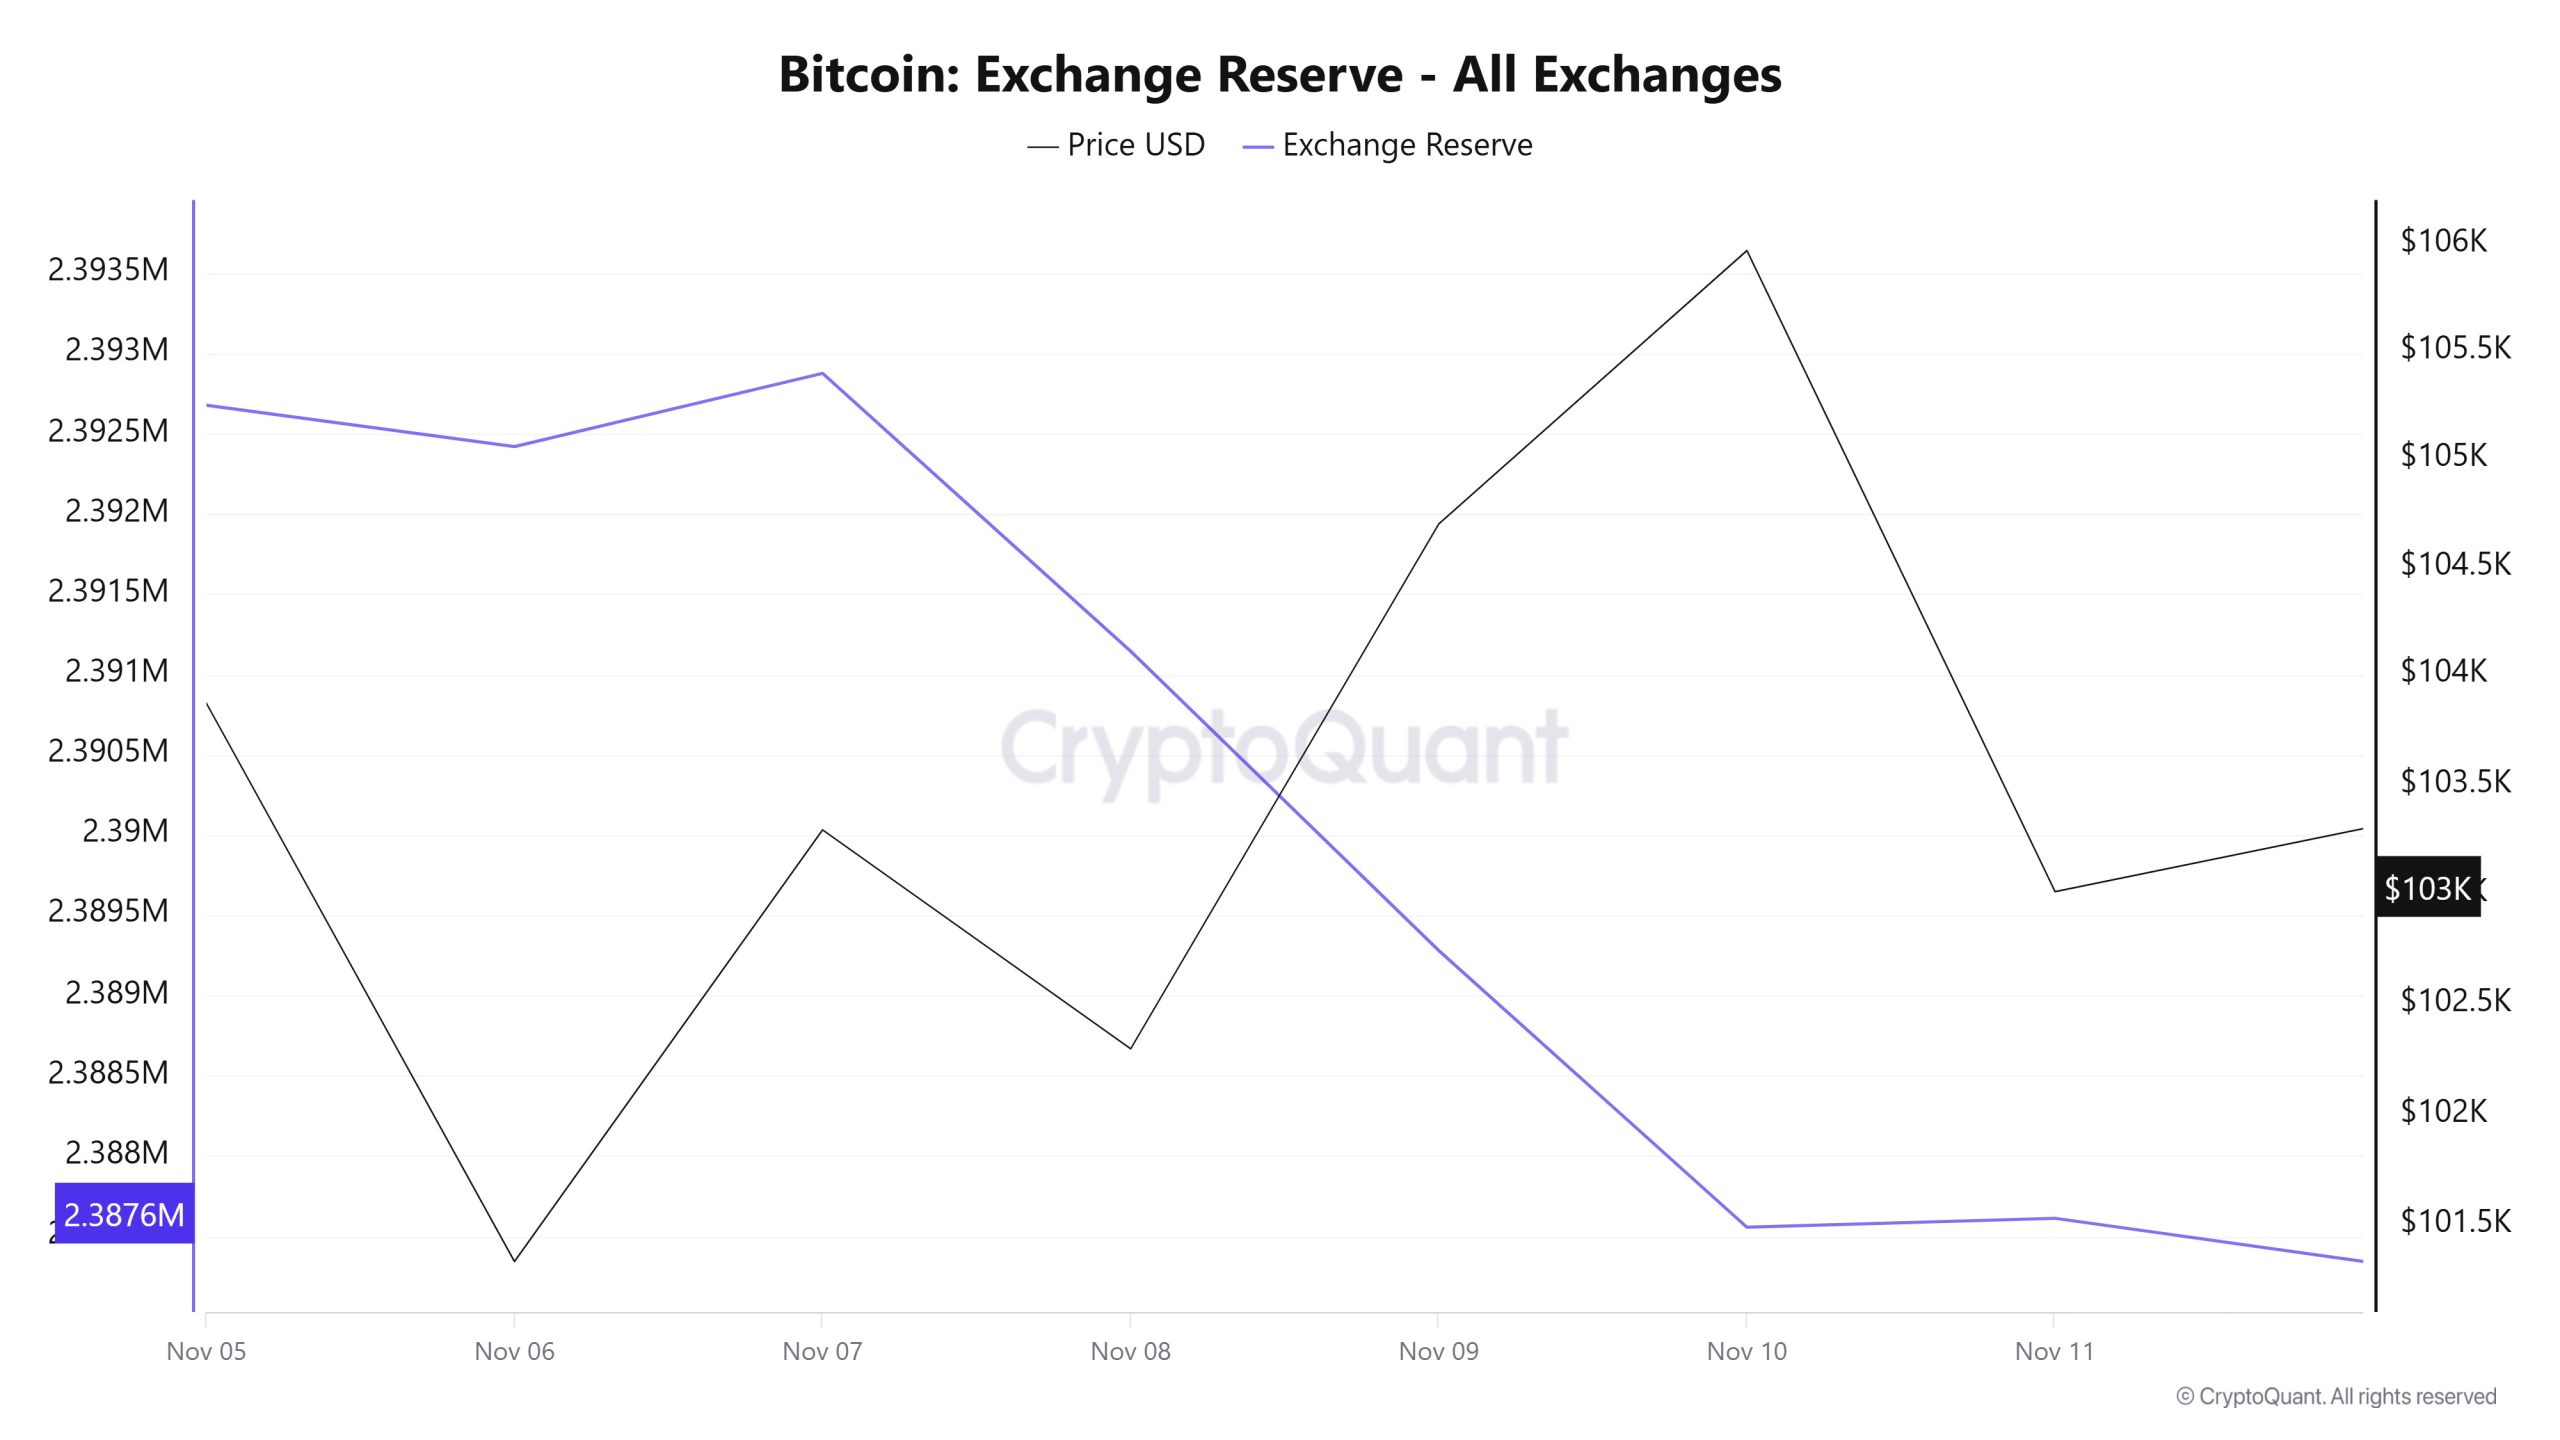
Between November 5 and 11, 2025, Bitcoin reserves on exchanges fell from 2,393,642 BTC to 2,387,610 BTC. There was a net outflow of 6,032 BTC, and reserves decreased by approximately 0.25%. During this period, the BTC price rose from $101,474 to $103,009, gaining approximately 1.5% in value. The decline in reserves during this period of slight price increase showed that investors preferred to protect their assets. This situation indicated that confidence had not been completely lost and that expectations for a recovery in the medium term remained. A price increase may occur in the short term, albeit weak, but low trading volumes may be insufficient to support a strong rise.
| Date | Exchange Inflow | Exchange Outflow | Exchange Netflow | Exchange Reserve | BTC Price |
|---|---|---|---|---|---|
| 05-Nov | 39,199 | 40,163 | -964 | 2,392,678 | 101,474 |
| 06-Nov | 37,858 | 38,116 | -258 | 2,392,420 | 101,338 |
| 07-Nov | 31,952 | 31,496 | 456 | 2,392,876 | 103,290 |
| 08-Nov | 9,100 | 10,831 | -1,732 | 2,391,144 | 102,296 |
| 09-Nov | 8,554 | 10,420 | -1,866 | 2,389,278 | 104,698 |
| 10-Nov | 28,898 | 30,622 | -1,724 | 2,387,555 | 105,970 |
| 11-Nov | 24,256 | 24,200 | 56 | 2,387,610 | 103,009 |
Fees and Revenues
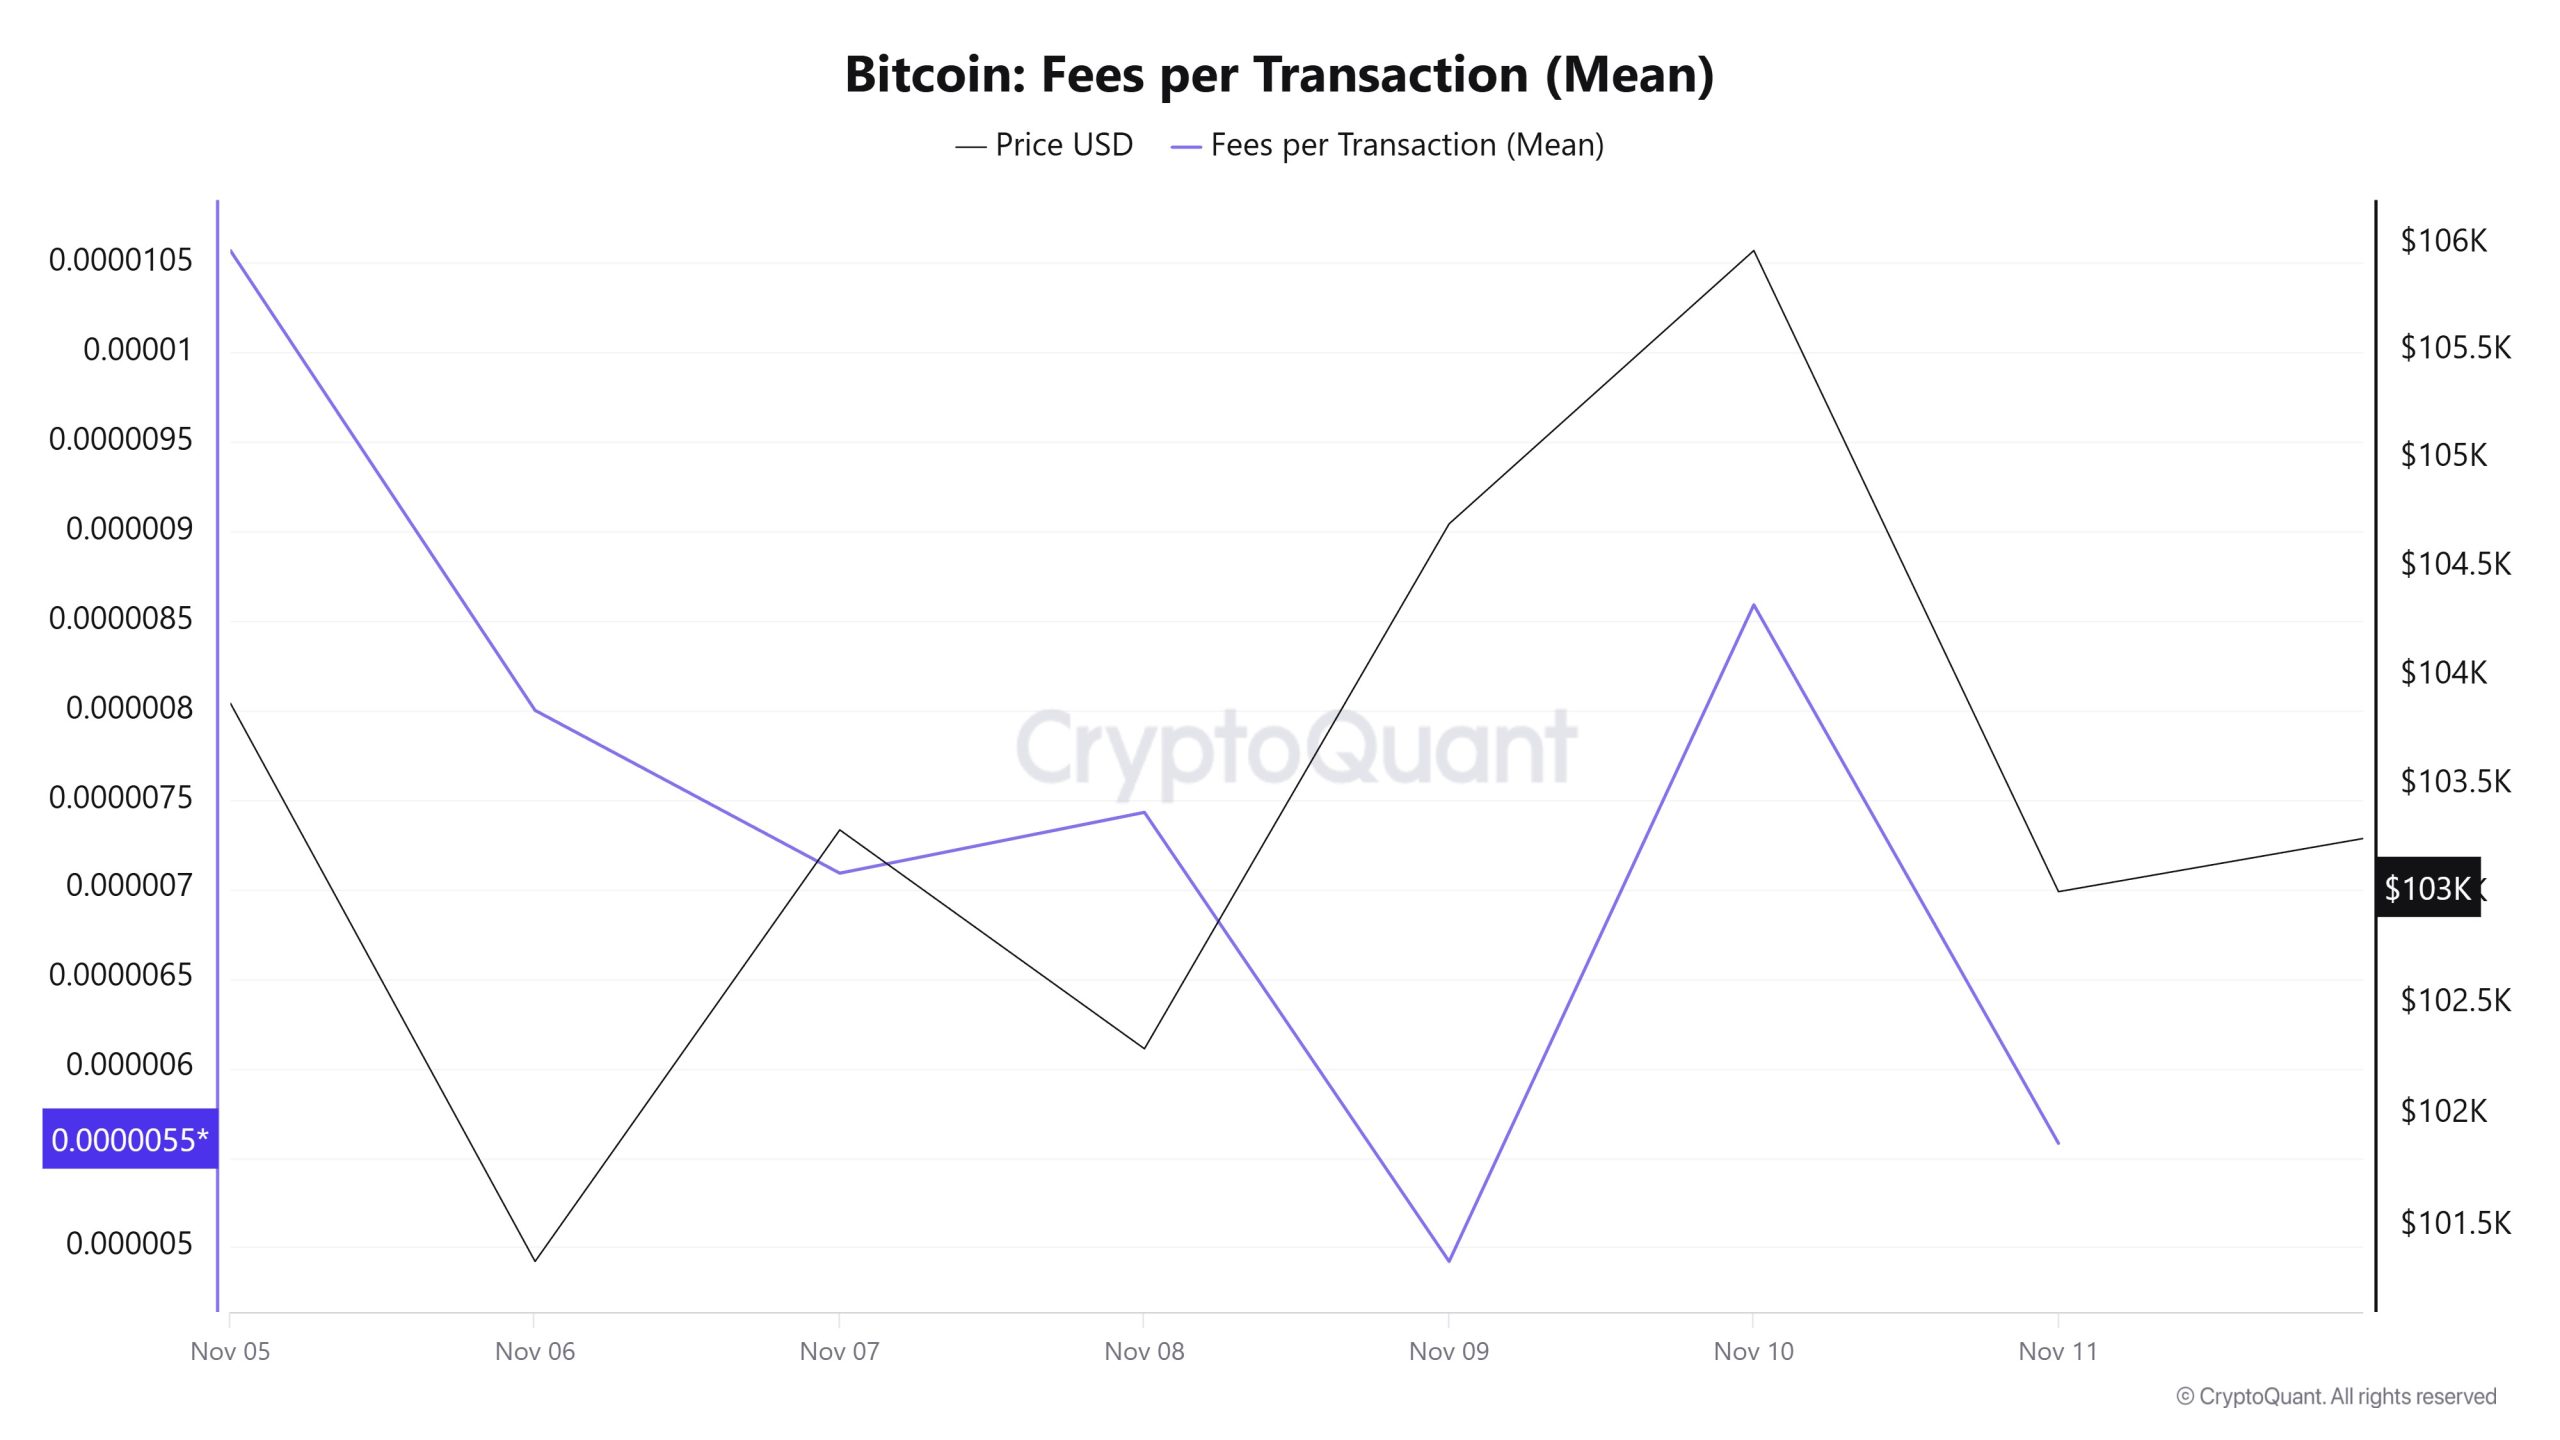
When examining the Bitcoin Fees per Transaction (Mean) data between November 5 and 11, it is seen that on November 5, the first day of the week, the indicator stood at 0.00001057.
A downward trend was observed until November 9, when the indicator recorded its lowest value of the week at 0.00000492.
In this context, as a result of a significant increase in Bitcoin price volatility as of November 10, the indicator regained momentum and followed a positive trend due to the impact of price volatility.
On November 11, the last day of the weekly period, the indicator closed the week at 0.00000558.
Bitcoin: Fees (Total)
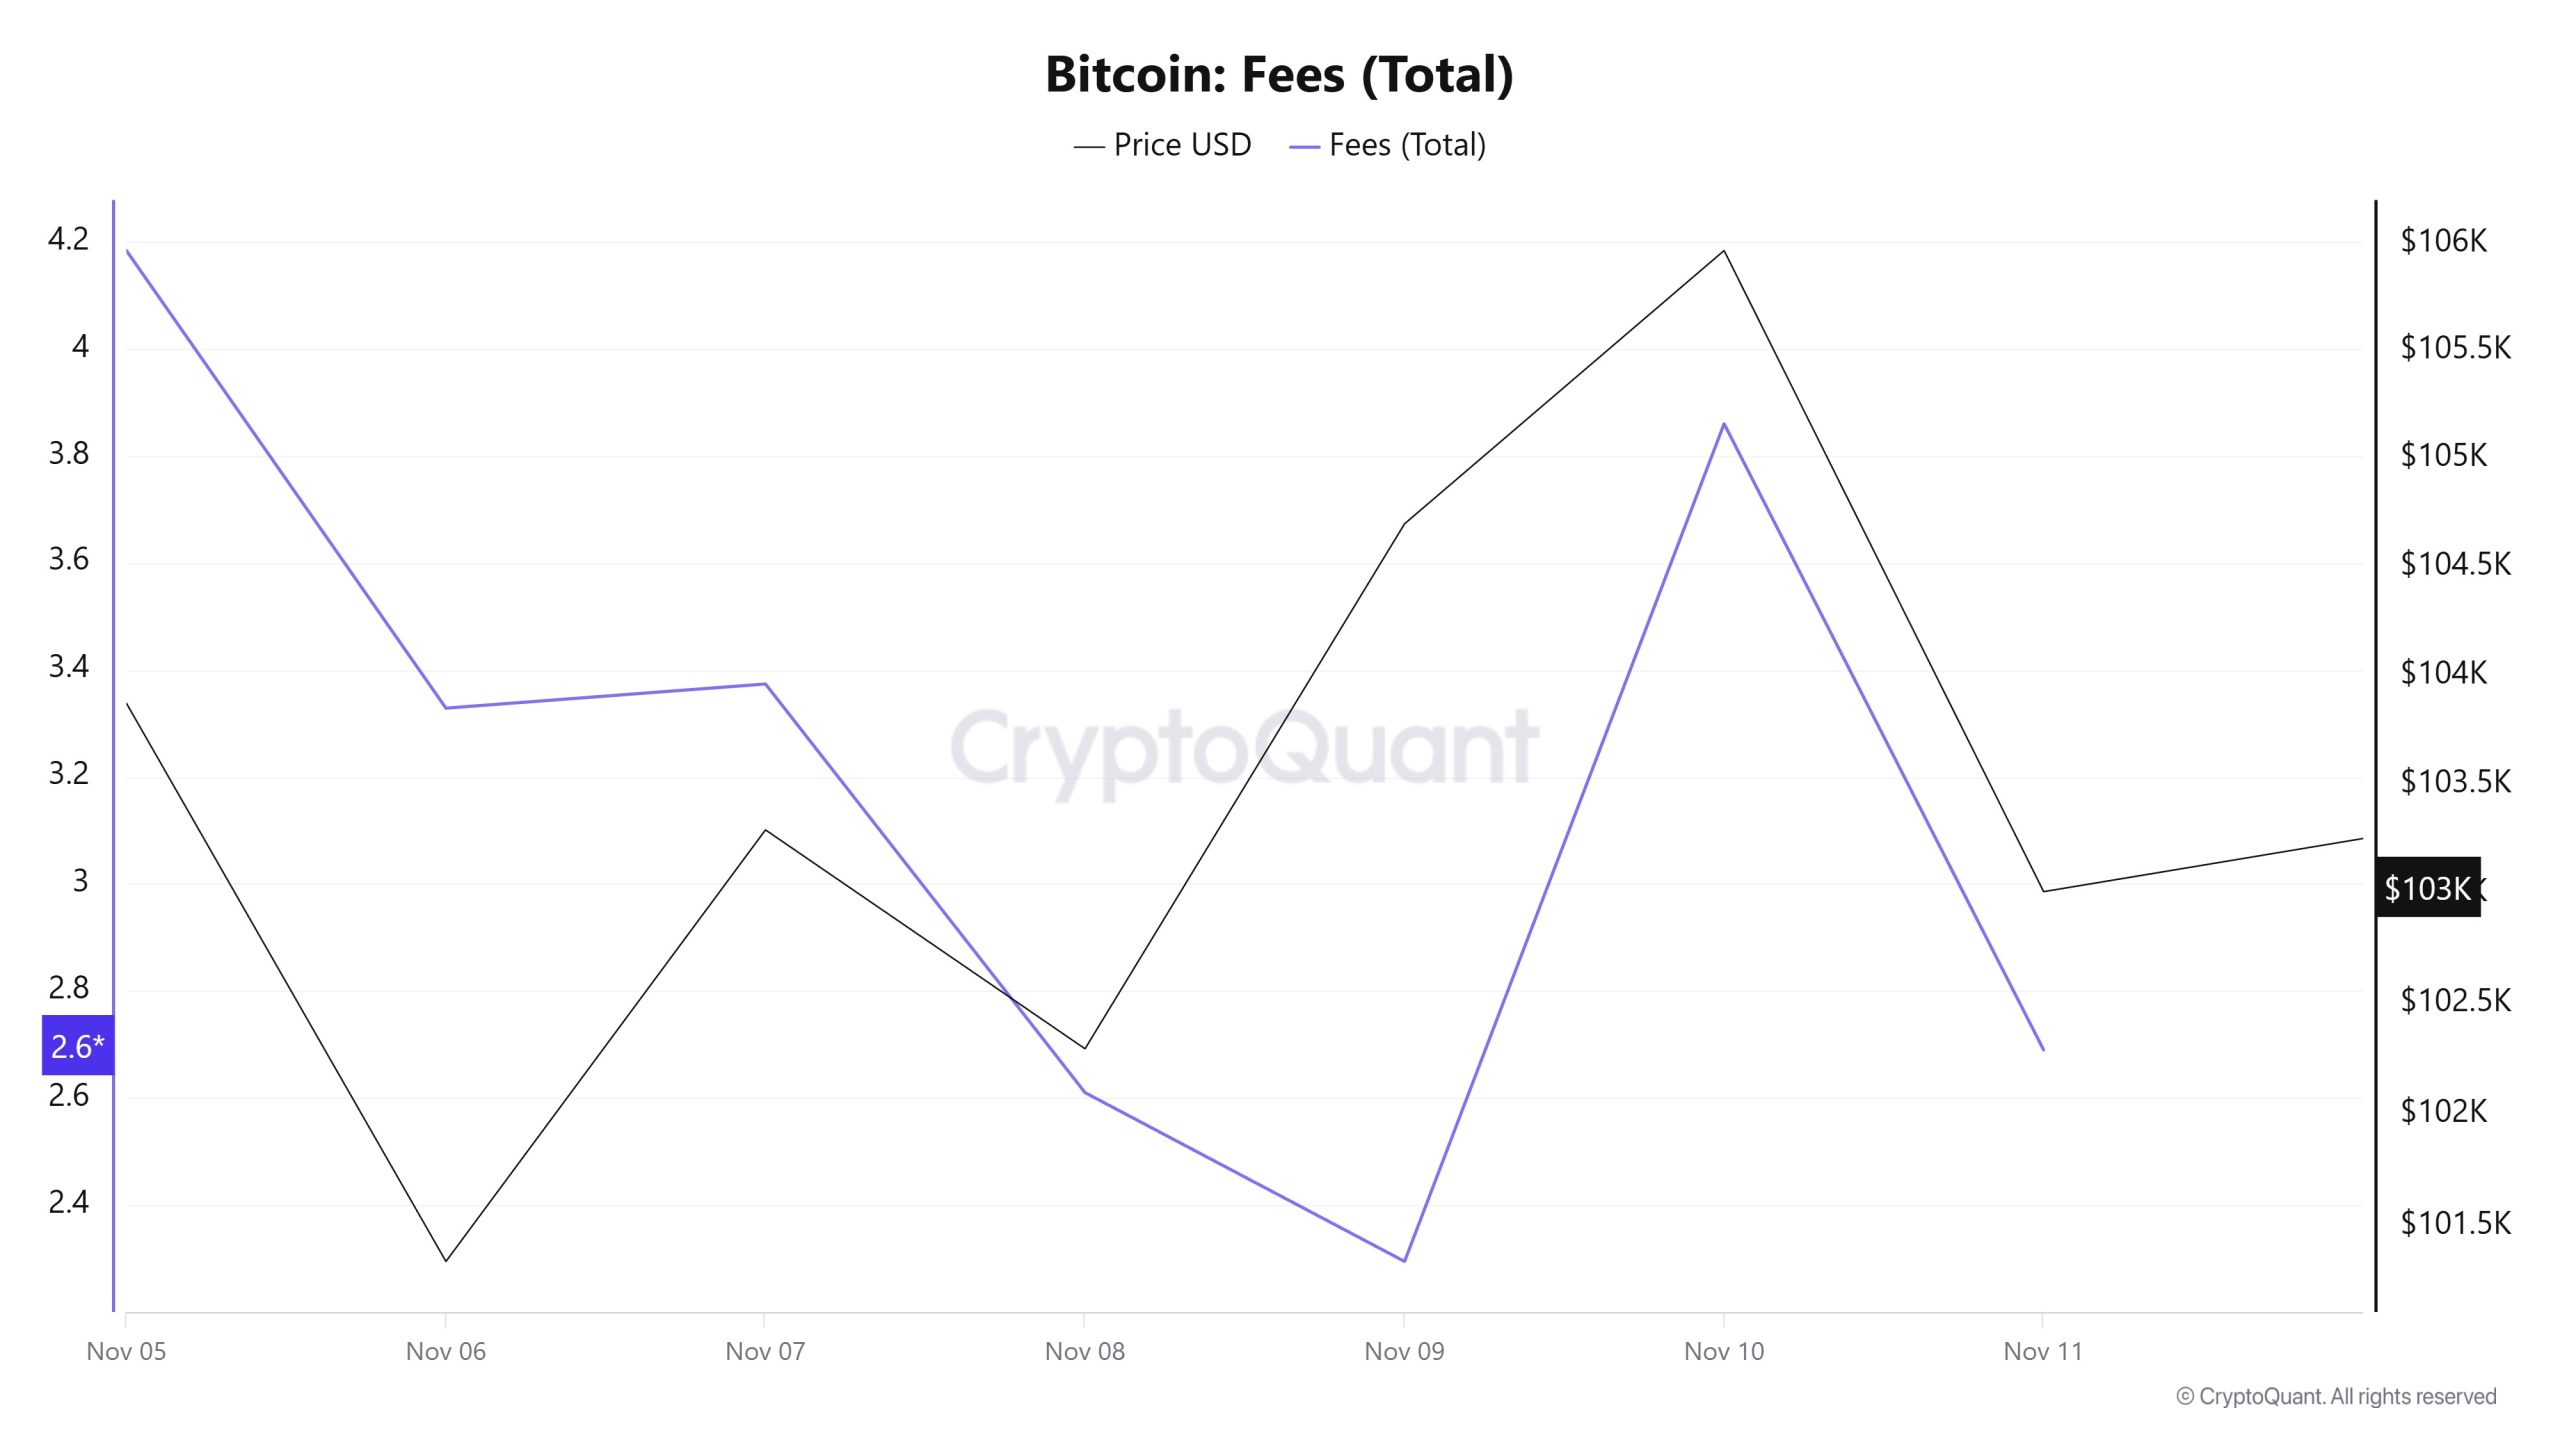
Similarly, when examining the Bitcoin Fees (Total) data between November 5 and 11, it can be seen that the indicator stood at 4.18353984 on November 5, the first day of the week.
A downward trend was observed until November 9, when the indicator recorded its lowest value of the week at 2.29472505.
In this context, as a result of a significant increase in Bitcoin price volatility as of November 10, the indicator regained momentum and followed a positive trend due to the impact of price volatility.
On November 11, the last day of the weekly period, the indicator closed the week at 2.68989415.
Miner Flows
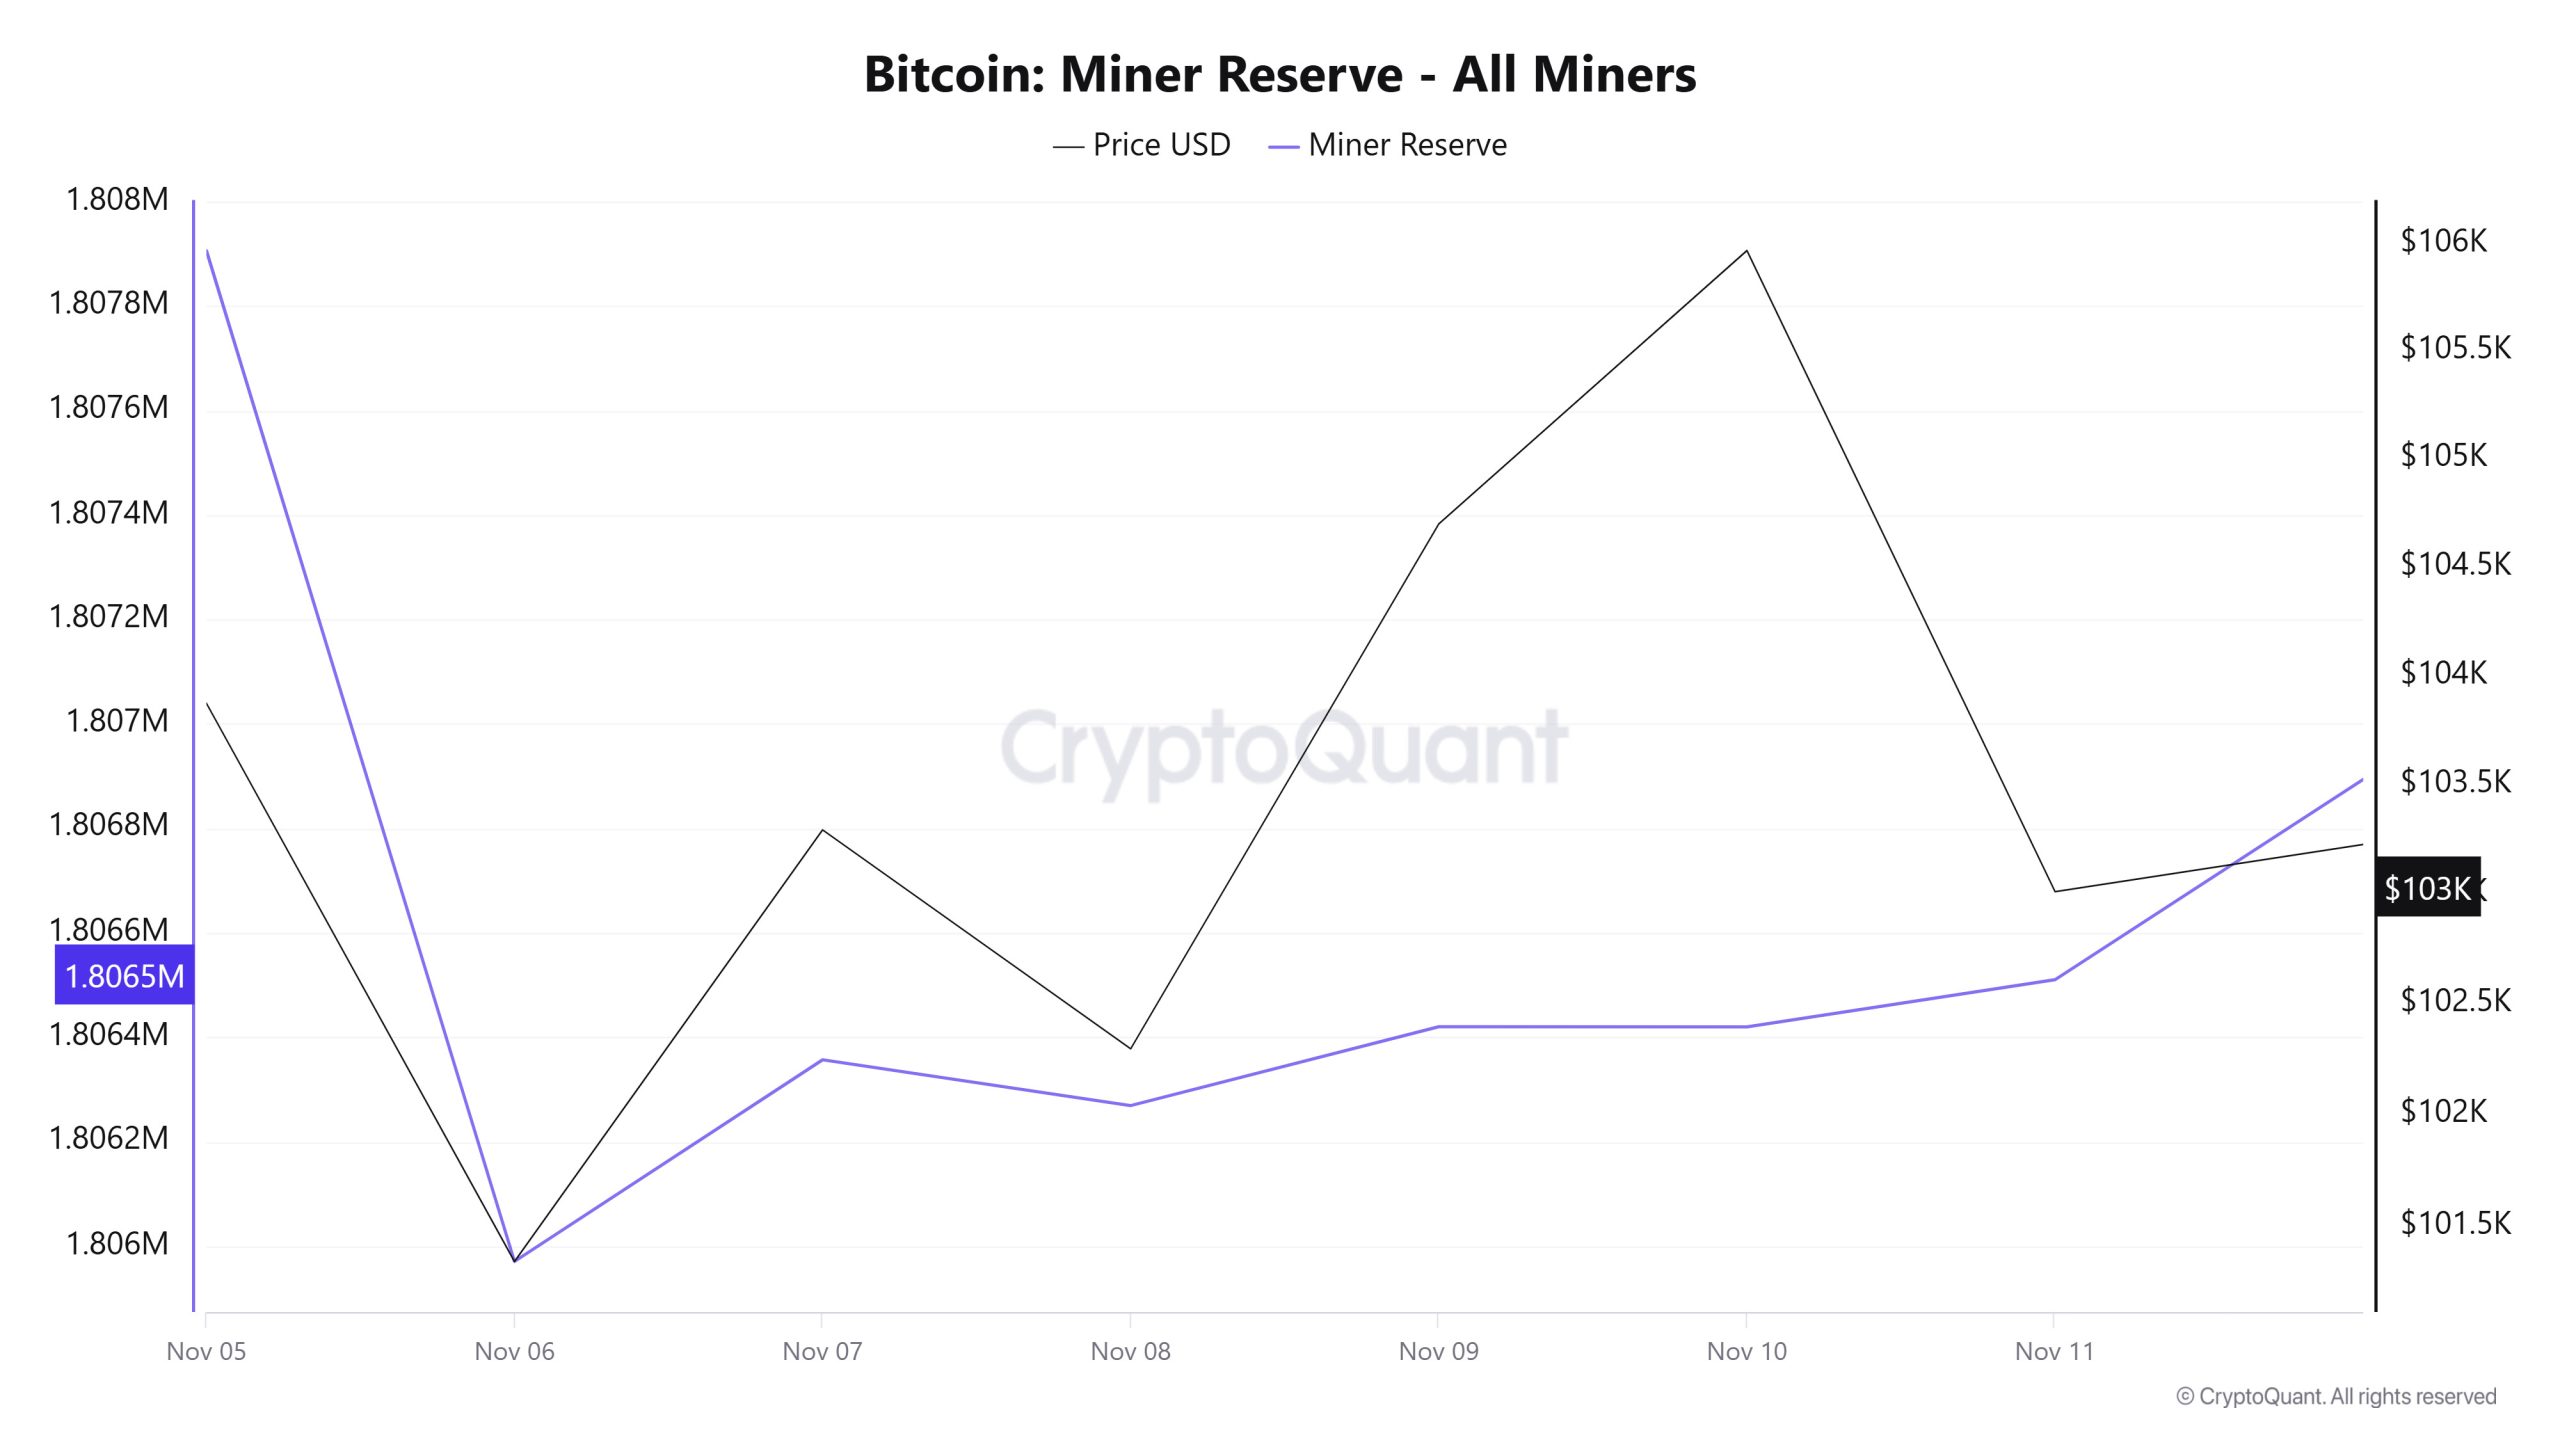
According to data obtained from the Miner Reserve table, a slight decrease in Bitcoin reserves held in miners’ wallets was observed this week. A time-dependent correlation structure between the Bitcoin price and miner reserve was observed during the period under review. However, the general trend shows that a positive correlation between these two variables is dominant.
Miner Inflow, Outflow, and Netflow
Between November 5 and 11, 49,067 Bitcoin flowed out of miners’ wallets, while 47,868 Bitcoin flowed into miner wallets during the same period. This week’s Miner Netflow was -1,199 Bitcoin. Meanwhile, the Bitcoin price was $103,870 on November 5 and $103,008 on November 11.
Throughout the week, Bitcoin inflows to miner wallets (Miner Inflow) were less than Bitcoin outflows from miner wallets (Miner Outflow), resulting in a negative net flow (Miner Netflow).
| Date | Nov. 05 | Nov. 06 | Nov. 07 | Nov. 08 | Nov. 09 | Nov. 10 | Nov. 11 |
|---|---|---|---|---|---|---|---|
| Miner Inflow | 10,249.58 | 6,836.36 | 10,393.71 | 3,584.32 | 3,880.29 | 5,784.41 | 7,140.04 |
| Miner Outflow | 10,052.36 | 8,771.91 | 10,007.55 | 3,672.00 | 3,729.28 | 5,784.83 | 7,049.57 |
| Miner Netflow | 197.22 | -1935.55 | 386.16 | -87.68 | 151.01 | -0.42 | 90.47 |
Transaction
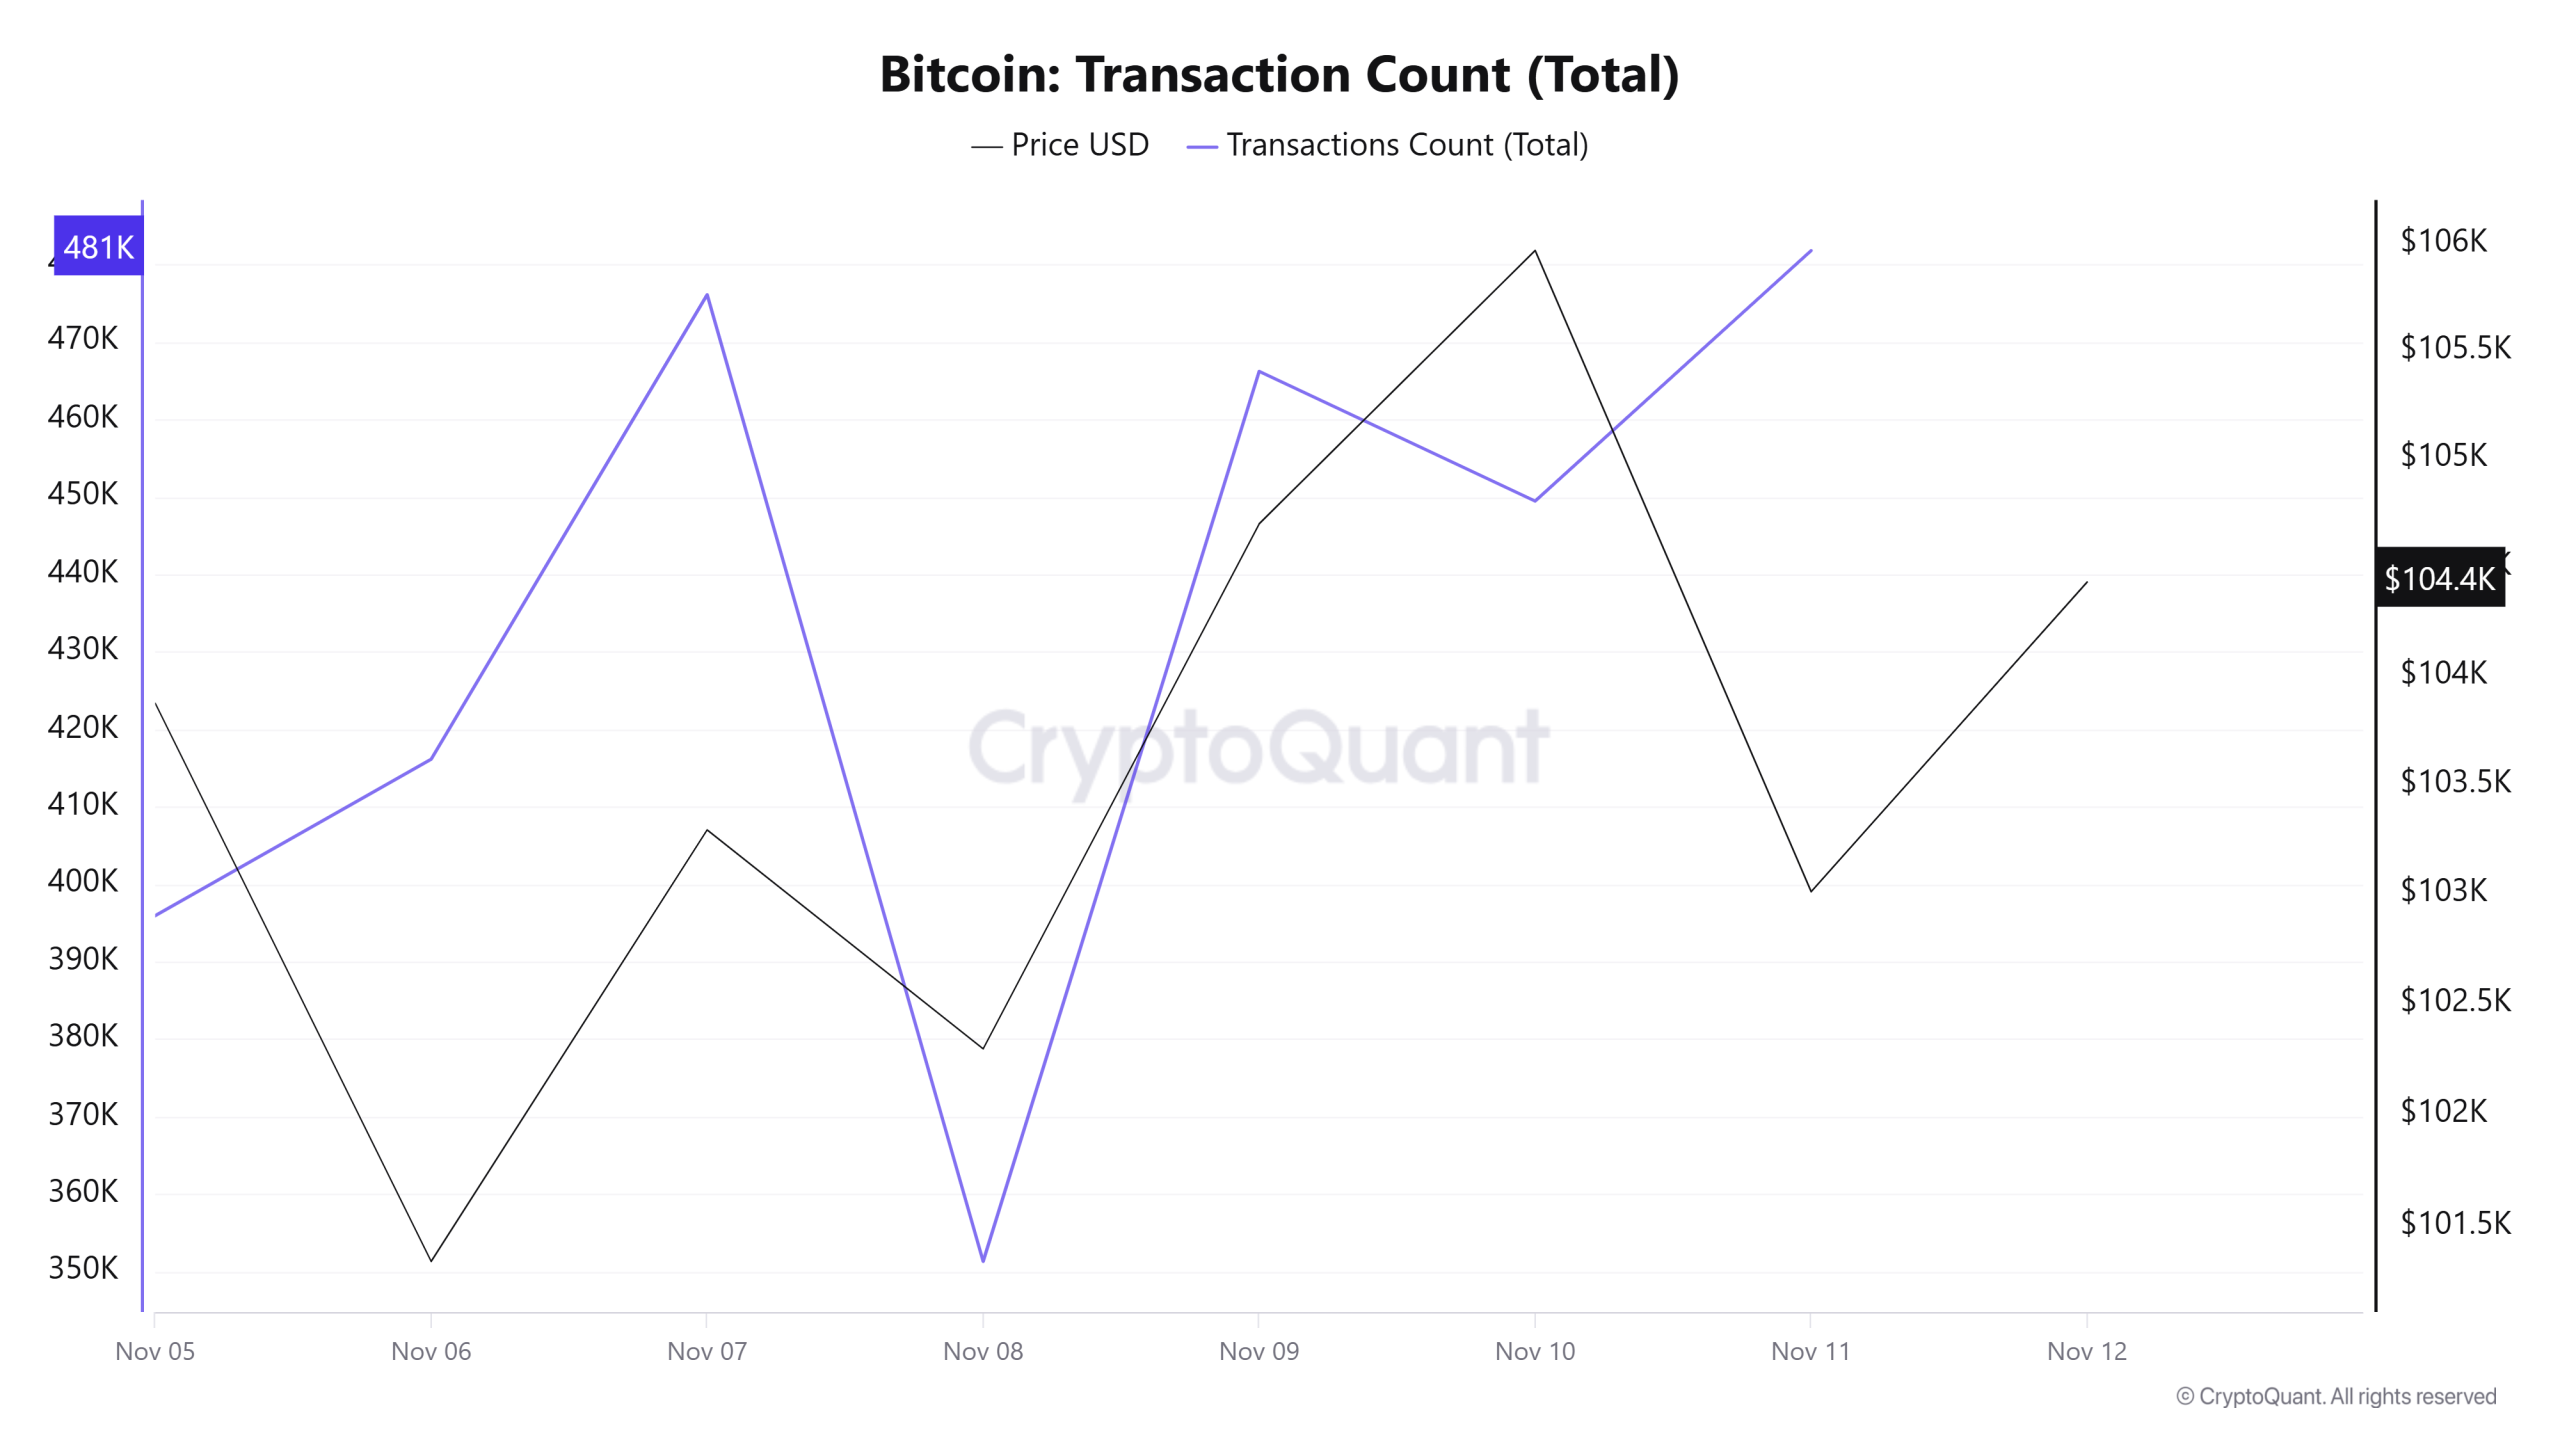 While 3,543,306 transactions were executed on the Bitcoin network last week, this week the number of transactions decreased by 14.3% to 3,036,930. The highest transaction volume of the week was recorded on November 11 at 481,796, while the lowest number of transactions was recorded on November 8 at 351,300. When examining the relationship between transaction count and price, a balanced correlation was observed throughout the week. This indicates that sales-oriented transfers and purchase-oriented transfers were balanced on the Bitcoin network, meaning the market is going through an indecisive period in terms of on-chain data. On the other hand, the surge in weekend activity observed over the past few weeks has come to an end this week, suggesting that transaction count distributions on a periodic basis have begun to normalize again.
Tokens Transferred
While a total of 4,697,165 BTC was transferred in the previous period, this week it increased by 19.94% to 5,633,523 BTC. The highest daily transfer of the week was recorded on November 5 at 955,634 BTC, while the lowest transfer volume was recorded on November 9 at 537,432 BTC. The correlation between the amount of tokens transferred and the price remained positively weighted on a weekly basis. In particular, the declining transfer volumes between November 5 and 8 quickly recovered between October 9 and 11, managing to reach levels close to those at the beginning of the period.
As the amount of Bitcoin transferred increased, the decrease in the number of transactions indicates that high-value, higher-volume but less frequent transactions were prominent during this period. This pattern suggests that the network exhibited more passive but larger user behavior.
Whale Activities

Whales Data:
Looking at whale activity on centralized exchanges over the past 7 days based on cryptocurrency market data, we see that while there was an upward trend from the beginning of the process, there was a downward trend towards the end. Looking at the Exchange Whale Ratio metric, on November 5, the first day of the 7-day period, the ratio of whales using centralized exchanges was 0.413. This also marked the lowest point of the process. The peak of the process was reached on November 9, rising to a value of 0.564. When this ratio is above the 0.35–0.45 band, it generally means that whales frequently use centralized exchanges. Currently at a value of 0.526, the metric shows that whales are actively using centralized exchanges. During this process, BTC was priced between $101,300 and $107,000. This indicated that centralized exchanges were being used by whales to make purchases. At the same time, total BTC transfers increased by 3% compared to last week, with 5,633,523 BTC moving. Data from the fourth quarter of 2025 shows that whale accumulation and institutional ETF inflows are strengthening Bitcoin’s structural strength. There are 262,000 BTC controlled by accumulators. Institutional demand, through ETFs and corporate treasuries, currently holds 10% of Bitcoin’s supply and has accumulated 2 million BTC since 2025, strengthening its strategic asset status. Amid macroeconomic fluctuations, Bitcoin’s resistance above $100,000 reflects coordinated accumulation by long-term holders, with 375,000 BTC added in 30 days.
Consequently, current on-chain dynamics, alongside market-wide transfers and high liquidations, indicate that the market is currently in equilibrium.
BTC Onchain Overall
| Metric | Positive 📈 | Negative 📉 | Neutral ➖ |
|---|---|---|---|
| Active Addresses | ✓ | ||
| Breakdowns | ✓ | ||
| Derivatives | ✓ | ||
| Supply Distribution | ✓ | ||
| Exchange Supply Ratio | ✓ | ||
| Exchange Reserve | ✓ | ||
| Fees and Revenues | ✓ | ||
| Miner Flows | ✓ | ||
| Transaction | ✓ | ||
| Whale Activity | ✓ |
*The metrics and guidance provided in the table do not alone explain or imply any expectation regarding future price changes in any asset. Digital asset prices can fluctuate based on numerous variables. The on-chain analysis and related guidance are intended to assist investors in their decision-making process, and basing financial investments solely on the results of this analysis may lead to unfavorable outcomes. Even if all metrics produce positive, negative, or neutral results simultaneously, the expected outcomes may not materialize depending on market conditions. It would be beneficial for investors reviewing the report to take these warnings into consideration.
Legal notice
The investment information, comments, and recommendations contained in this document do not constitute investment advisory services. Investment advisory services are provided by authorized institutions on a personal basis, taking into account the risk and return preferences of individuals. The comments and recommendations contained in this document are of a general nature. These recommendations may not be suitable for your financial situation and risk and return preferences. Therefore, making an investment decision based solely on the information contained in this document may not result in outcomes that align with your expectations.
NOTE: All data used in Bitcoin on-chain analysis is based on CryptoQuant.