
Active Addresses
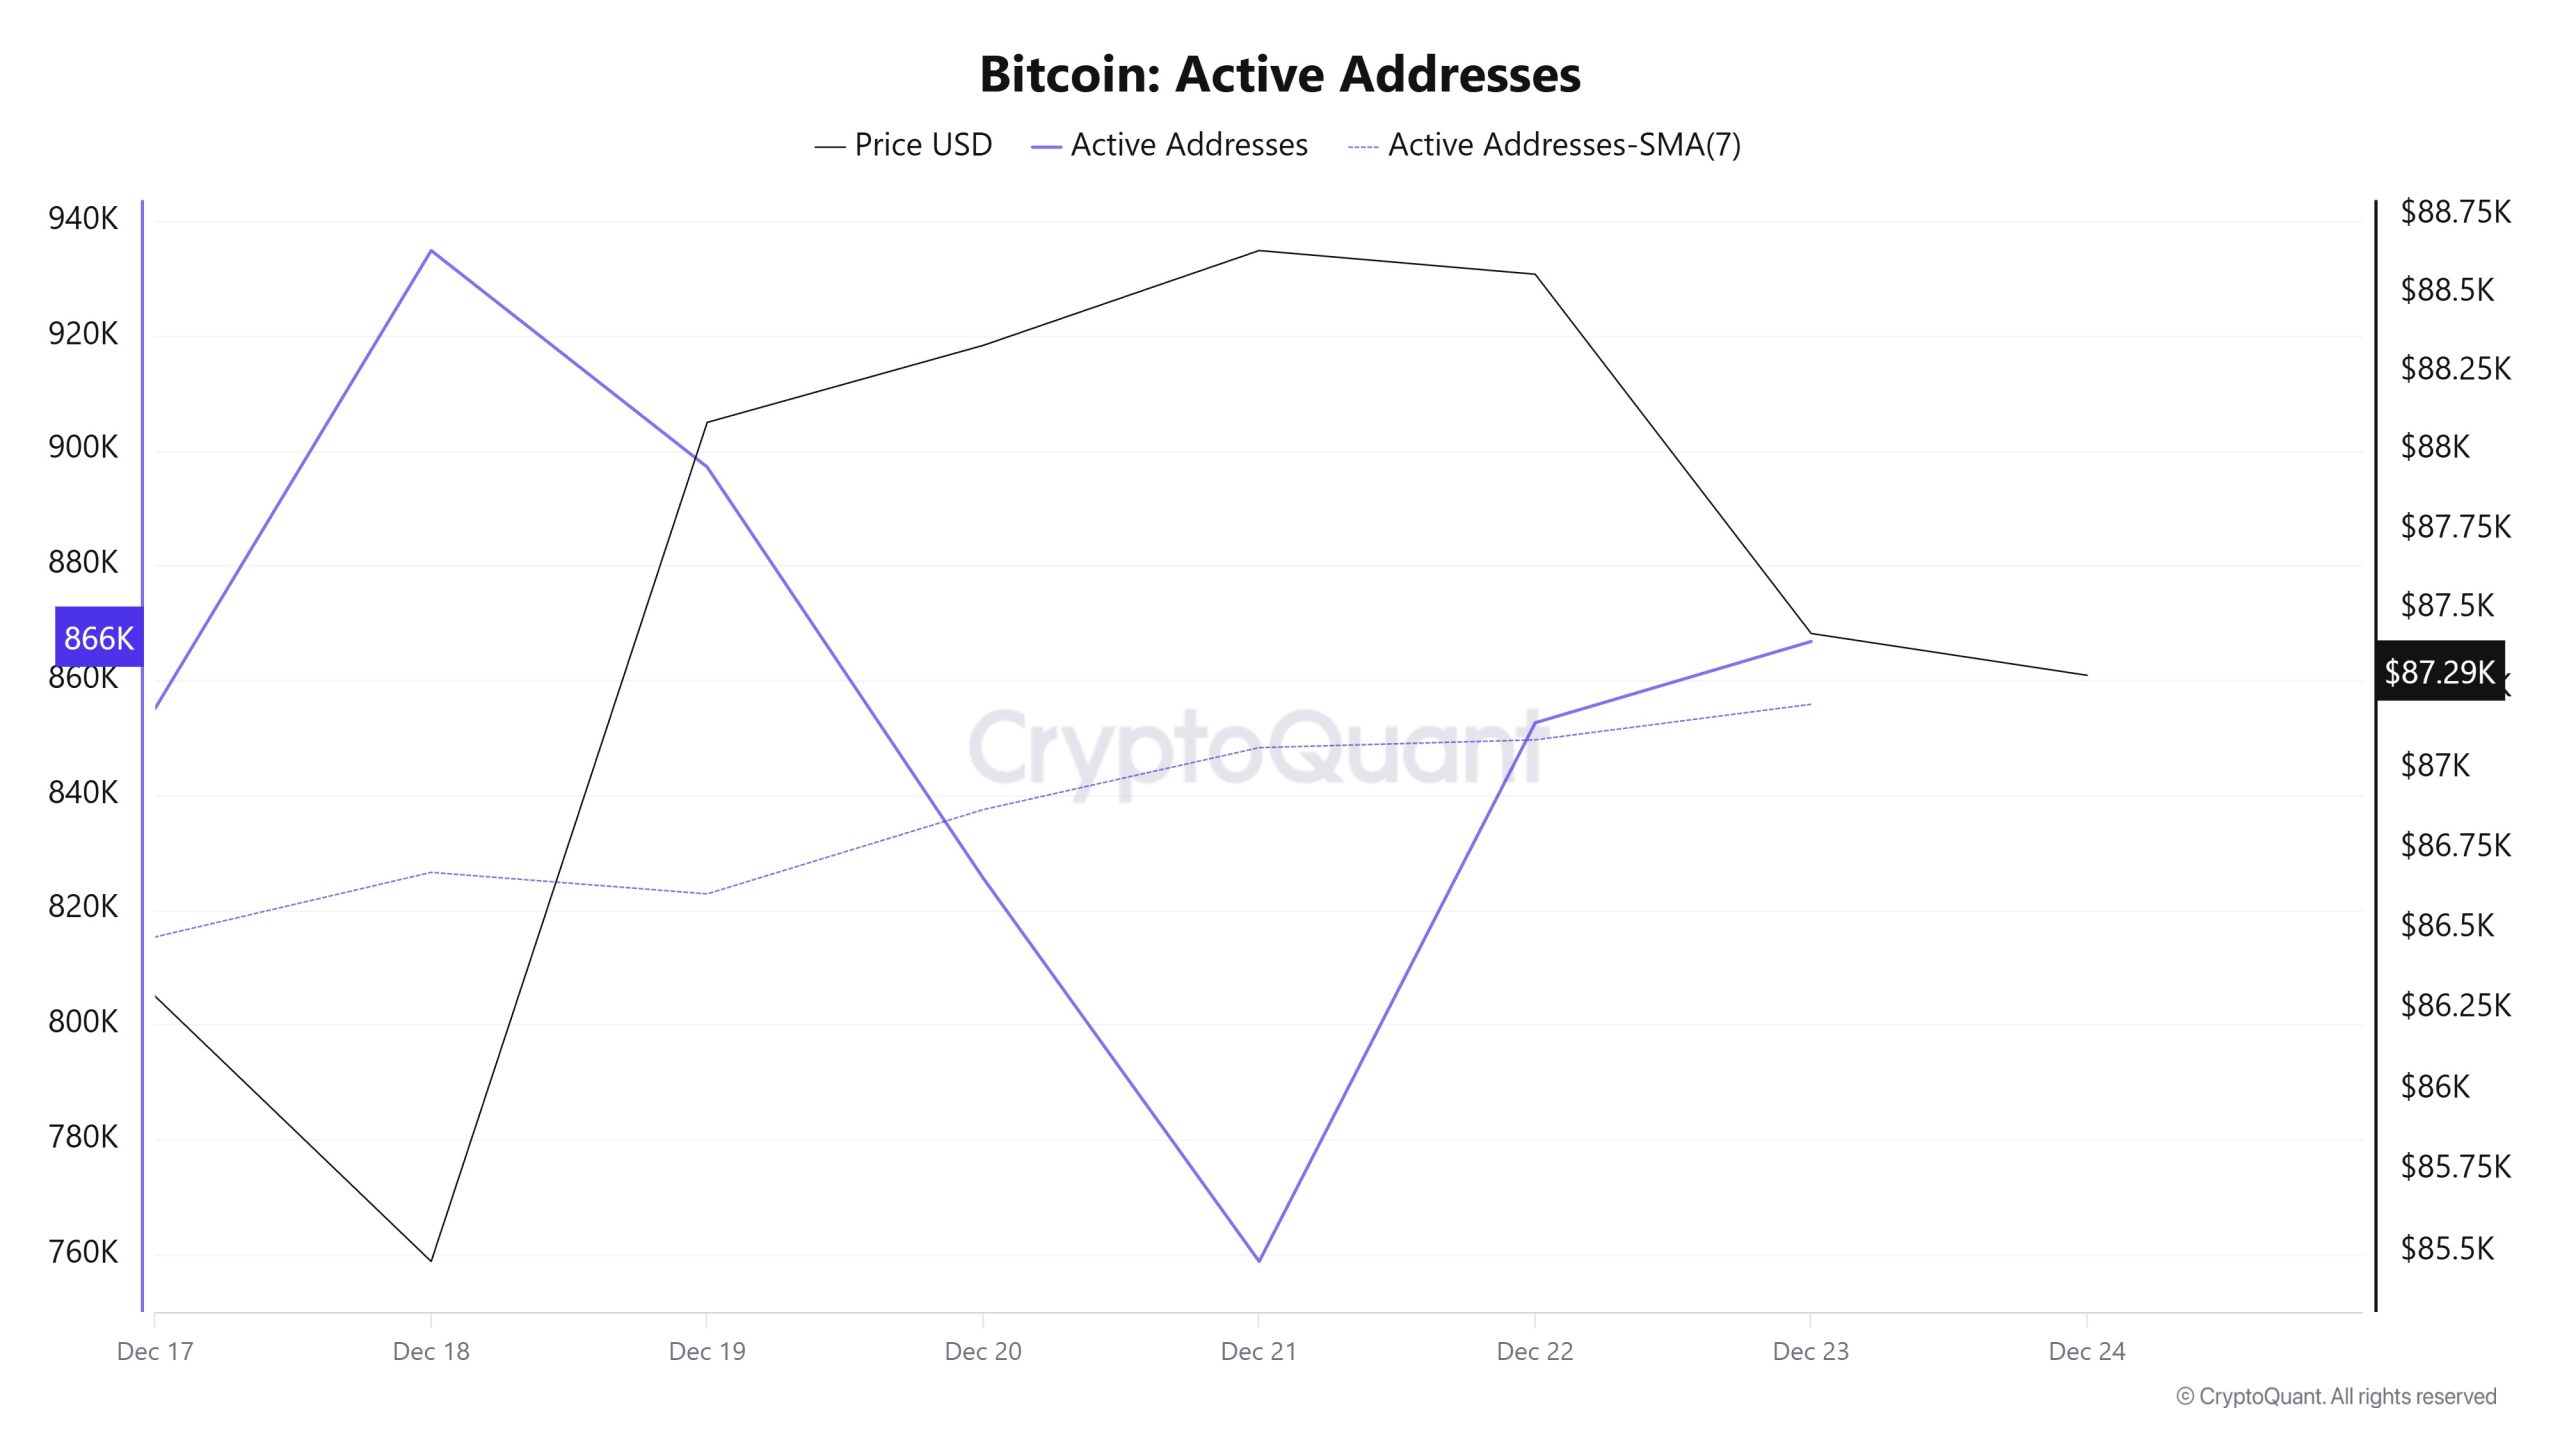
Between December 17 and December 24, 934,863 active addresses were added to the Bitcoin network ( ). During this period, the Bitcoin price dropped to $86,000. From a technical perspective, the 7-day simple moving average (SMA) shows a downward trend.
Active Sending Addresses
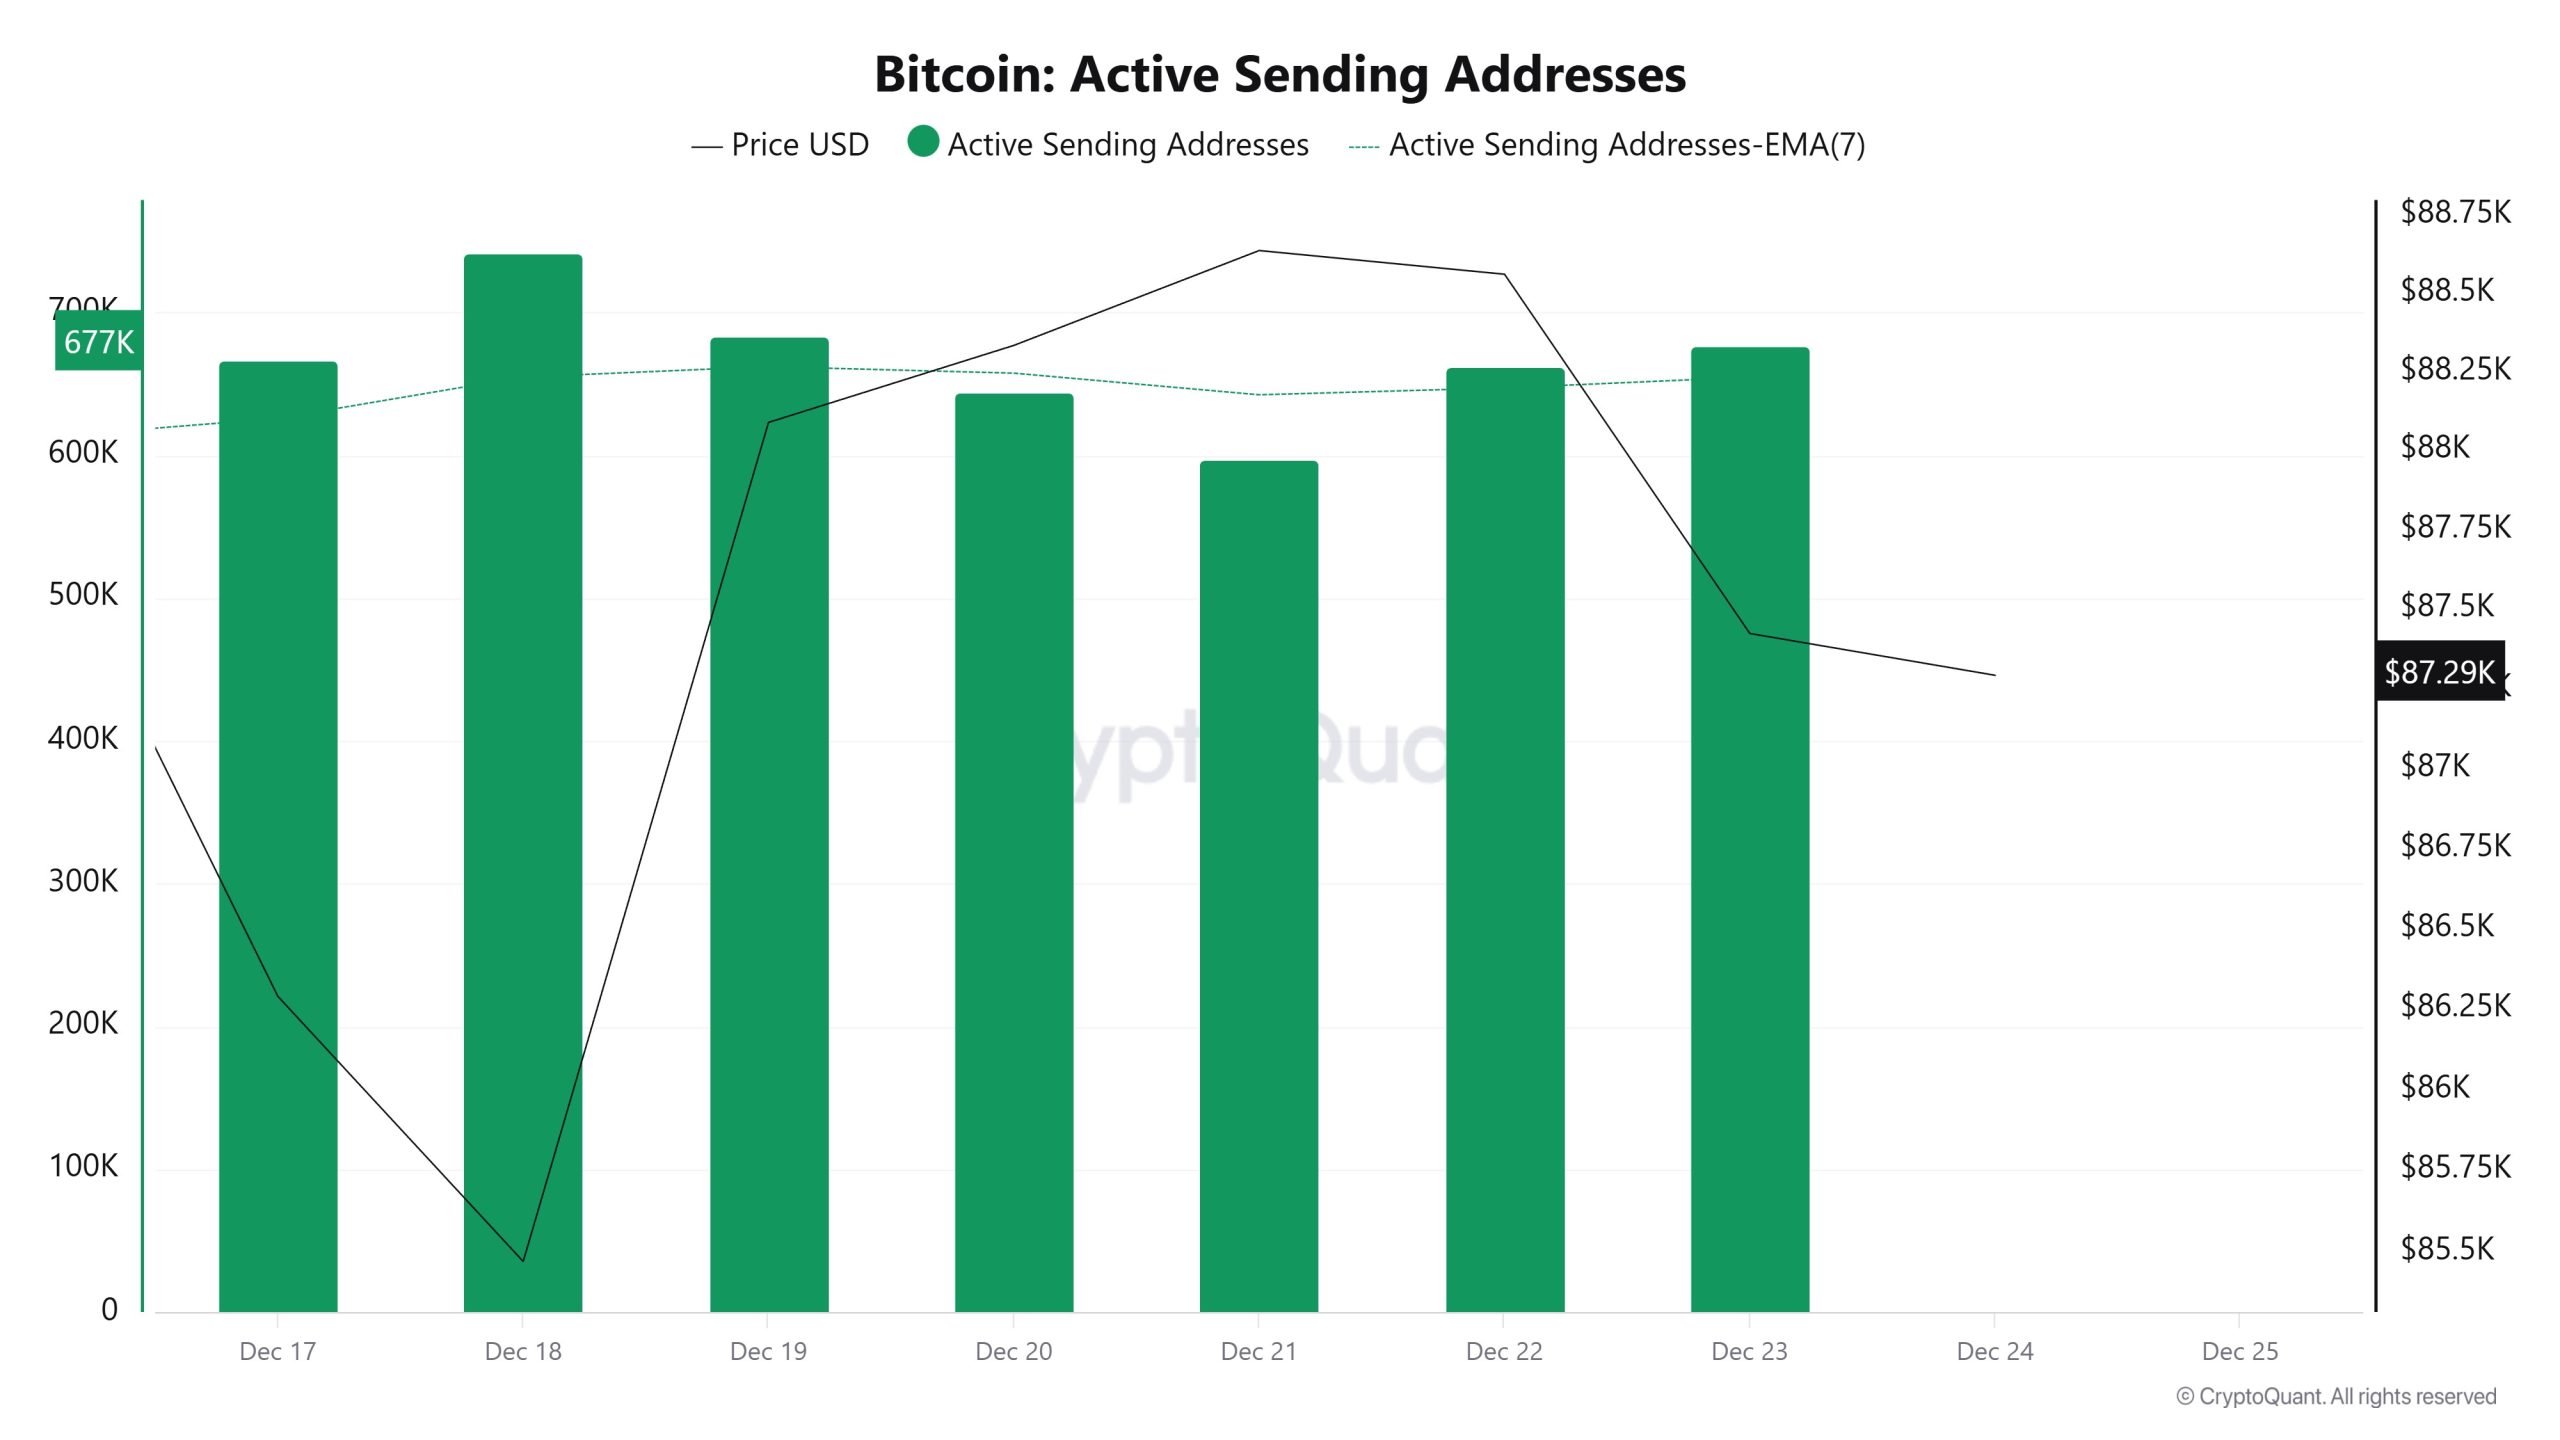
Between December 17 and December 24, an upward trend was observed in the active sending addresses metric. On the day the price reached its highest level, this metric stood at 741,656, indicating that user activity on the Bitcoin network was moving in parallel with the price. This data shows that the $88,000 level is supported not only by price but also by on-chain address activity, which is sales-based. Overall, the Active Sending Addresses metric has been trending upward during this period.
Active Receiving Addresses

Between December 17 and December 24, active receiving addresses experienced a typical increase alongside the Black Line (price line). On the day the price reached its peak, active receiving addresses rose to 515,568 levels, indicating that buyers acquired Bitcoin at the $88,000 level.
Breakdowns
MVRV
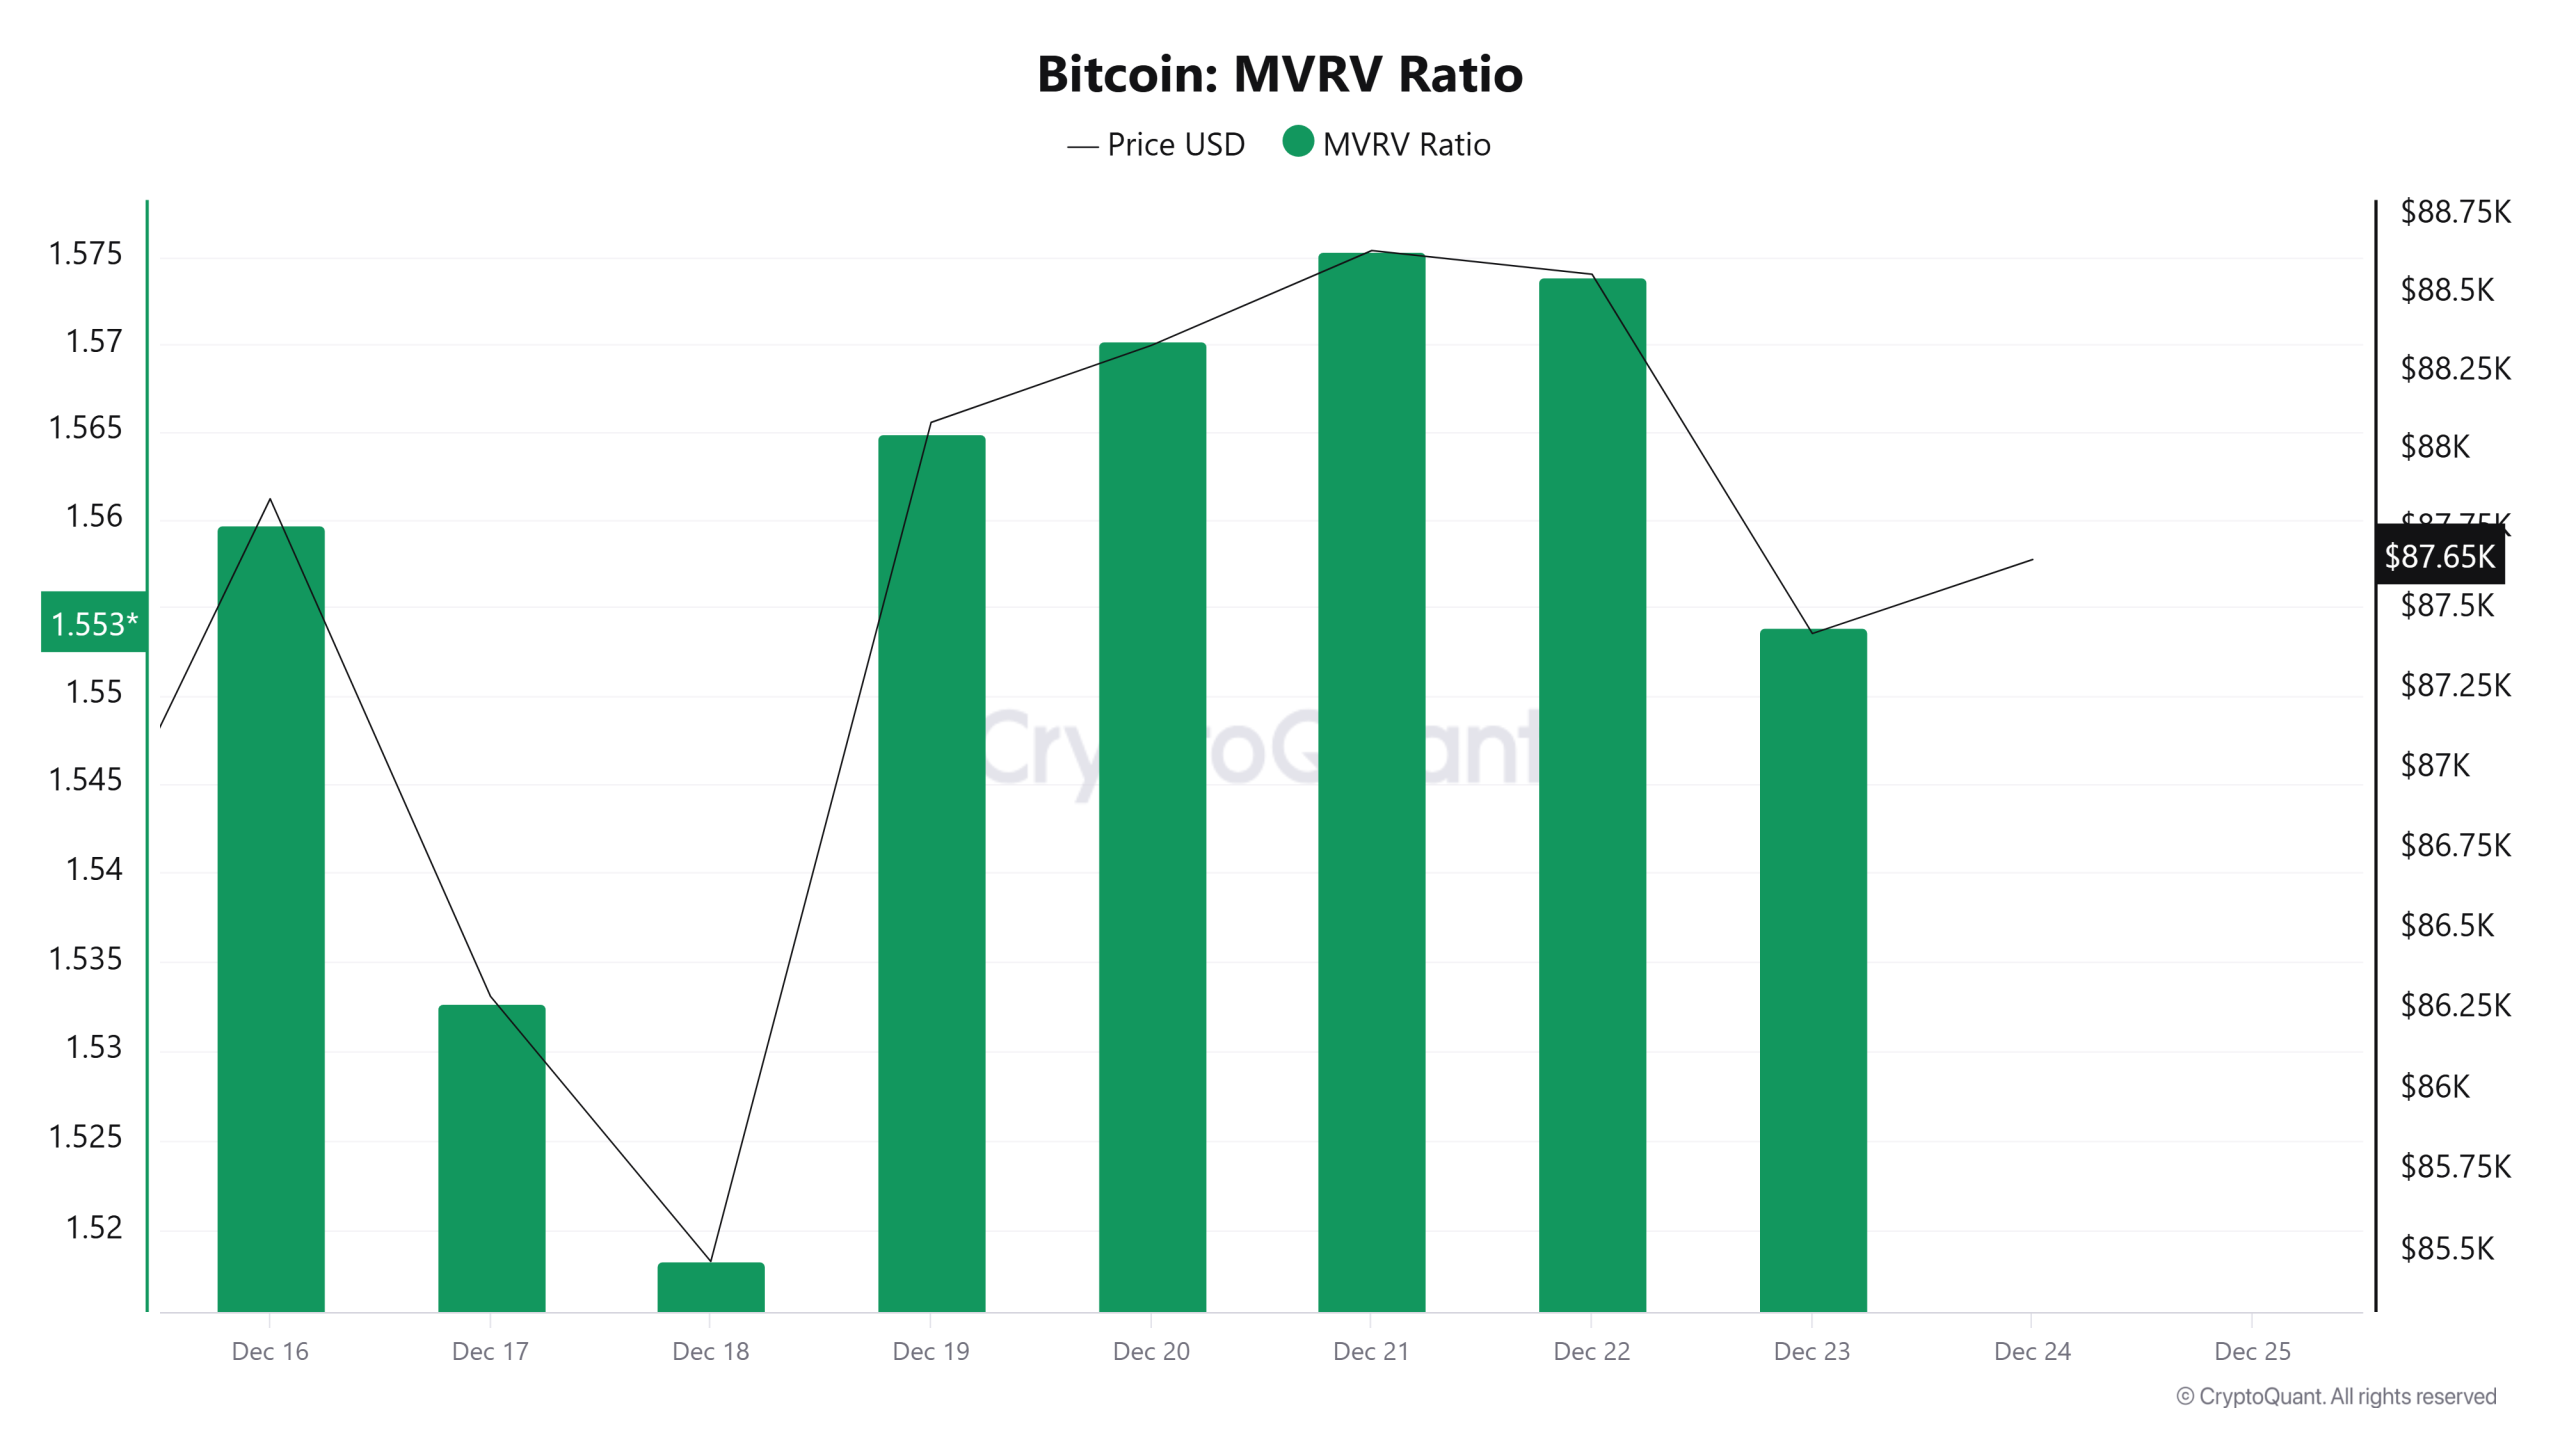
On December 17, while the Bitcoin price was trading at $86,289, the MVRV Ratio stood at 1.532.
As of December 23, the Bitcoin price rose to $87,422, recording a 1.31% increase, while the MVRV Ratio rose to 1.553, recording a 1.37% increase.
Realized Price
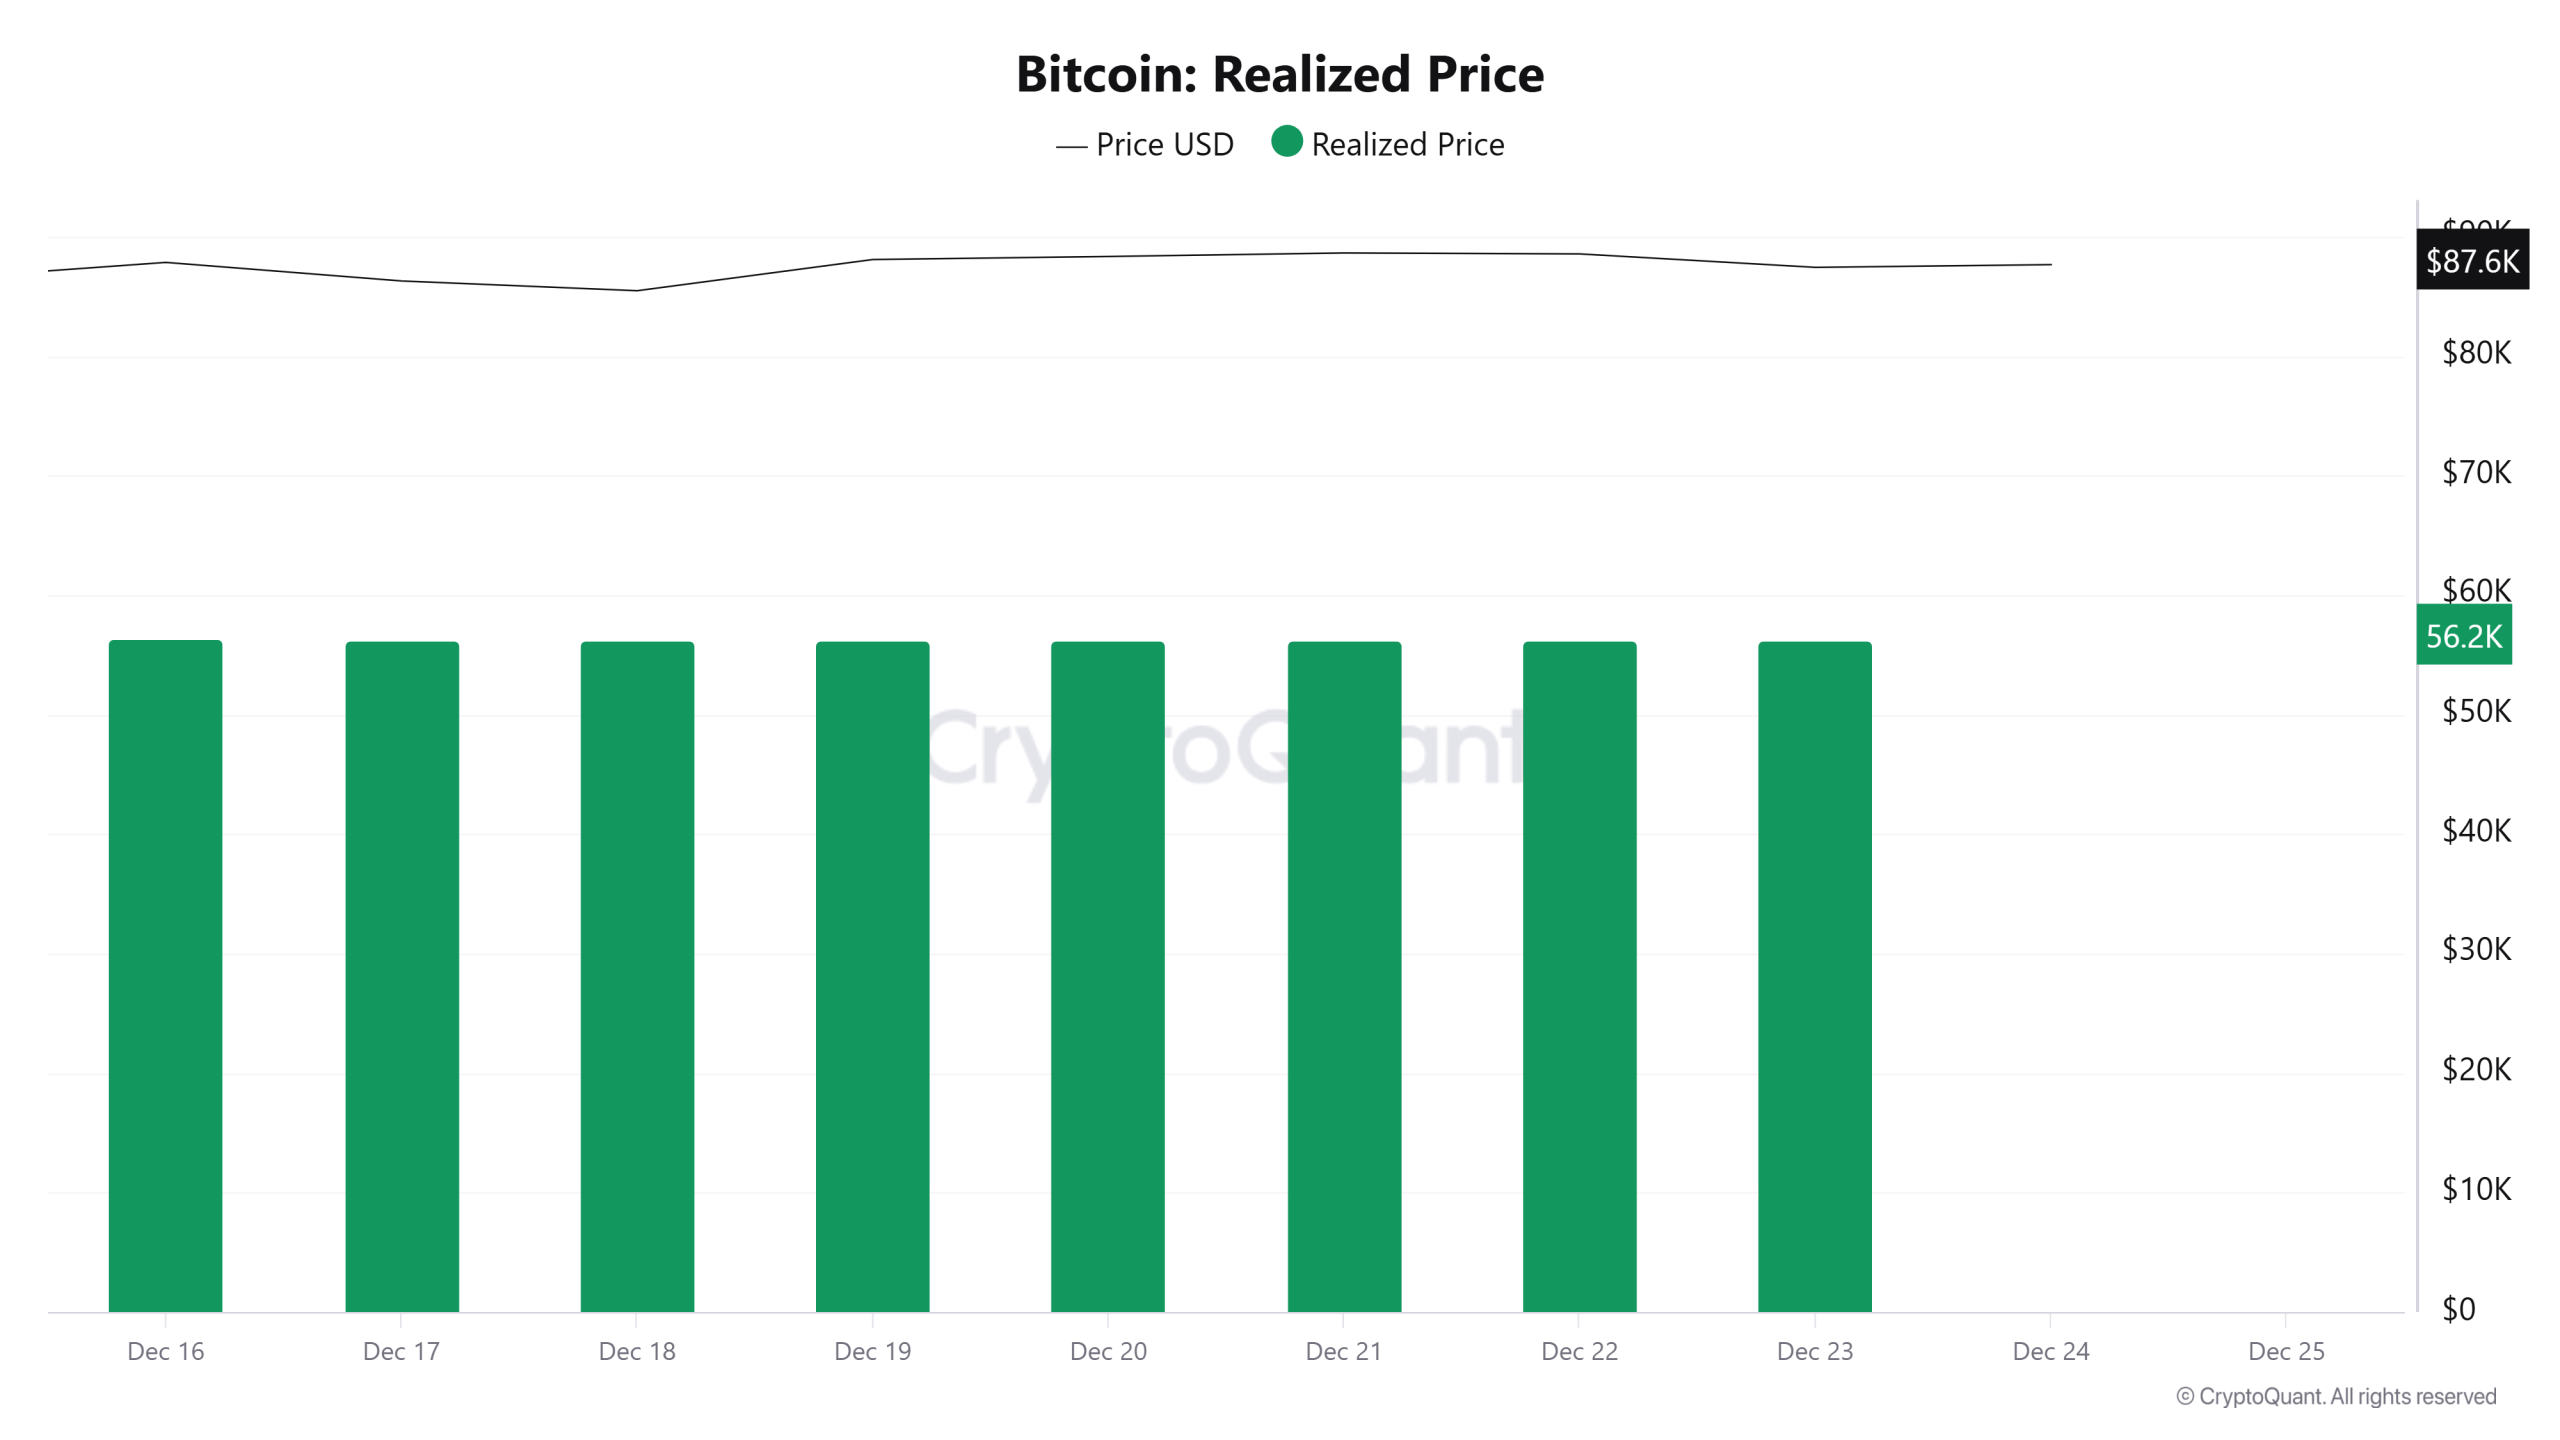
On December 17, Bitcoin was trading at $86,289, while the Realized Price was at 56,300.
As of December 23, the Bitcoin price rose to $87,422, while the Realized Price fell to $56,261, recording a 0.07% decline.
Spent Output Profit Ratio (SOPR)
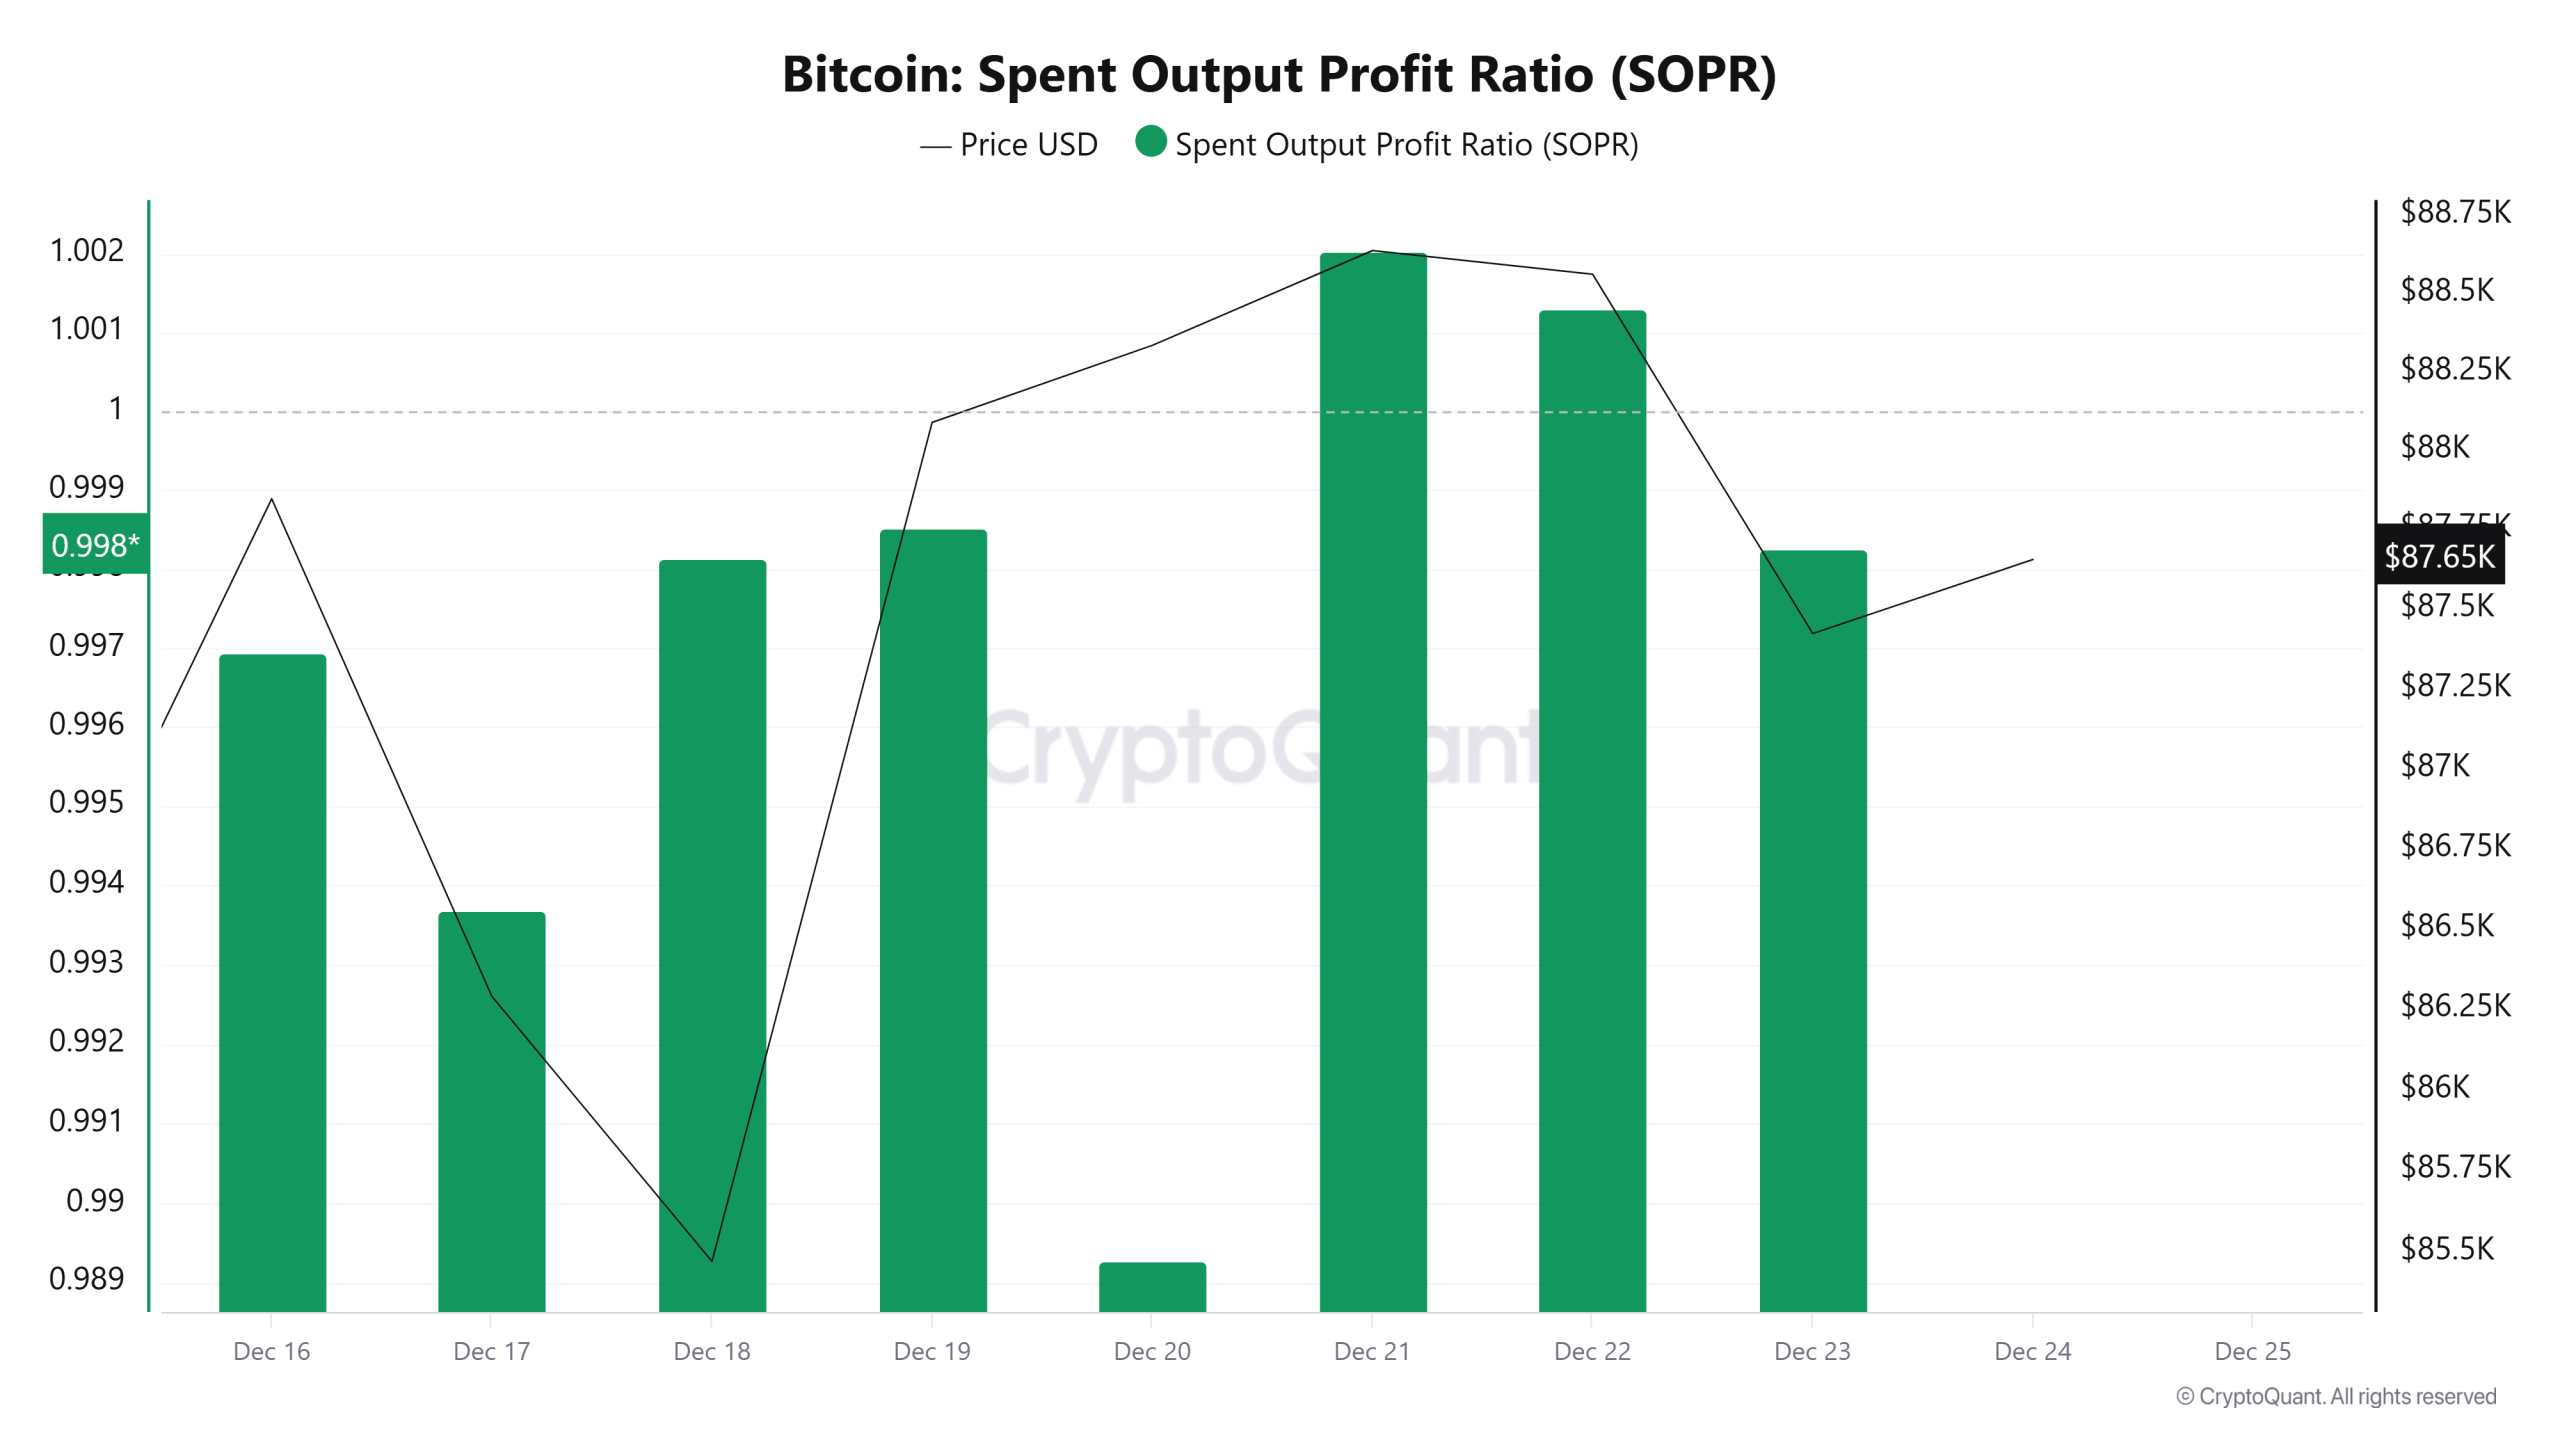
On December 17, while the Bitcoin price was trading at $86,289, the SOPR metric was at 0.993.
As of December 23, while the Bitcoin price rose to $87,422, the SOPR metric rose to 0.998, recording a 0.50% increase.
Derivatives
Open Interest
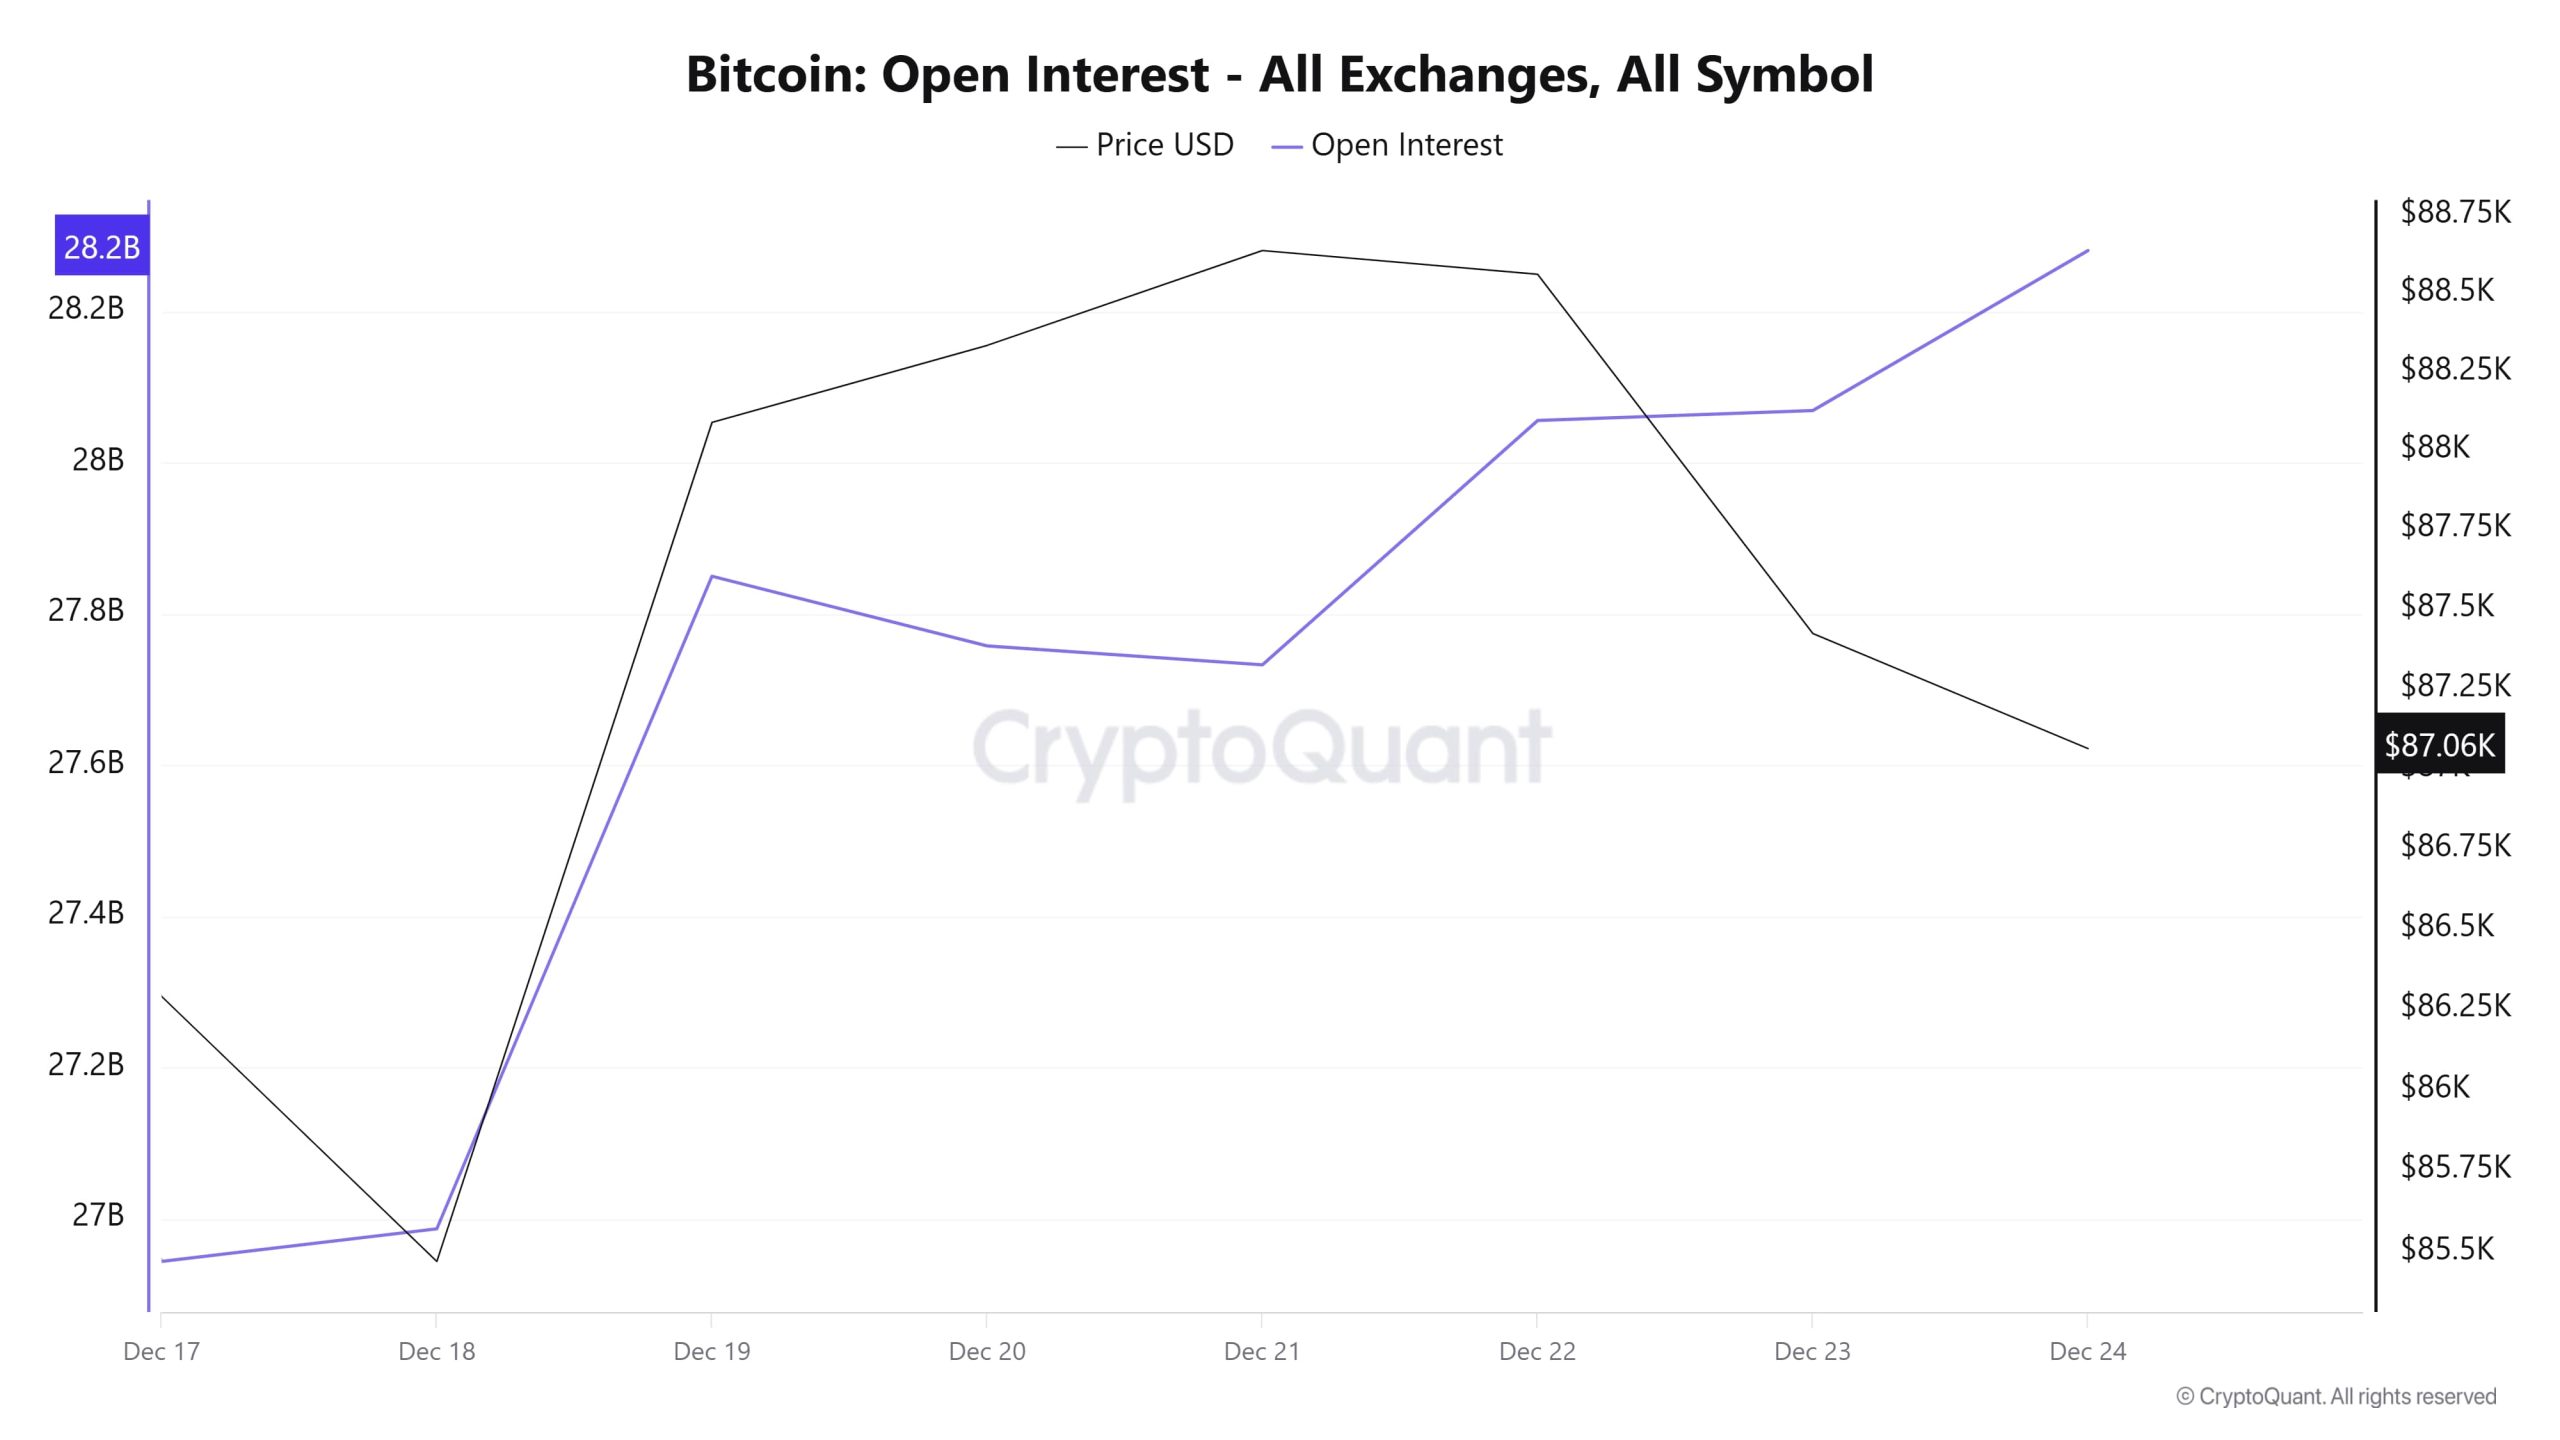
The BTC price experienced a sharp rise between December 12-19, managing to surpass the $88,000 level. At the same time, the open interest accompanying this rise reveals that these newly opened positions are long-heavy. While both the price and open interest remained flat between December 20-22, the price began to decline as of December 23. However, the open interest continues to rise. This divergence indicates that risk in leveraged trading has increased and volatile movements may begin.
The overall picture shows that position density in the market has increased in the short term and price movements have become more sensitive.
Funding Rate
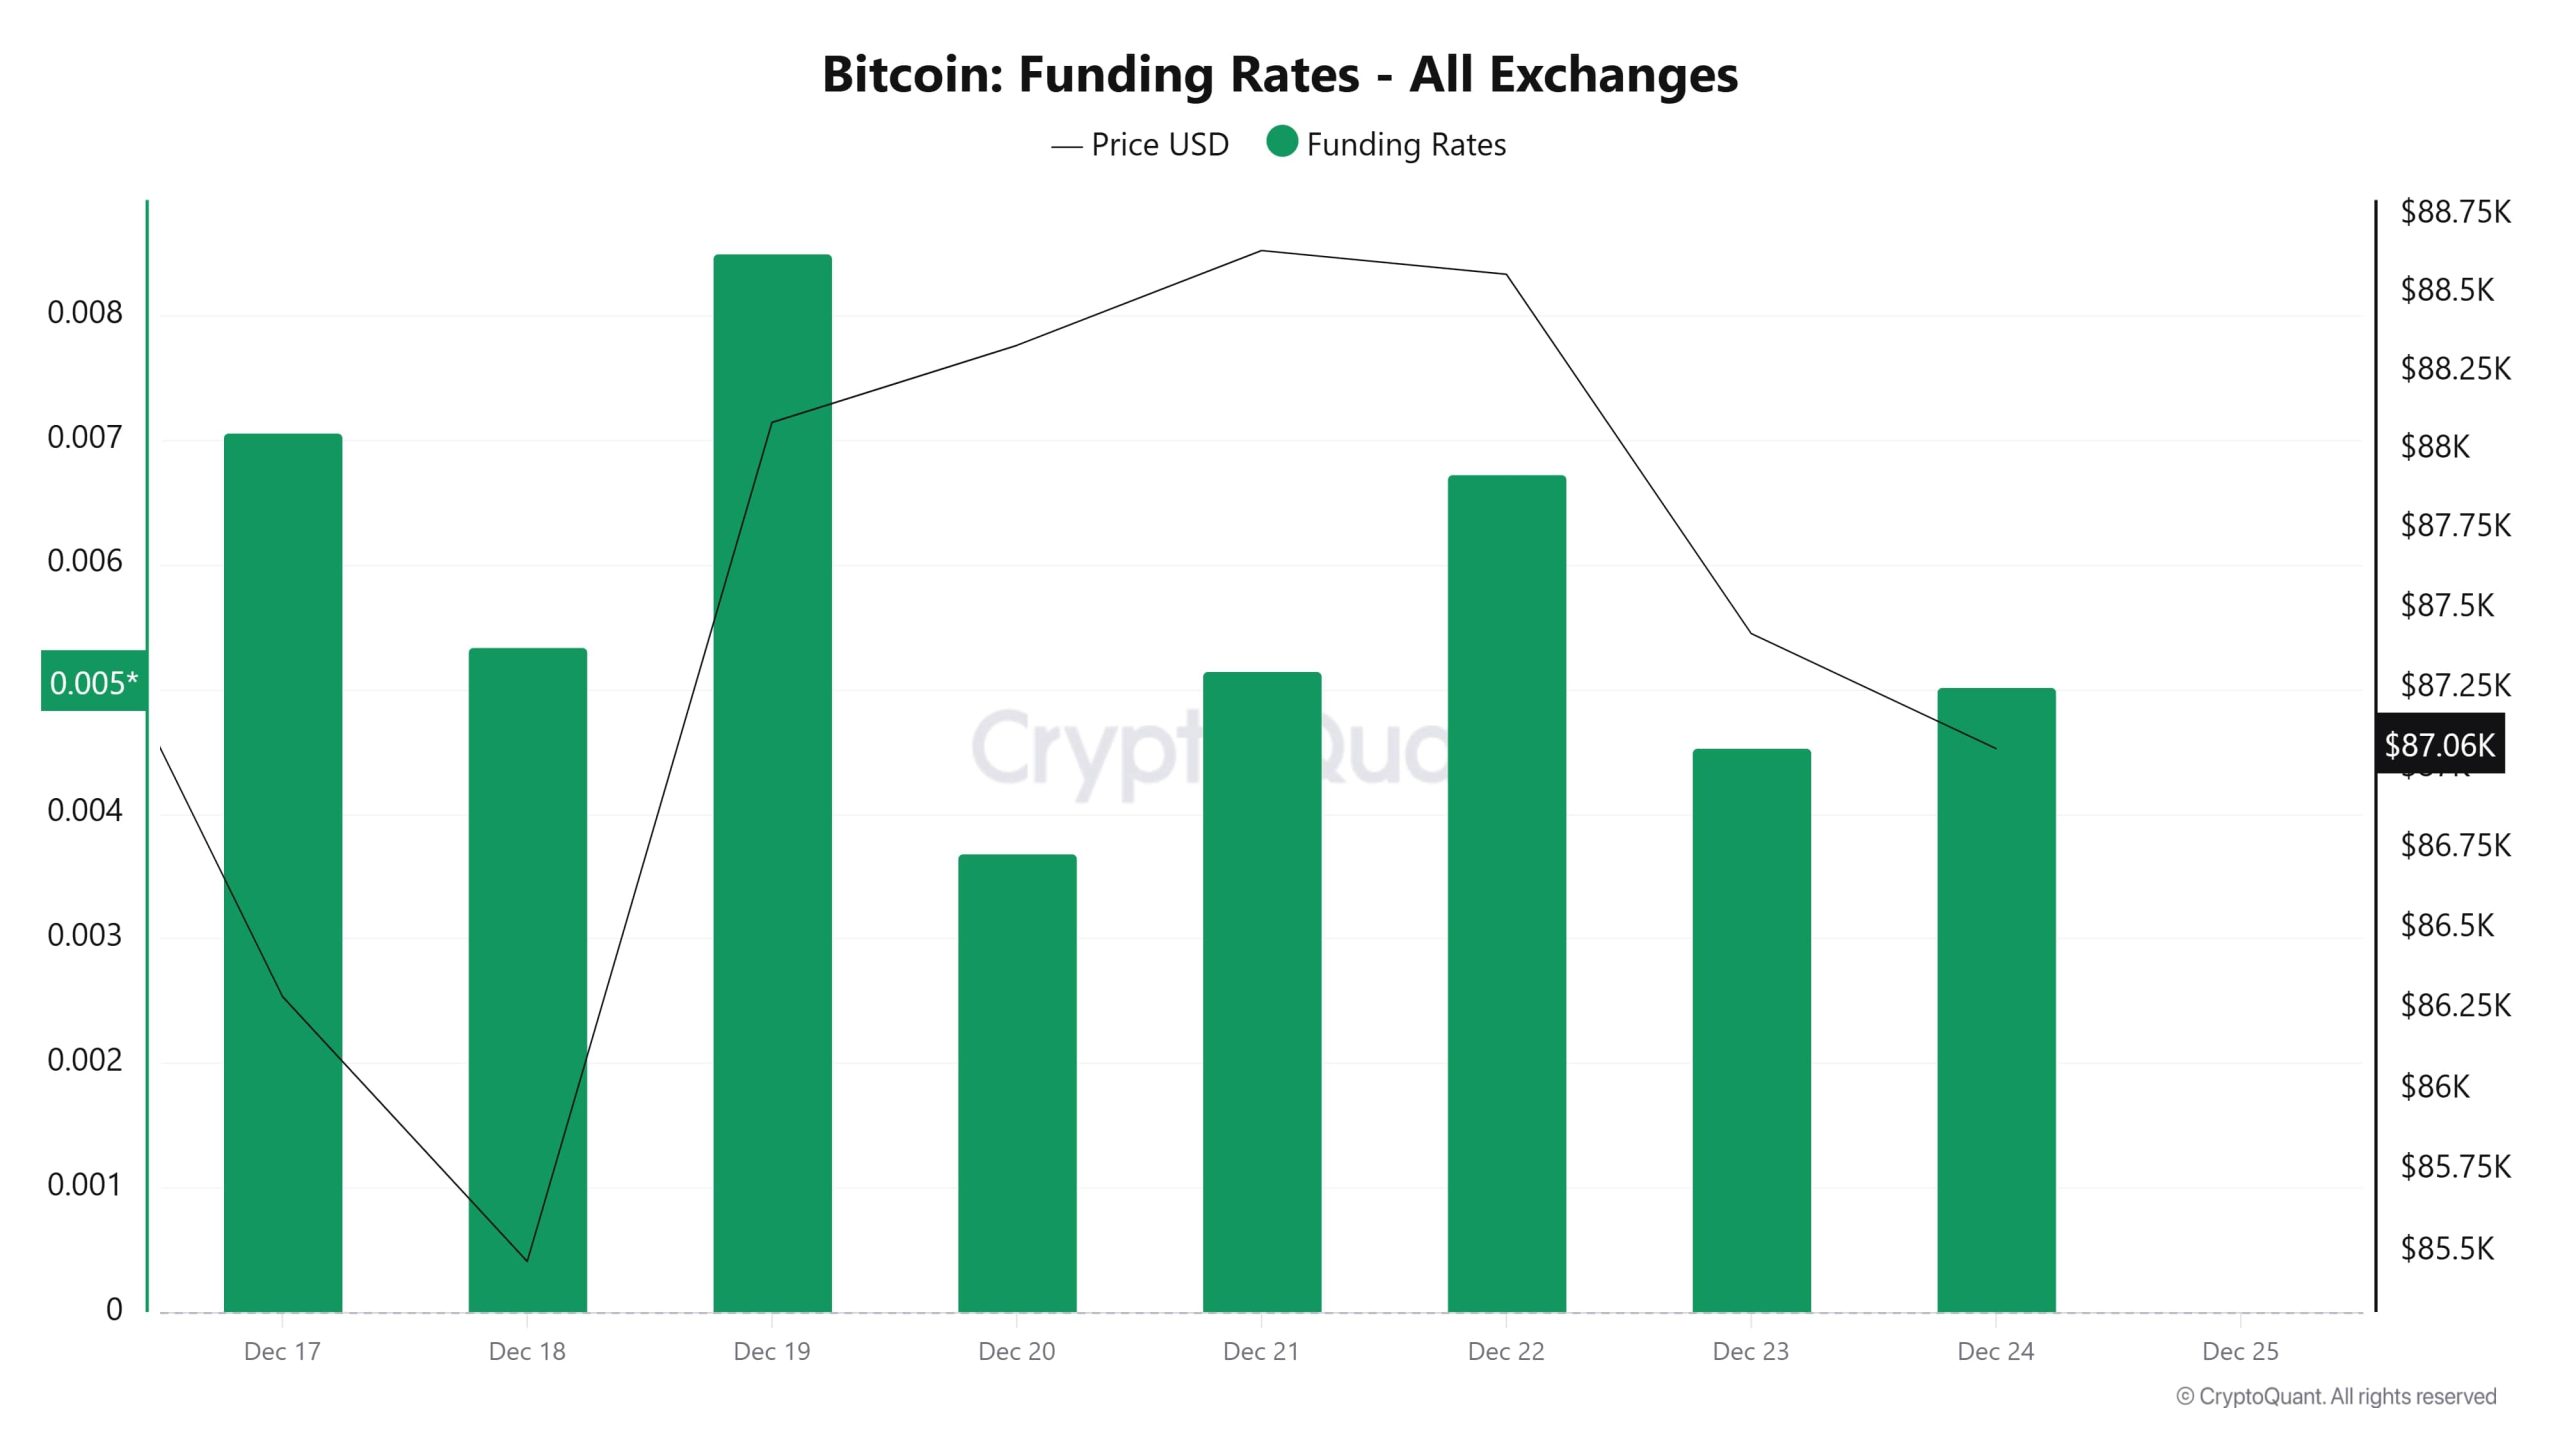
The chart shows that Bitcoin funding rates have generally remained positive and that long positions dominate the market. The rise in rates following the brief dip on December 18 indicates continued appetite for buying. The price has failed to sustain upward attempts, with pullbacks becoming more prominent in recent days. The weakening of the price while the funding rate remains positive indicates that leveraged long positions pose a risk and that volatility in the market may increase.
Long & Short Liquidations
Last week, the BTC price fell from $90,500 to $84,500, resulting in a total of $658 million in long liquidations and $892 million in short liquidations.
| Date | Long Amount (Million $) | Short Amount (Million $) |
|---|---|---|
| December 17 | 202.15 | 400.99 |
| December 18 | 216.79 | 411.55 |
| December 19 | 16.00 | 28.18 |
| December 20 | 0.97 | 1.33 |
| December 21 | 13.19 | 10.95 |
| December 22 | 180.02 | 32.18 |
| December 23 | 29.37 | 7.74 |
| Total | 658.49 | 892.92 |
Supply Distributions
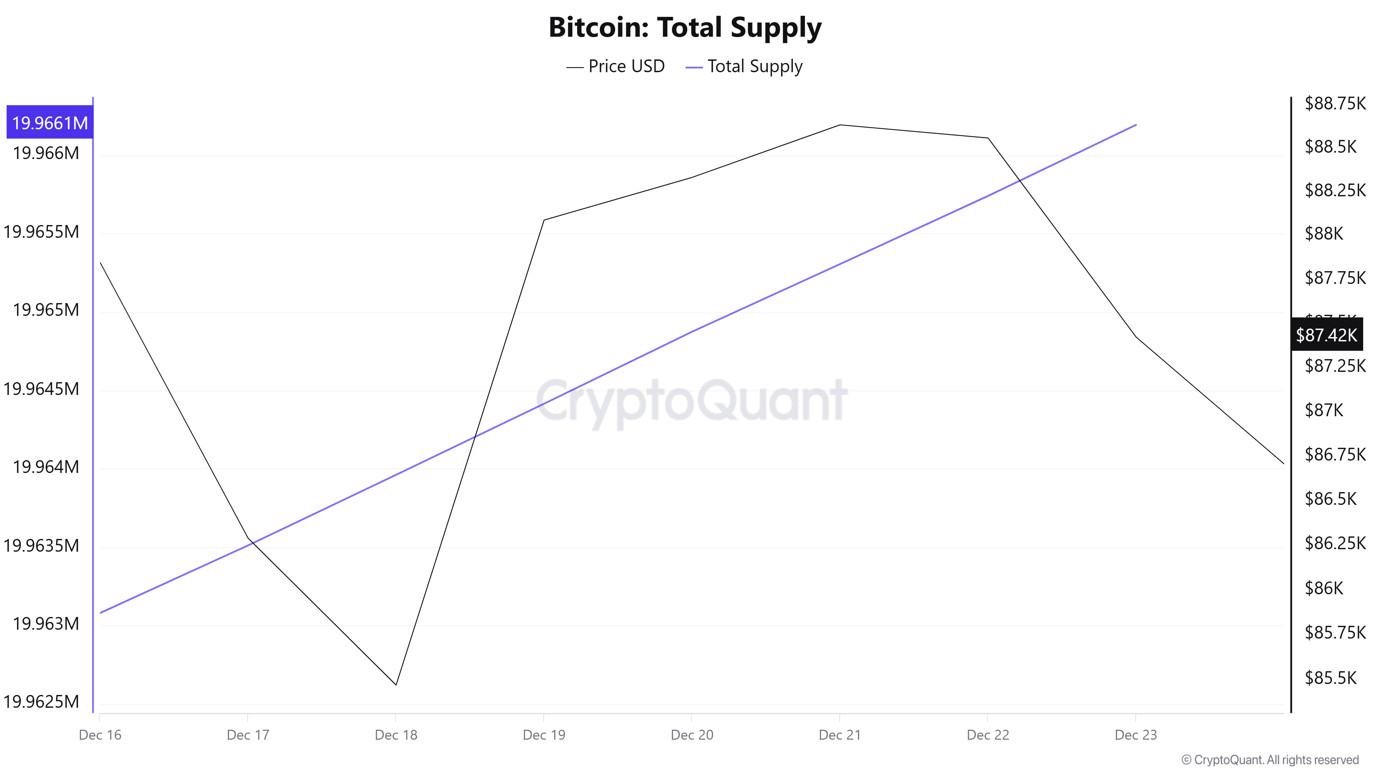
Total Supply: Reached 19,966,162 units, an increase of approximately 0.0154% compared to last week.
New Supply: The amount of BTC produced this week was 3,082.
Velocity: The velocity, which was 12.28 last week, reached 12.27 as of December 24.
| Wallet Category | 12/16/2025 | December 23, 2025 | Change (%) |
|---|---|---|---|
| < 1 BTC | 8.4463% | 8.45% | 0.044 |
| 1 – 10 BTC | 11.3183% | 11.3162% | -0.019% |
| 10 – 100 BTC | 23.1963% | 23.0635% | -0.572% |
| 100 – 1k BTC | 28.3483% | 28.3658% | 0.062% |
| 1k – 10k BTC | 20.7914% | 20.9159% | 0.599% |
| 10k+ BTC | 7.9881% | 7.8863% | -1.275% |
Limited movements in the <1 BTC and 1–10 BTC groups indicate that no clear direction has emerged on the retail side, while the decline in the 10–100 BTC band points to partial distribution. In contrast, the increase seen in the 100–1,000 BTC segment highlights the accumulation trend among mid-sized investors, while the limited pullback in the 1,000–10,000 BTC group signals profit-taking in this segment. The decline in wallets holding 10,000 BTC and above indicates that large investors remain cautious but have not completely exited the market.
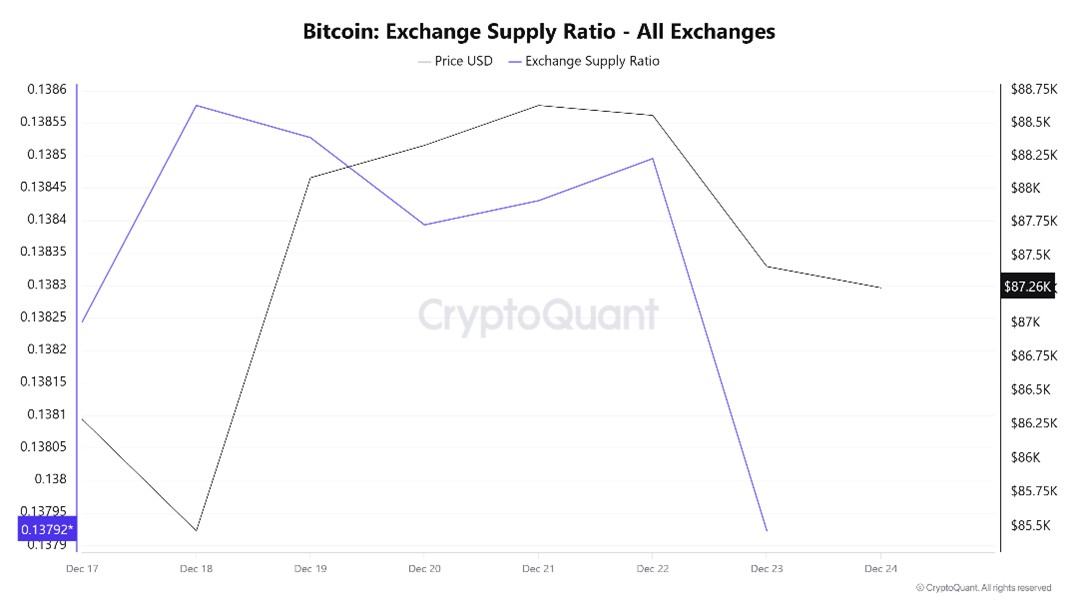
Exchange Supply Ratio
Between December 10 and December 17, the Ethereum Exchange Supply Ratio rose from 0.13752255 to 0.13778532. During this period, the Ethereum price rose from $2,826 to $2,923. Since December 23, at the point where the price and the Exchange Supply Ratio intersect, the correlation between the price and the Exchange Supply Ratio has turned positive. This indicates that the price has fallen while the amount of Ethereum supplied to exchanges has increased, and that long-term investors are likely turning to Ethereum. It appears that the Ethereum price may generally rise.
Exchange Reserve

Between December 17 and 23, 2025, Bitcoin reserves on exchanges fell from 2,757,481 BTC to 2,754,978 BTC. There was a net outflow of 2,503 BTC from exchange reserves. During this period, reserves decreased by approximately 0.09%, while the BTC price fell from $87,848 to $87,423, losing 0.48% of its value. The fact that reserve movements remained quite limited during this period of flat and volatile BTC prices indicated that investors were neither strongly selling nor aggressively buying. Although there were small inflows and outflows on a daily basis, the overall picture pointed to a cautious wait-and-see attitude. In the short term, the BTC price may fluctuate within a narrow band and volatility may remain limited.
| Date | 17-Dec | 18-Dec | 19-Dec | 20-Dec | December 21 | December 22 | 23-Dec |
|---|---|---|---|---|---|---|---|
| Exchange Inflow | 44,563 | 36,131 | 29,712 | 12,562 | 13,734 | 32,633 | 33,587 |
| Exchange Outflow | 41,015 | 29,416 | 30,639 | 15,180 | 12,930 | 31,280 | 44,966 |
| Exchange Netflow | 3,549 | 6,715 | -927 | -2,618 | 804 | 1,353 | -11,379 |
| Exchange Reserve | 2,761,030 | 2,767,745 | 2,766,818 | 2,764,200 | 2,765,004 | 2,766,357 | 2,754,978 |
| BTC Price | 87,848 | 85,471 | 88,089 | 88,333 | 88,635 | 88,559 | 87,423 |
Fees and Revenues
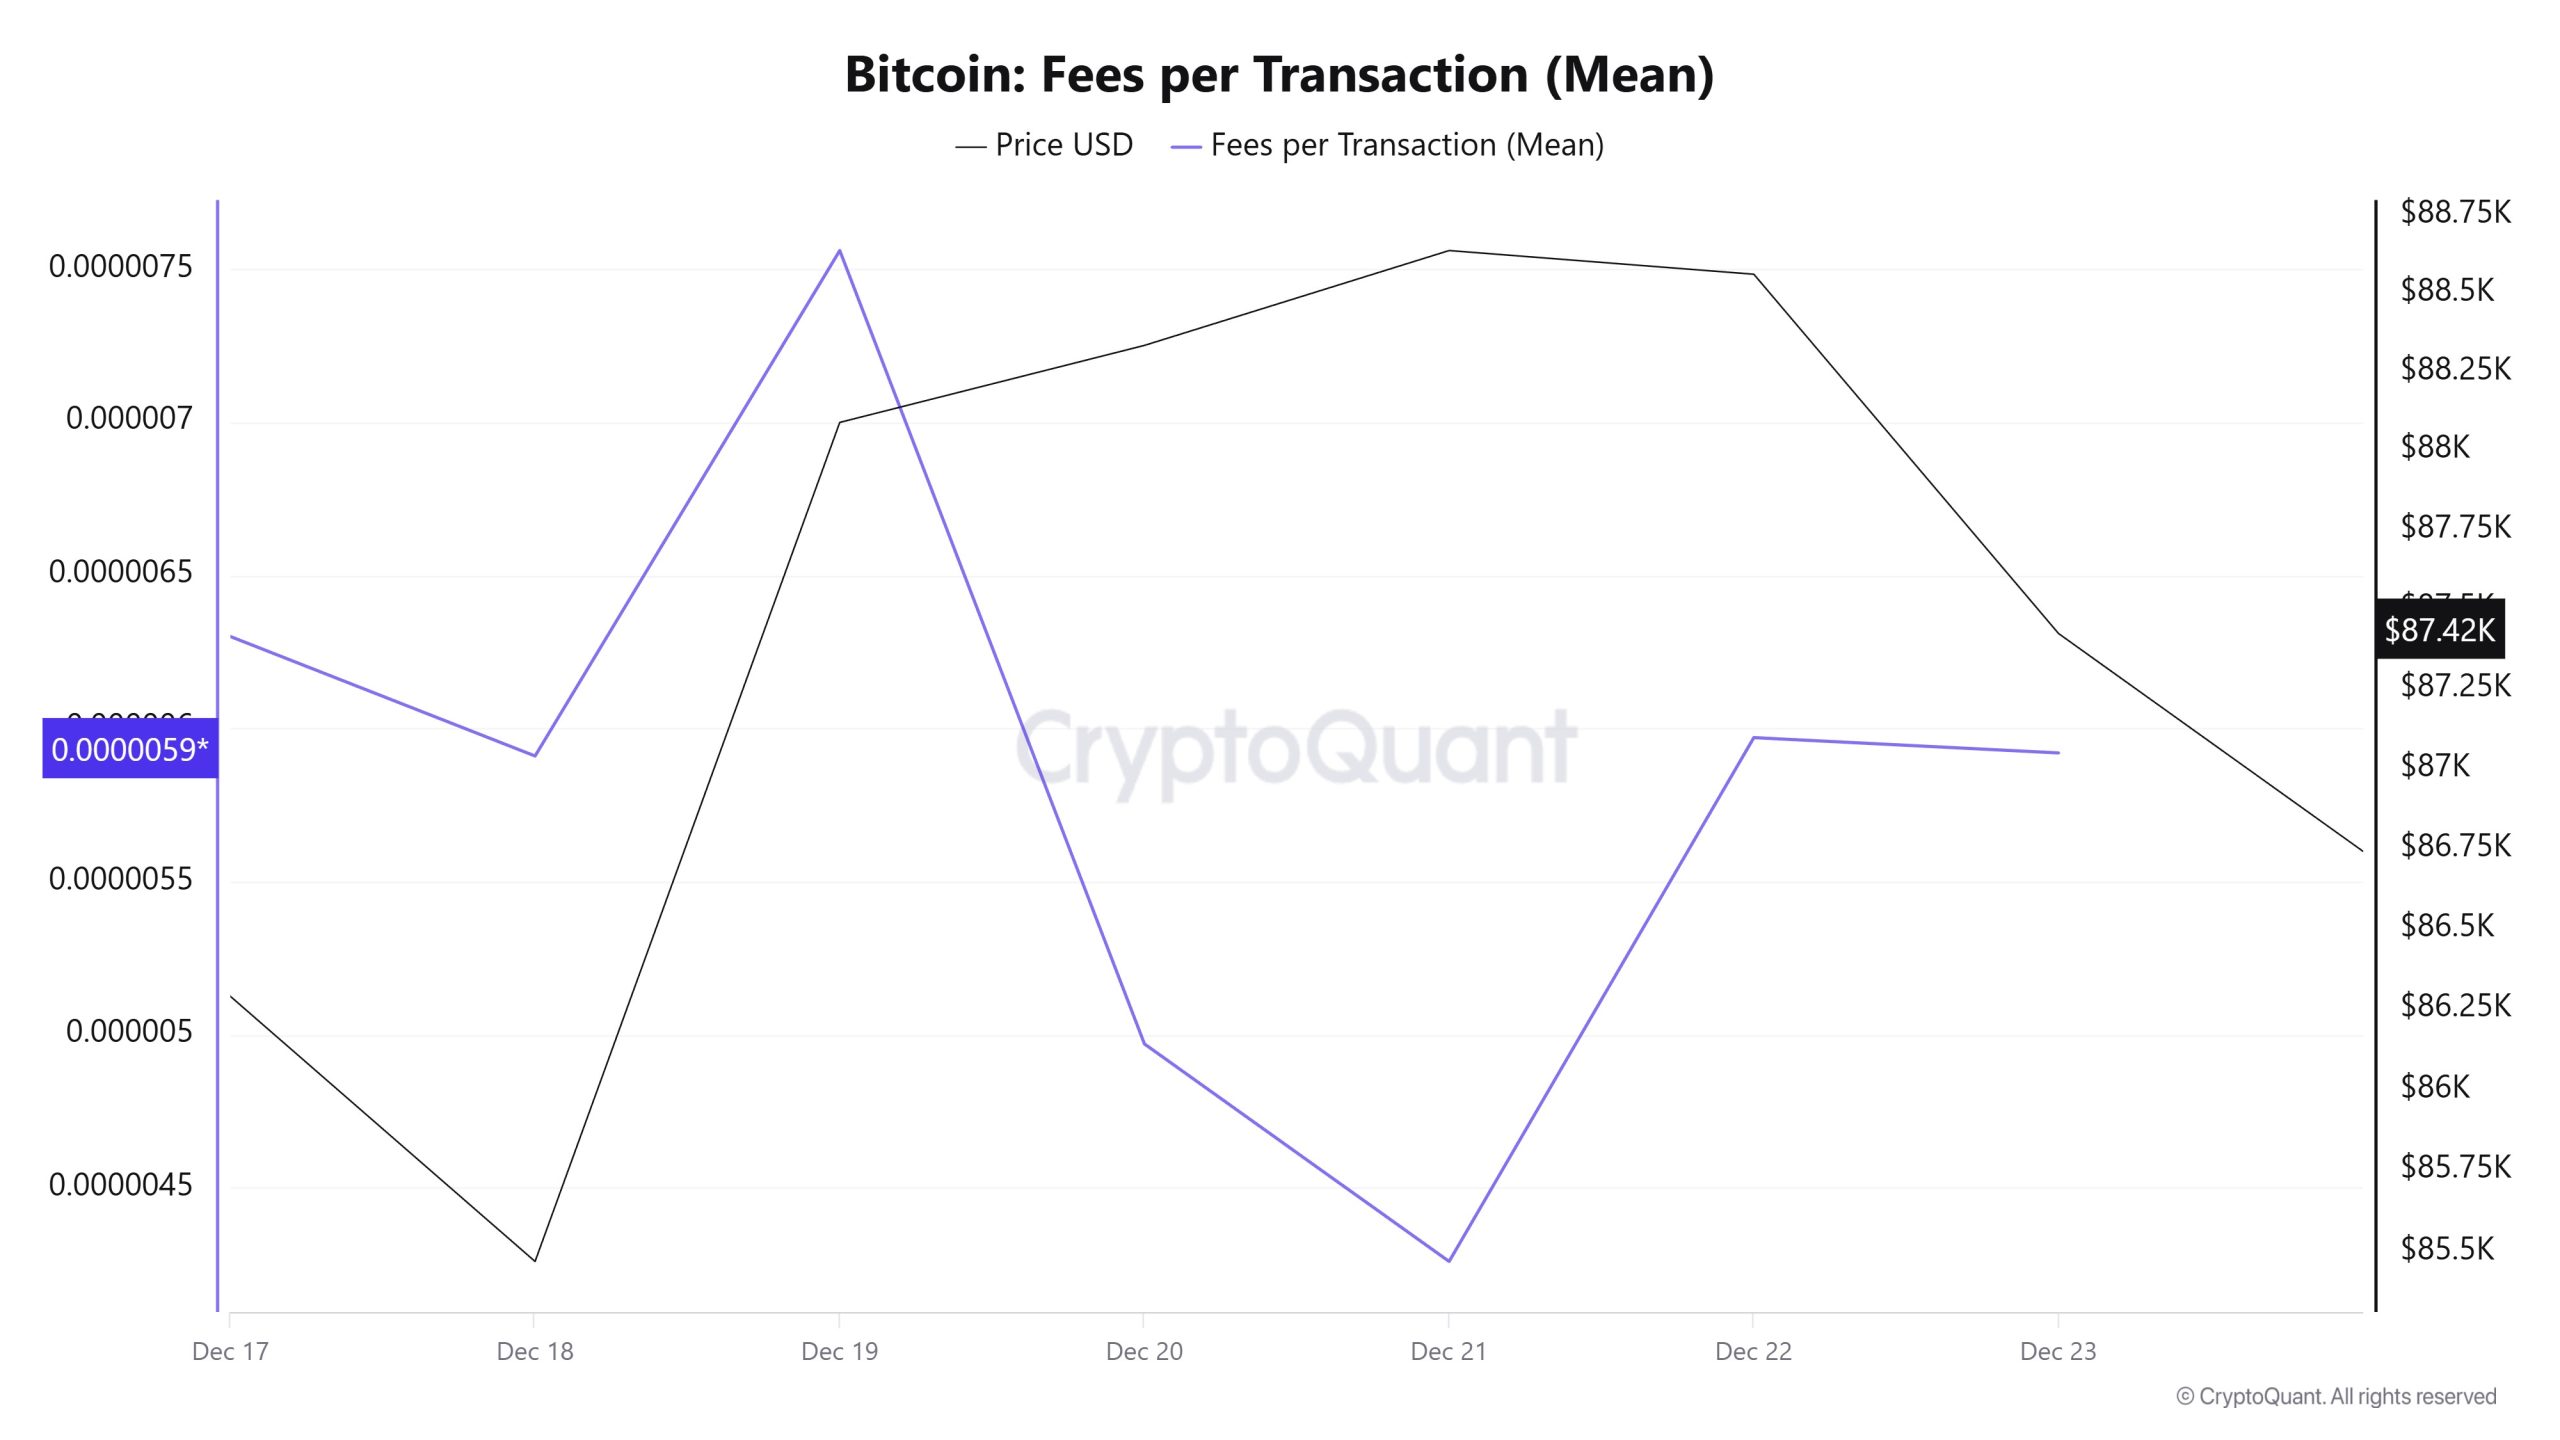
When examining the Bitcoin Fees per Transaction (Mean) data between December 17 and 23, it is seen that the indicator reached 0.0000063 on December 17, the first day of the week.
A fluctuating trend was observed until December 21, and on this date, the indicator recorded the week’s lowest value at 0.00000426.
In this context, as a result of the increase in Bitcoin price volatility as of December 21, the indicator regained momentum and followed a positive trend due to the impact of price volatility.
On December 23, the last day of the weekly period, the indicator closed the week at 0.00000592 .
Bitcoin: Fees (Total)
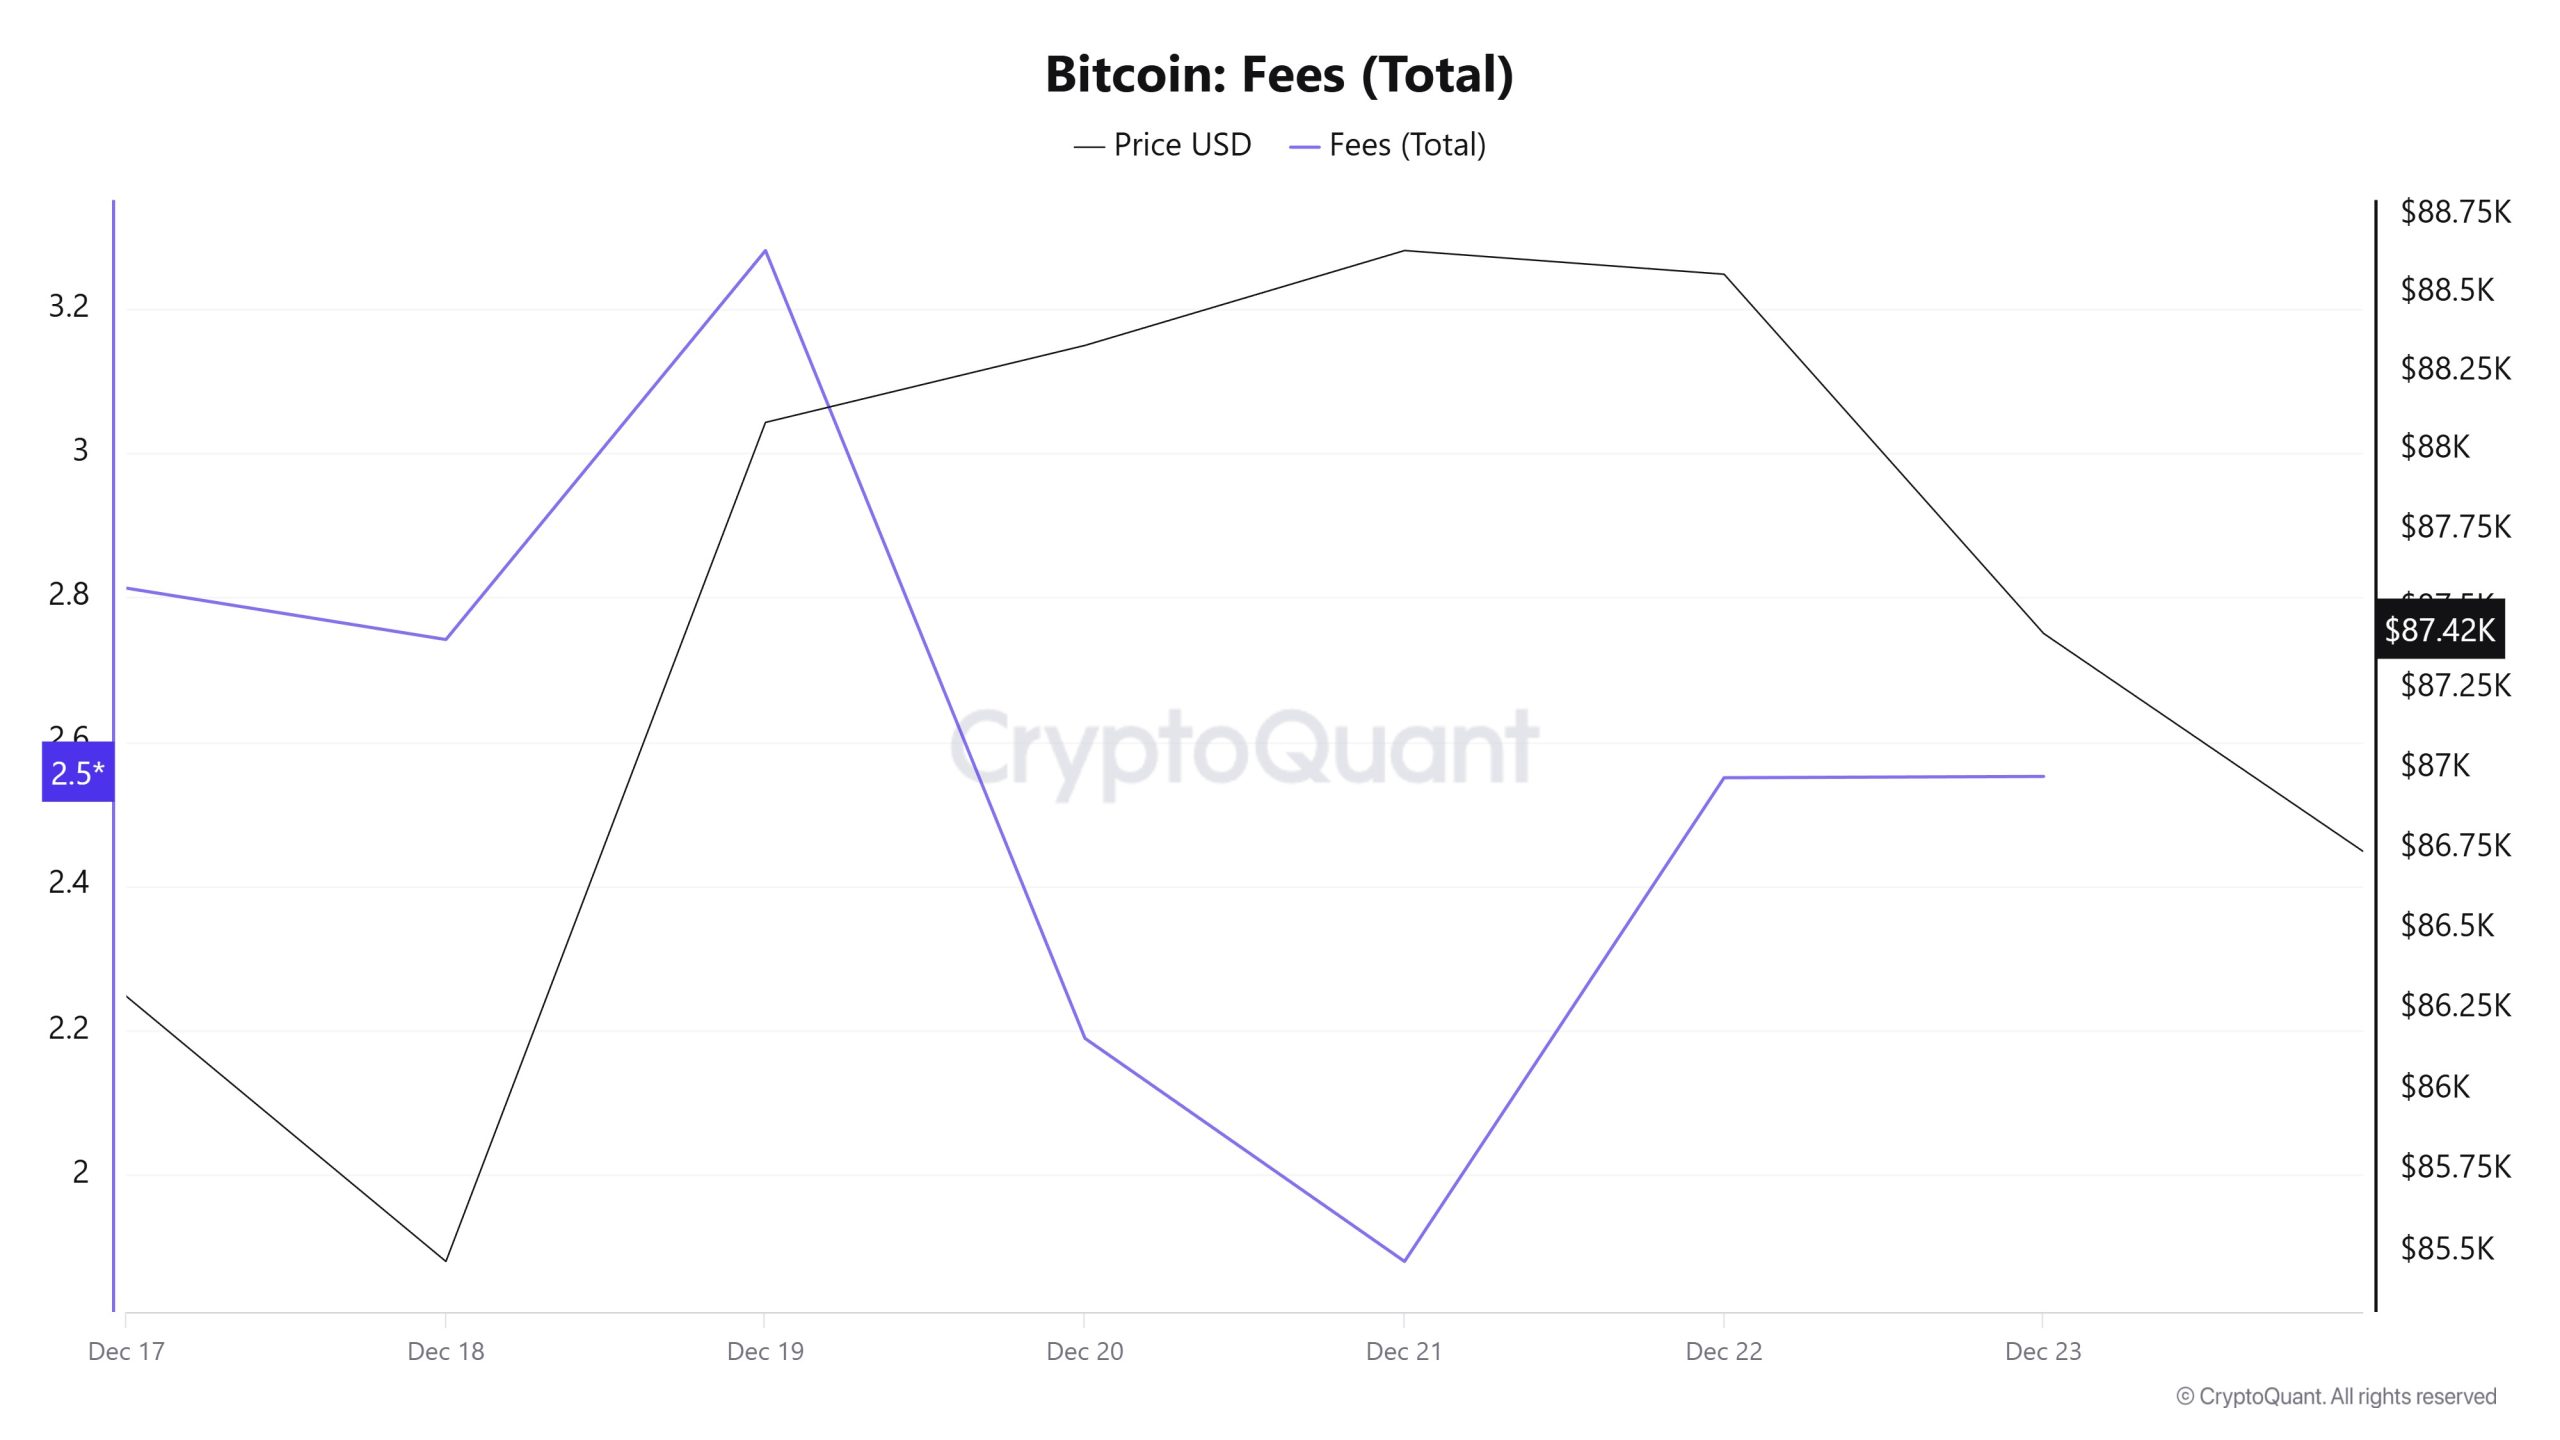
Similarly, when examining the Bitcoin Fees (Total) data for the period between December 17 and 23, it is observed that the indicator reached 2.81297801 on December 17, the first day of the week.
A fluctuating trend was observed until December 21, and on this date, the indicator recorded the week’s lowest value at 1.87931674.
In this context, as a result of the increase in Bitcoin price volatility as of December 21, the indicator regained momentum and followed a positive trend due to the impact of price volatility.
On December 23, the last day of the weekly period, the indicator closed the week at 2.55184313.
Miner Flows
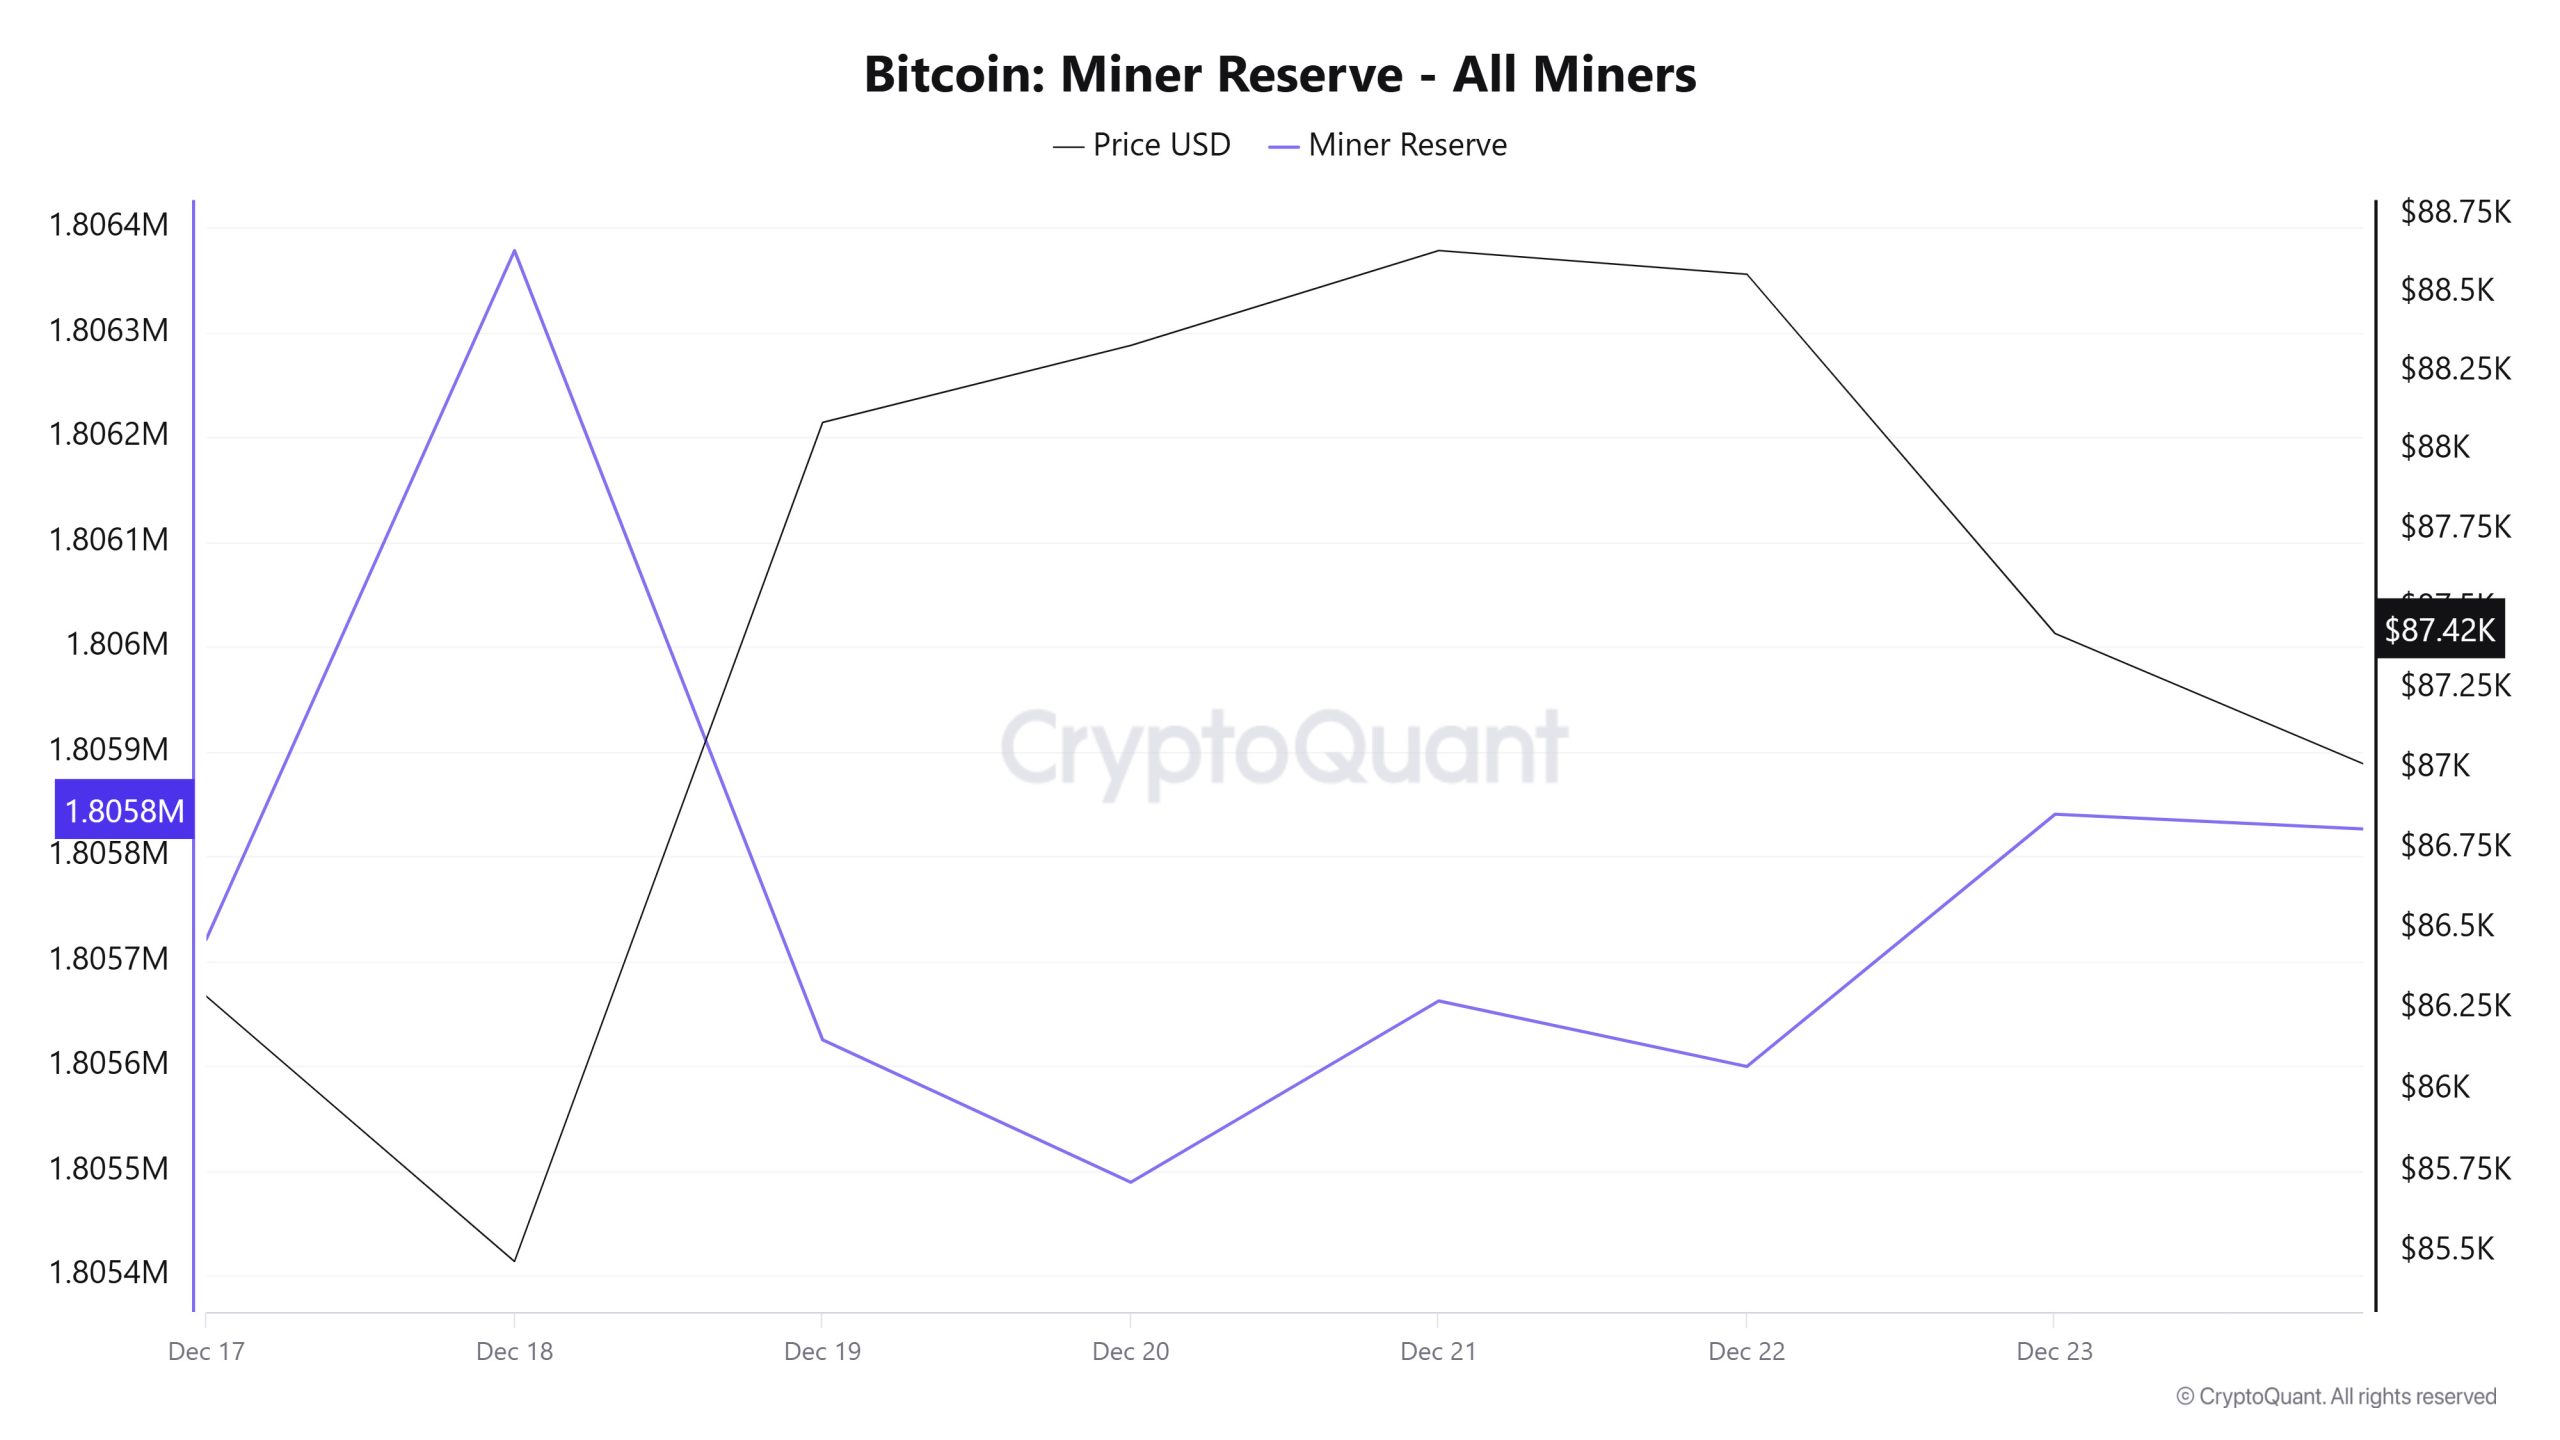
According to data obtained from the Miner Reserve table, an increase in Bitcoin reserves held in miners’ wallets was observed this week. A time-dependent correlation structure between the Bitcoin price and miner reserve was observed during the period under review. However, the general trend reveals that a negative correlation between these two variables is dominant.
Miner Inflow, Outflow, and Netflow
Between December 17 and 23, 49,269 Bitcoin were withdrawn from miners’ wallets, while 49,694 Bitcoin were deposited into miner wallets during the same period. This week’s Miner Netflow was 425 Bitcoin. Meanwhile, the Bitcoin price was $86,289 on December 17 and $87,422 on December 23.
Throughout the week, Bitcoin inflows into miner wallets (Miner Inflow) exceeded Bitcoin outflows from miner wallets (Miner Outflow), resulting in a positive net flow (Miner Netflow).
| Date | Dec. 17 | Dec. 18 | Dec. 19 | Dec. 20 | Dec. 21 | Dec. 22 | Dec. 23 |
|---|---|---|---|---|---|---|---|
| Miner Inflow | 11,450.44 | 9,510.92 | 9,169.01 | 3,401.77 | 3,075.42 | 5,734.42 | 7,352.32 |
| Miner Outflow | 11,144.98 | 8,853.82 | 9,922.28 | 3,537.70 | 2,902.33 | 5,796.97 | 7,111.59 |
| Miner Netflow | 305.45 | 657.10 | -753.27 | -135.93 | 173.09 | -62.55 | 240.73 |
Transaction
![]()
Last week, 3,219,177 transactions took place on the Bitcoin network, while this week the number of transactions fell to 3,083,855, recording a decrease of approximately 4.2%. The highest transaction volume of the week was recorded on December 18 at 463,737, while the lowest transaction volume was measured on December 22 at 427,138.
Looking at the transaction count graph, it can be seen that the number of transactions on weekends (Saturday/Sunday) is quite close to each other, and the total number of transactions on these days exceeds that of Friday and Monday. When this situation is evaluated in conjunction with the fact that transactions have been above average on Saturdays for approximately 7-8 weeks, it indicates that weekend transfers attributed to institutional actors and raising suspicion have now evolved to include Sundays, no longer being limited to Saturdays. Parallel to this, the possibility that network activity may have been relatively passive on Fridays and Mondays is gaining strength. Although no specific reason requiring these transactions to be carried out specifically on weekends has yet been clearly observed on the network, it can be interpreted that there has been a change in the behavior patterns of the usual suspects based on daily transaction numbers.
Although the relationship between transaction count and price remained largely balanced throughout the period, it was observed that the correlation, which was negatively weighted at the beginning of the period, turned positive towards the end of the period, restoring balance. Within this relatively balanced correlation structure, the data point that clearly stands out in terms of the effect of network activity on price is the increase in transaction numbers coinciding with the sudden drop in the price of on December 18. In this context, it can be assessed that the trigger for the negative correlation at the beginning of the period was most likely the transactions that came through the network on December 18, creating selling pressure.
Tokens Transferred
While a total of 5,758,407 BTC was transferred in the previous period, this week the volume fell by 7.45% to 5,329,609 BTC. The highest daily transfer volume of the week was recorded on December 17 at 881,609 BTC, while the lowest daily volume was recorded on December 21 at 530,442 BTC. The correlation between the amount of BTC transferred and the price showed a closer relationship throughout the period, with a mostly negative trend.
The simultaneous decrease in both the amount of Bitcoin transferred and the number of transactions indicates that smaller, more fragmented transactions gained prominence during this period. This structure indicates that a greater number of relatively small transfers took place on the network and that the impact of these movements on the price became more pronounced during this period. In addition, the fact that the price has been declining for some time, along with the decline in both the number of transfers and the total amount of BTC transferred, shows that the network activity-price relationship has clearly shifted to the negative side.
Whale Activities
Whale Data:
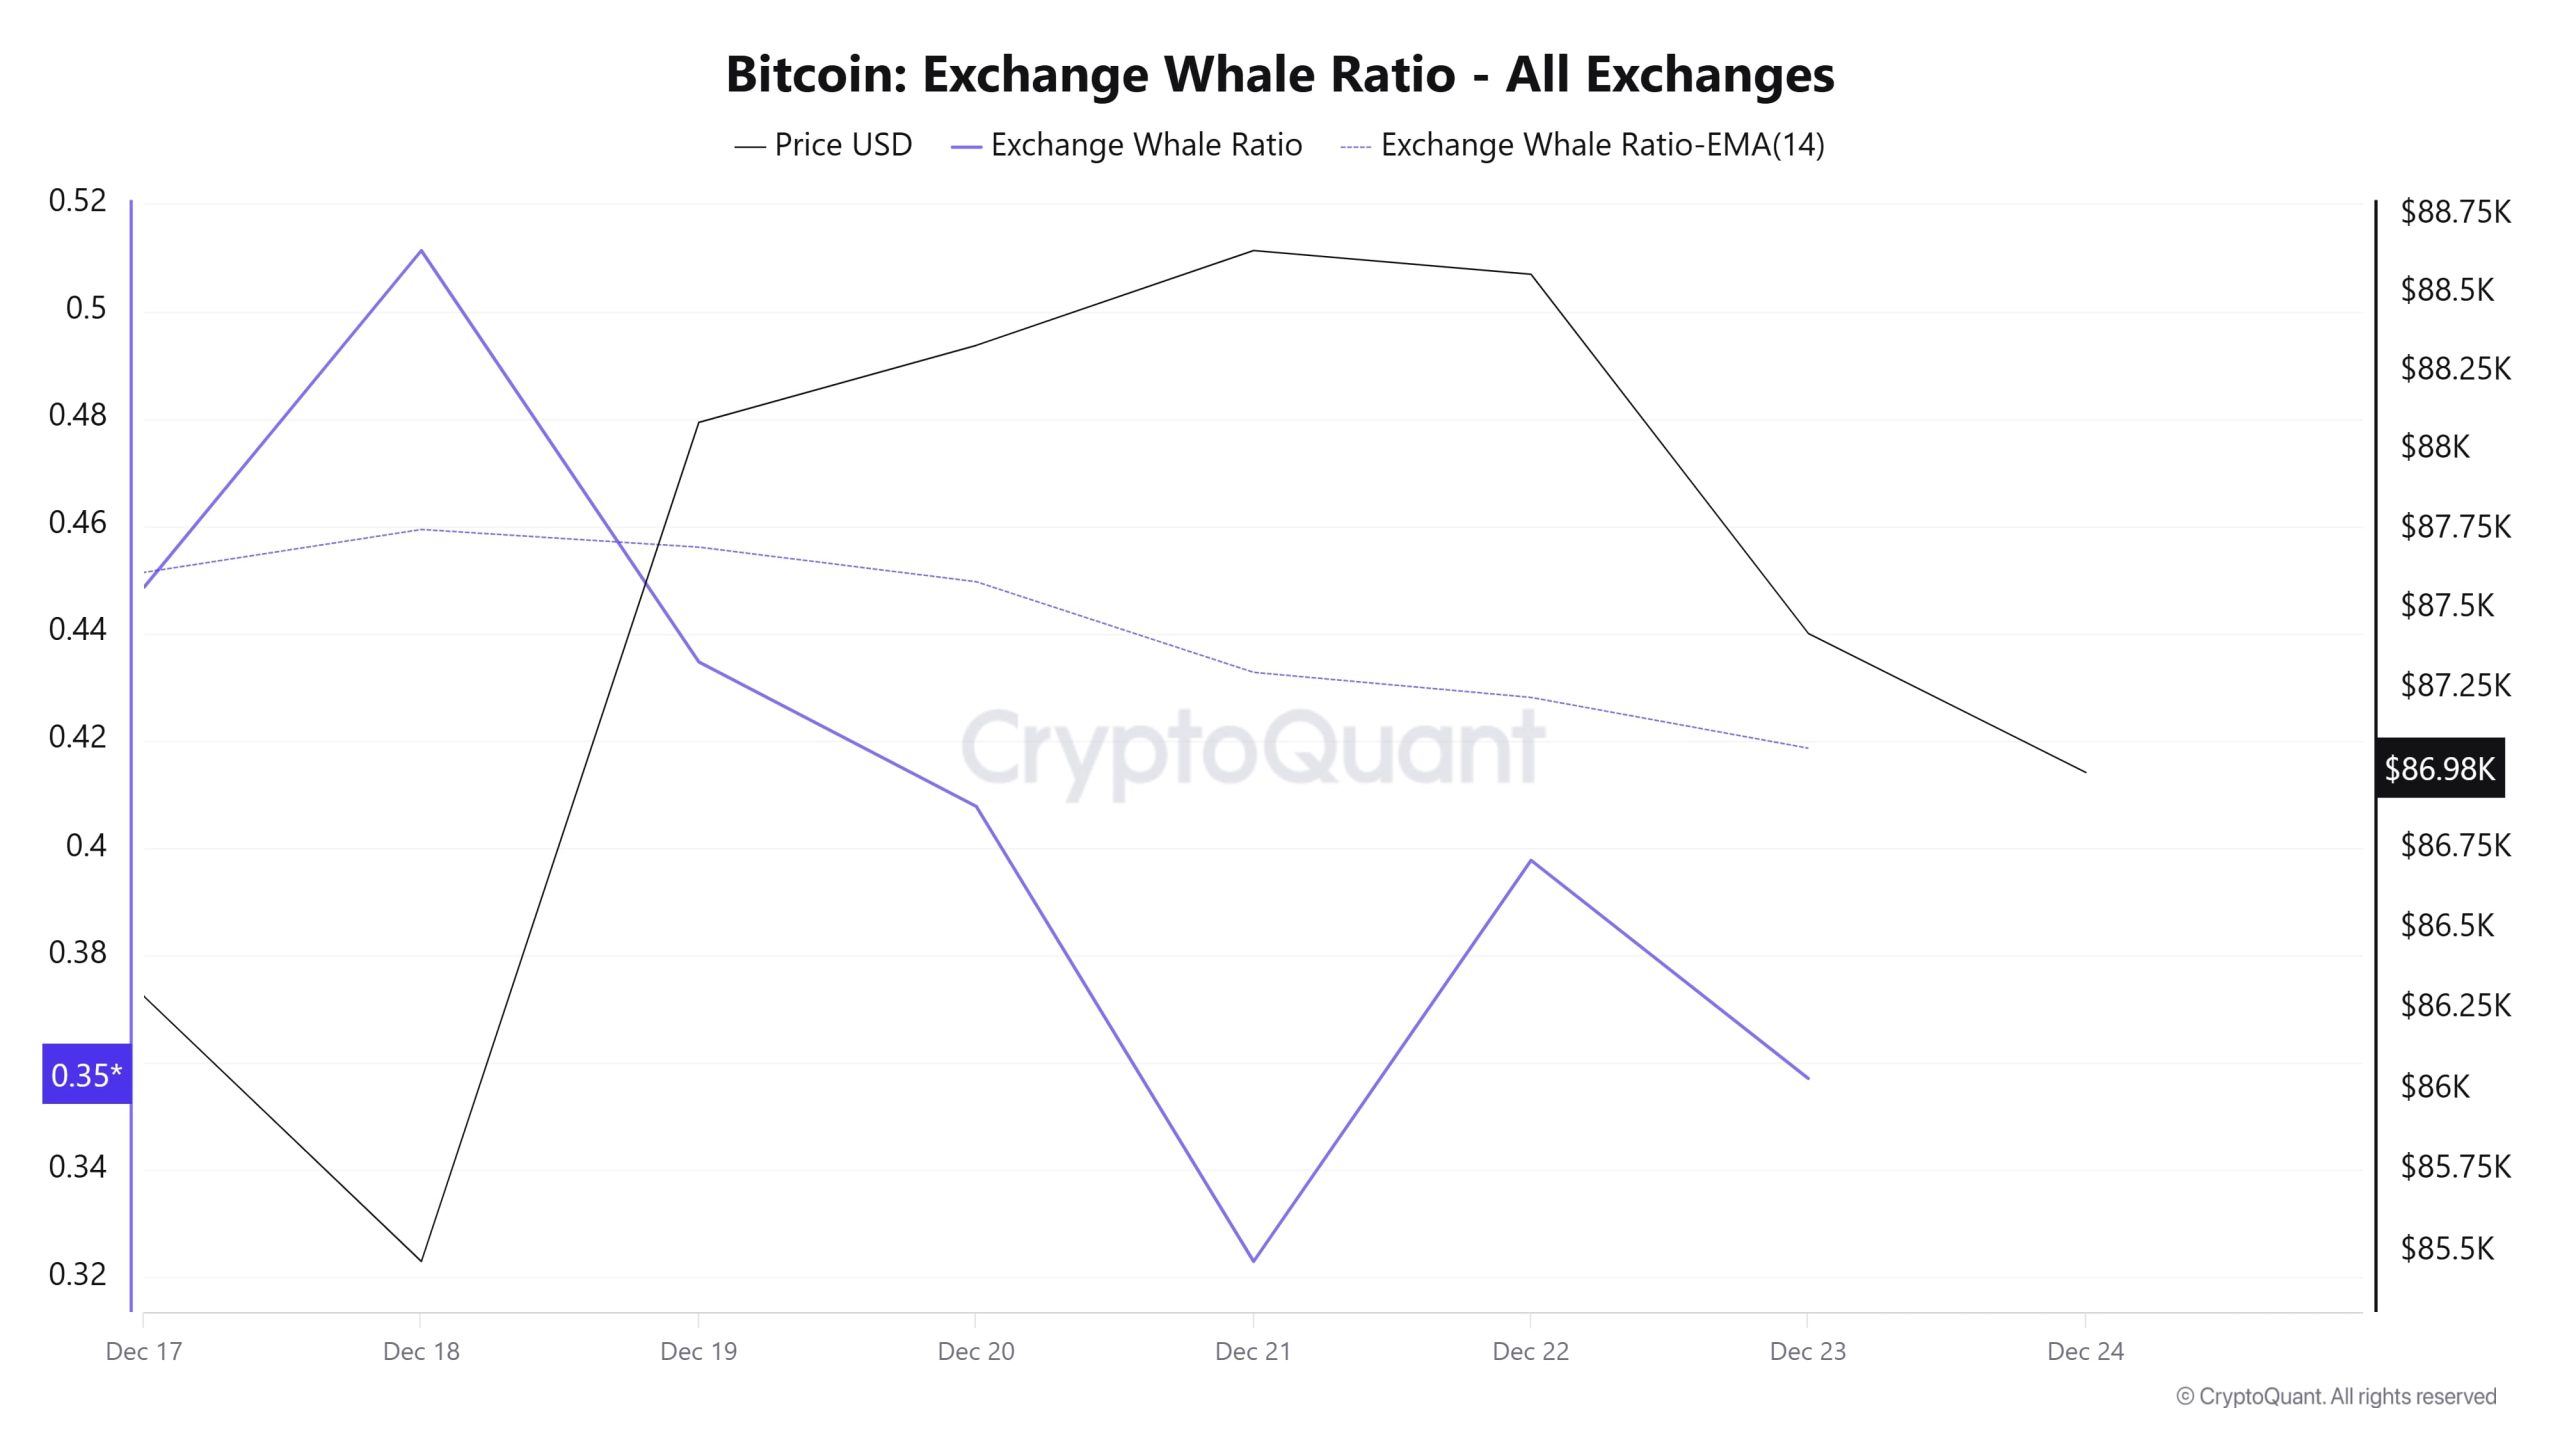
Looking at whale activity on centralized exchanges over the last 7 days based on crypto market data, we can say that centralized exchanges, which were heavily used at the beginning of the process, have entered a downward trend for the remainder of the process, and activity on centralized exchanges has decreased. Looking at the Exchange Whale Ratio metric, on December 17, the first day of the 7-day period, the ratio of whales using centralized exchanges was 0.448. On December 11, the second day of the process, it reached its peak, reaching a value of 0.511. The metric then declined, reaching its lowest point on December 21 at 0.322. When this ratio is above the 0.35–0.45 range, it generally indicates that whales are frequently using centralized exchanges. Currently at 0.356, the metric corresponds to a time when whales are using centralized exchanges less frequently during the process. During this period, the price fluctuated between $90,300 and $84,500. This signaled that the selling side prevailed in the trading battle between whales on centralized exchanges. At the same time, total BTC transfers increased by 7% compared to last week, with 5,329,609 BTC moving. Data shows that this year, bitcoin whale sales reached a record level of $15 billion. This indicates that whales holding BTC sold 161,294 BTC. These sales occurred not after prices bottomed out, but before deeper market corrections. As a result, we can say that very large whales caused BTC to lose value and that the market’s pessimistic attitude continues even though sales have decreased.
BTC Onchain Overall
| Metric | Positive 📈 | Negative 📉 | Neutral ➖ |
|---|---|---|---|
| Active Addresses | ✓ | ||
| Breakdowns | ✓ | ||
| Derivatives | ✓ | ||
| Supply Distribution | ✓ | ||
| Exchange Supply Ratio | ✓ | ||
| Exchange Reserve | ✓ | ||
| Fees and Revenues | ✓ | ||
| Miner Flows | ✓ | ||
| Transaction | ✓ | ||
| Whale Activity | ✓ |
- The metrics and guidance provided in the table do not alone explain or imply any expectation of future price changes for any asset. Digital asset prices can fluctuate based on many different variables. The on-chain analysis and related guidance are intended to assist investors in their decision-making process, and basing financial investments solely on the results of this analysis may lead to unfavorable outcomes. Even if all metrics produce positive, negative, or neutral results simultaneously, the expected outcomes may not materialize depending on market conditions. It would be beneficial for investors reviewing the report to take these warnings into consideration.
Legal Notice
The investment information, comments, and recommendations contained in this document do not constitute investment advisory services. Investment advisory services are provided by authorized institutions on a personal basis, taking into account the risk and return preferences of individuals. The comments and recommendations contained in this document are of a general nature. These recommendations may not be suitable for your financial situation and risk and return preferences. Therefore, making an investment decision based solely on the information contained in this document may not result in outcomes that align with your expectations.
NOTE: All data used in Bitcoin on-chain analysis is based on CryptoQuant.
