Weekly Ethereum Onchain Report – October 08
Active Addresses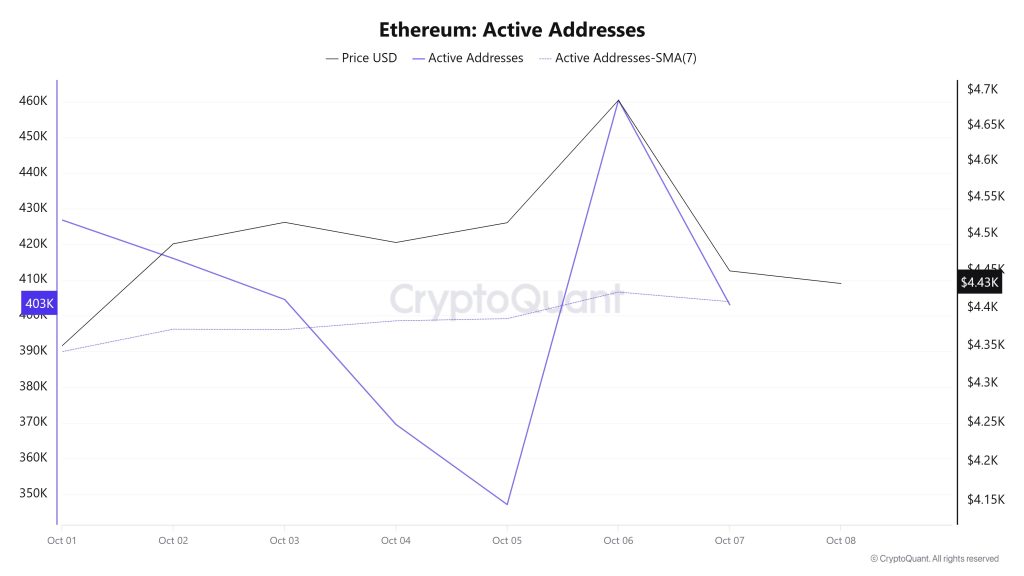
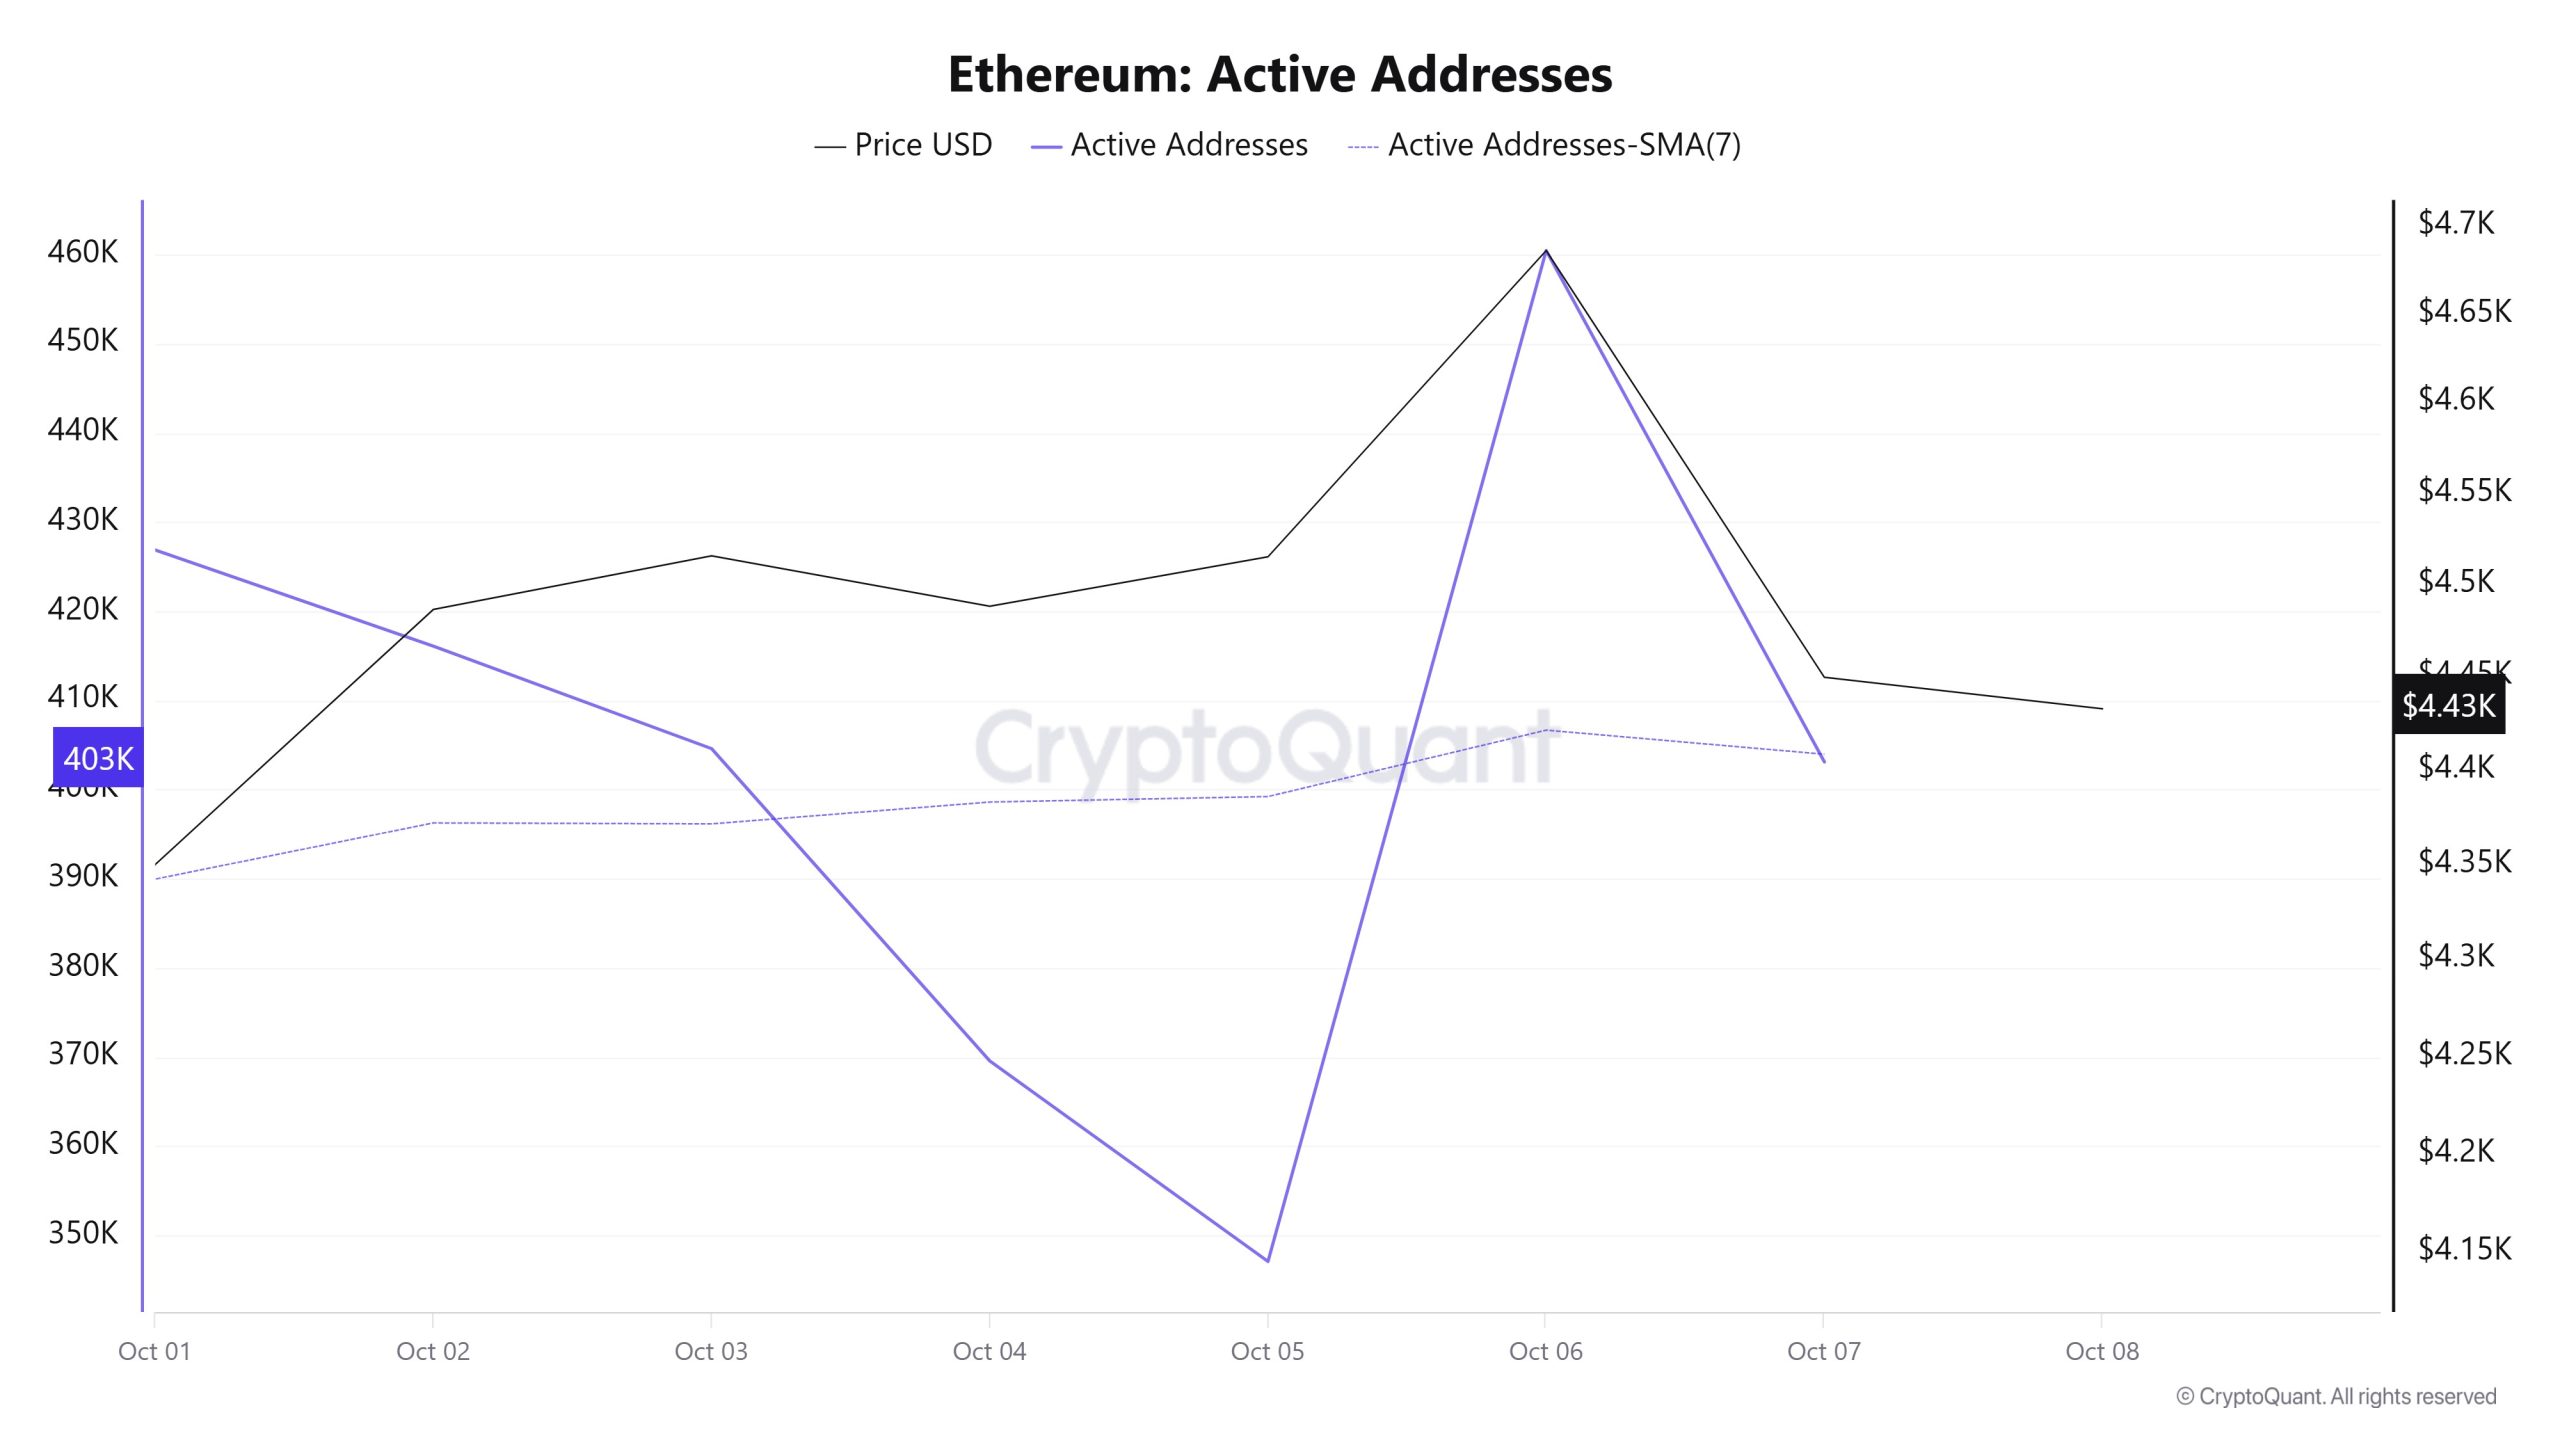
Between October 1 and October 8, a total of 460,449 active addresses were added to the Ethereum network. During this period, the Ethereum price rose from $4,349 to $4,685. Especially on September 28, at the point where the price touched the active address for the 2nd time, the price started to rise with the number of active addresses. When the 7-day simple moving average (SMA) is analyzed, it is seen that the Ethereum price is generally consolidating horizontally.
Active Sending Addresses
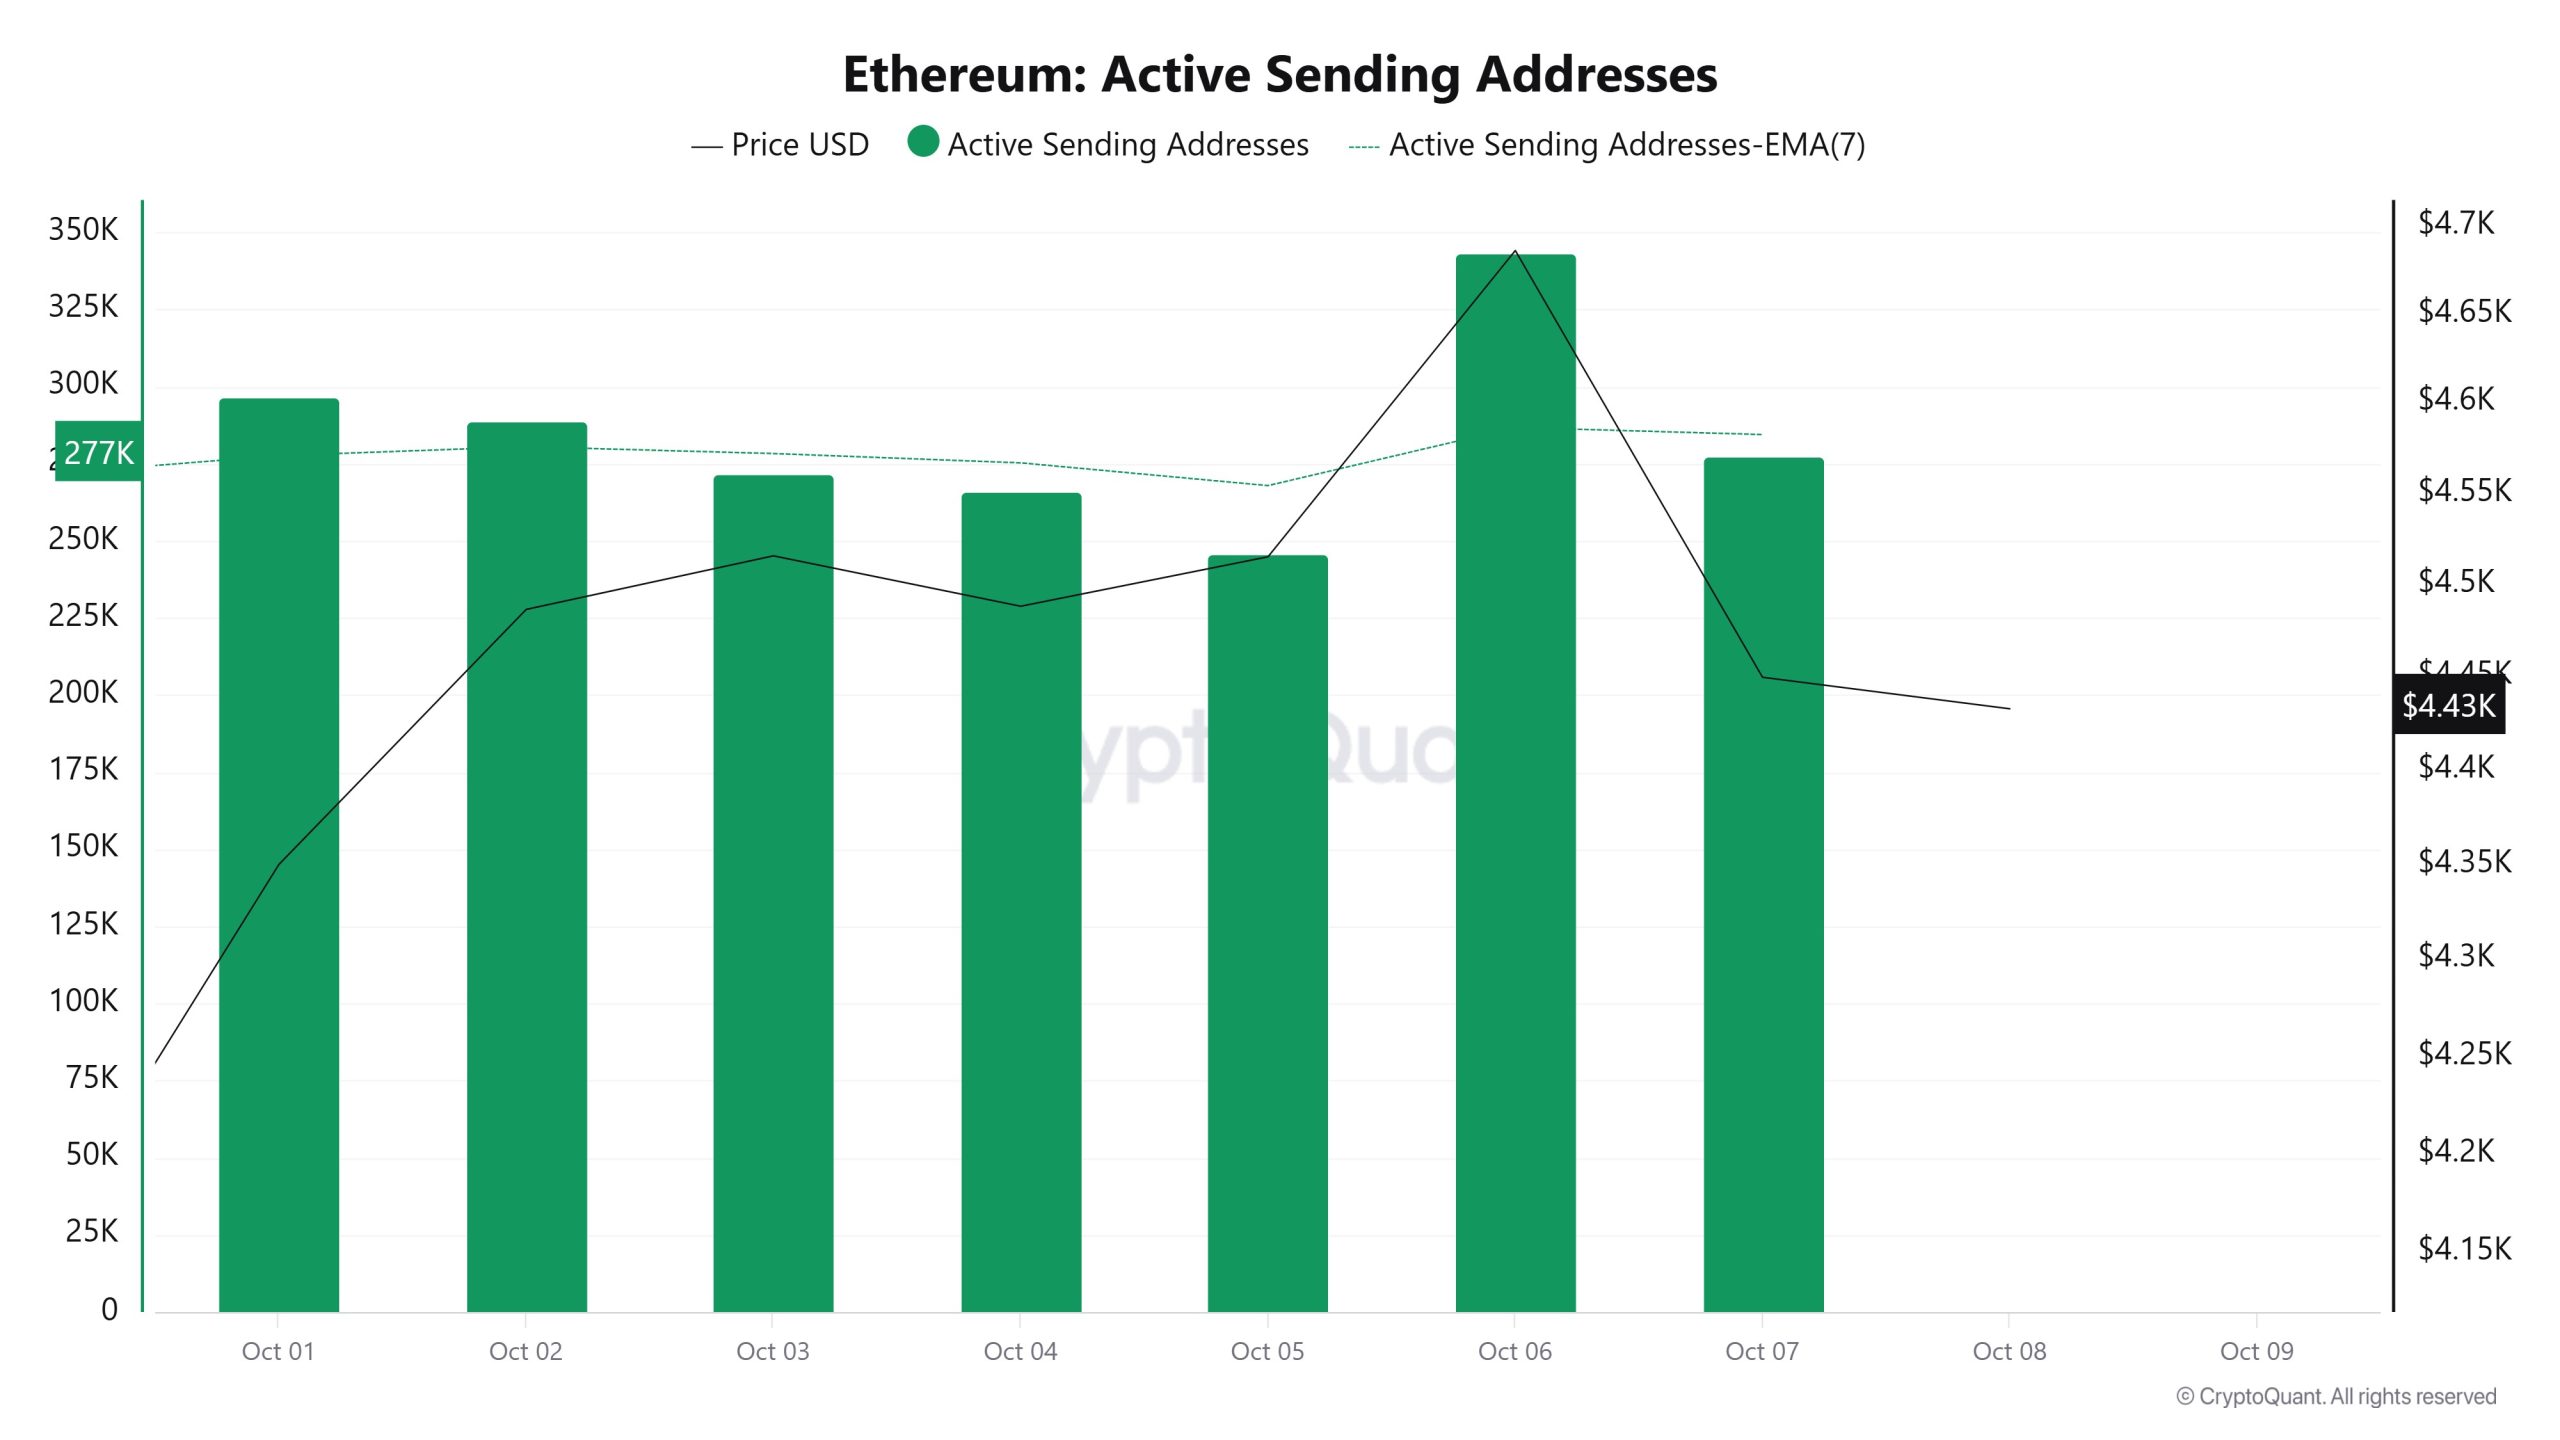
Between October 1 and October 8, a high level of active sending activity was observed along with the Black Line (price line) in active shipping addresses. On the day when the price reached a weekly high, active shipping addresses reached 343,277.
Active Receiving Addresses
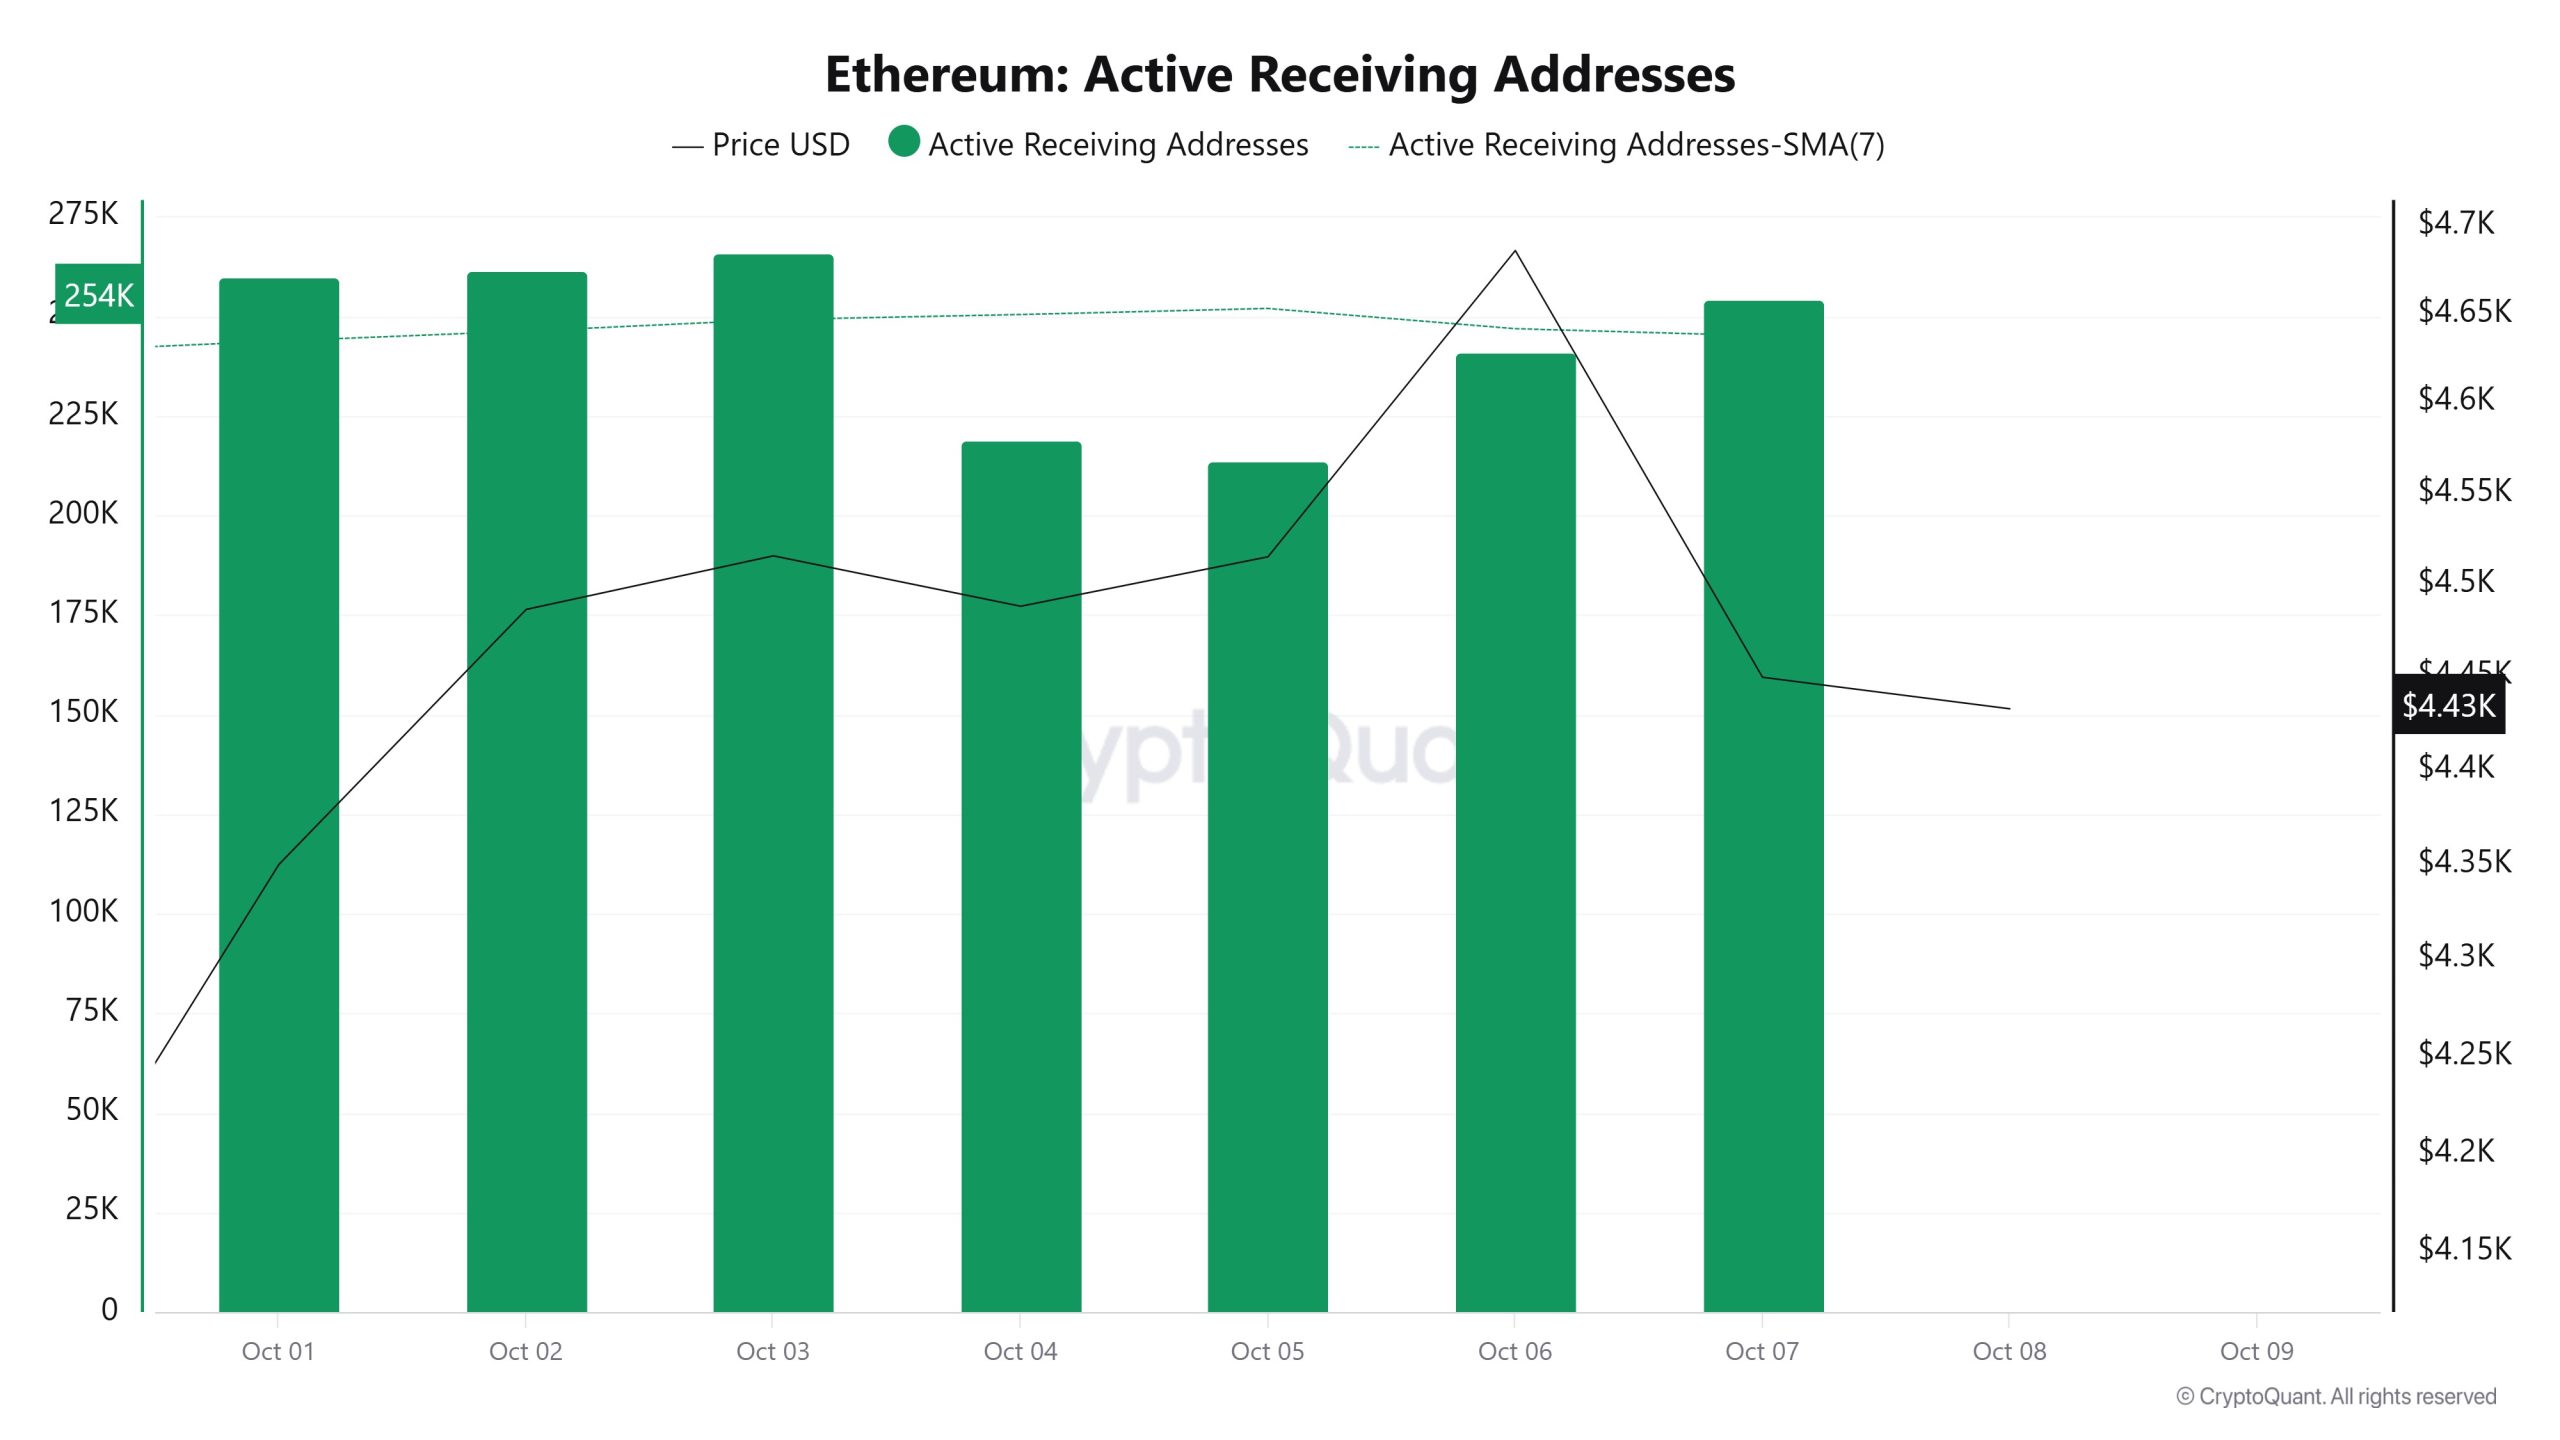
Between October 1 and October 8, there was no significant increase in active buying addresses and the price consolidated horizontally. On the day when the price reached its highest level, active receiving addresses reached 265,867, indicating that purchases are increasing.
Total Value Staked
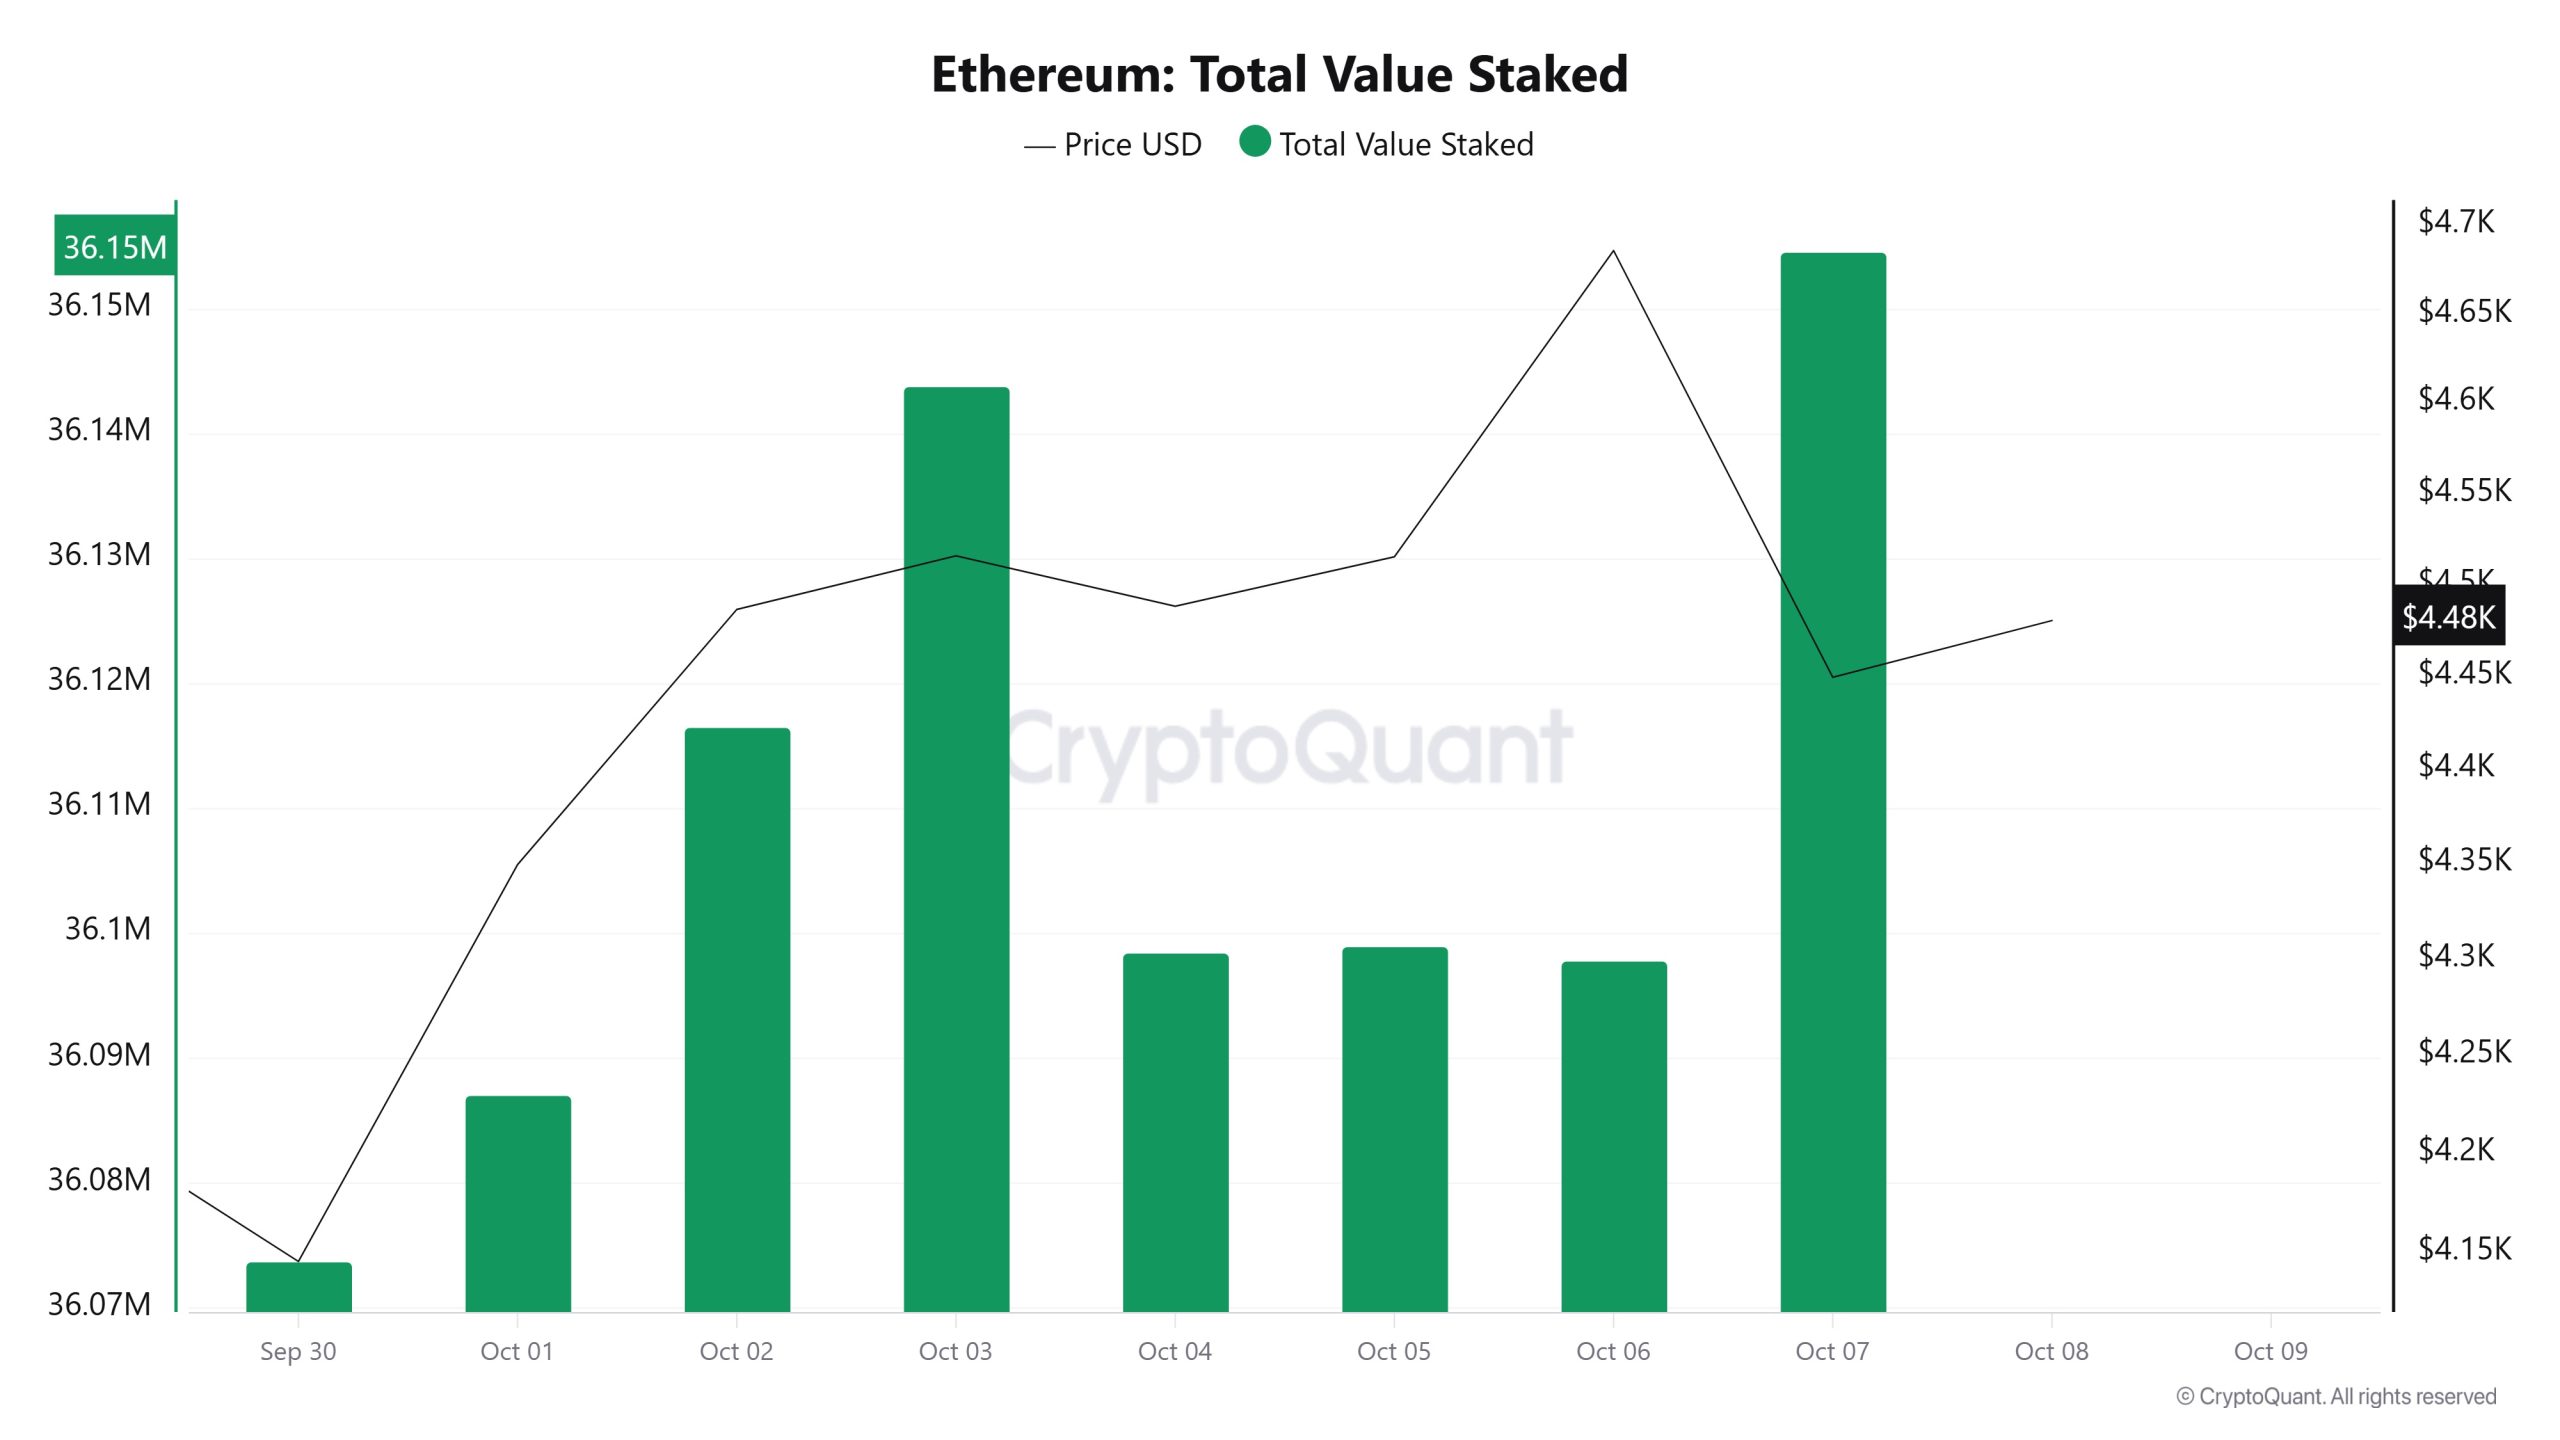
On October 1, the ETH price was at $4.349 while Total Value Staked was at 36,087,022.
As of October 7, the ETH price rose 2.30% to $4.449, while Total Value Staked increased 0.19% to 36,154,655.
Staking Inflows
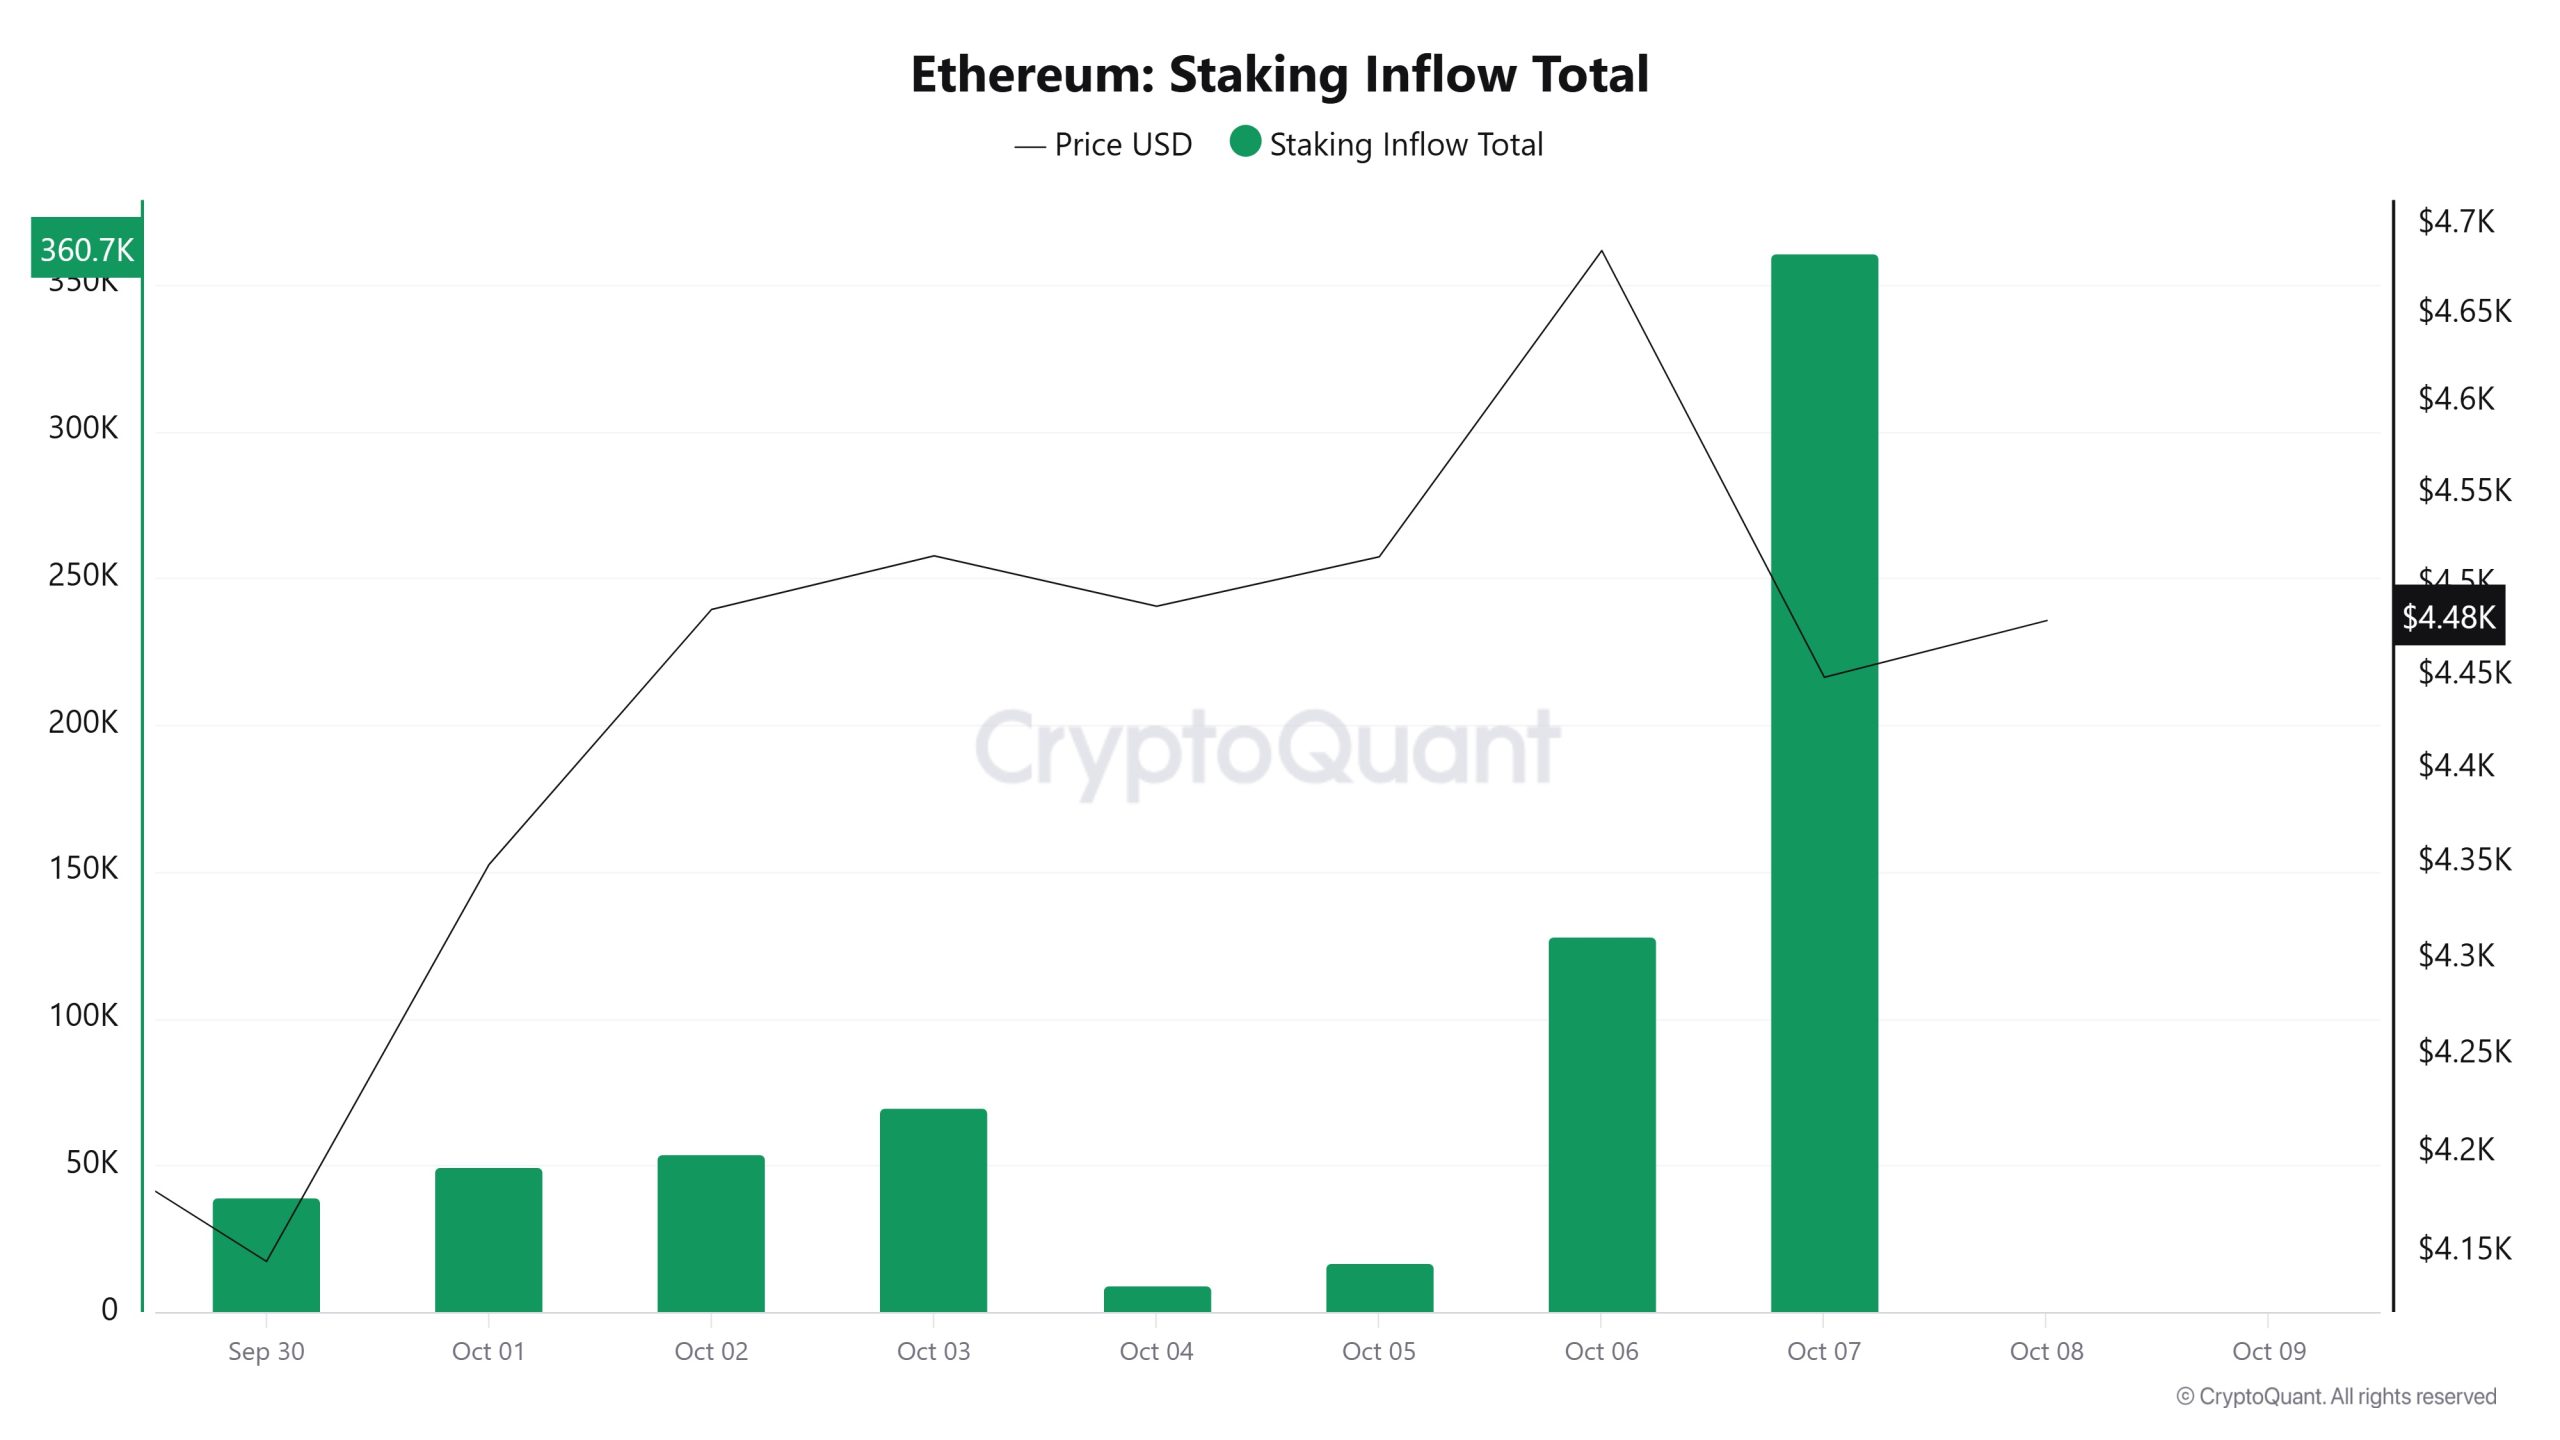
On October 1, ETH price was at $4,349 while Staking Inflow was 49,689.
As of October 7, ETH price rose to $4,449 while Staking Inflow increased by 626.0% to 360,758.
Derivatives
Open Interest
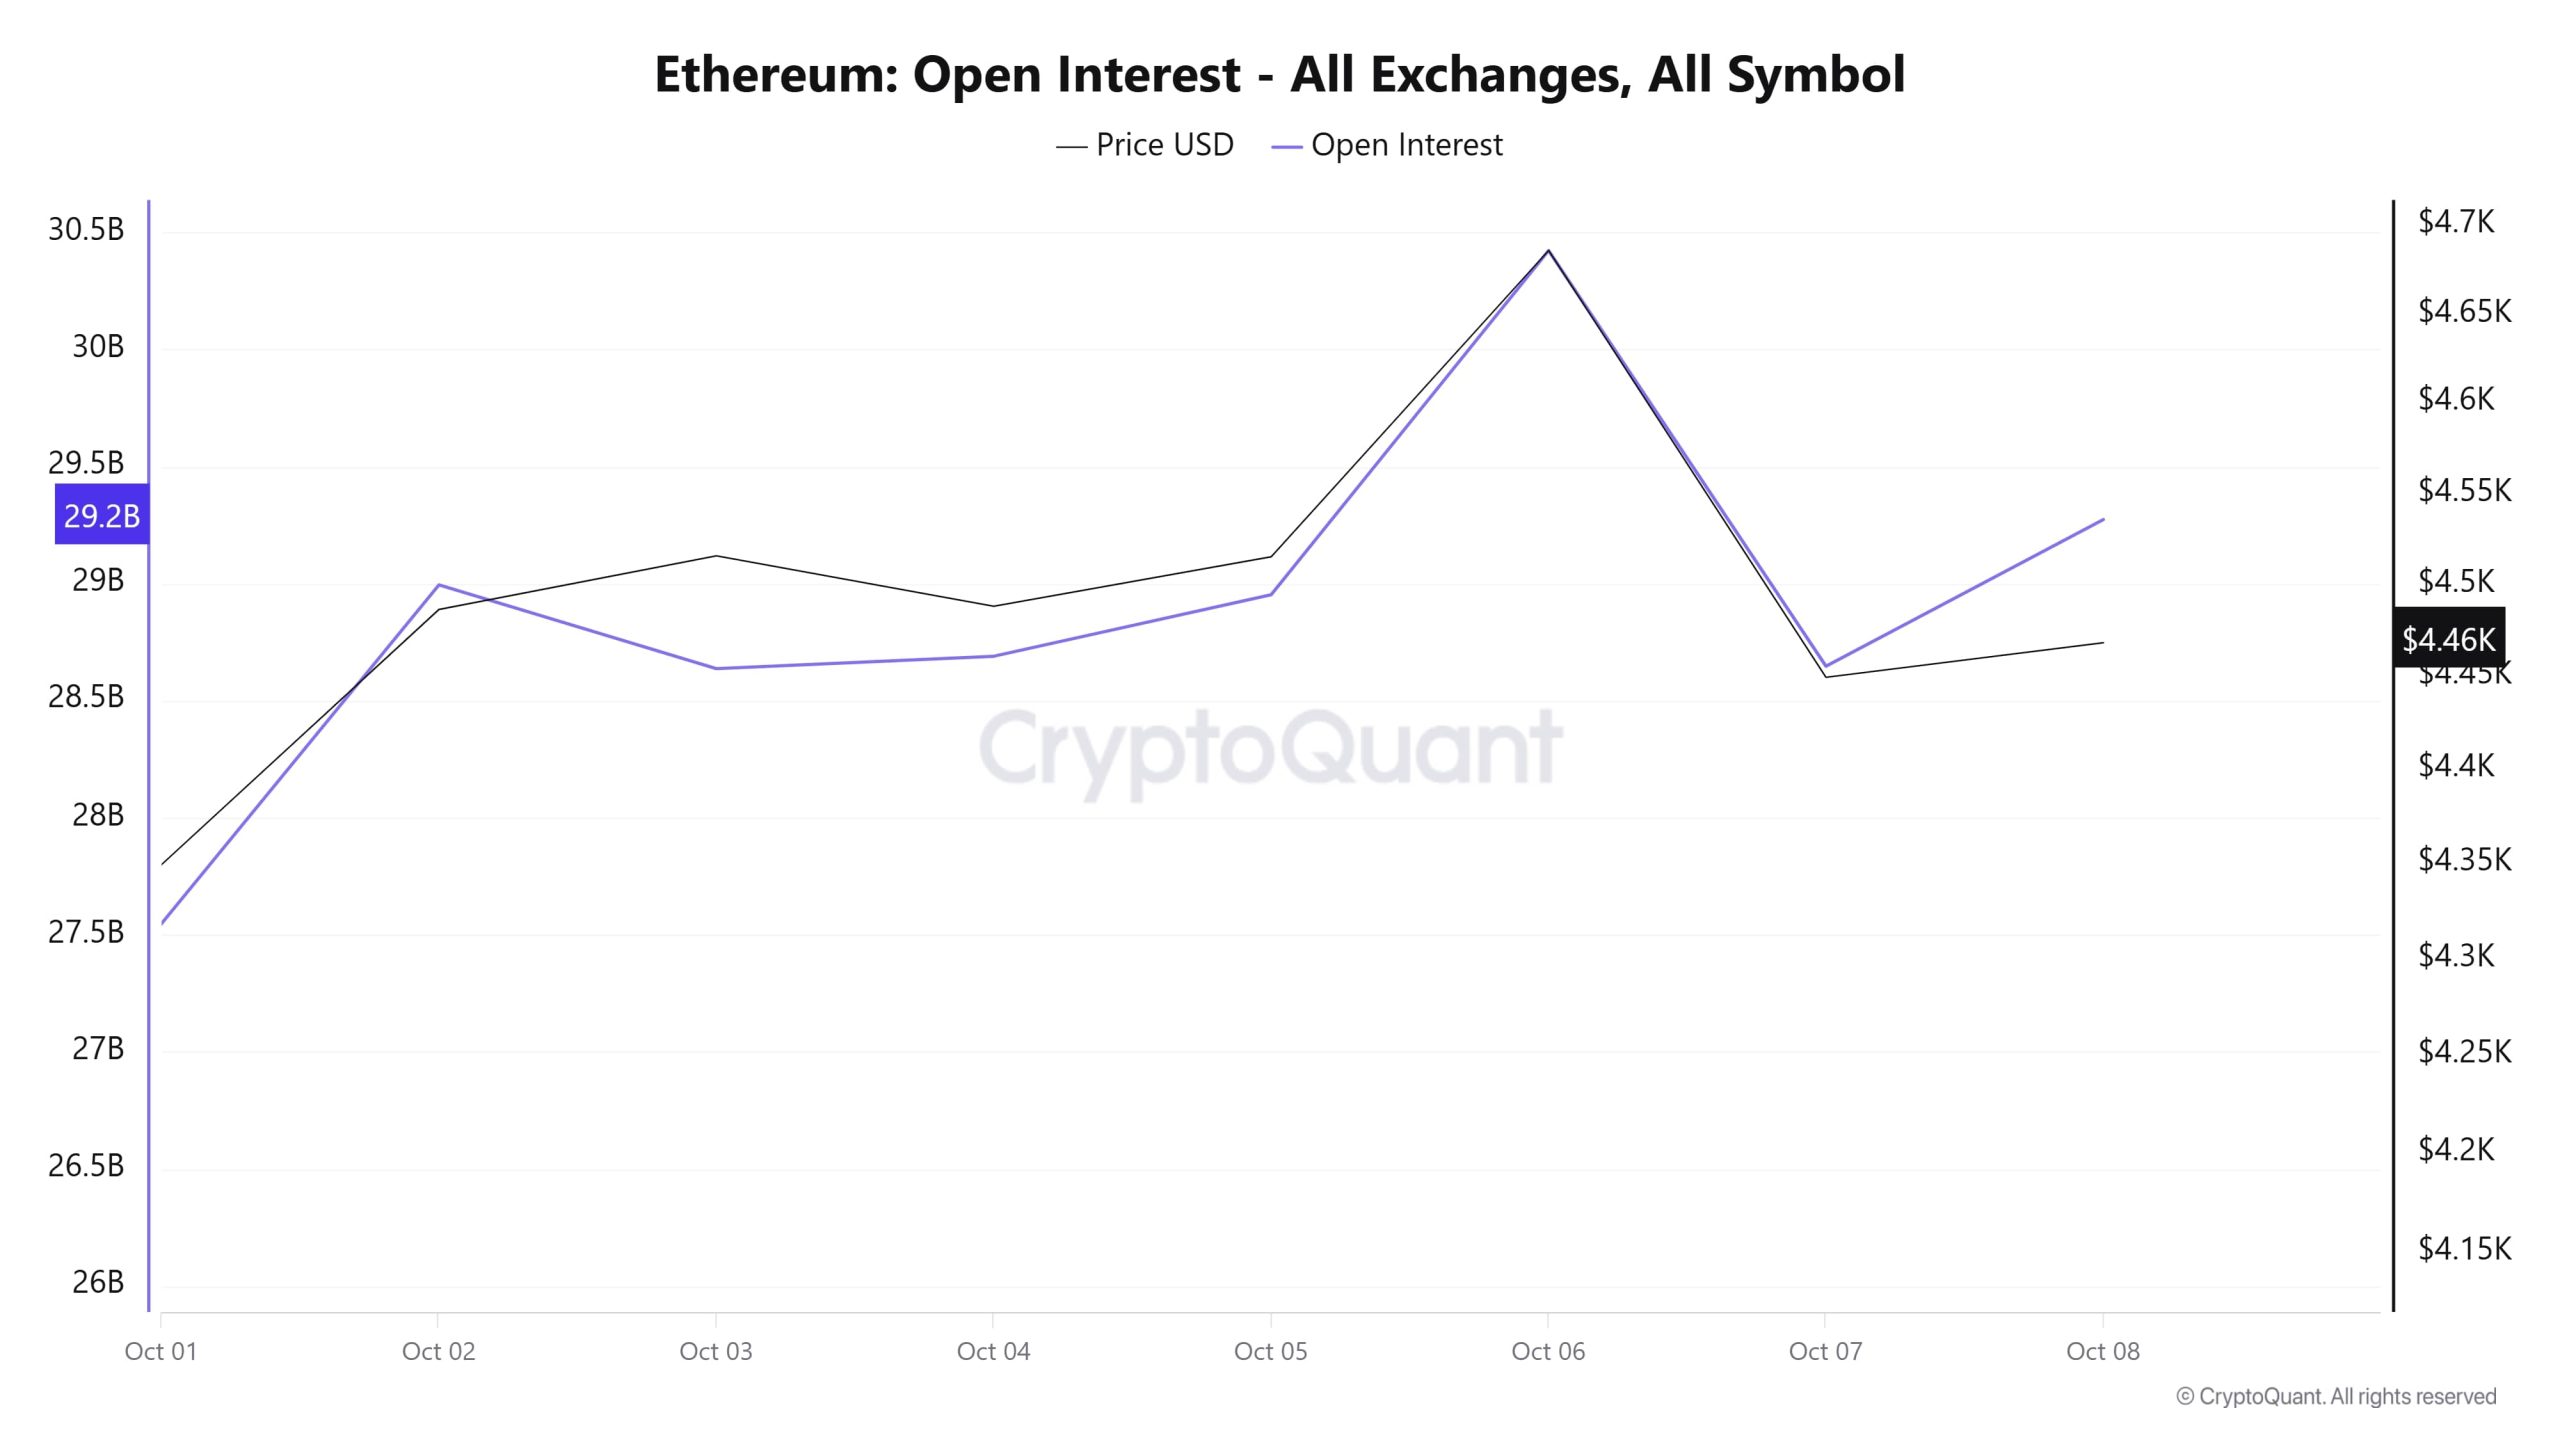
While open interest was around $27.5 billion at the beginning of the period, it rose rapidly to over $29 billion as of October 2. This upward trend is also supported by the price side in parallel. October 3 and 4 saw a slight decline in both price and open interest, while October 5-6 saw a strong rebound, with both metrics reaching their peaks. On October 7, there was a sharp decline, followed by a partial rebound on October 8. Overall, the chart shows that the increased trading appetite in the middle of the week was later dampened by price pressure and the market shifted to a cautious outlook in the short term.
Funding Rate
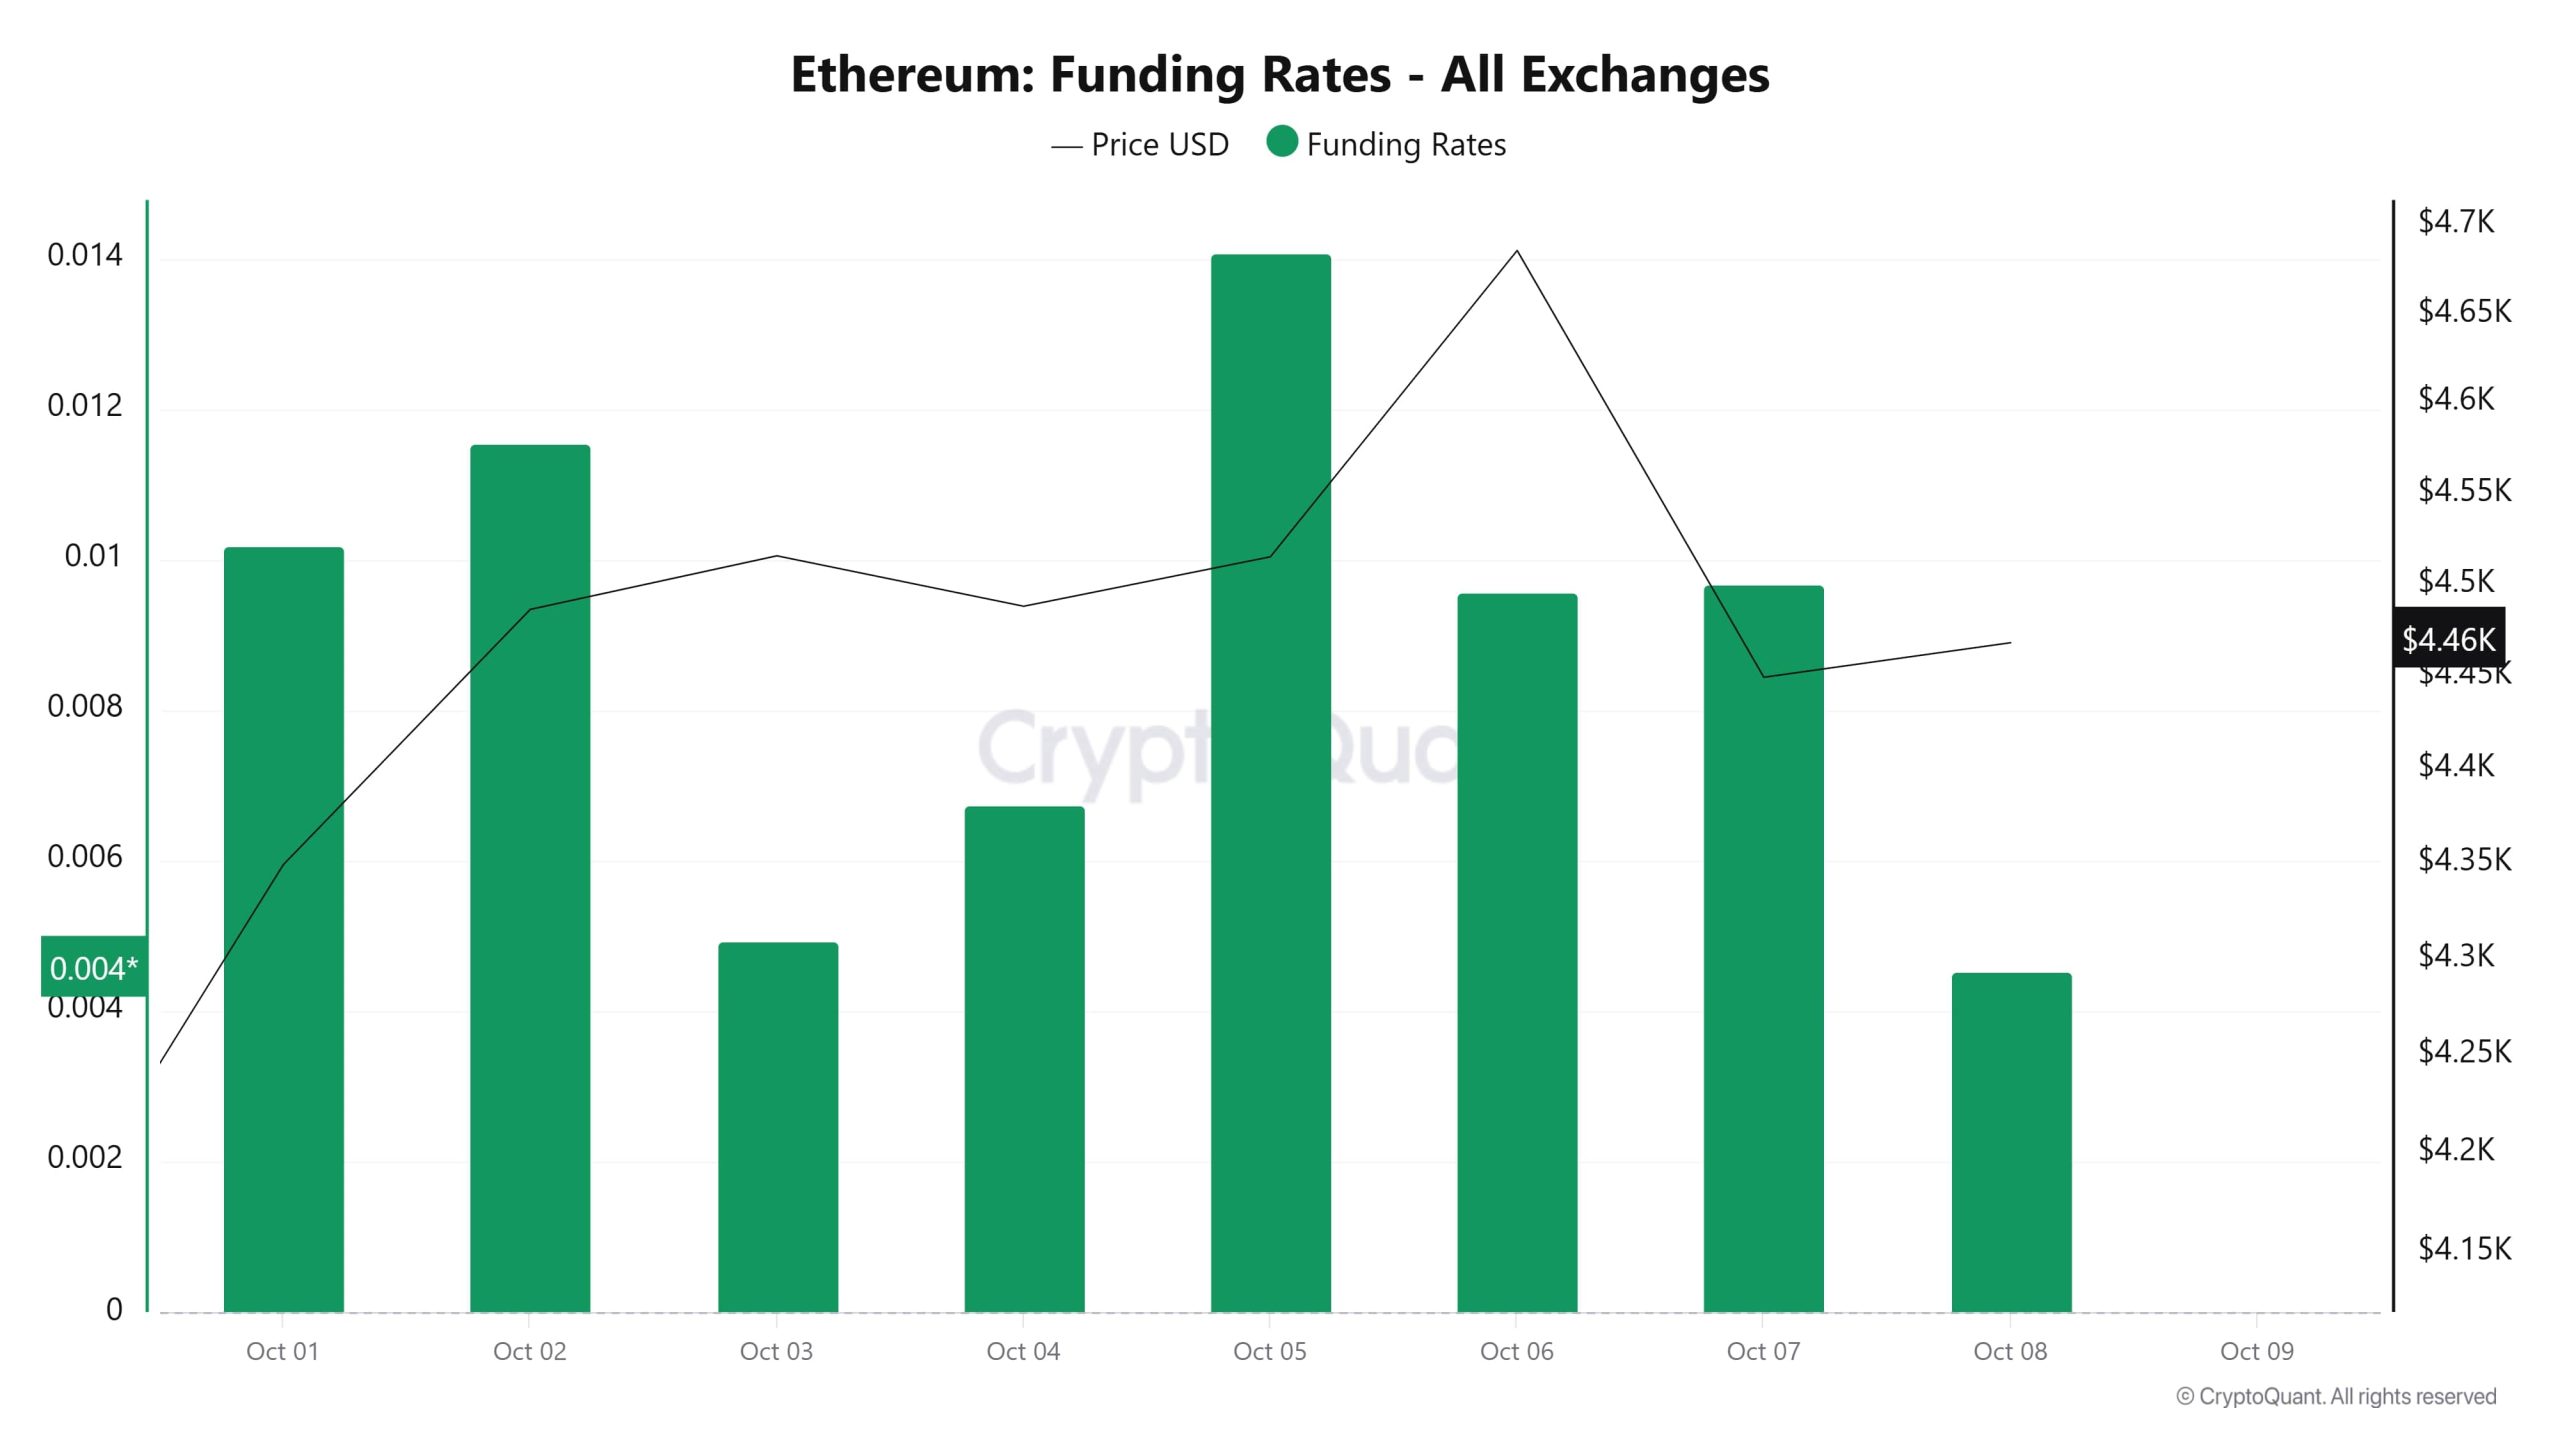
Funding ratios were generally in positive territory, indicating that the market was mainly driven by long positions during this period. On October 5, the ratio hit a weekly high of 0.014, indicating that there was a significant increase in leveraged buy trades and investors’ bullish expectations strengthened. However, after this rise, both funding rates and price action weakened as of October 6. The decline in the ETH price from $4,650 to $4,460 suggests that the market has moved from excessive optimism to a short-term cooling process and some of the leveraged positions have been closed.
Long & Short Liquidations
| Date | Long Amount (Million $) | Short Amount (Million $) |
|---|---|---|
| 01 October | 19.26 | 136.31 |
| 02 October | 34.96 | 138.25 |
| 03 October | 140.68 | 85.39 |
| 04 October | 28.00 | 8.16 |
| 05 October | 42.54 | 114.31 |
| 06 October | 22.05 | 88.26 |
| 07 October | 209.37 | 33.70 |
| Total | 496.86 | 604.38 |
Approximately $ 496 million of long positions were liquidated with the ETH price, which rose from $ 4,150 to $ 4,750 and then fell back to the $ 4,410 region. Another $604 million worth of short positions were liquidated in the same timeframe.
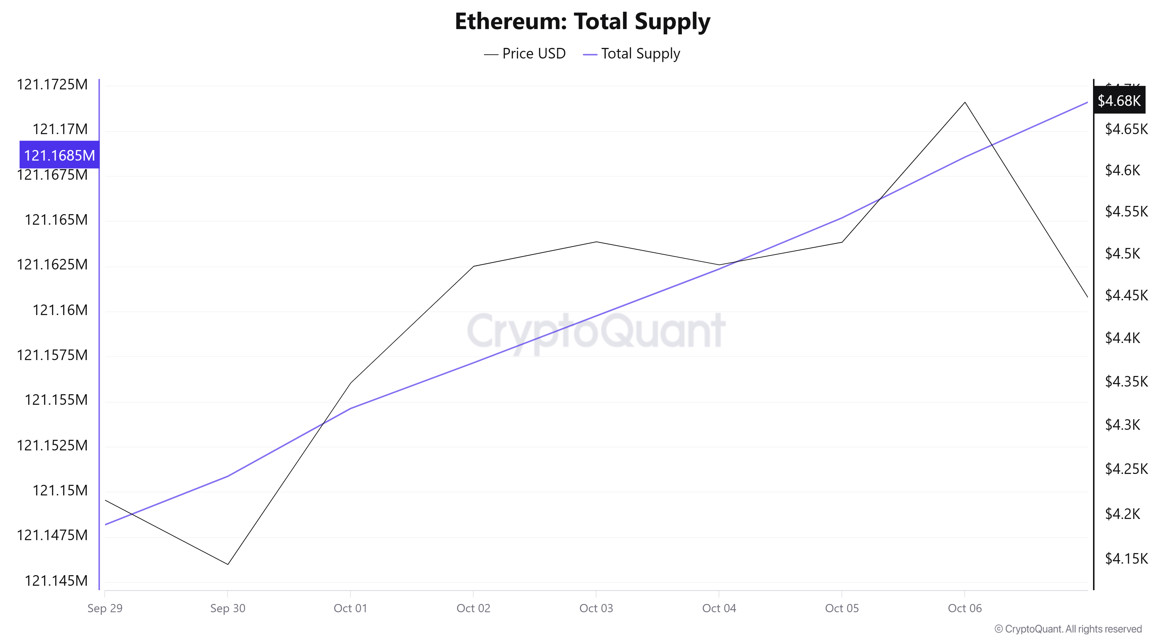
Total Supply: It reached 121,168,548 units, an increase of approximately 0.0168% compared to last week.
New Supply: The amount of ETH produced this week was 20,372.
Velocity: Velocity was 9.77 as of October 6, down from 9.70 last week.
| Wallet Category | 29.09.2025 | 06.10.2025 | Change (%) |
|---|---|---|---|
| 100 – 1k ETH | 8.5116M | 8.4835M | -0.33% |
| 1k – 10k ETH | 13.2387M | 13.1369M | -0.77% |
| 10k – 100k ETH | 21.2415M | 21.7766M | 2.52% |
| 100k+ ETH | 3.9777M | 4.1781M | 5.04% |
According to the latest weekly data, Ethereum wallet distribution presented a bullish outlook. The 100-1k ETH range declined 0.33%, while the 1k-10k ETH segment fell 0.77%. In contrast, the 10k-100k ETH group rose 2.52%. The most notable movement was in the 100k+ ETH category; this segment increased by 5.04%.
Exchange Supply Ratio
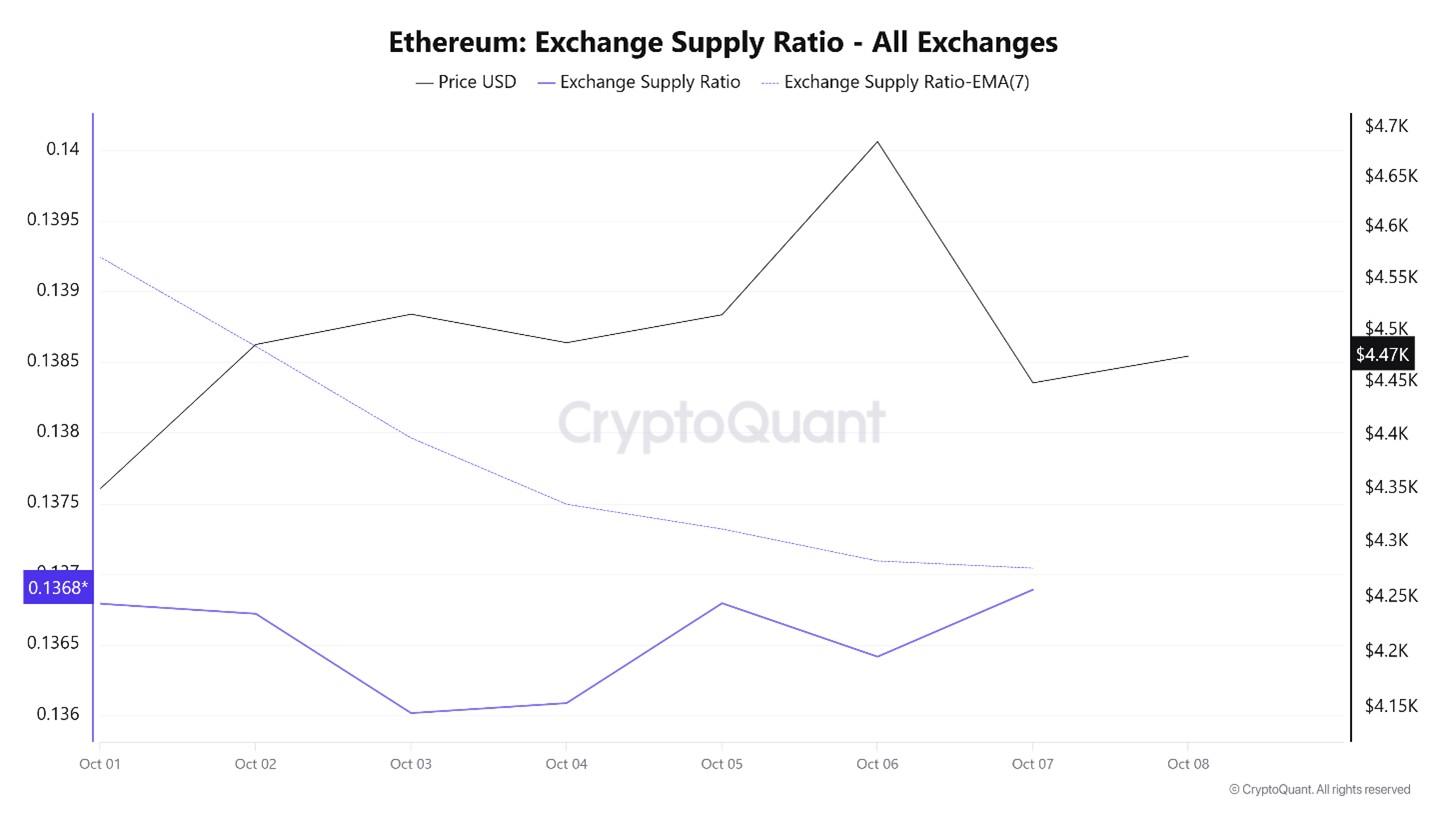
Between October 1 and October 7, after the US government shutdown in crypto assets markets started to rise, Ethereum Exchange Supply Ratio increased from 0.1367188 to 0.13704186. During this period, the Ethereum price dropped from $4,486 to $4,449. The negative correlation between the price and the Exchange Supply Ratio, especially this week, shows that despite the price decline, the amount of Ethereum supplied to exchanges has increased, possibly indicating that long-term investors continue to hold their assets. It is seen that the expectation of a general decline in the Ethereum price is dominant.
Exchange Reserve
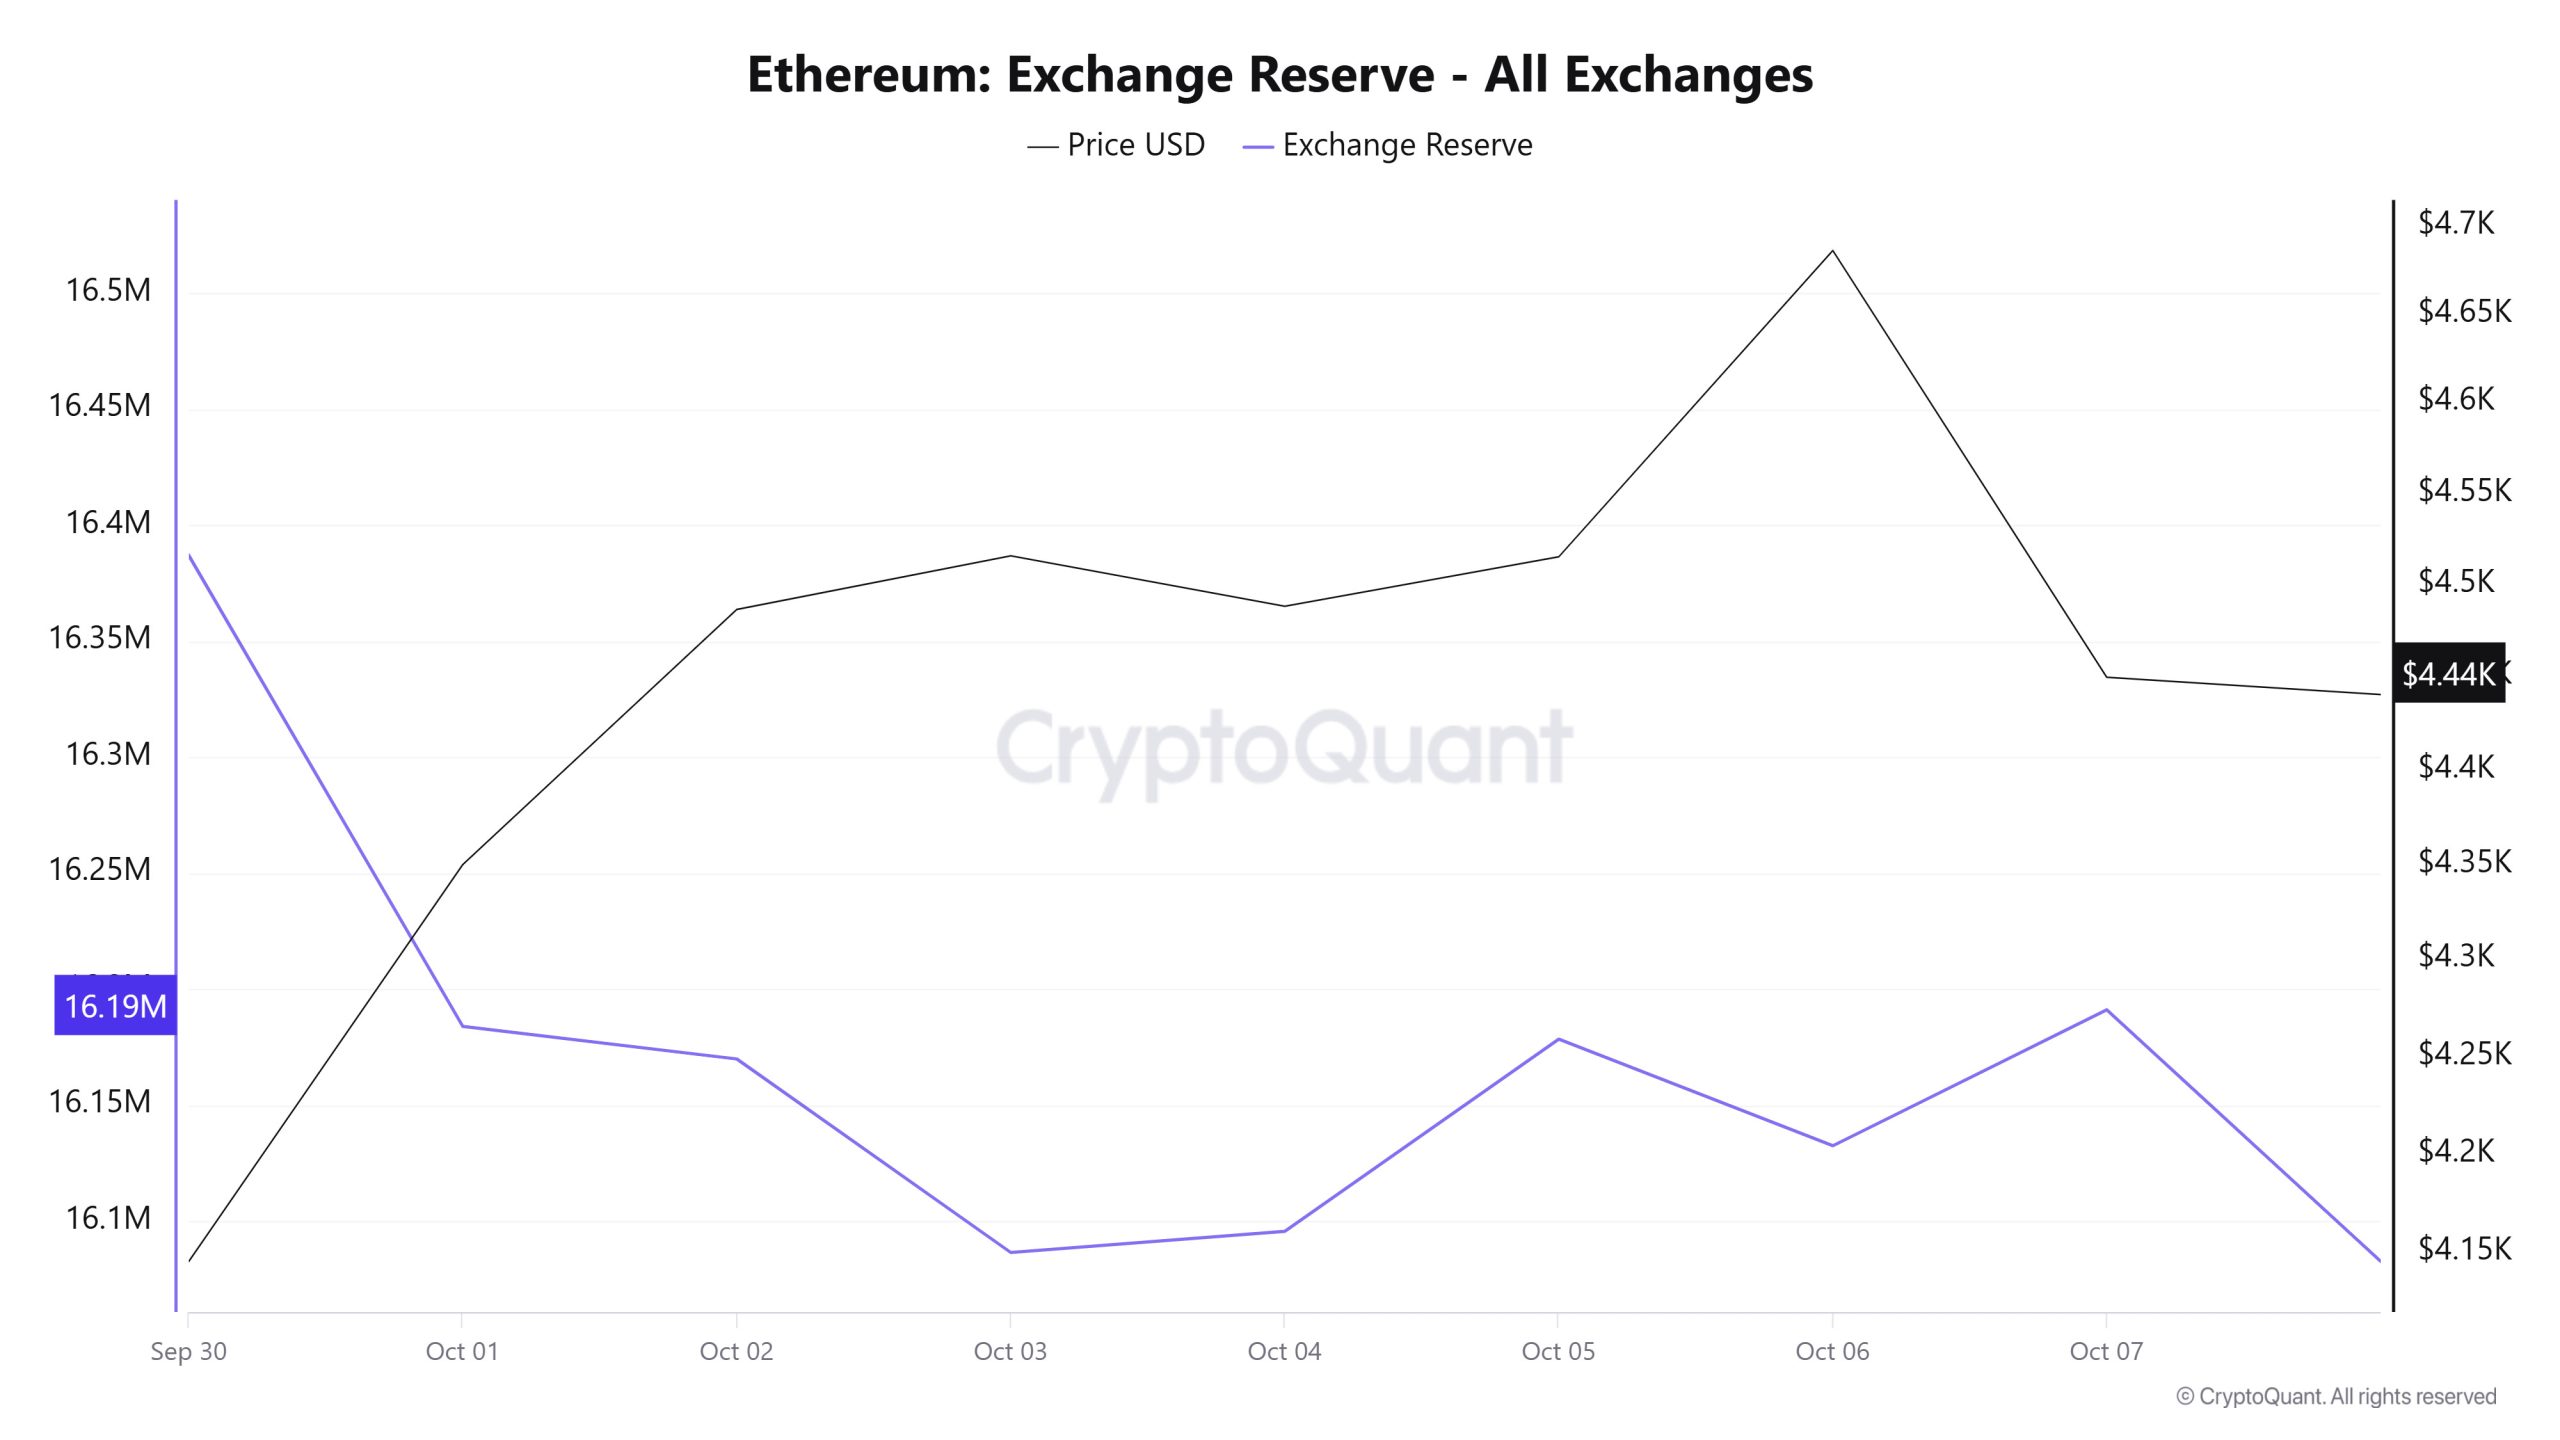
Between October 01-07, 2025, Ethereum reserves on exchanges decreased from 16,386,852 ETH to 16,190,977 ETH, with a total net outflow of 195,875 ETH. In this process, reserves decreased by approximately 1.20%. In the same period, the ETH price rose from $4,146 to $4,449, gaining about 7.32%. The decline in reserves while the price increased suggests that investors continued to withdraw their ETH from exchanges despite the rise, selling pressure remained low and the supply contraction supported the price. The upward trend in the ETH price may continue if investors maintain their long-term holding trend.
| Date | Exchange Inflow | Exchange Outflow | Exchange Netflow | Exchange Reserve | ETH Price ($) |
|---|---|---|---|---|---|
| 01-Oct | 1,166,494 | 1,369,515 | -203,021 | 16,183,831 | 4,146 |
| 02-Oct | 1,084,170 | 1,098,219 | -14,050 | 16,169,782 | 4,486 |
| 03-Oct | 940,147 | 1,023,573 | -83,425 | 16,086,356 | 4,515 |
| 04-Oct | 545,304 | 536,200 | 9,104 | 16,095,461 | 4,488 |
| 05-Oct | 547,242 | 464,371 | 82,871 | 16,178,332 | 4,515 |
| 06-Oct | 1,211,884 | 1,257,828 | -45,944 | 16,132,388 | 4,686 |
| 07-Oct | 1,149,708 | 1,091,119 | 58,589 | 16,190,977 | 4,449 |
Fees and Revenues
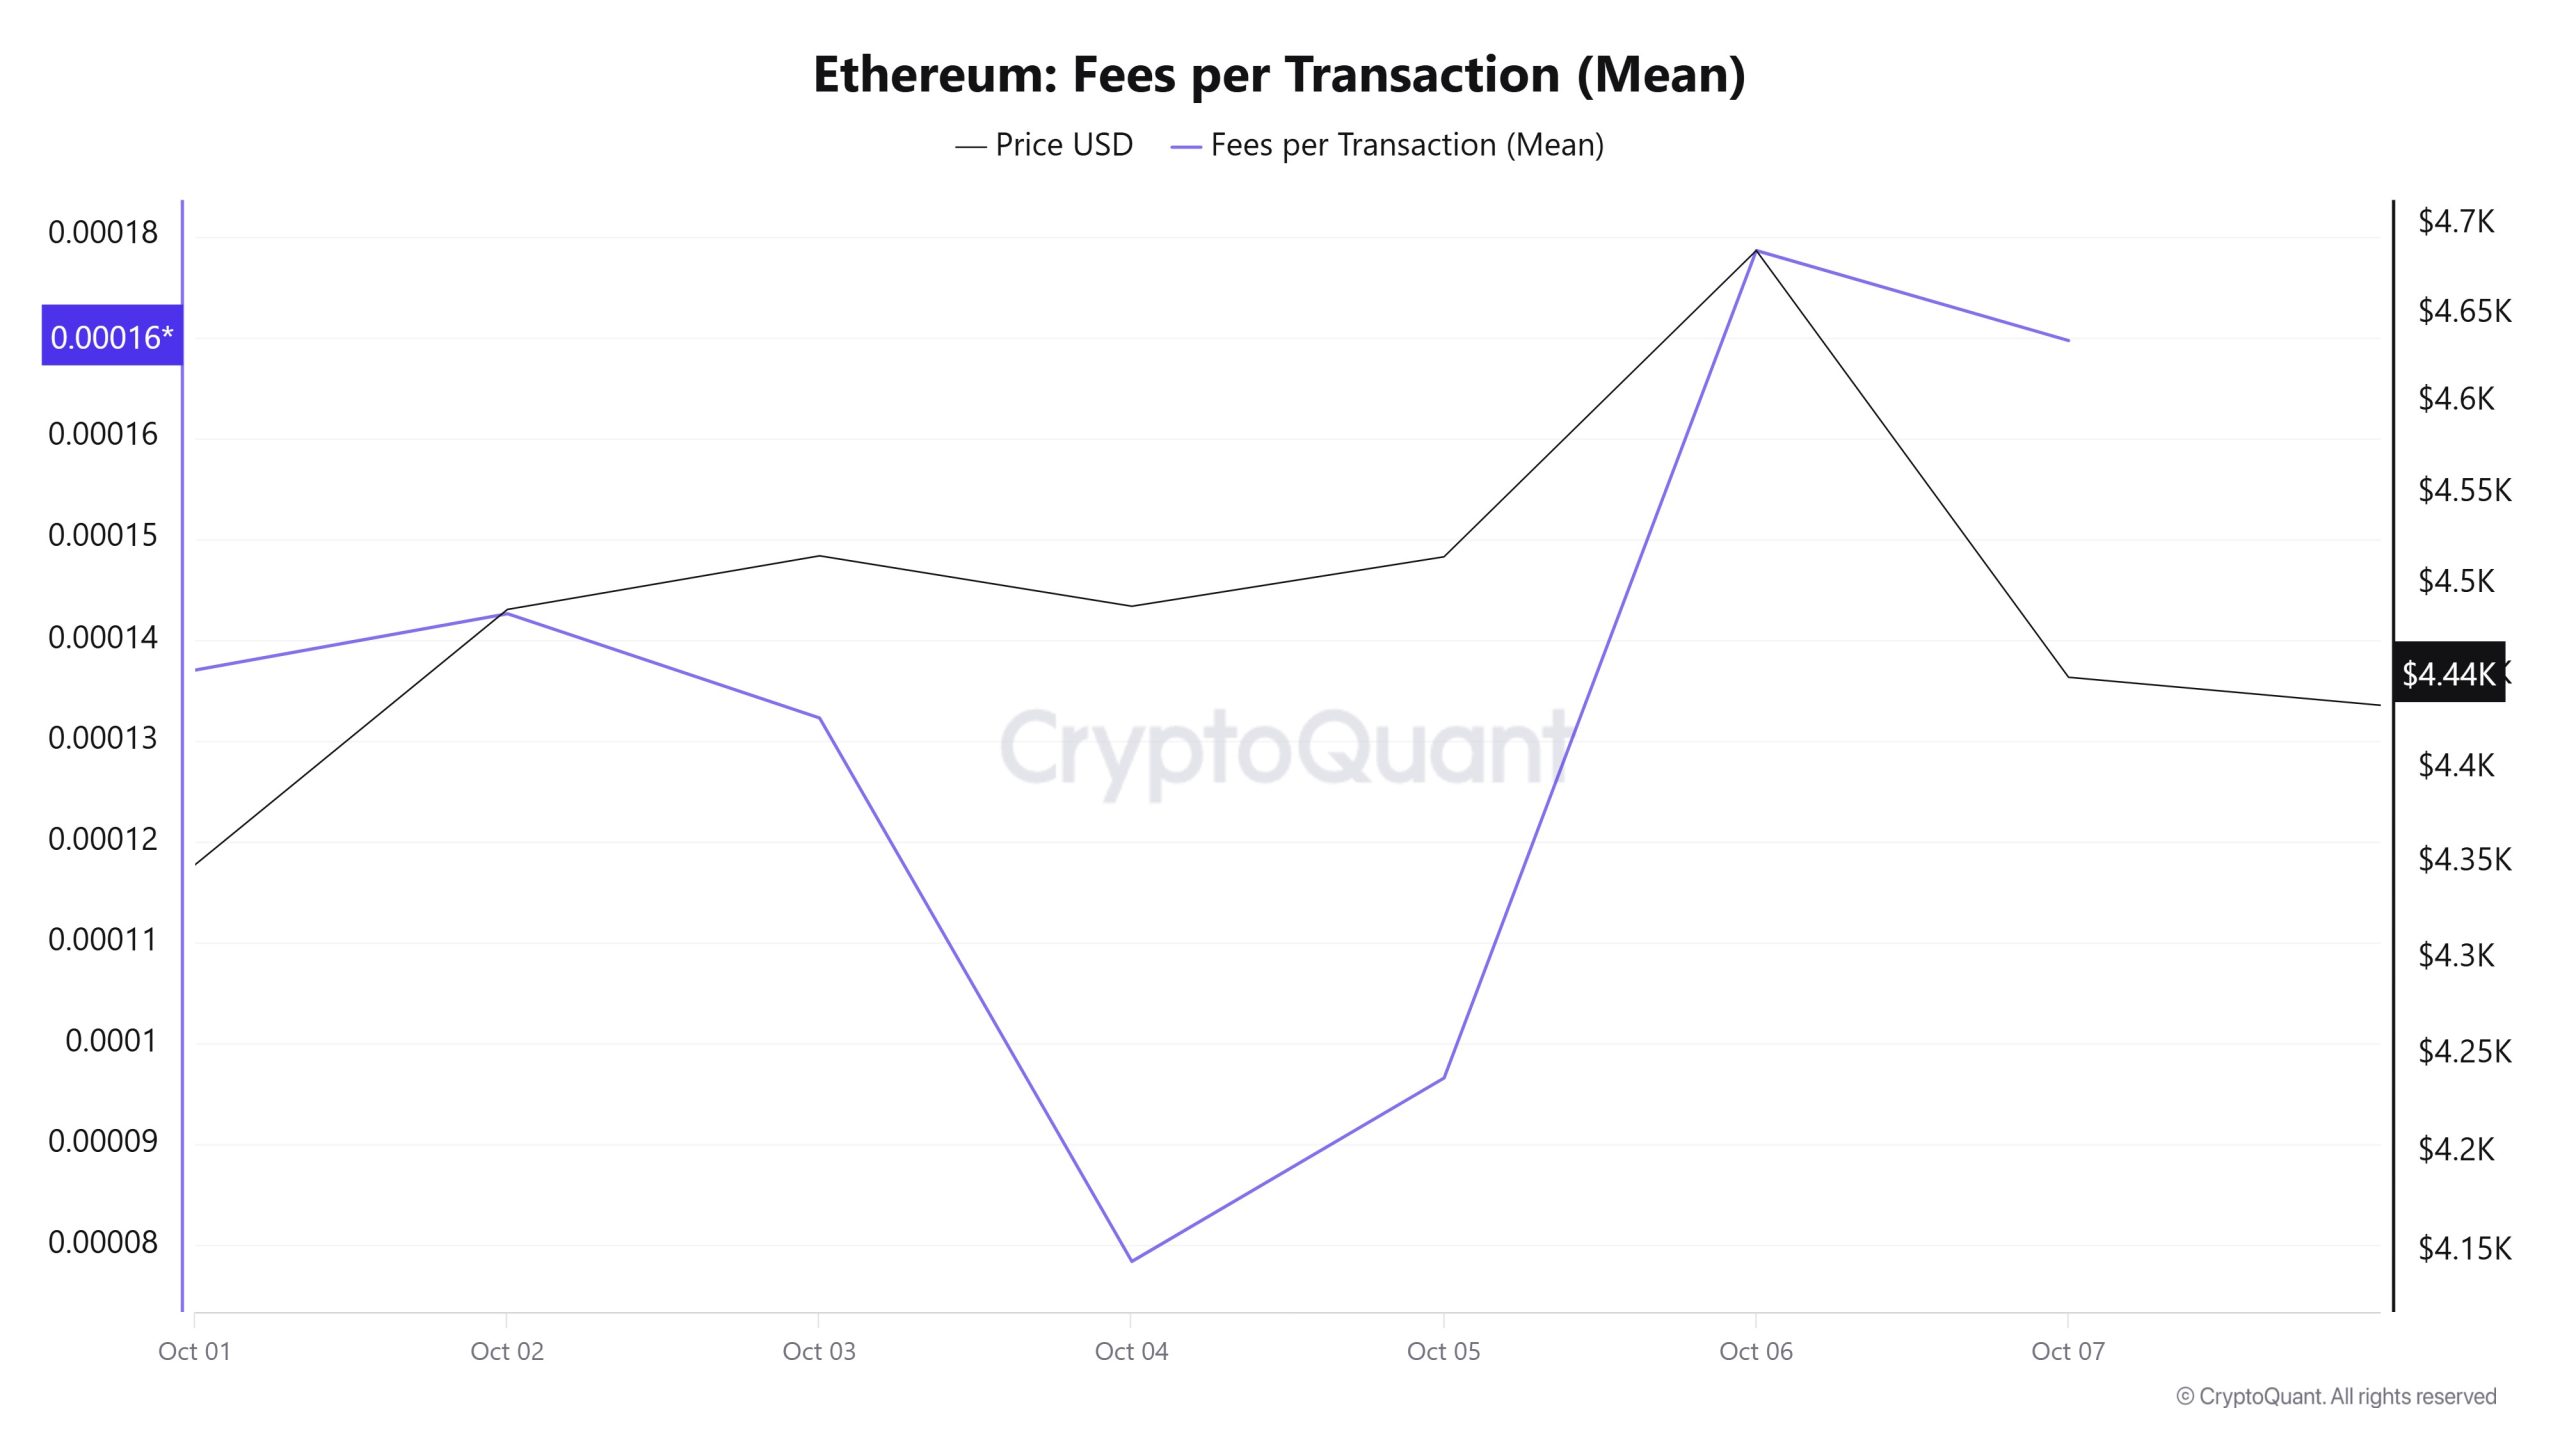
Analysing the Ethereum Fees per Transaction (Mean) data between October 1-7, it is seen that the indicator was realized at 0.00013701575477716 on October 1, the first day of the week.
After this date, it followed a fluctuating course due to the volatility in Ethereum price. On October 4, it fell to 0.000078414180447965, recording the lowest value of the week.
In the following days, the Ethereum Fees per Transaction (Mean) indicator resumed its upward trend and closed at 0.000169674421108118 on October 7, the last day of the week.
Ethereum: Fees (Total)
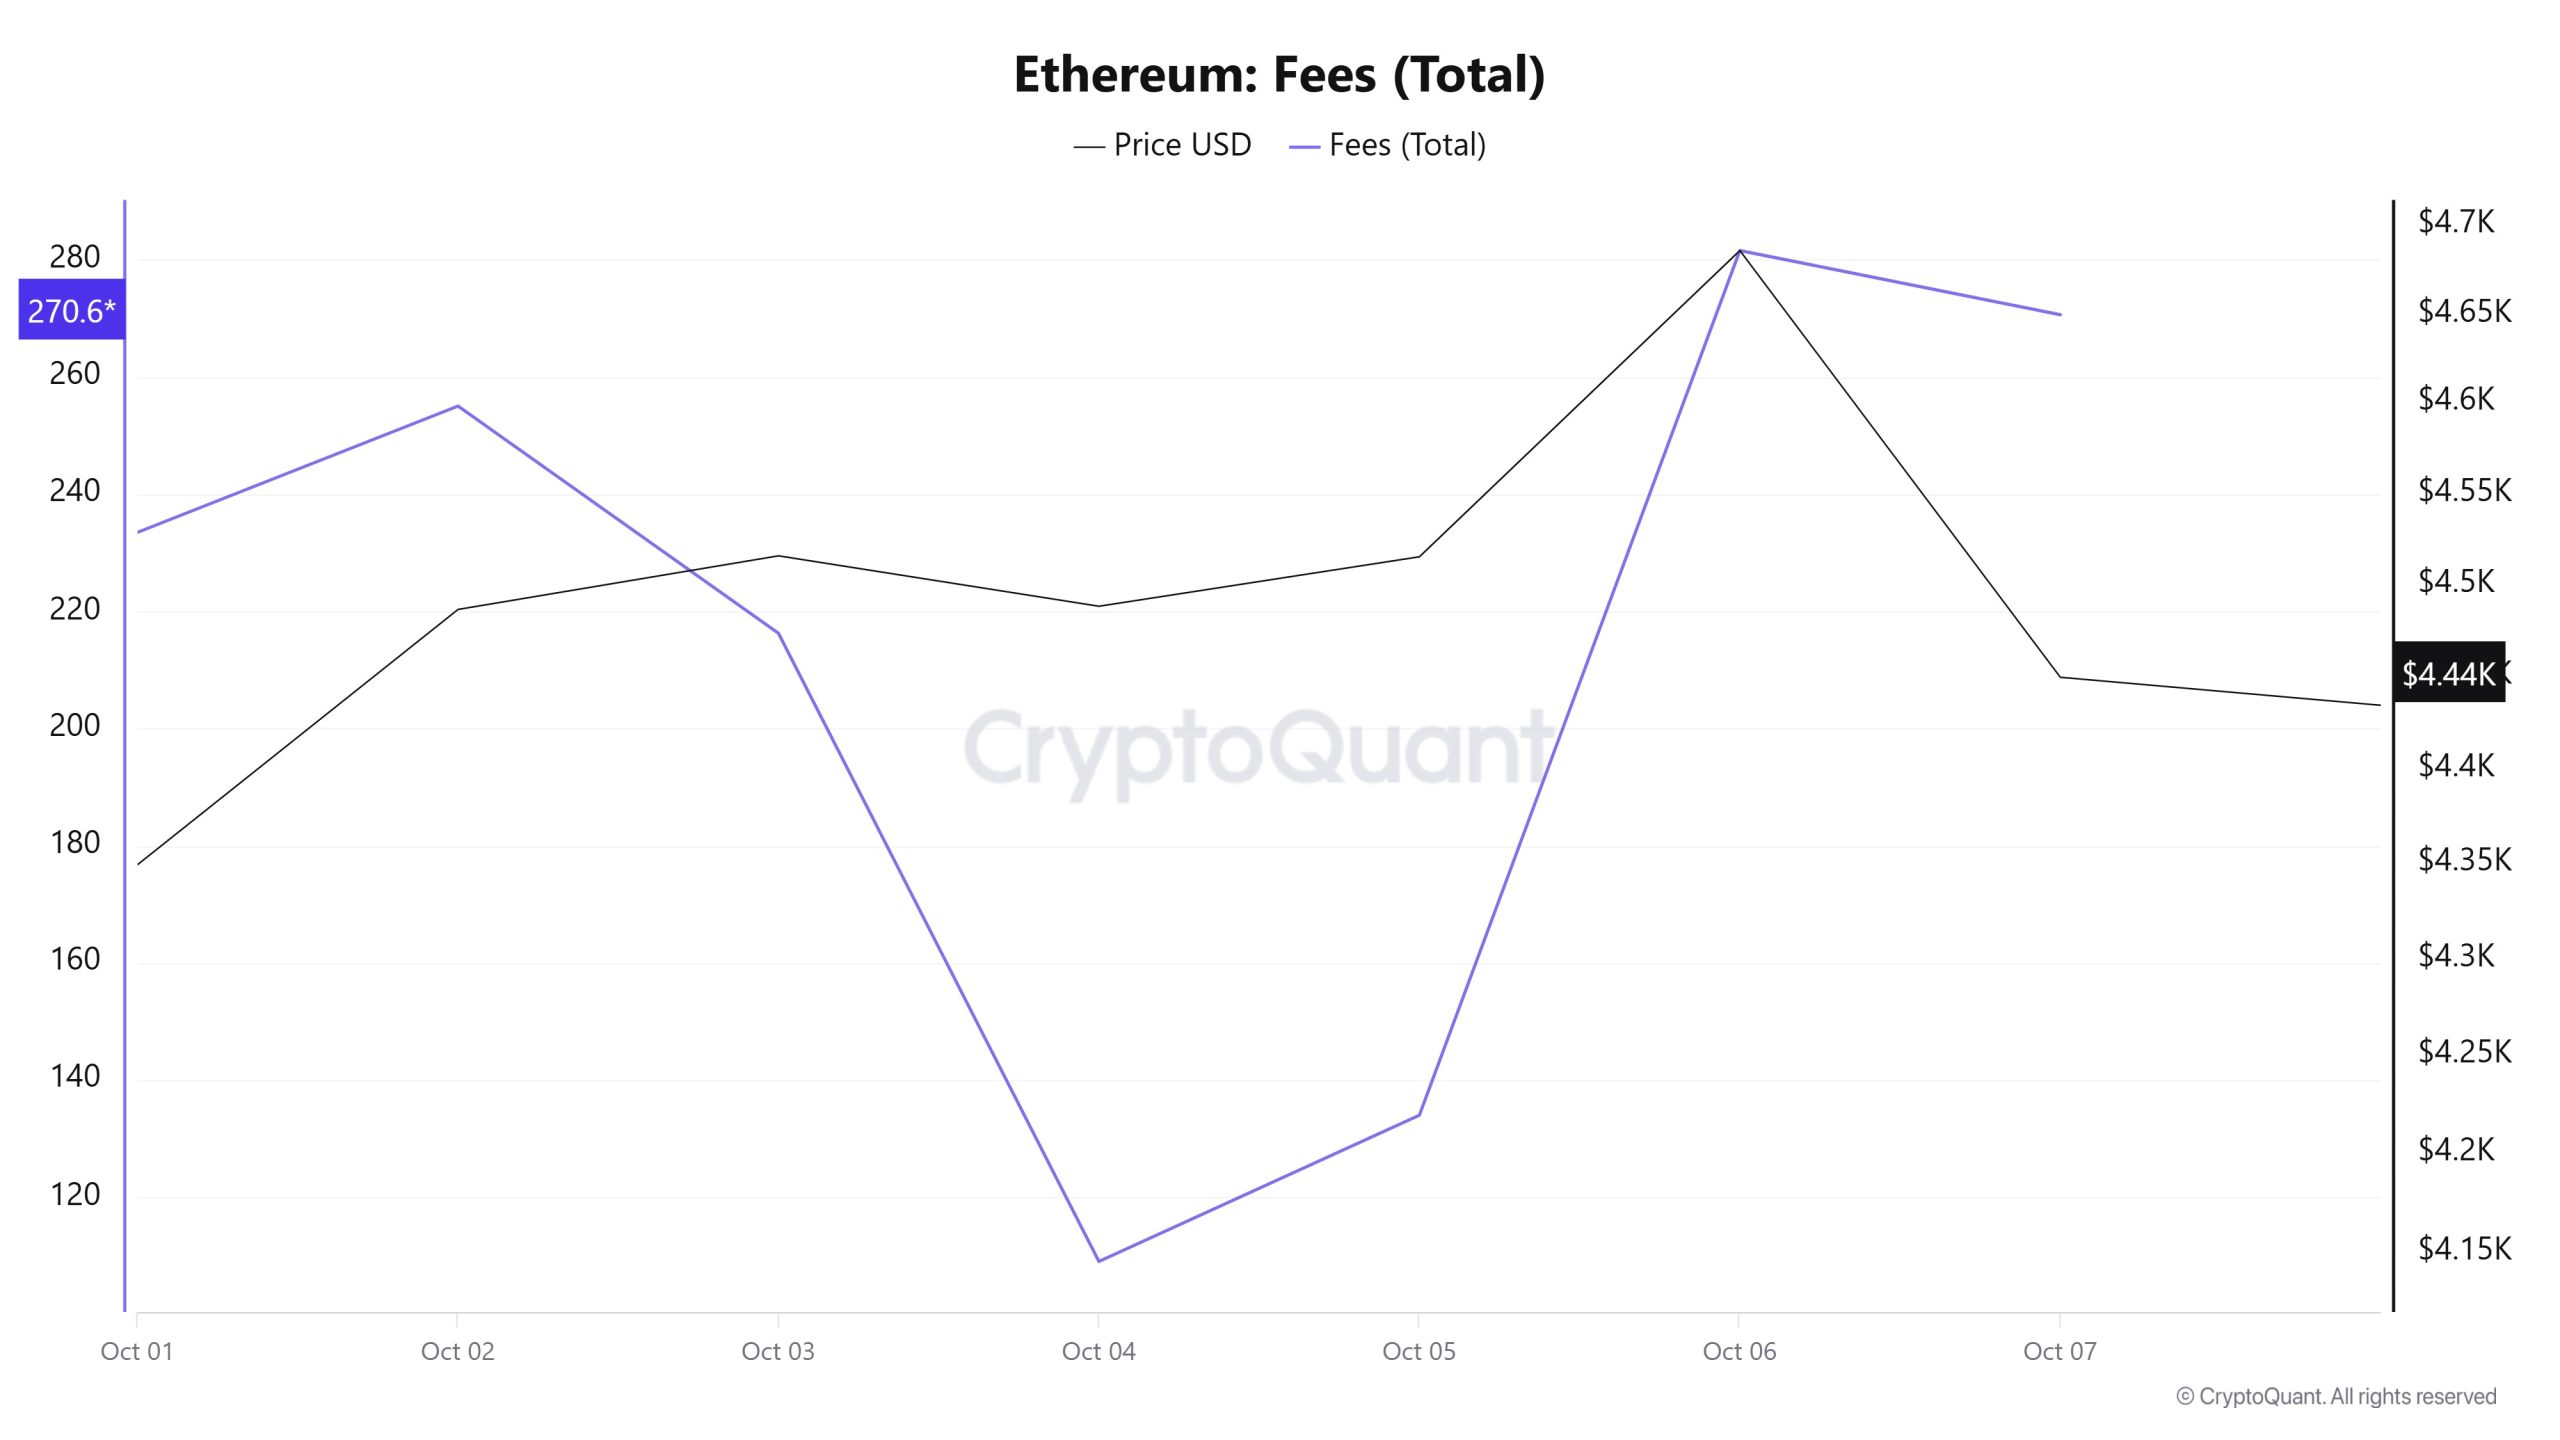
Similarly, an analysis of Ethereum Fees (Total) data for October 1-7 shows that on October 1, the first day of the week, the indicator stood at 233.49663164529105.
After this date, it followed a fluctuating course due to the volatility in Ethereum price. On October 4, it fell to 109.01892142008343, recording the lowest value of the week.
In the following days, the Ethereum Fees (Total) indicator resumed its upward trend and closed at 270.6491961793485 on October 7, the last day of the week.
Blocks Mined
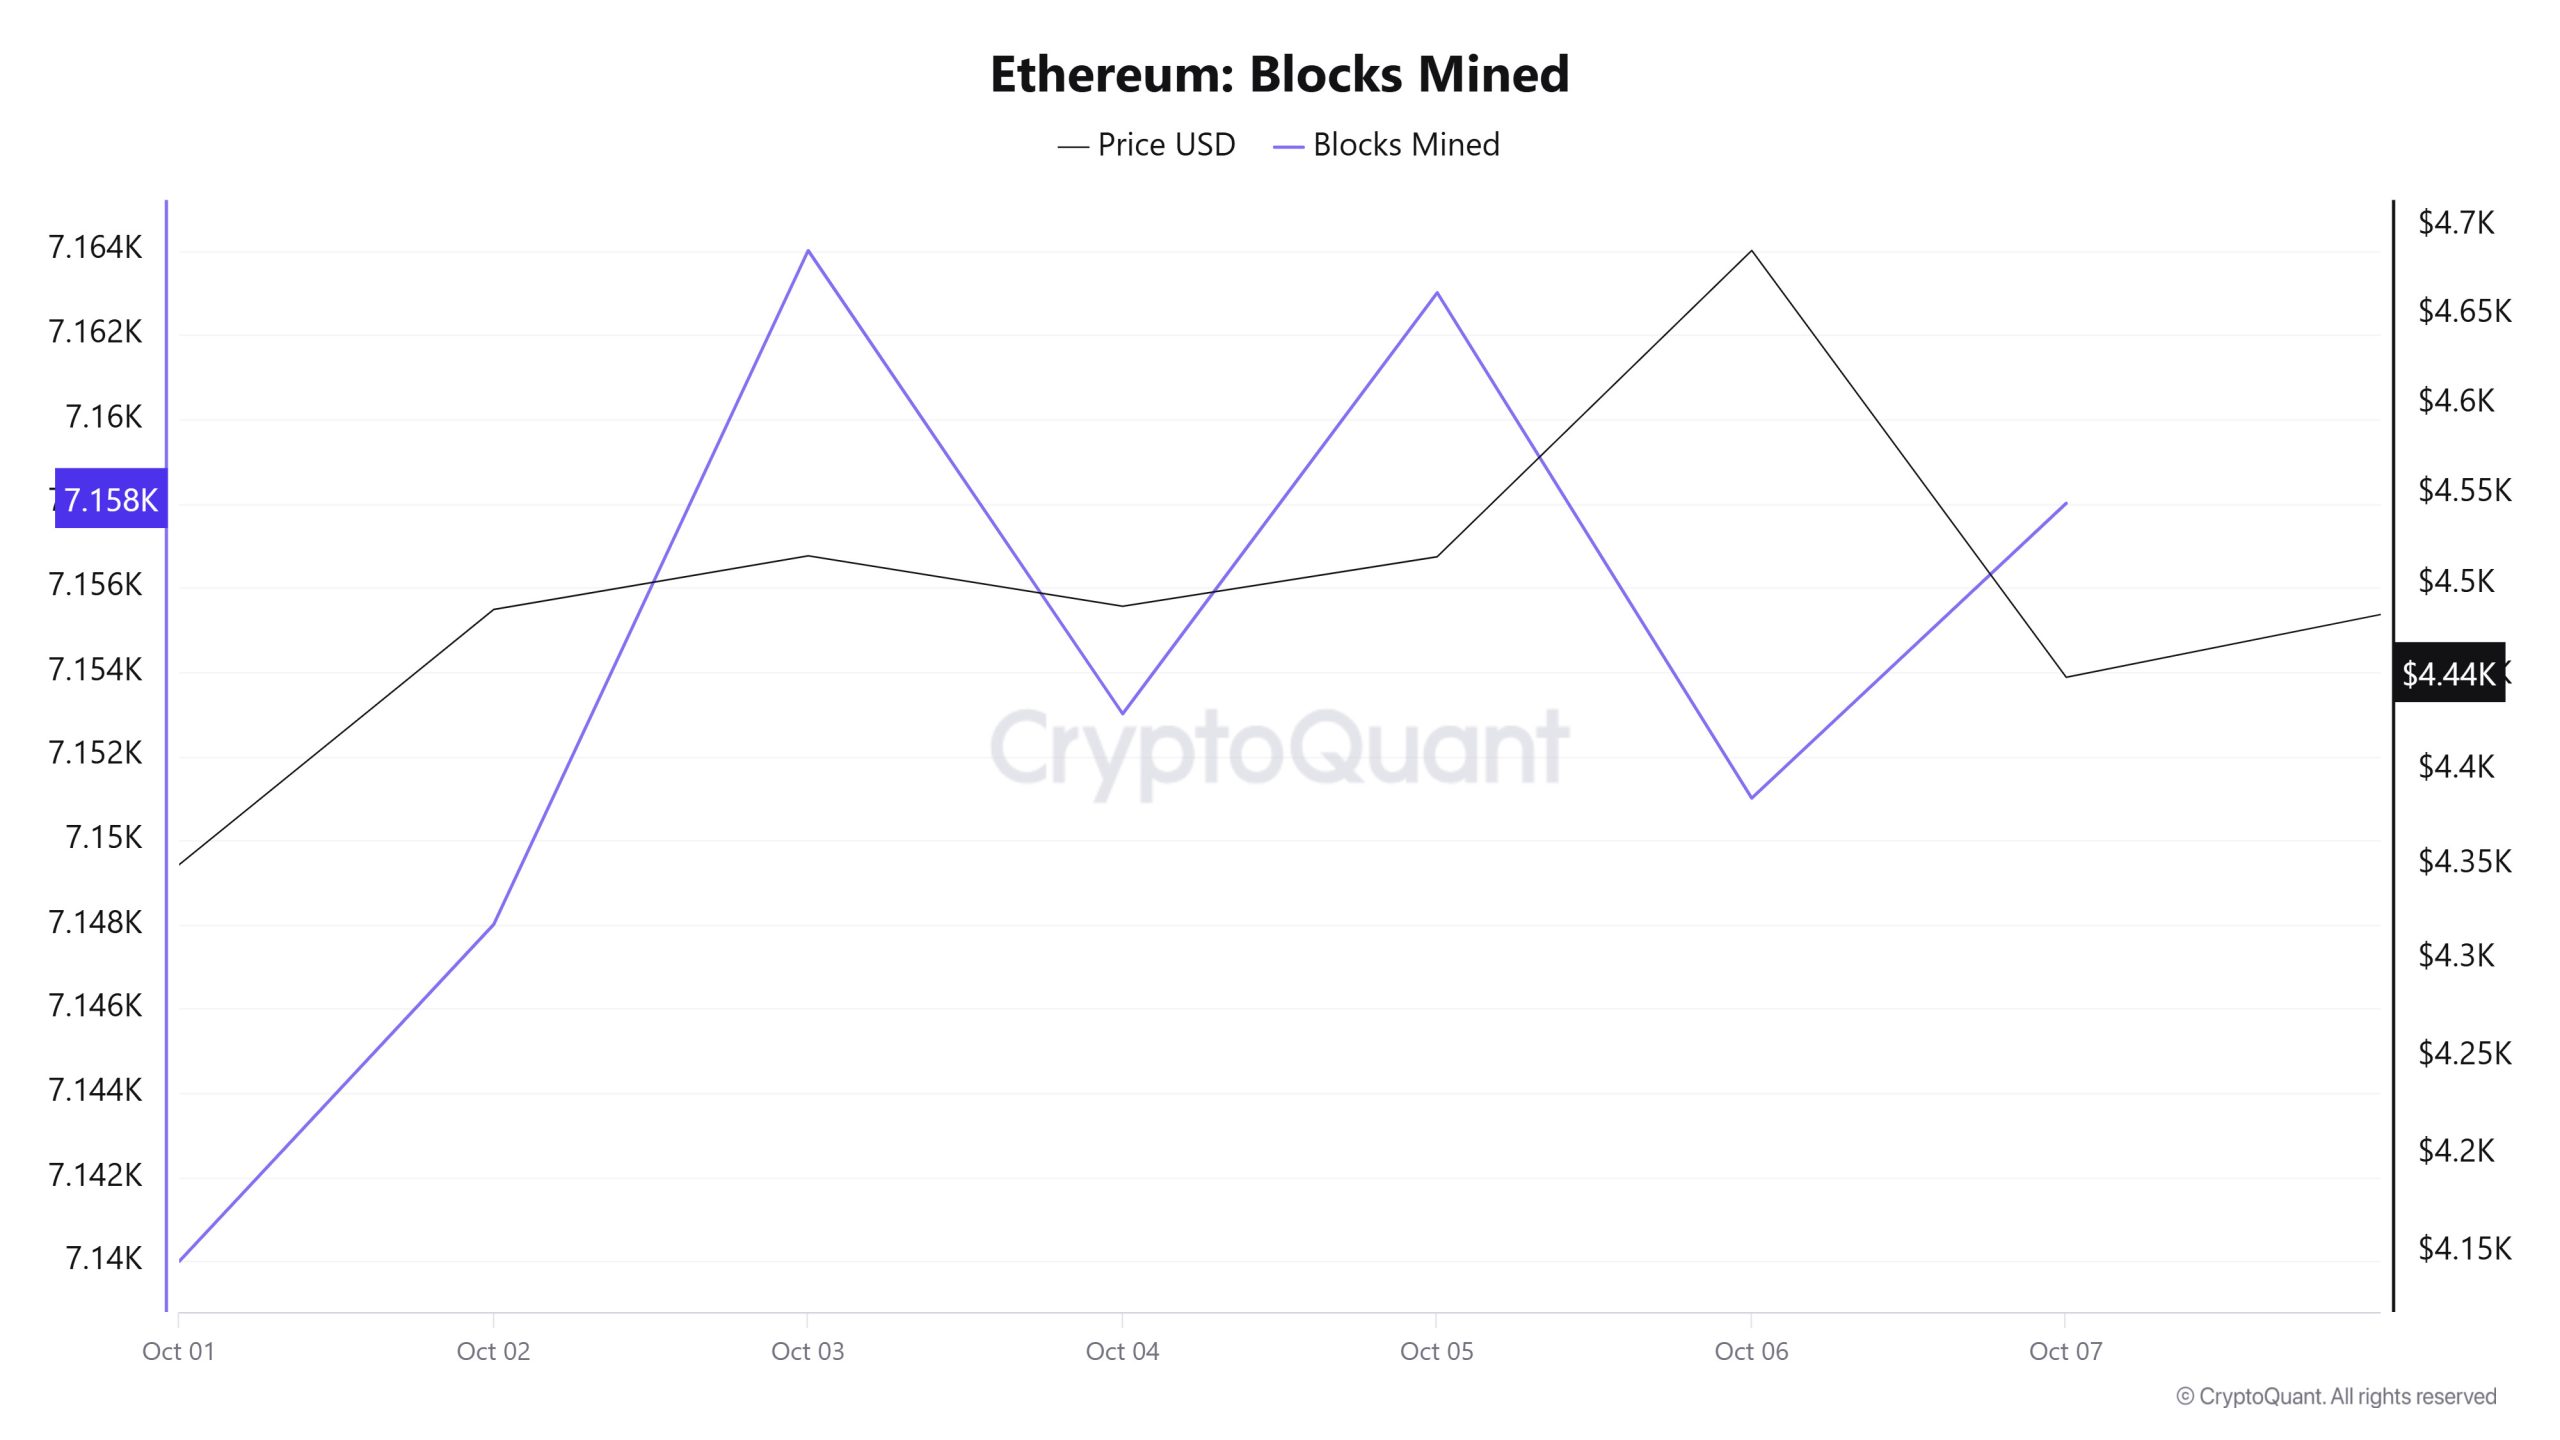
Between October 01 – 07, Ethereum block production data showed an increase throughout the week. While 7,140 blocks were produced on October 01, this number increased to 7,158 as of October 07.
A time-varying correlation structure has been observed between the Ethereum price and the number of block production. However, the general trend suggests that a positive correlation between these two variables is dominant.
Block Size
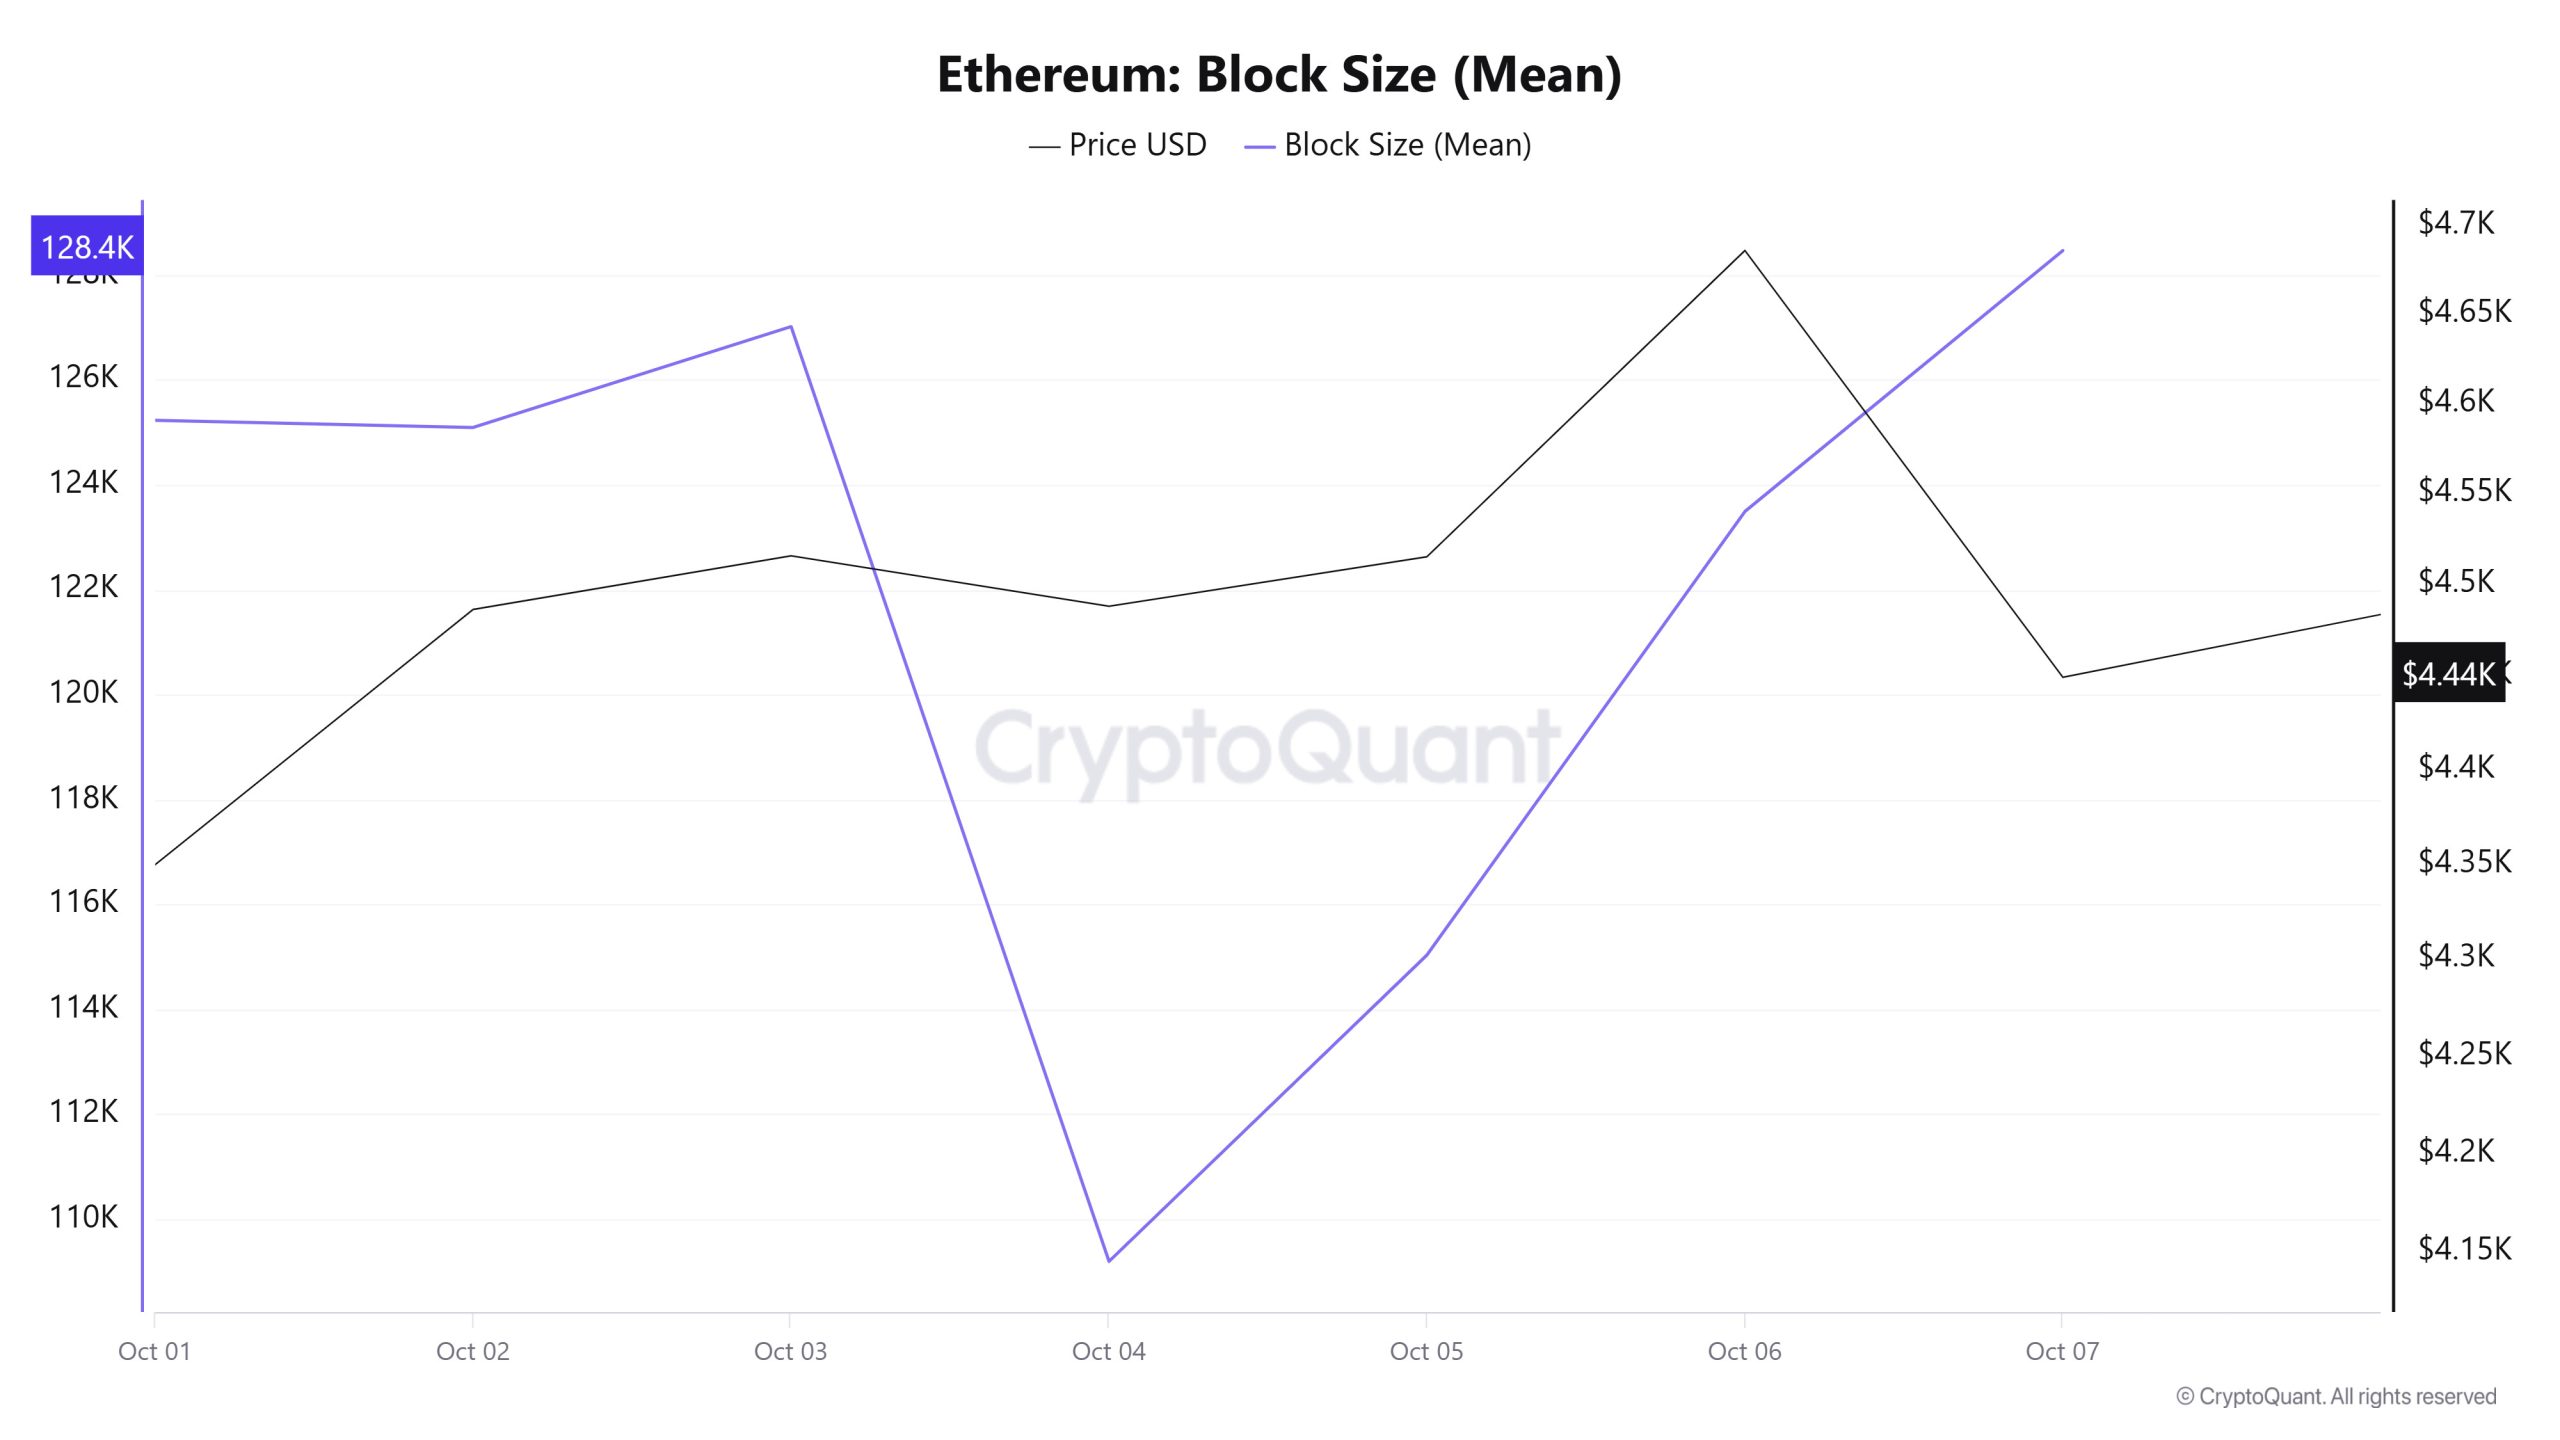
Between October 01 – 07, Ethereum block size data shows that there was an increase throughout the week. On October 01, the average block size was 125,231 bytes, while this value increased to 128,466 bytes as of October 07.
A time-varying correlation structure was observed between block size and Ethereum price during the relevant period. However, the general trend suggests that a positive correlation between these two variables is dominant.
Block Interval
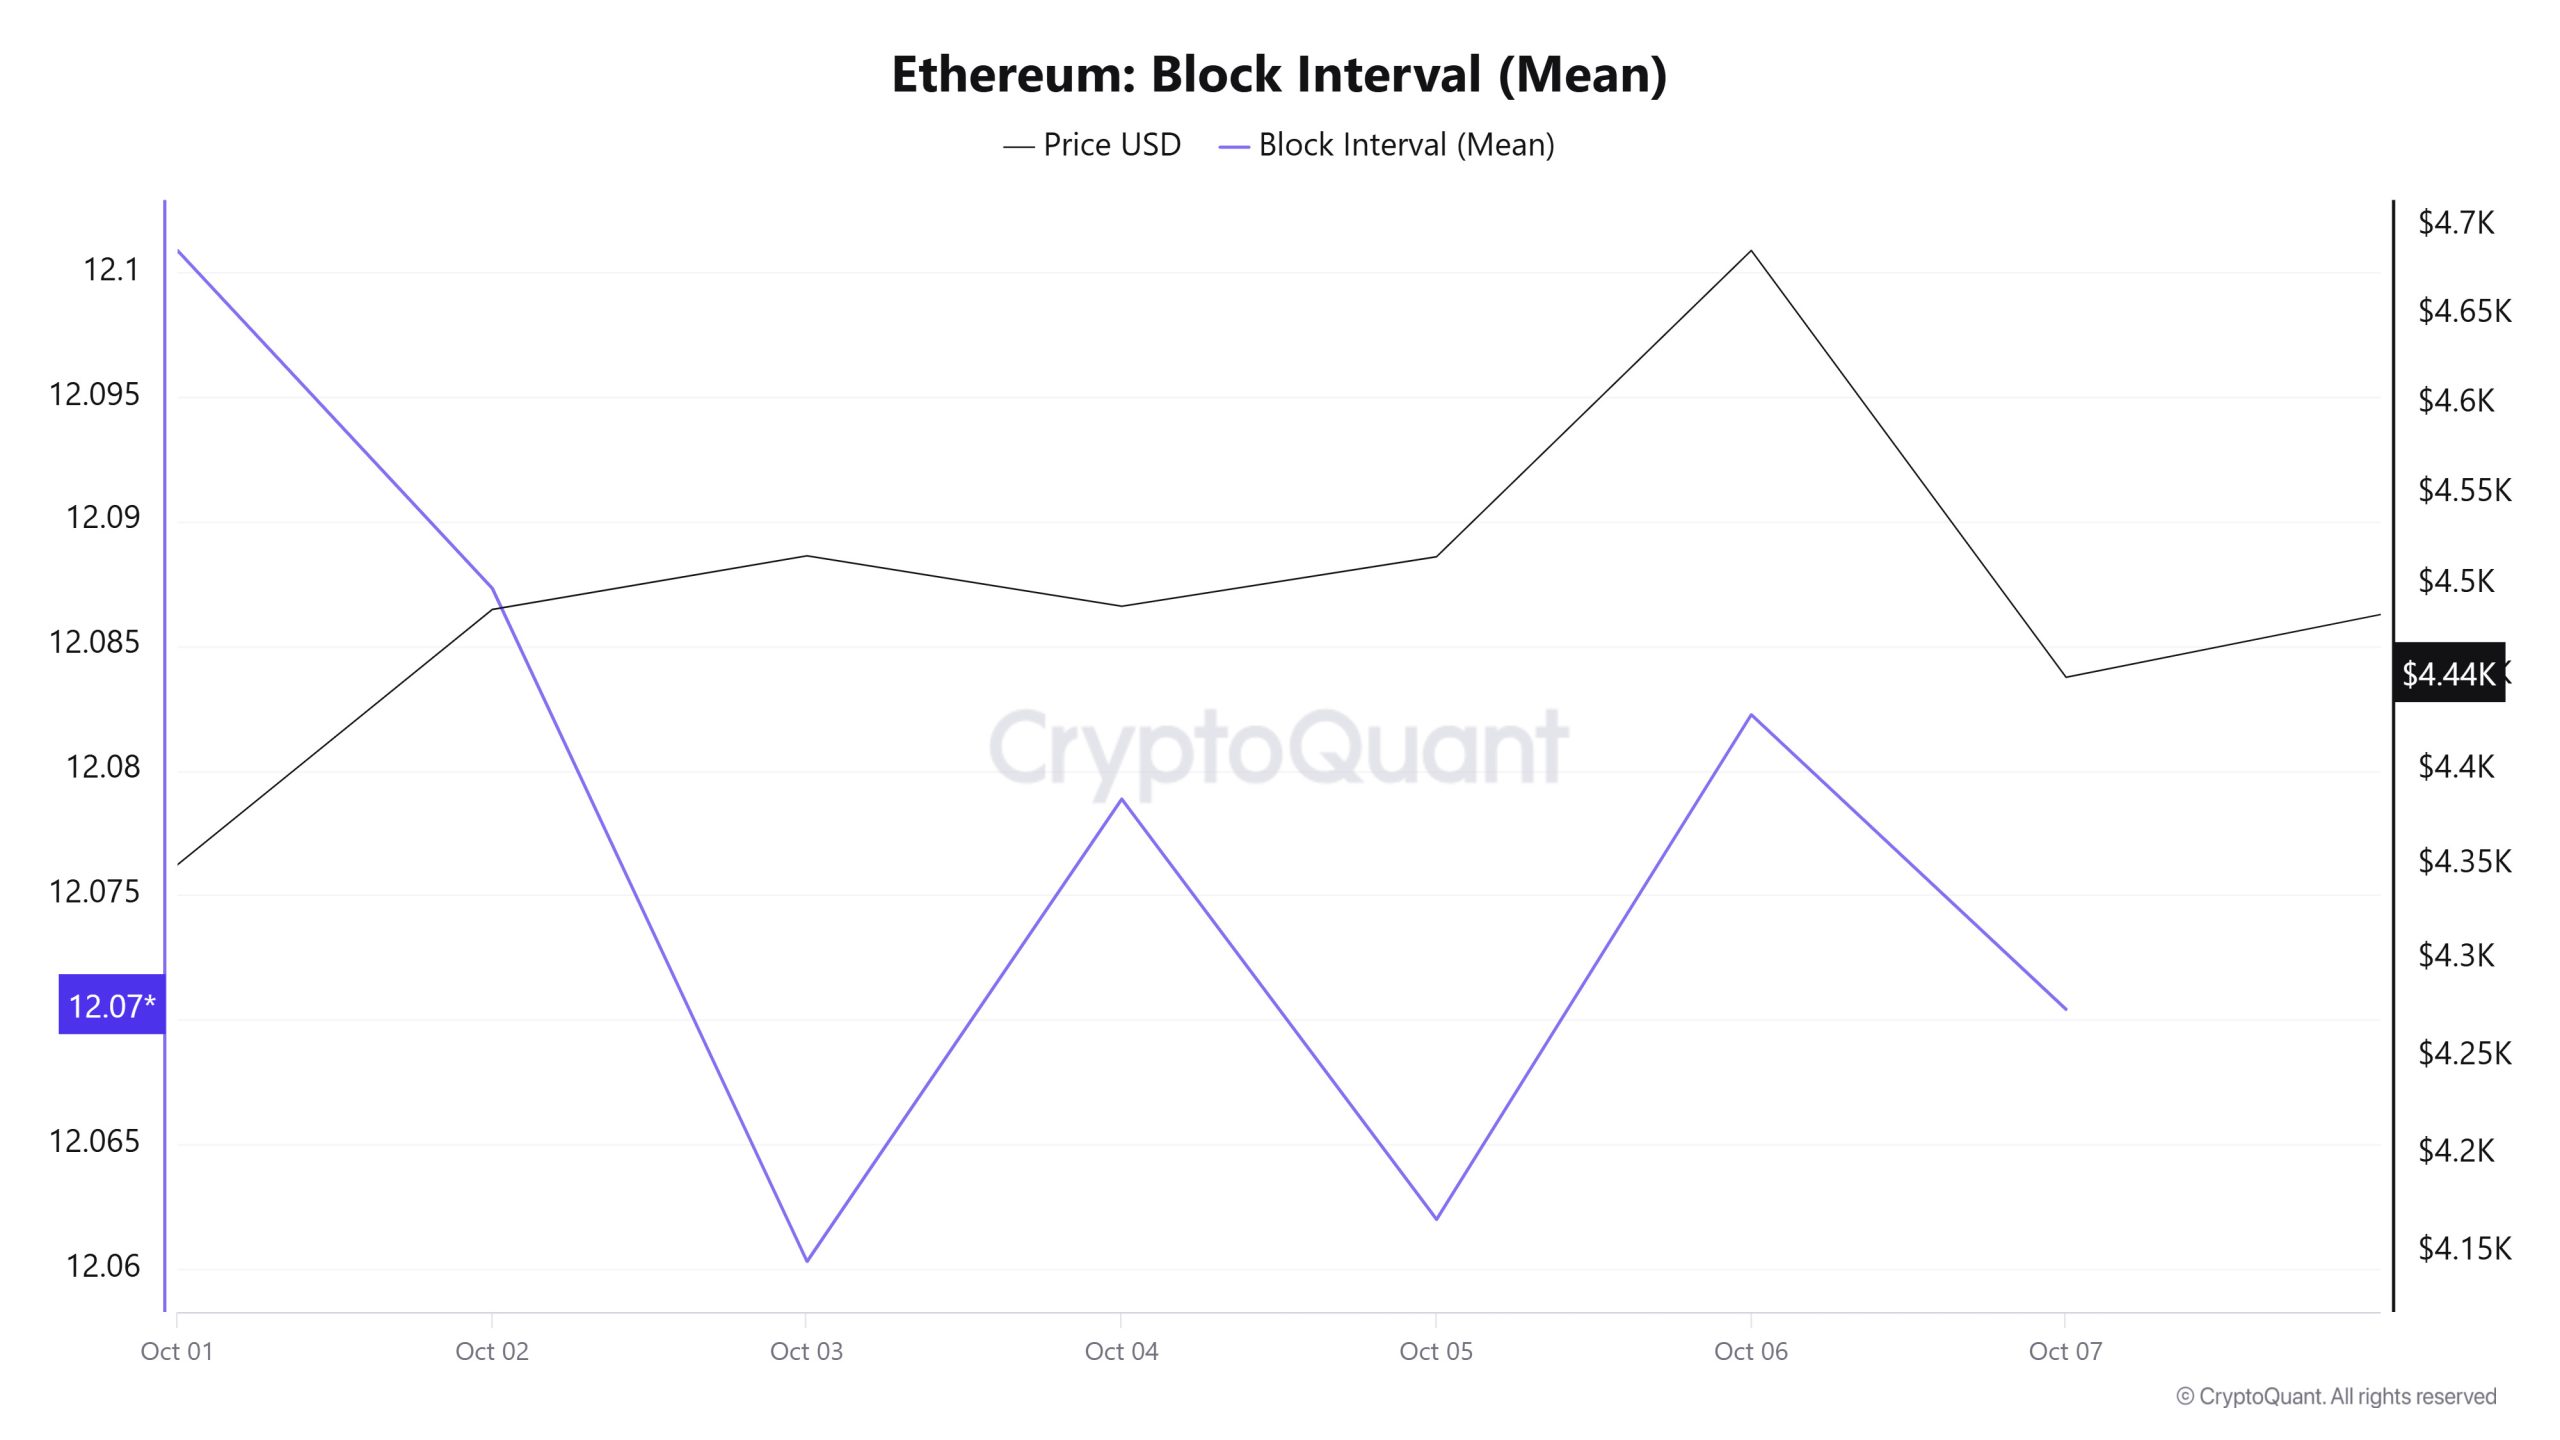
Between October 01 – 07, Ethereum block time decreased slightly throughout the week. On October 01, the average block duration was recorded as 12.10 seconds, while it decreased to 12.07 seconds as of October 07.
During the period in question, a time-varying correlation structure was observed between Ethereum block duration and price movement. However, the general trend suggests that a negative correlation between these two variables is dominant.
Transaction
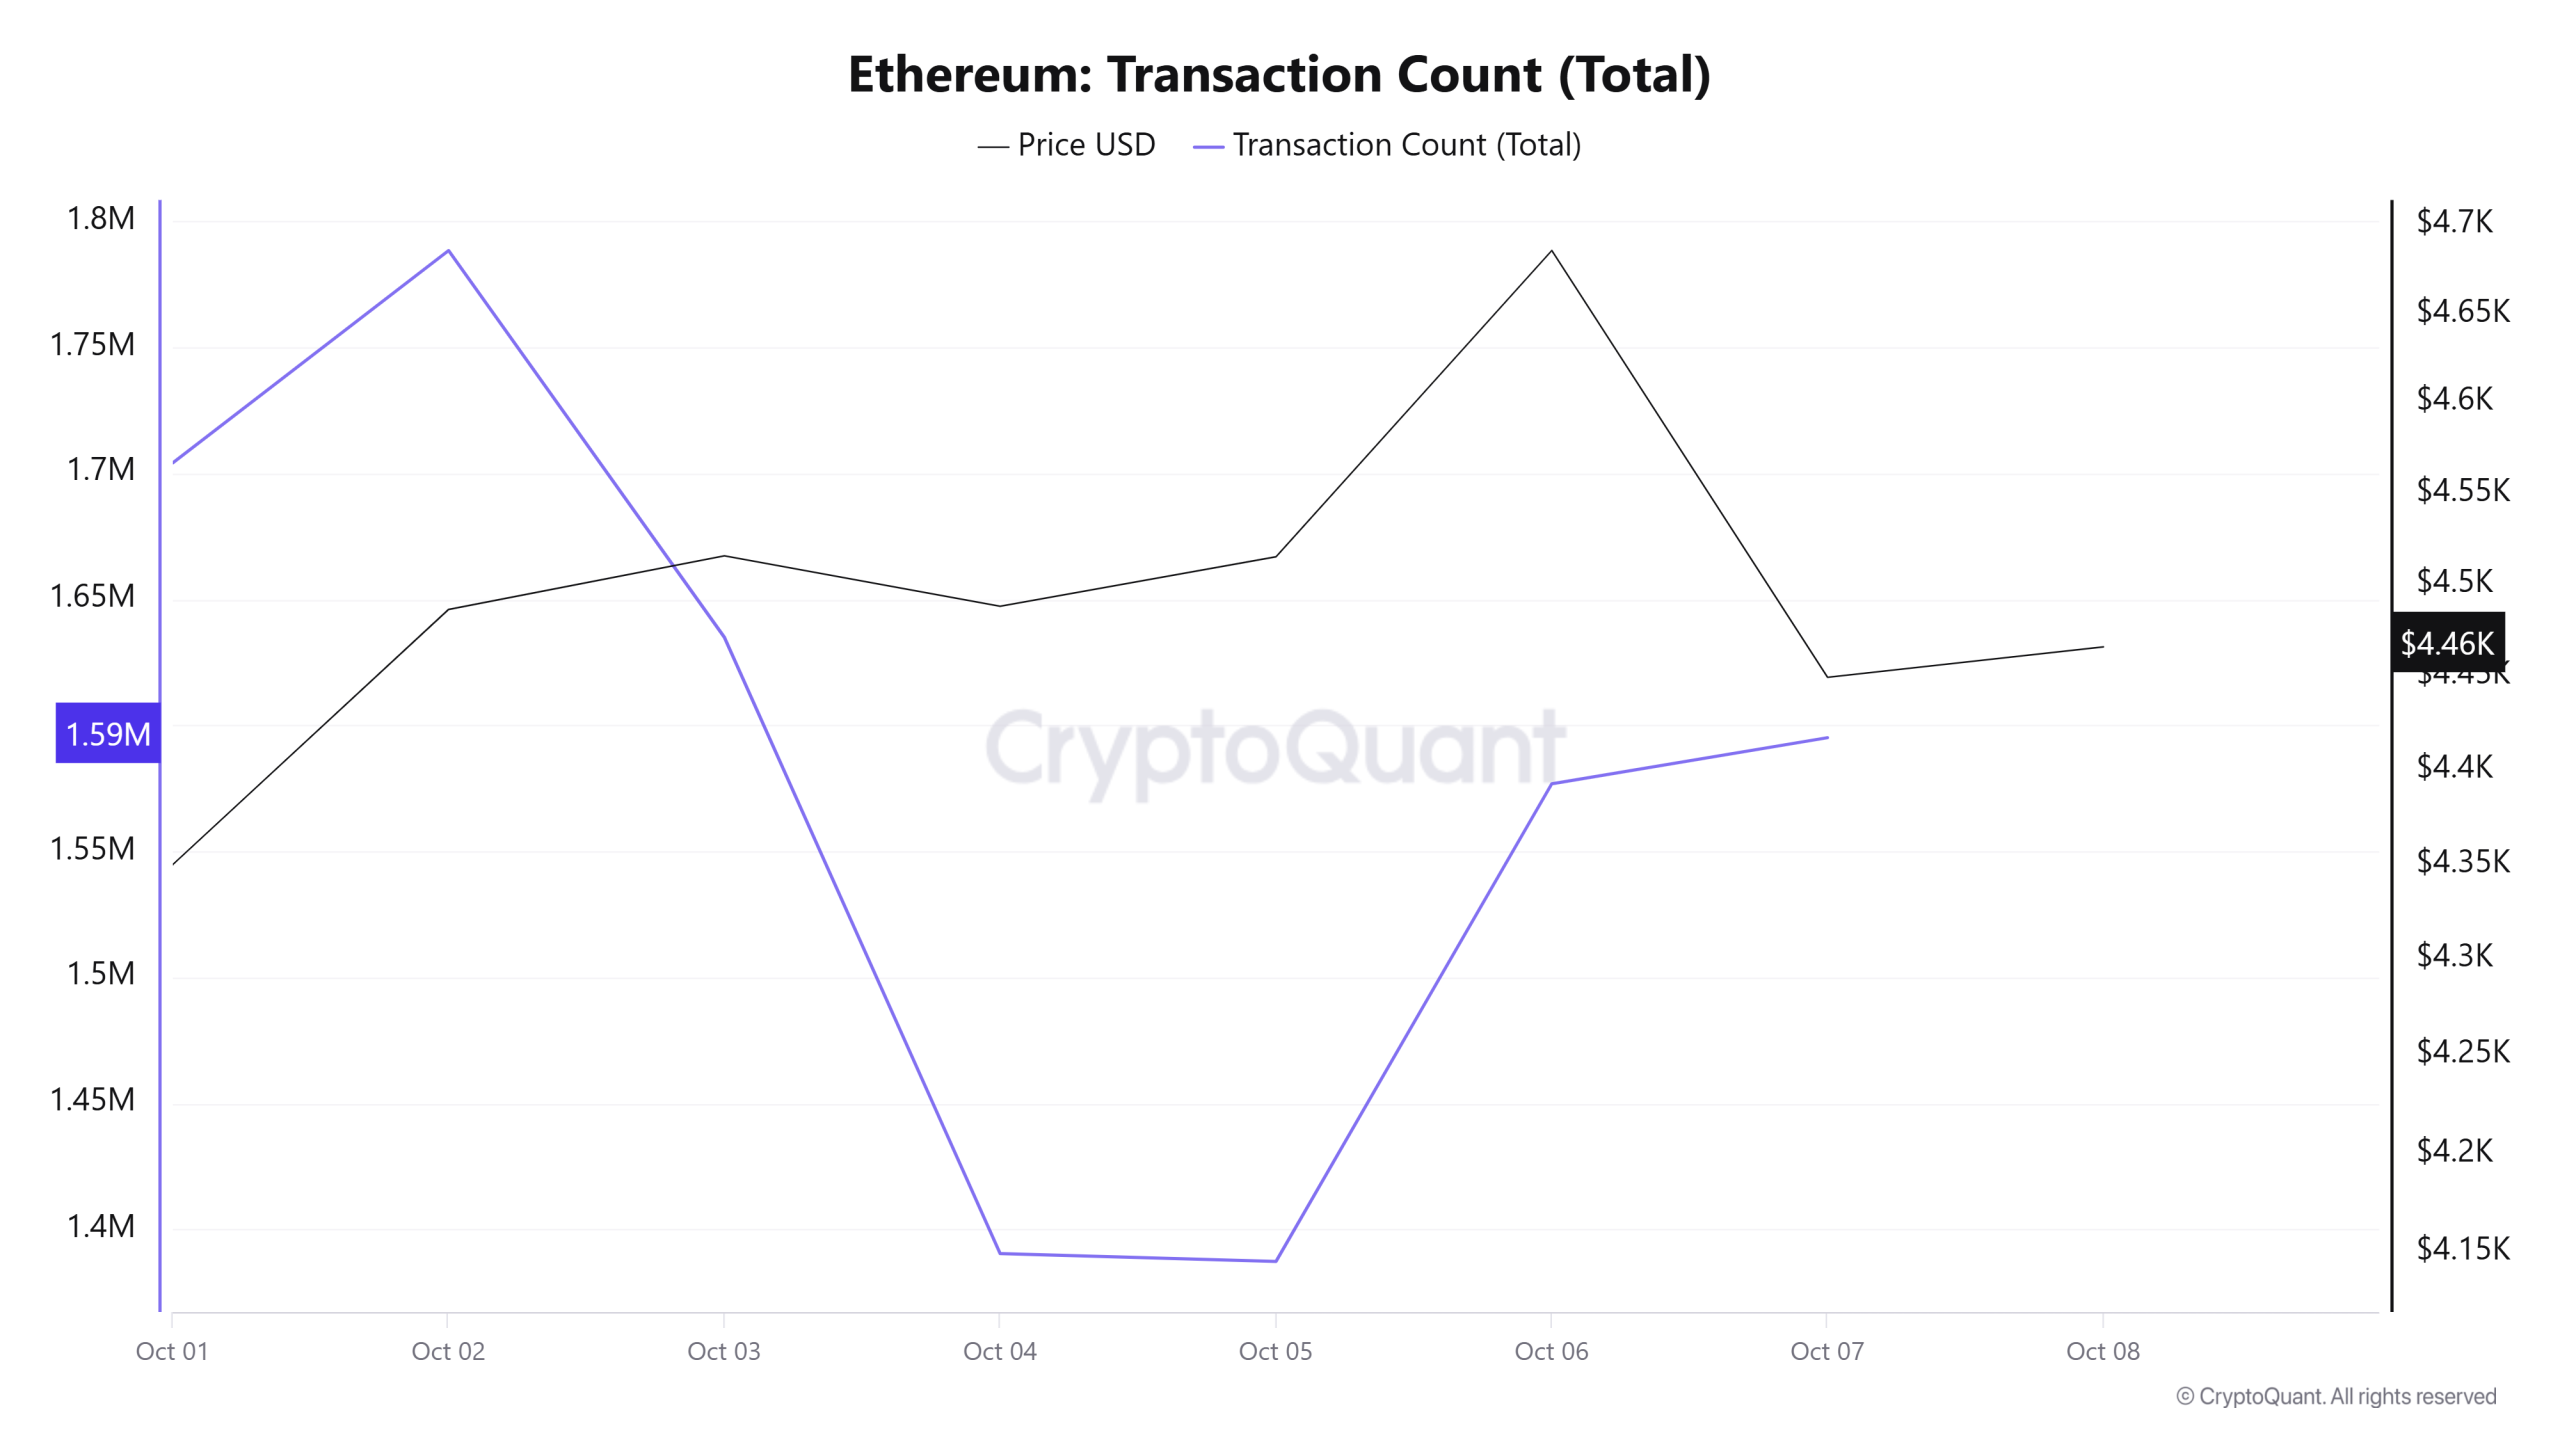
While a total of 11,152,344 transactions were made on the Ethereum network last week, the number of transactions this week decreased by about 0.68% to 11,076,994. On a weekly basis, the highest number of transactions was 1,788,467 on October 2 and the lowest number of transactions was 1,387,207 on October 5. The correlation between the number of trades and the price was mixed, alternating between positive and negative across days, so it is difficult to draw a clear conclusion on whether the transfer was a buy or a sell based on the available data.
On the other hand, the partial decline in network activity suggests that Ethereum burns realized through transactions are starting to lose strength, network activity has partially decreased, and less Ether is leaving the supply. This may signal that overall demand in the ecosystem may continue to shrink in the short term.
Tokens Transferred
The total amount of ETH transferred between last week and this week decreased by approximately 2.41% from 13,872,094 to 13,537,133. The highest transfer on a weekly basis was 2,688,239 ETH on October 7, while the lowest transfer was 945,803 ETH on October 4. On a daily basis, unbalanced changes between the amounts transferred are evident and market movements continue to fluctuate. The relationship between the price and the amount of tokens transferred during the period showed a balanced correlation. This makes it difficult to understand in which direction the transfers are dominated on the buy-sell side.
The decline in network activity and the amount of Ethereum transferred, although not a large numerical decline, can be interpreted as a harbinger of a period of stagnation in the market. This slowdown in transaction and transfer volumes suggests a short-term decline in user engagement. If a similar pattern persists in the coming weeks, it could signal that network activity has started to decline steadily, potentially affecting price movements.
Estimated Leverage Ratio
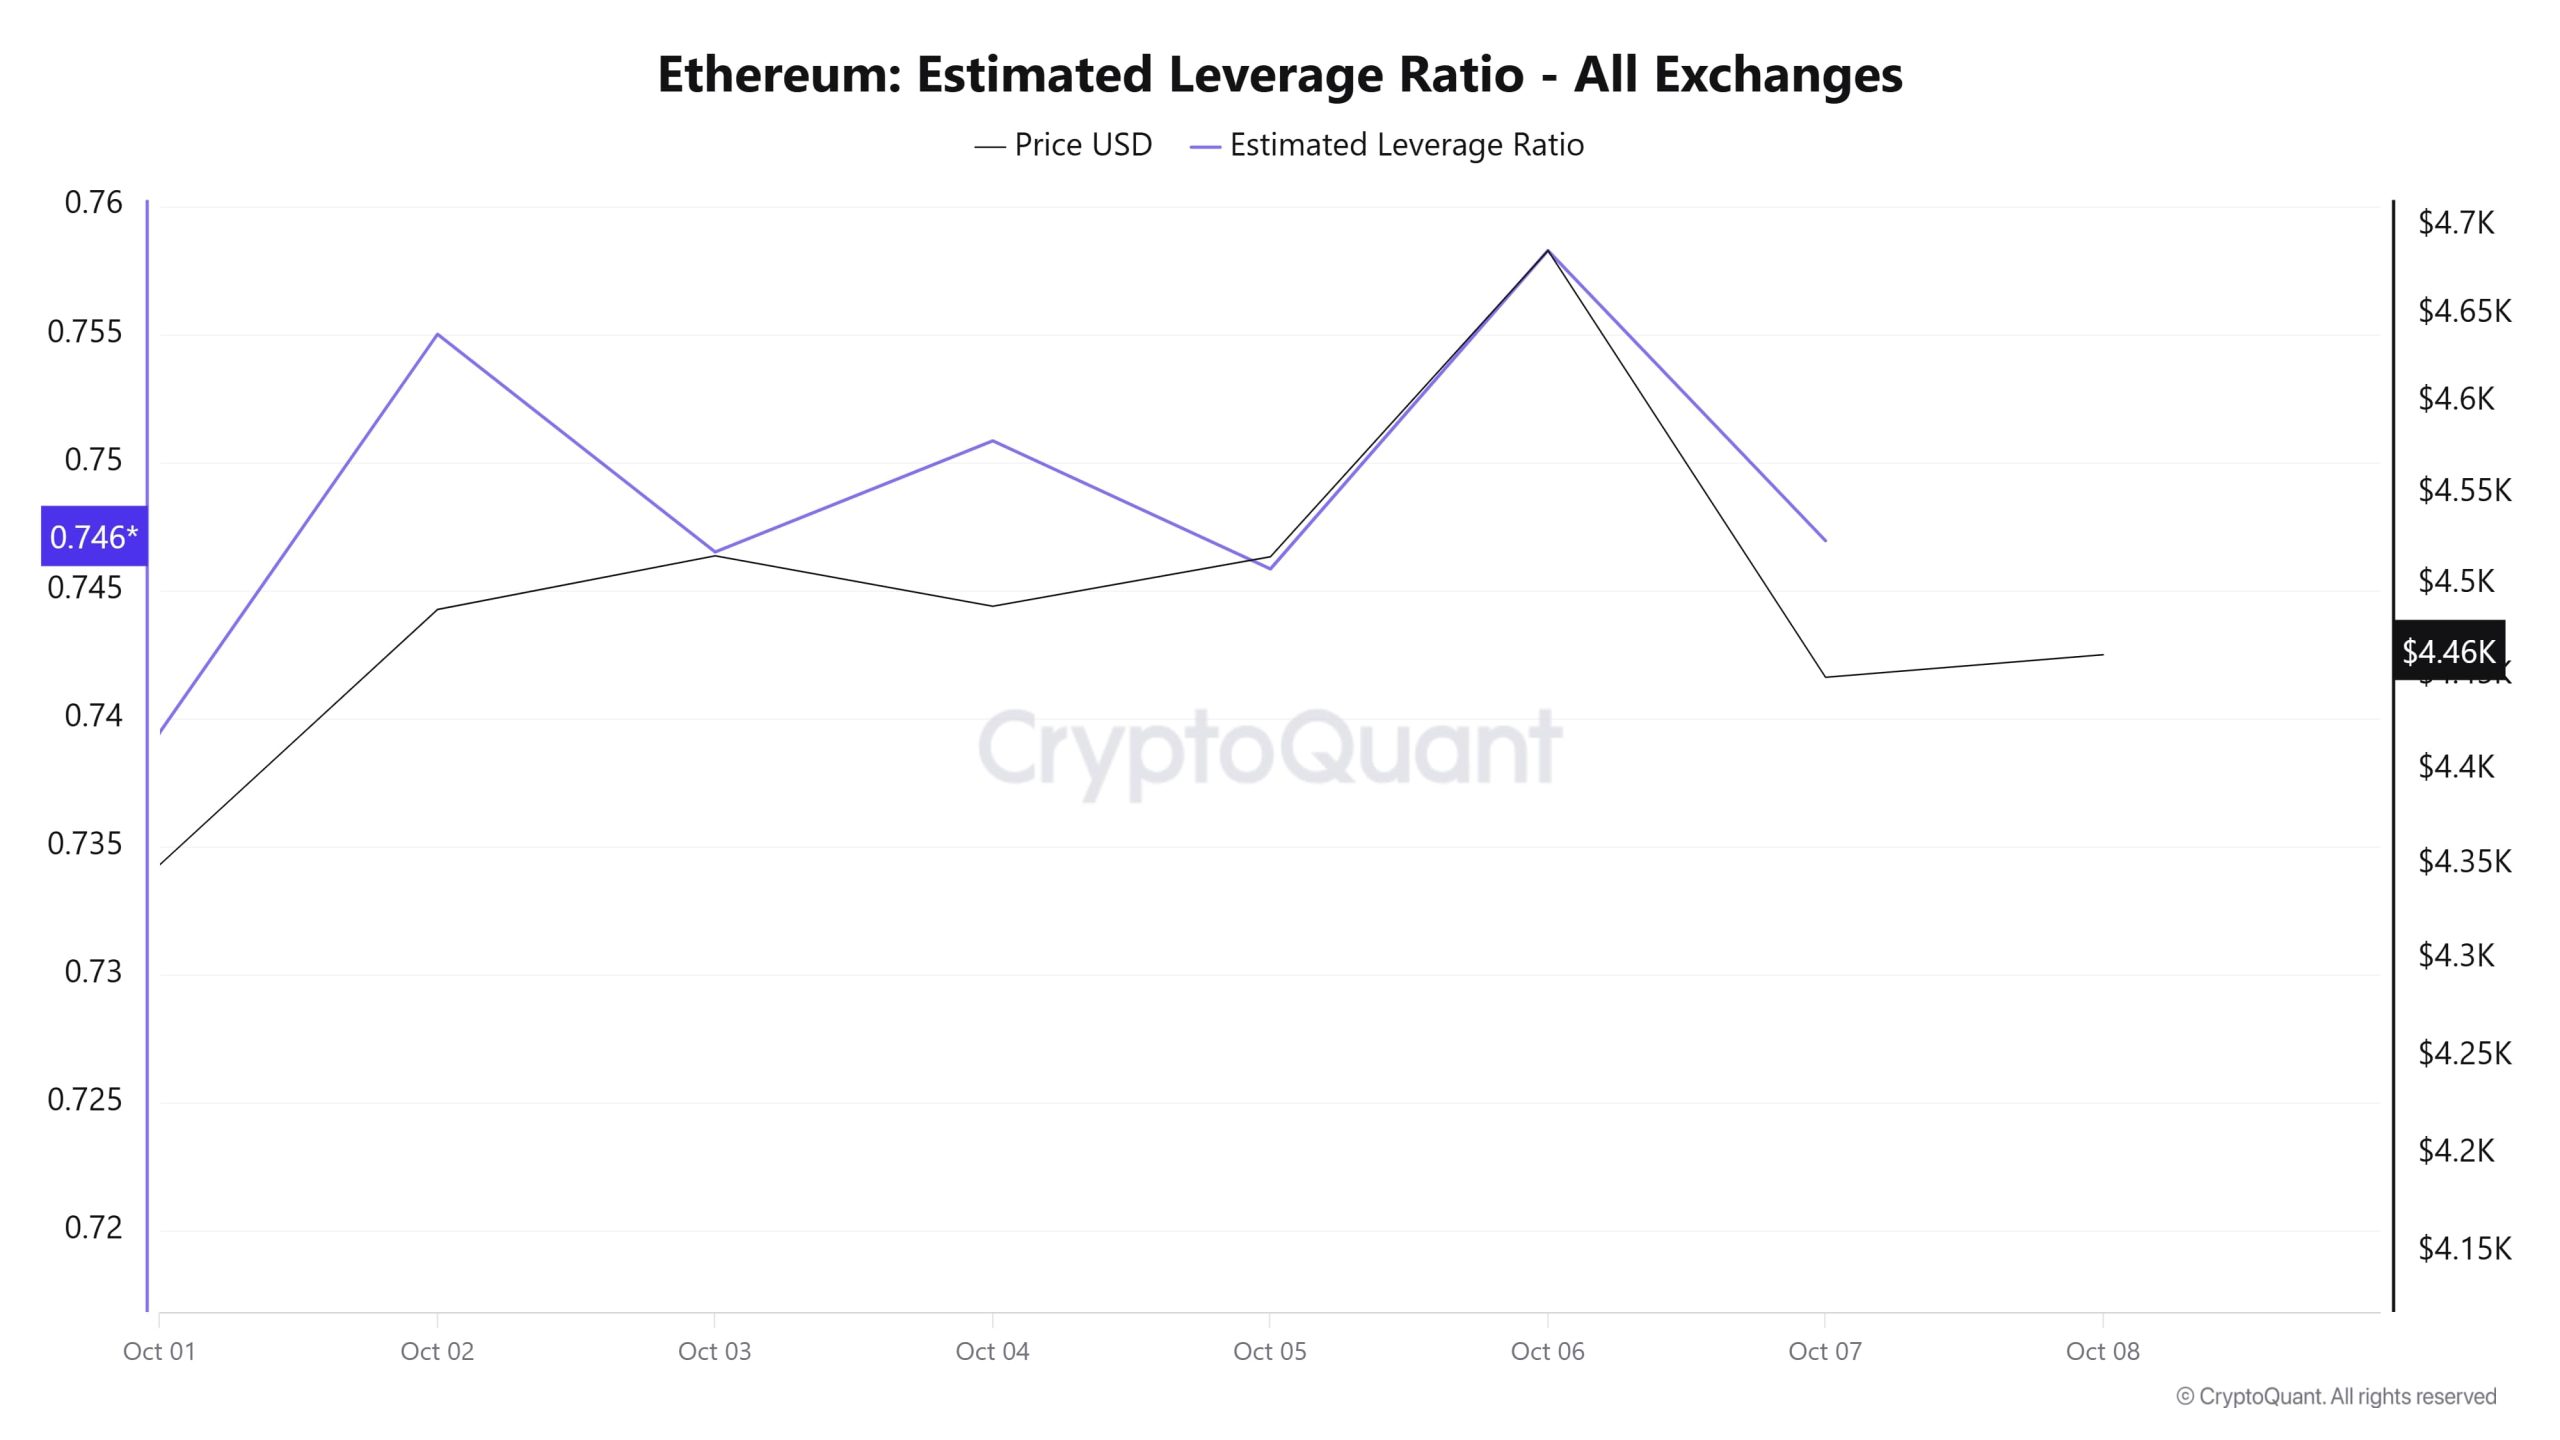
During the 7-day period, the metric moved in a narrow band from the beginning to the end of the process. ELR (Estimated Leverage Ratio), which had a value of 0.739 at the beginning of the process, also formed the lowest point of the process. On October 6, it rose to 0.758, forming the highest point of the process. At the time of writing, it stands at 0.746. A higher ELR means that participants are willing to take on more risk and usually indicates bullish conditions or expectations. It should be noted that these rises can also be caused by a decrease in reserves. When we look at Ethereum reserves, there were 16.18 million reserves at the beginning of the process, while this figure decreased slightly during the rest of the process and is currently seen as 16.10 million. At the same time, Ethereum’s Open Interest is seen as 54.61 billion dollars at the beginning of the process. As of now, the volume increased in the process and the open interest value stood out as $ 60.36 billion. With all this data, the ELR metric experienced a slight increase in the early times of the process, but moved in a narrow band for the rest of the time. The price of the asset moved between $4,155 and $4,750 with all this data. At the moment, the risk appetite of investors and traders is moving in a balanced manner. The increase in the volume of open interest data, which appears throughout the process, and the slight decrease in reserves shows us that the slight increase in the ELR ratio shows us that the risk appetite among investors is slightly formed. As a result, the slight withdrawal of reserves and the increase in open interest have caused an increase in the ELR metric in a narrow band. This indicated that the market was pessimistic, but risk appetite was building.
ETH Onchain Overall
| Metric | Positive 📈 | Negative 📉 | Neutral ➖ |
|---|---|---|---|
| Active Addresses | ✓ | ||
| Total Value Staked | ✓ | ||
| Derivatives | ✓ | ||
| Supply Distribution | ✓ | ||
| Exchange Supply Ratio | ✓ | ||
| Exchange Reserve | ✓ | ||
| Fees and Revenues | ✓ | ||
| Bloks Mined | ✓ | ||
| Transaction | ✓ | ||
| Estimated Leverage Ratio | ✓ |
*The metrics and guidance in the table do not, in and of themselves, describe or imply an expectation of future price changes for any asset. The prices of digital assets may vary depending on many different variables. The onchain analysis and related guidance are intended to assist investors in their decision-making process, and making financial investments based solely on the results of this analysis may result in harmful transactions. Even if all metrics produce a positive, negative or neutral result at the same time, the expected results may not be seen according to market conditions. Investors reviewing the report would be well advised to heed these caveats.
Legal Notice
The investment information, comments and recommendations contained in this document do not constitute investment advisory services. Investment advisory services are provided by authorized institutions on a personal basis, taking into account the risk and return preferences of individuals. The comments and recommendations contained in this document are of a general type. These recommendations may not be suitable for your financial situation and risk and return preferences. Therefore, making an investment decision based solely on the information contained in this document may not result in results that are in line with your expectations.
NOTE: All data used in Ethereum onchain analysis is based on Cryptoqaunt.