
Active Addresses
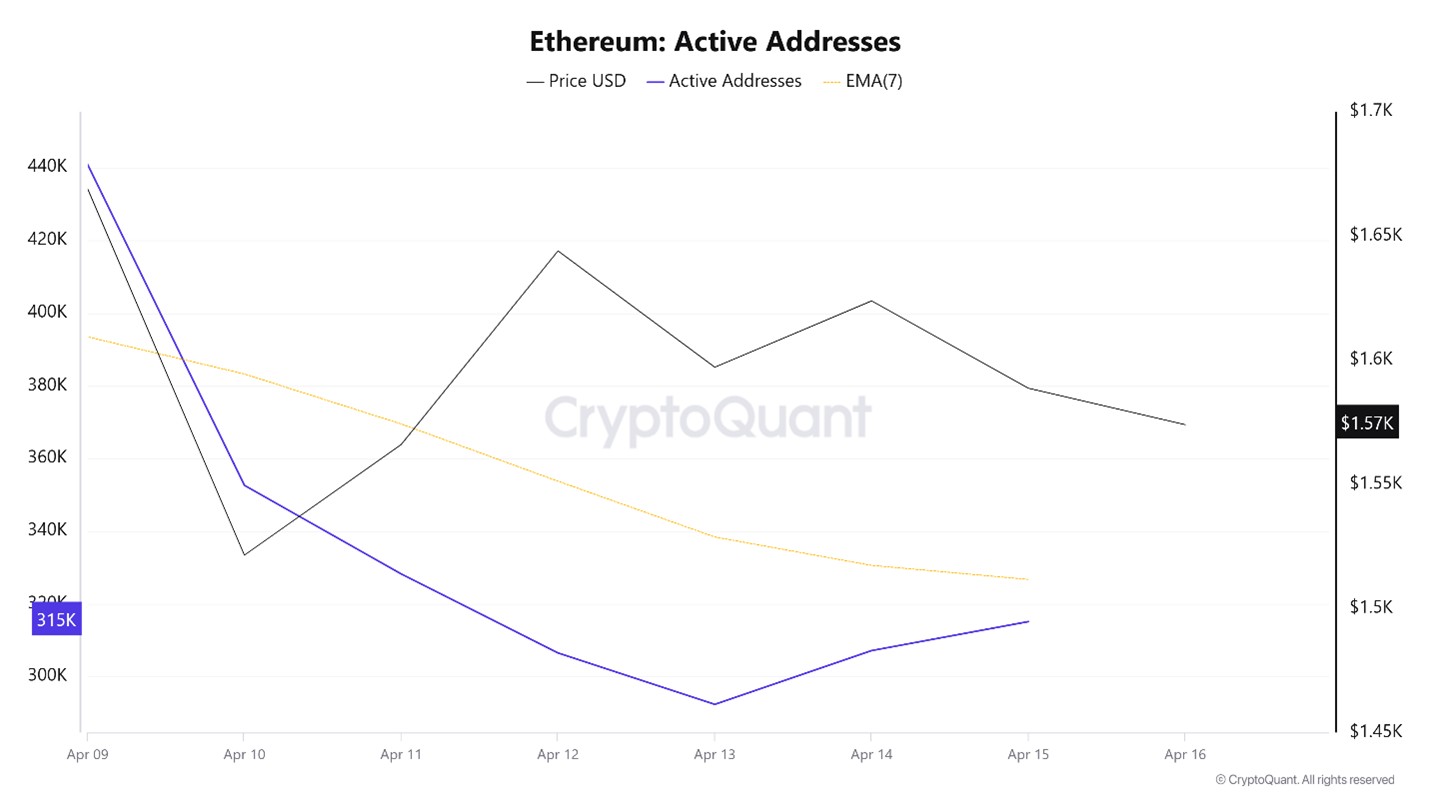
In terms of the number of active addresses, there were 352,657 active entries on the ETH network between April 9 and April 16, 2025, this week. Ethereum fell to $1,521 during this period. The chart shows that Ethereum purchases are gradually decreasing in the area where the price and the number of active addresses intersect. When we follow the 7-day simple moving average, it is observed that the price follows an upward trend on the dates when this average cut the price.
Active Sending Addresses
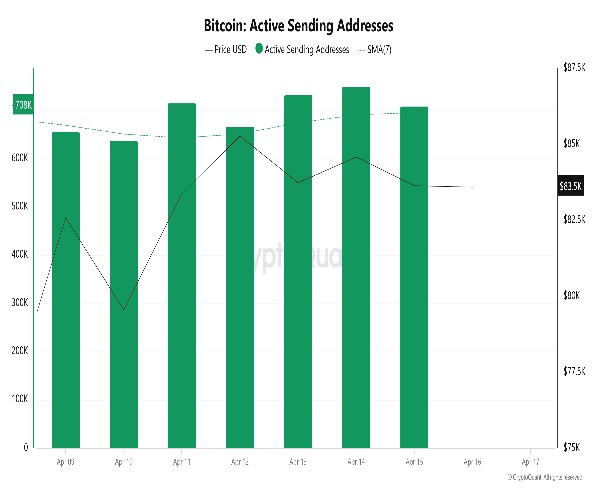
With the Black Line (price line) in active shipping addresses, there was a significant drop in active shipping addresses on April 10. On the day when the price hit its lowest point, active shipping addresses dropped to 237,699, indicating that buyers sold their positions as Ethereum remained at 1,521 for a while. As a result, it is seen that price drops cause an acceleration in sending addresses.
Active Receiving Addresses
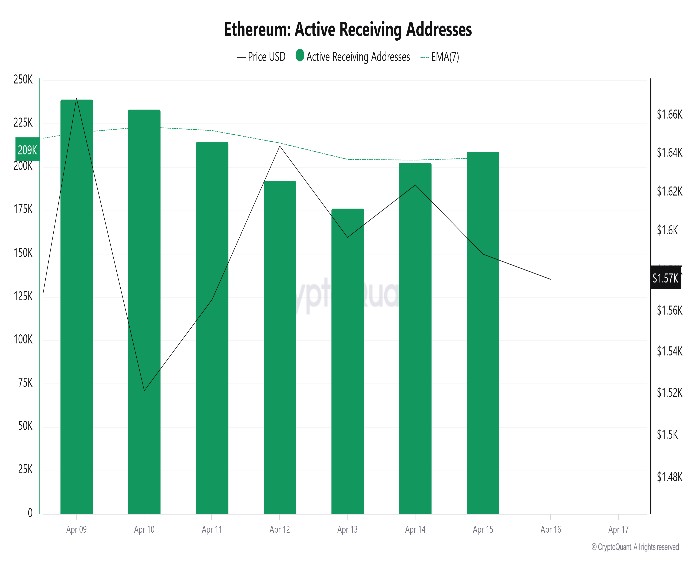
Along with the Black Line (price line) in active sending addresses, there has been a significant drop in active buying addresses after April 13. On the day of the price low, active shipping addresses rose to 176,215 , indicating that buyers took their positions at Ethereum’s $1,592 level.
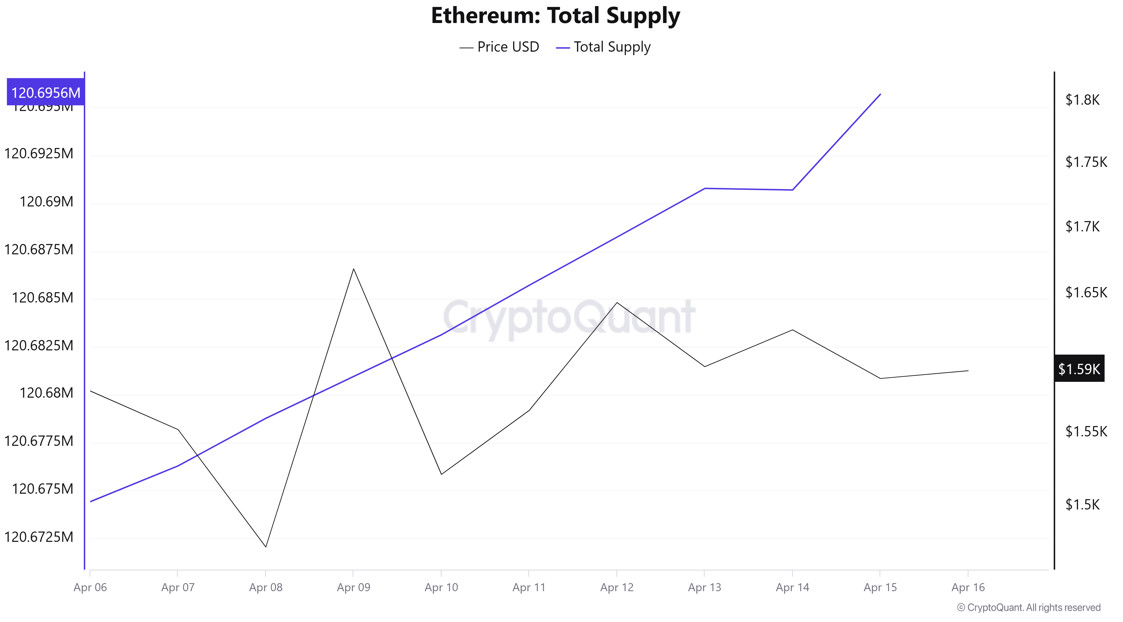
Total Value Staked
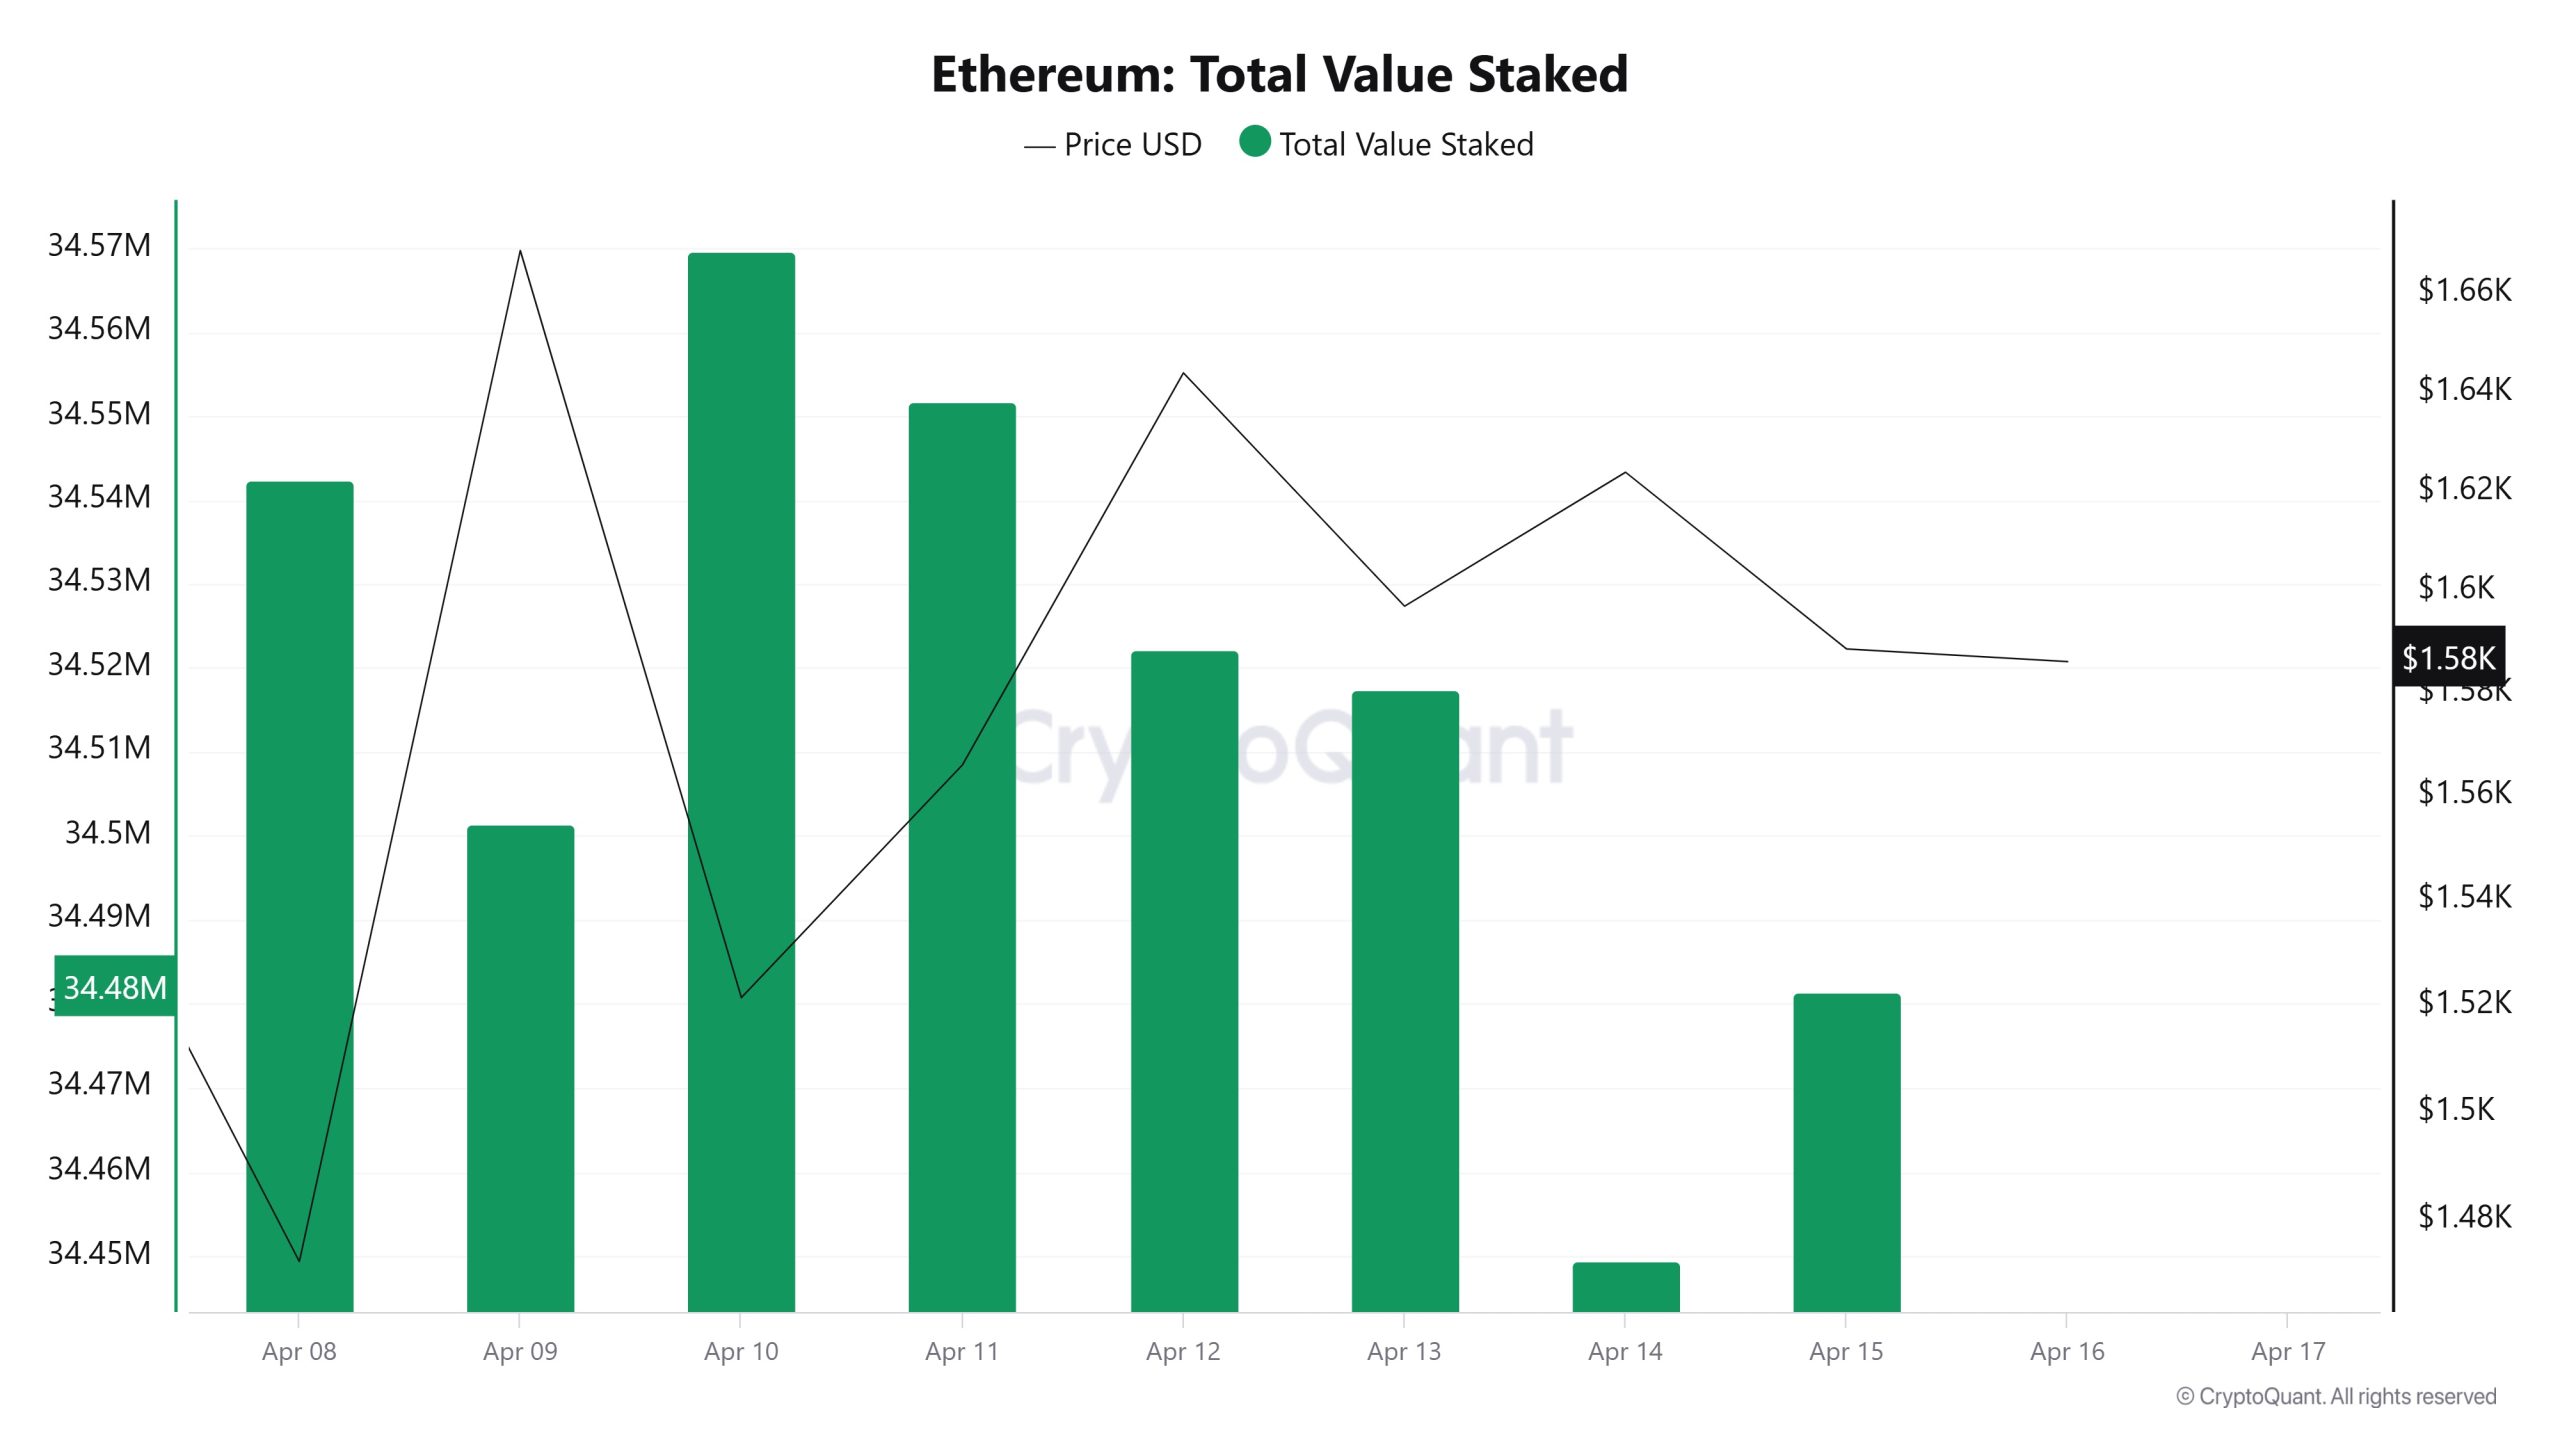
On April 9, ETH price was 1,669 while Total Value Staked was 34,501,341. As of April 15, ETH price was down to 1,588 while Total Value Staked Ratio was 34,481,493. Compared to last week, ETH price decreased by 4.85% while Total Value Staked Ratio decreased by 0.058%.
Staking Inflows
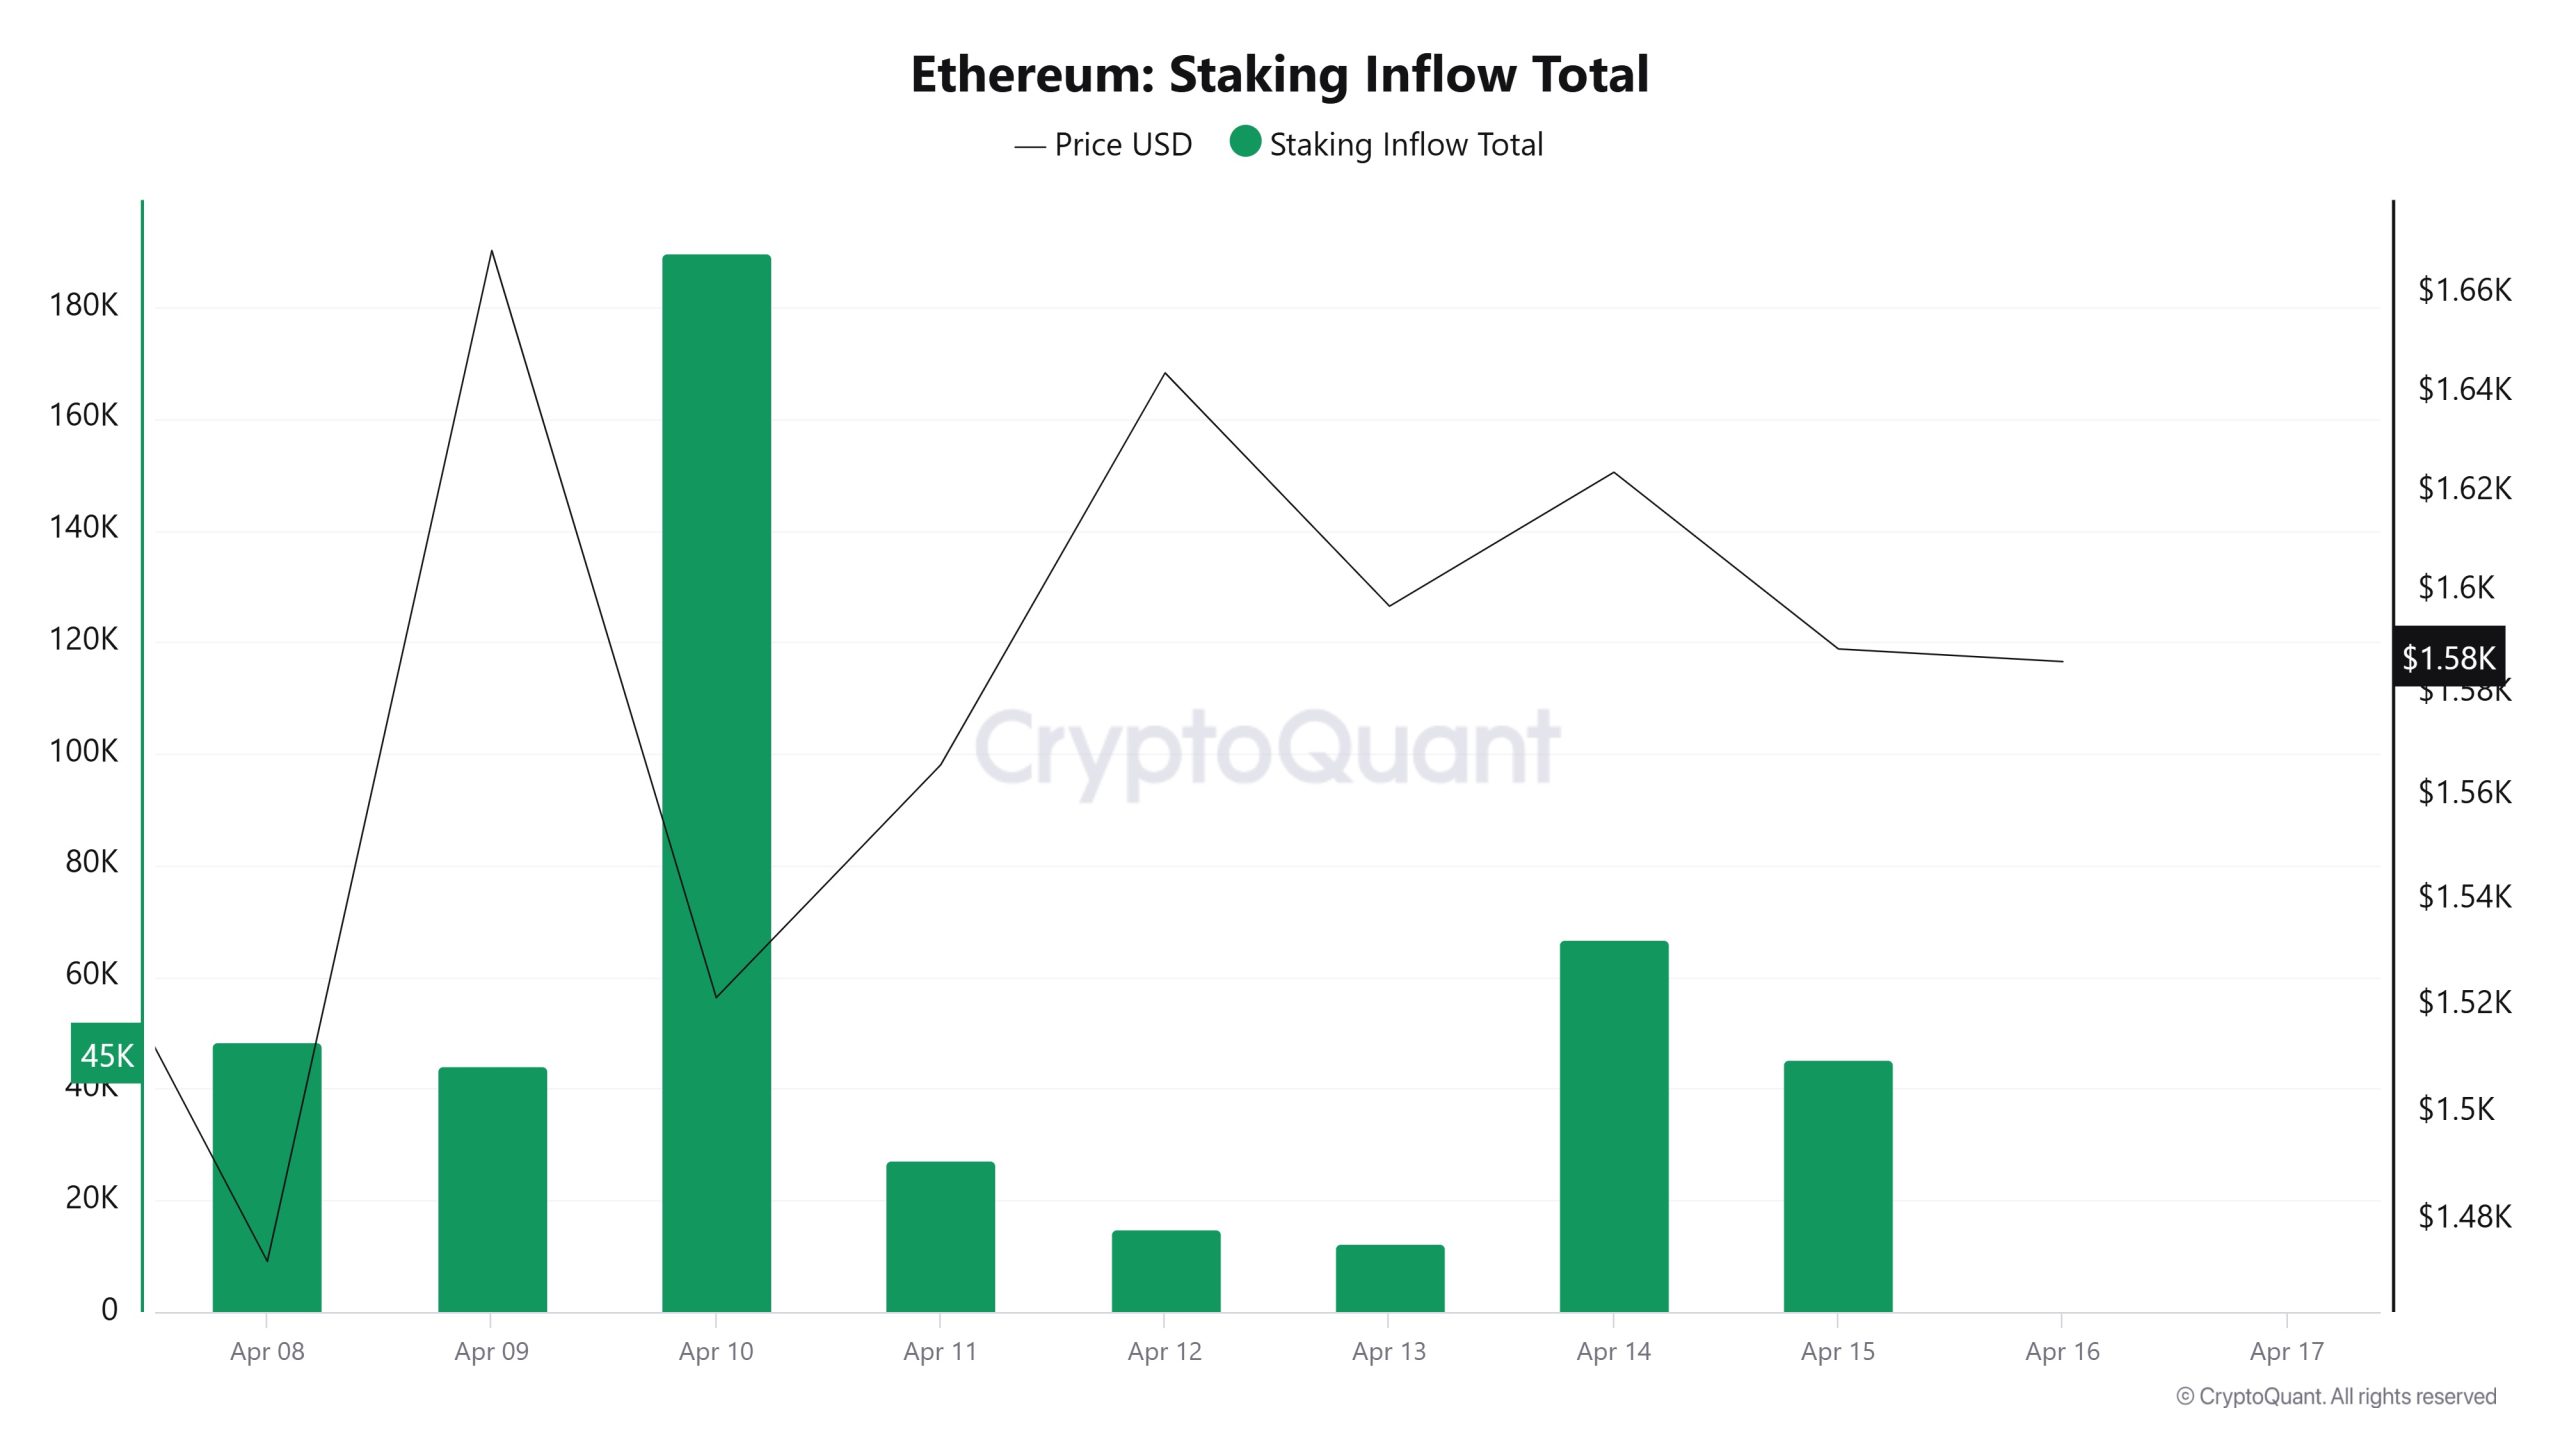
On April 9th, the ETH price was at 1,669 while the Staking Inflow Ratio was 44,277. As of April 15th, the ETH price decreased to 1,588 while the Staking Inflow Ratio increased to 45,385. Compared to last week, there was a 4.85% decrease in ETH price and a 2.5% increase in Staking Inflow Ratio .
Derivatives
Open Interest
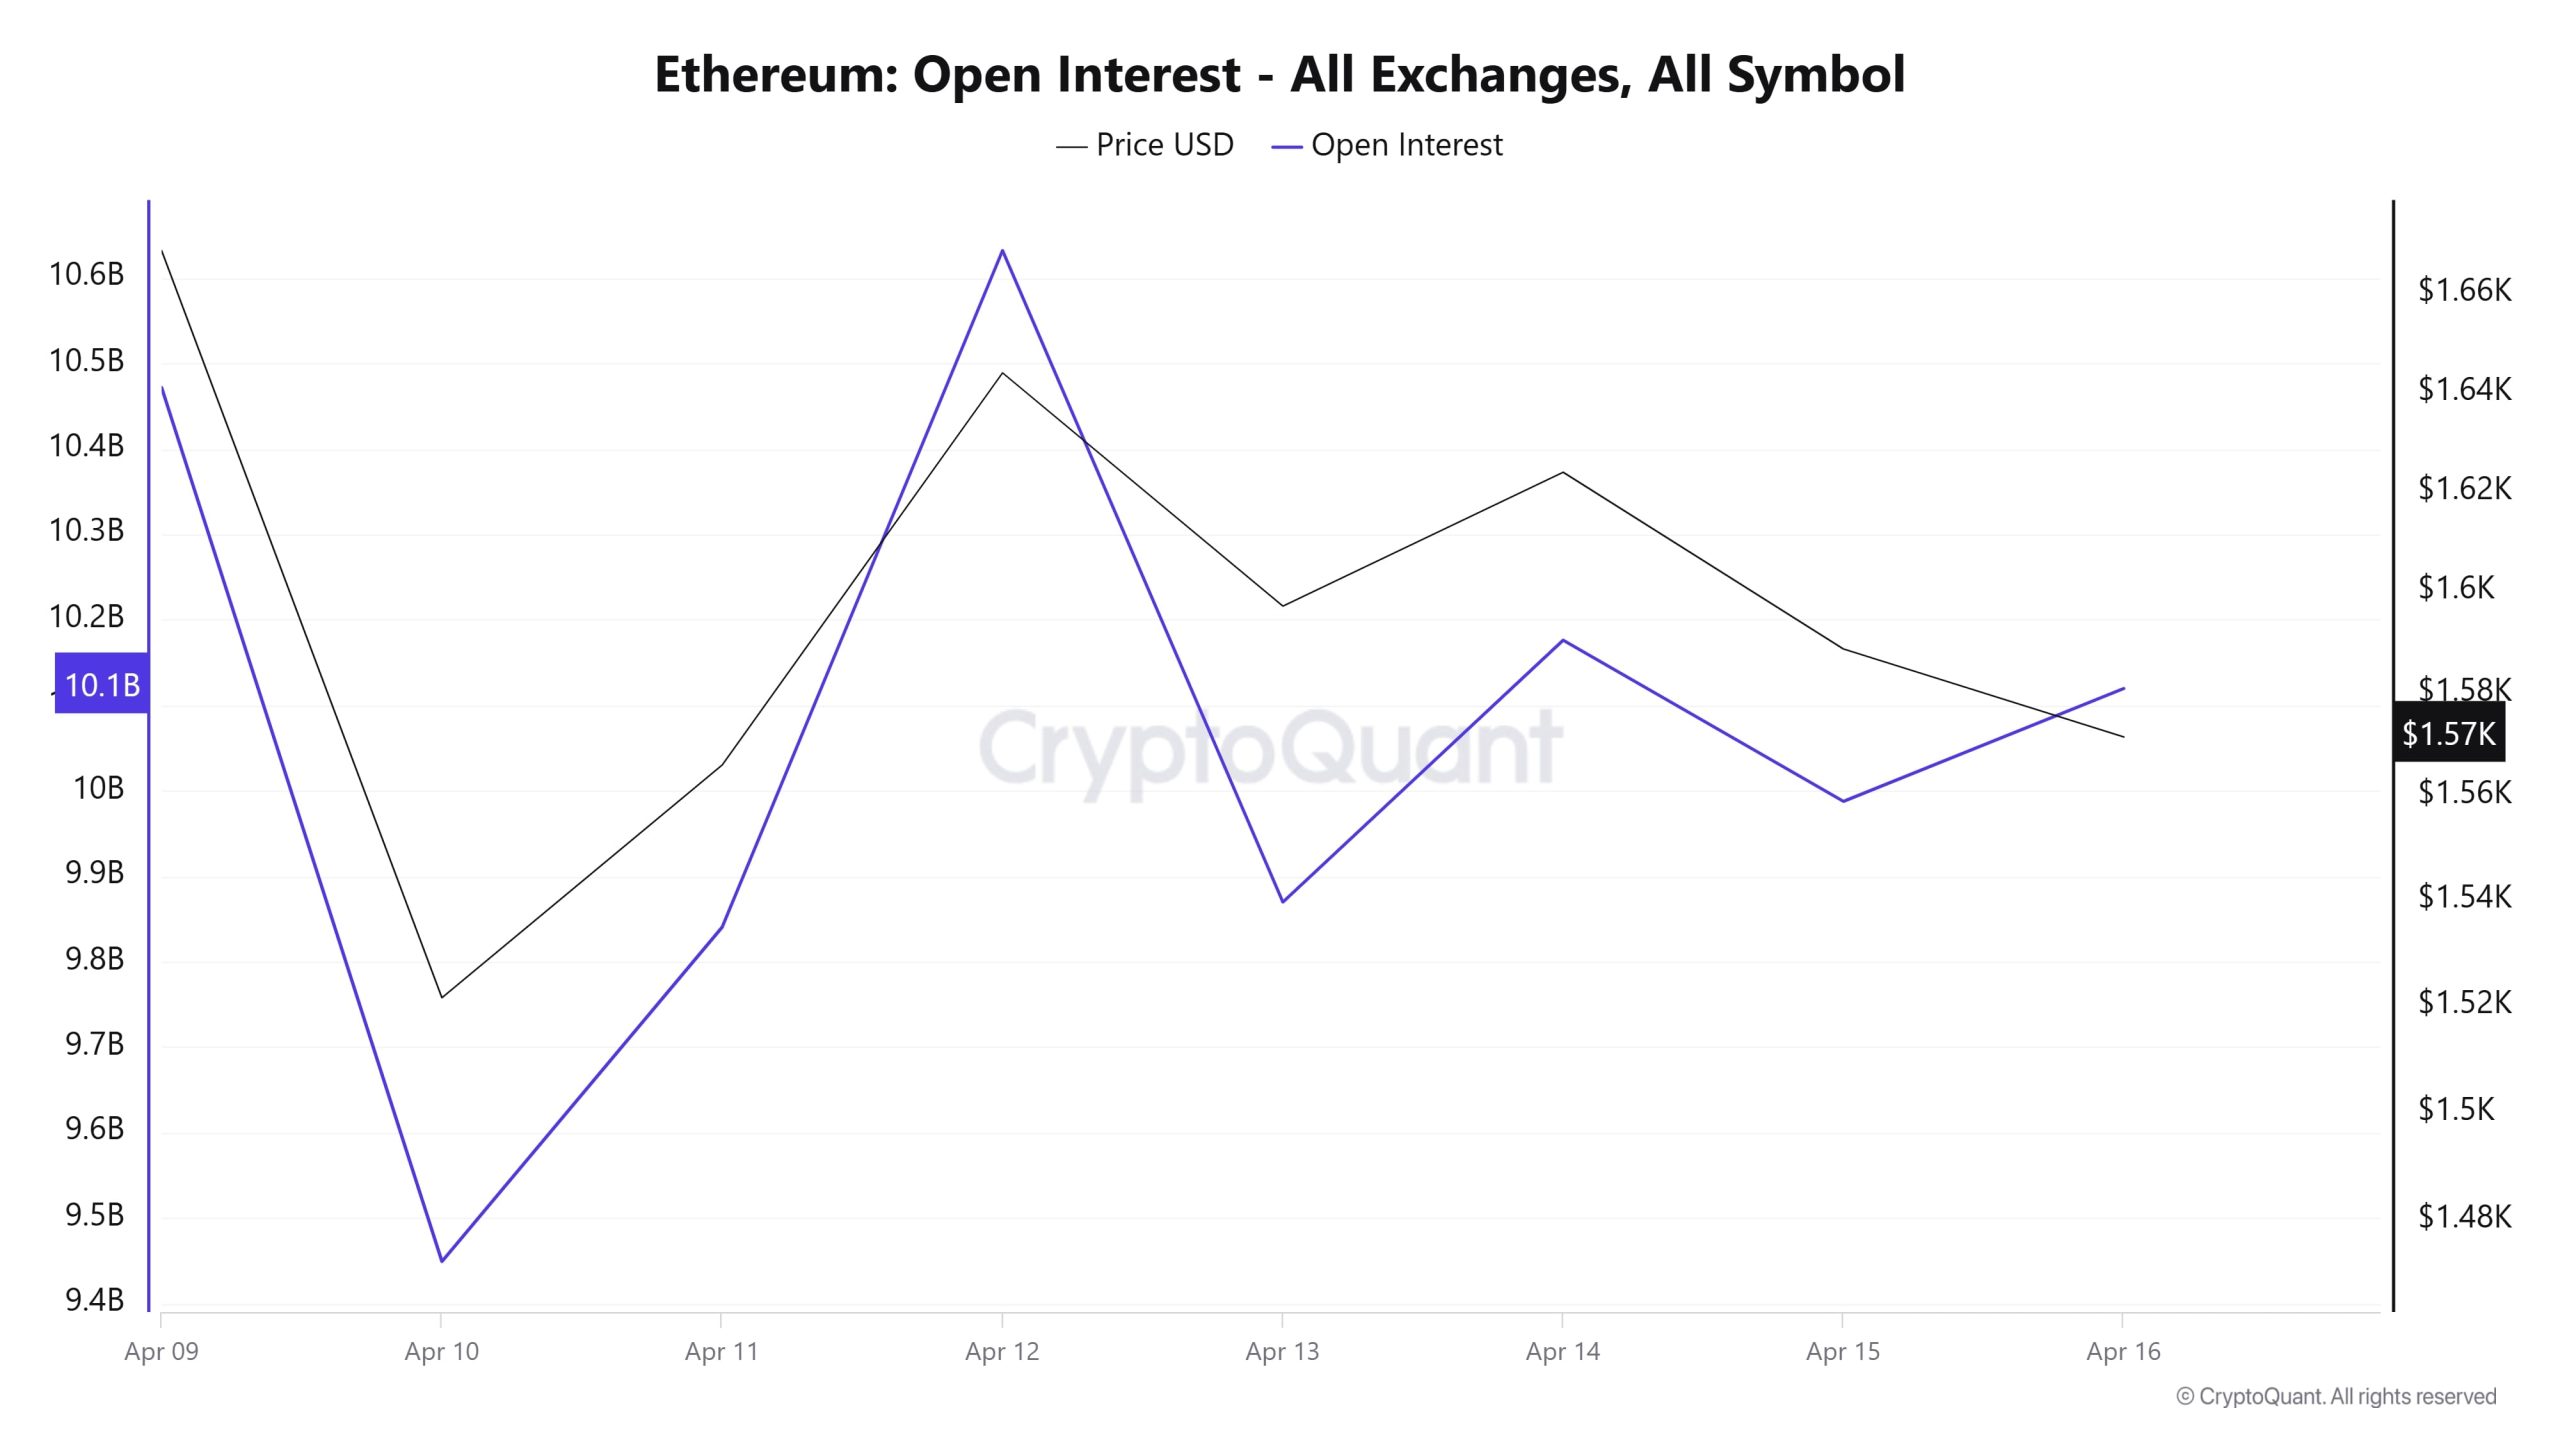
ETH, which started the week with an open interest of $10.5 billion, experienced a significant drop in both price and open interest on April 10. Open interest fell to around $9.4 billion, indicating position closures and the unwinding of leveraged trades. On the same date, the ETH price also supported this decline, falling to around $1,480. But on April 11 and 12, open interest rebounded to $10.6 billion. With this movement, the price rises to around $1,640. That is to say, the market has moved again, longs have gained weight. However, this rise is not very permanent. As of April 13, both price and open interest started to fall again. On April 14, open interest falls below 10 billion and the price falls to 1,600. On the last day, April 16, open interest recovered a bit (around $10 billion), but the price remained at $1,570.
Funding Rate
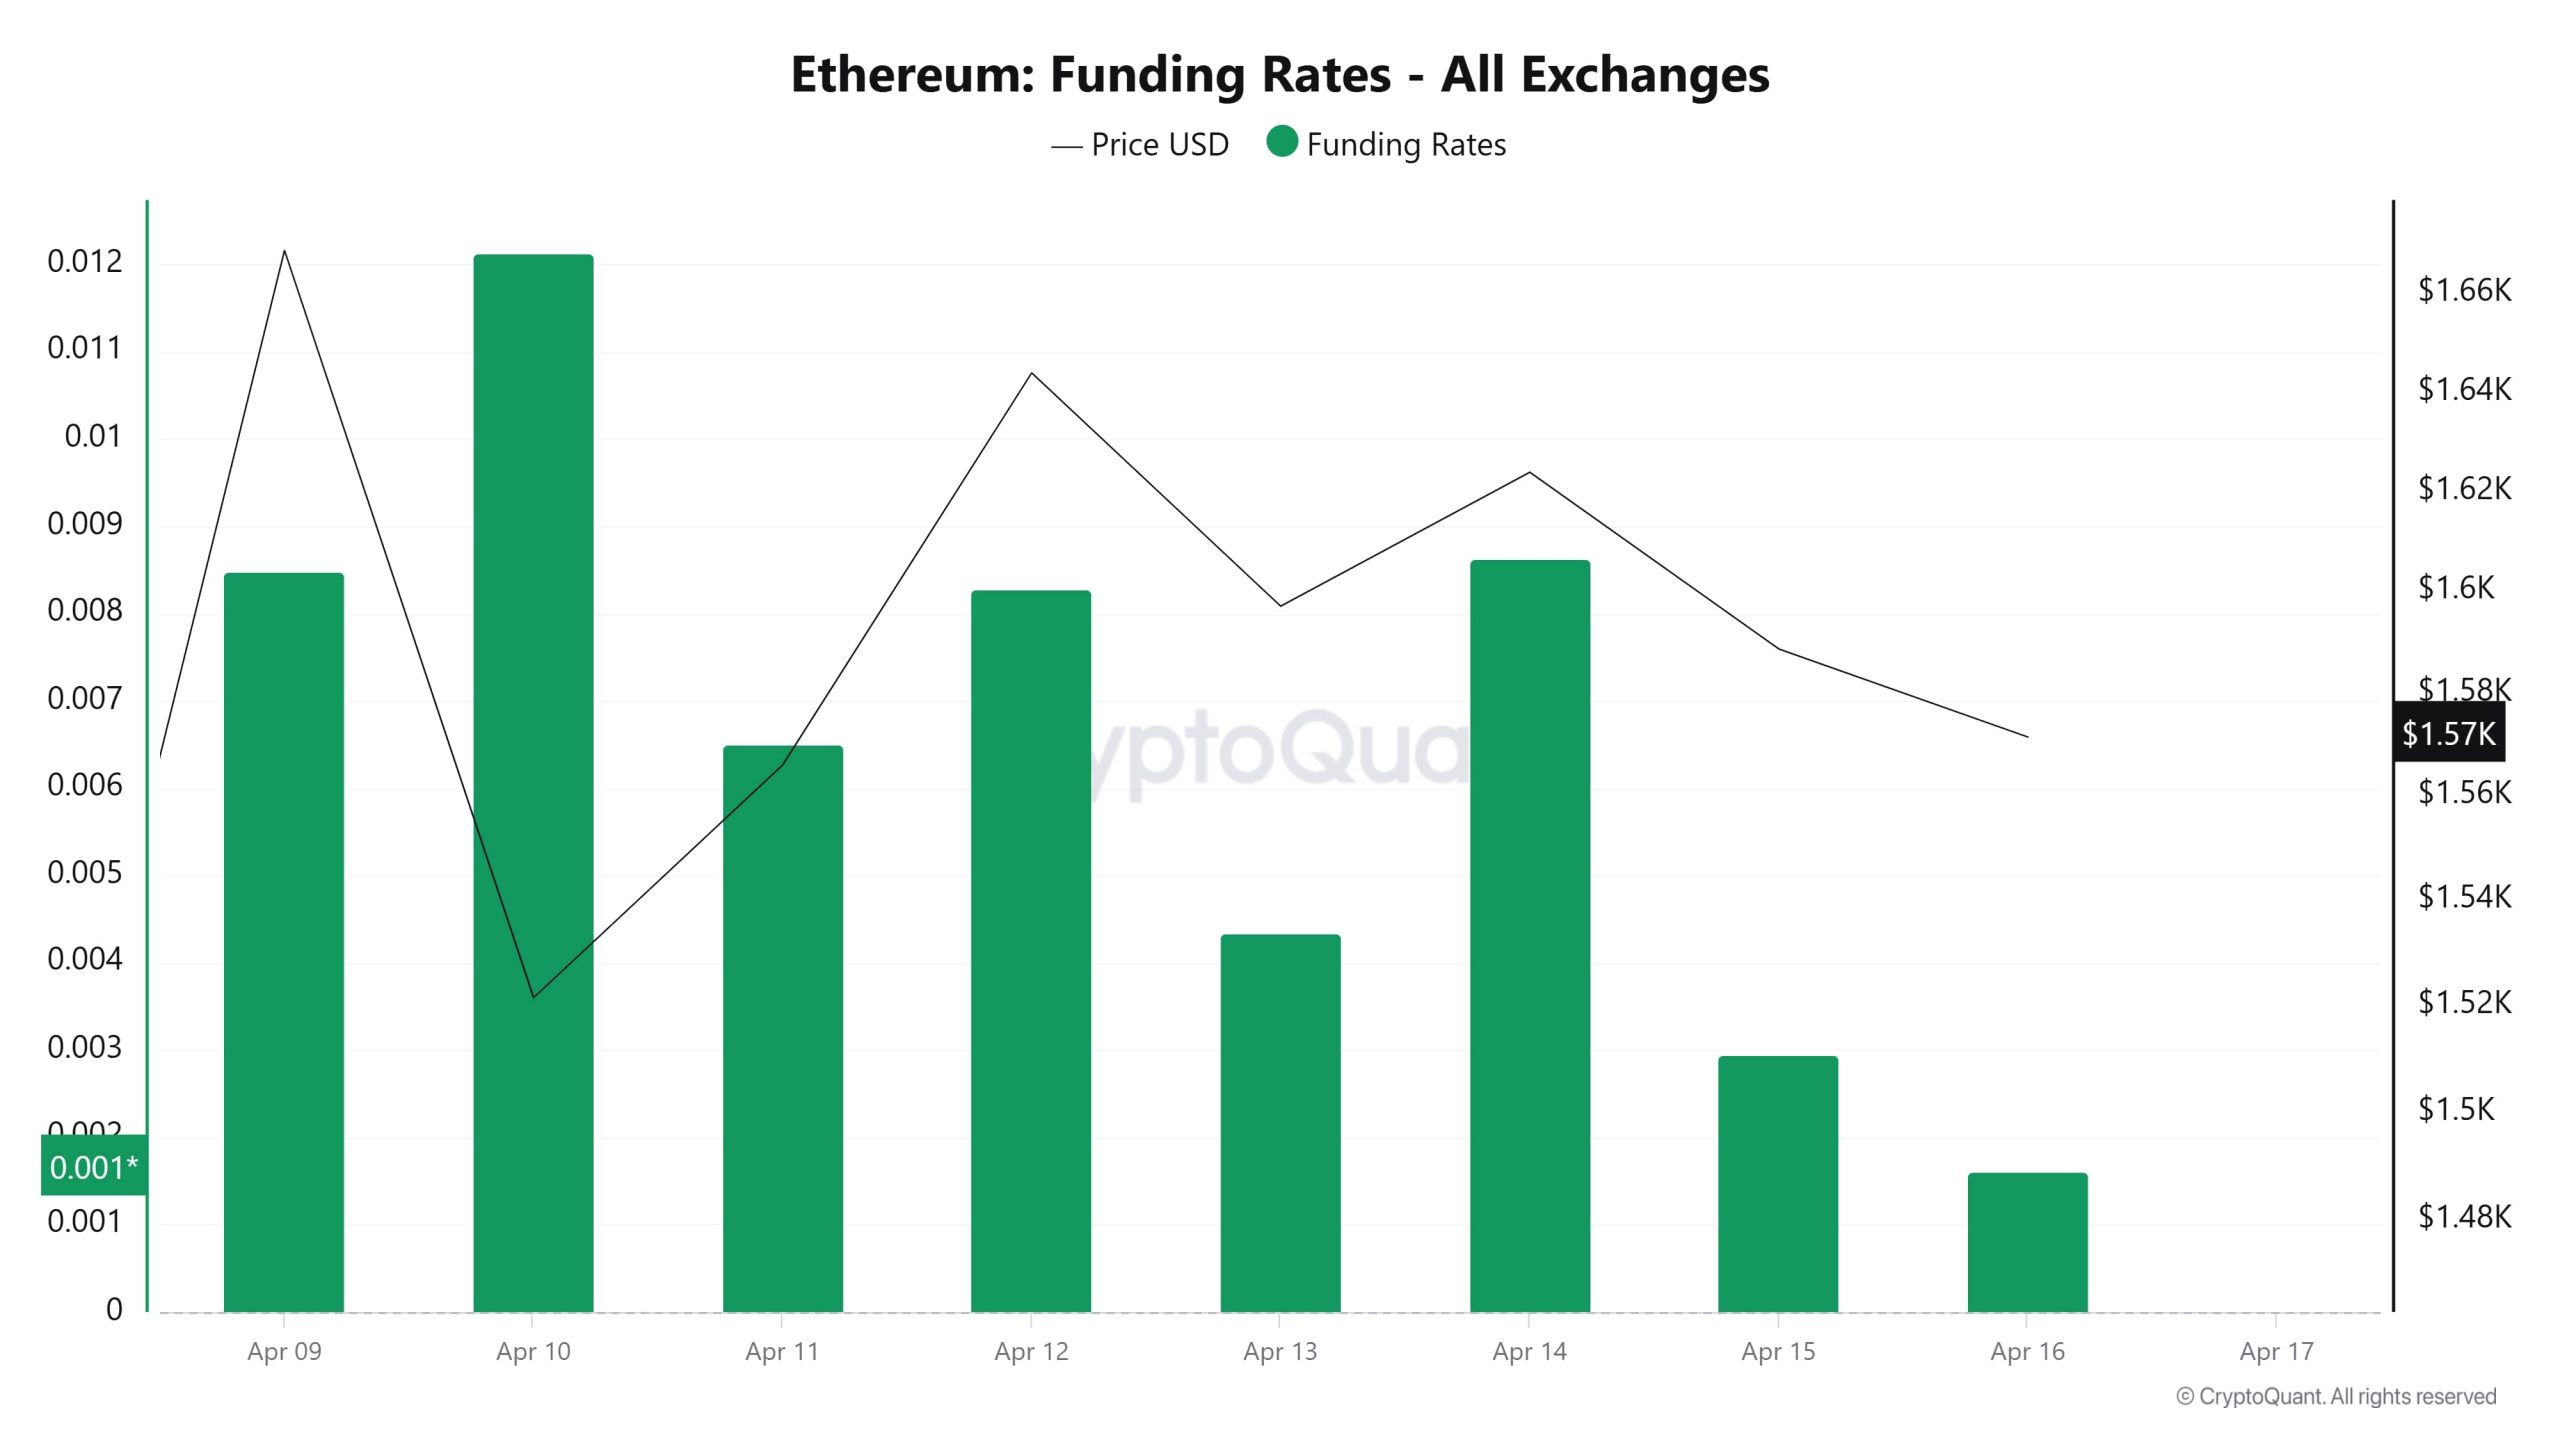
On April 9, the funding rate was around 0.0085, while the Ethereum price was around $1,669. On April 10, the funding rate reached a high of over 0.012. Meanwhile, the price of Ethereum fell sharply to around $1,530. This indicates that excessive long positions accumulated in the market and a correction followed. On April 11 and 12, the funding rate fell again to 0.0082, while the price rebounded to above $1,600. On April 14, the funding rate rose once again to 0.0085. Meanwhile, the Ethereum price was around $1,610. But then, on April 15 and 16, the funding rate dropped to 0.0029 and 0.0016, respectively, while the price dropped again to $1,570. In general, the chart shows that rises in funding rates are usually followed by price declines, suggesting that corrections are occurring at times when long pressure in the market is increasing. In recent days, the funding rate has fallen considerably, suggesting that the long appetite in the market is decreasing or becoming more
Long & Short Liquidations
ETH, which has risen from a low of $1,389 to $1,690 since the beginning of the week, is currently hovering at $1,575. Despite the rise in price, the high volatility in this period brought almost equal amounts of long and short liquidation. During this period, a long position of 362 million dollars and a short position of 393 million dollars were liquidated.
| Date | Long Amount (Million $) | Short Amount (Million $) |
|---|---|---|
| April 09 | 73.91 | 171.73 |
| April 10 | 116.64 | 31.21 |
| April 11 | 21.45 | 39.74 |
| April 12 | 12.19 | 73.10 |
| April 13 | 66.07 | 25.38 |
| April 14 | 36.32 | 37.54 |
| April 15 | 35.50 | 14.67 |
| Total | 362.08 | 393.37 |
Supply Distribution
Total Supply: It reached 120,652,063 units, up about 0.0320% from last week.
New Supply: The amount of ETH produced this week was 38,630.
Velocity: Velocity, which was 7.69 last week, was 7.73 as of April 14.
| Wallet Category | 07.04.2025 | 14.04.2025 | Change (%) |
|---|---|---|---|
| 100 – 1k ETH | 9.3971M | 9.2894M | -1.15% |
| 1k – 10k ETH | 12.6666M | 12.565M | -0.80% |
| 10k – 100k ETH | 16.3439M | 16.1504M | -1.18% |
| 100k+ ETH | 5.4636M | 5.1282M | -6.14% |
According to the latest data, there was a decrease of 1.15% in 100 – 1k ETH wallets, while the 1k – 10k ETH category also saw a decrease of 0.80%. While the 1.18% decrease in the 10k – 100k ETH range was noteworthy, the most significant change occurred in 100k+ ETH wallets with a decrease of 6.14%.
Exchange Reserve
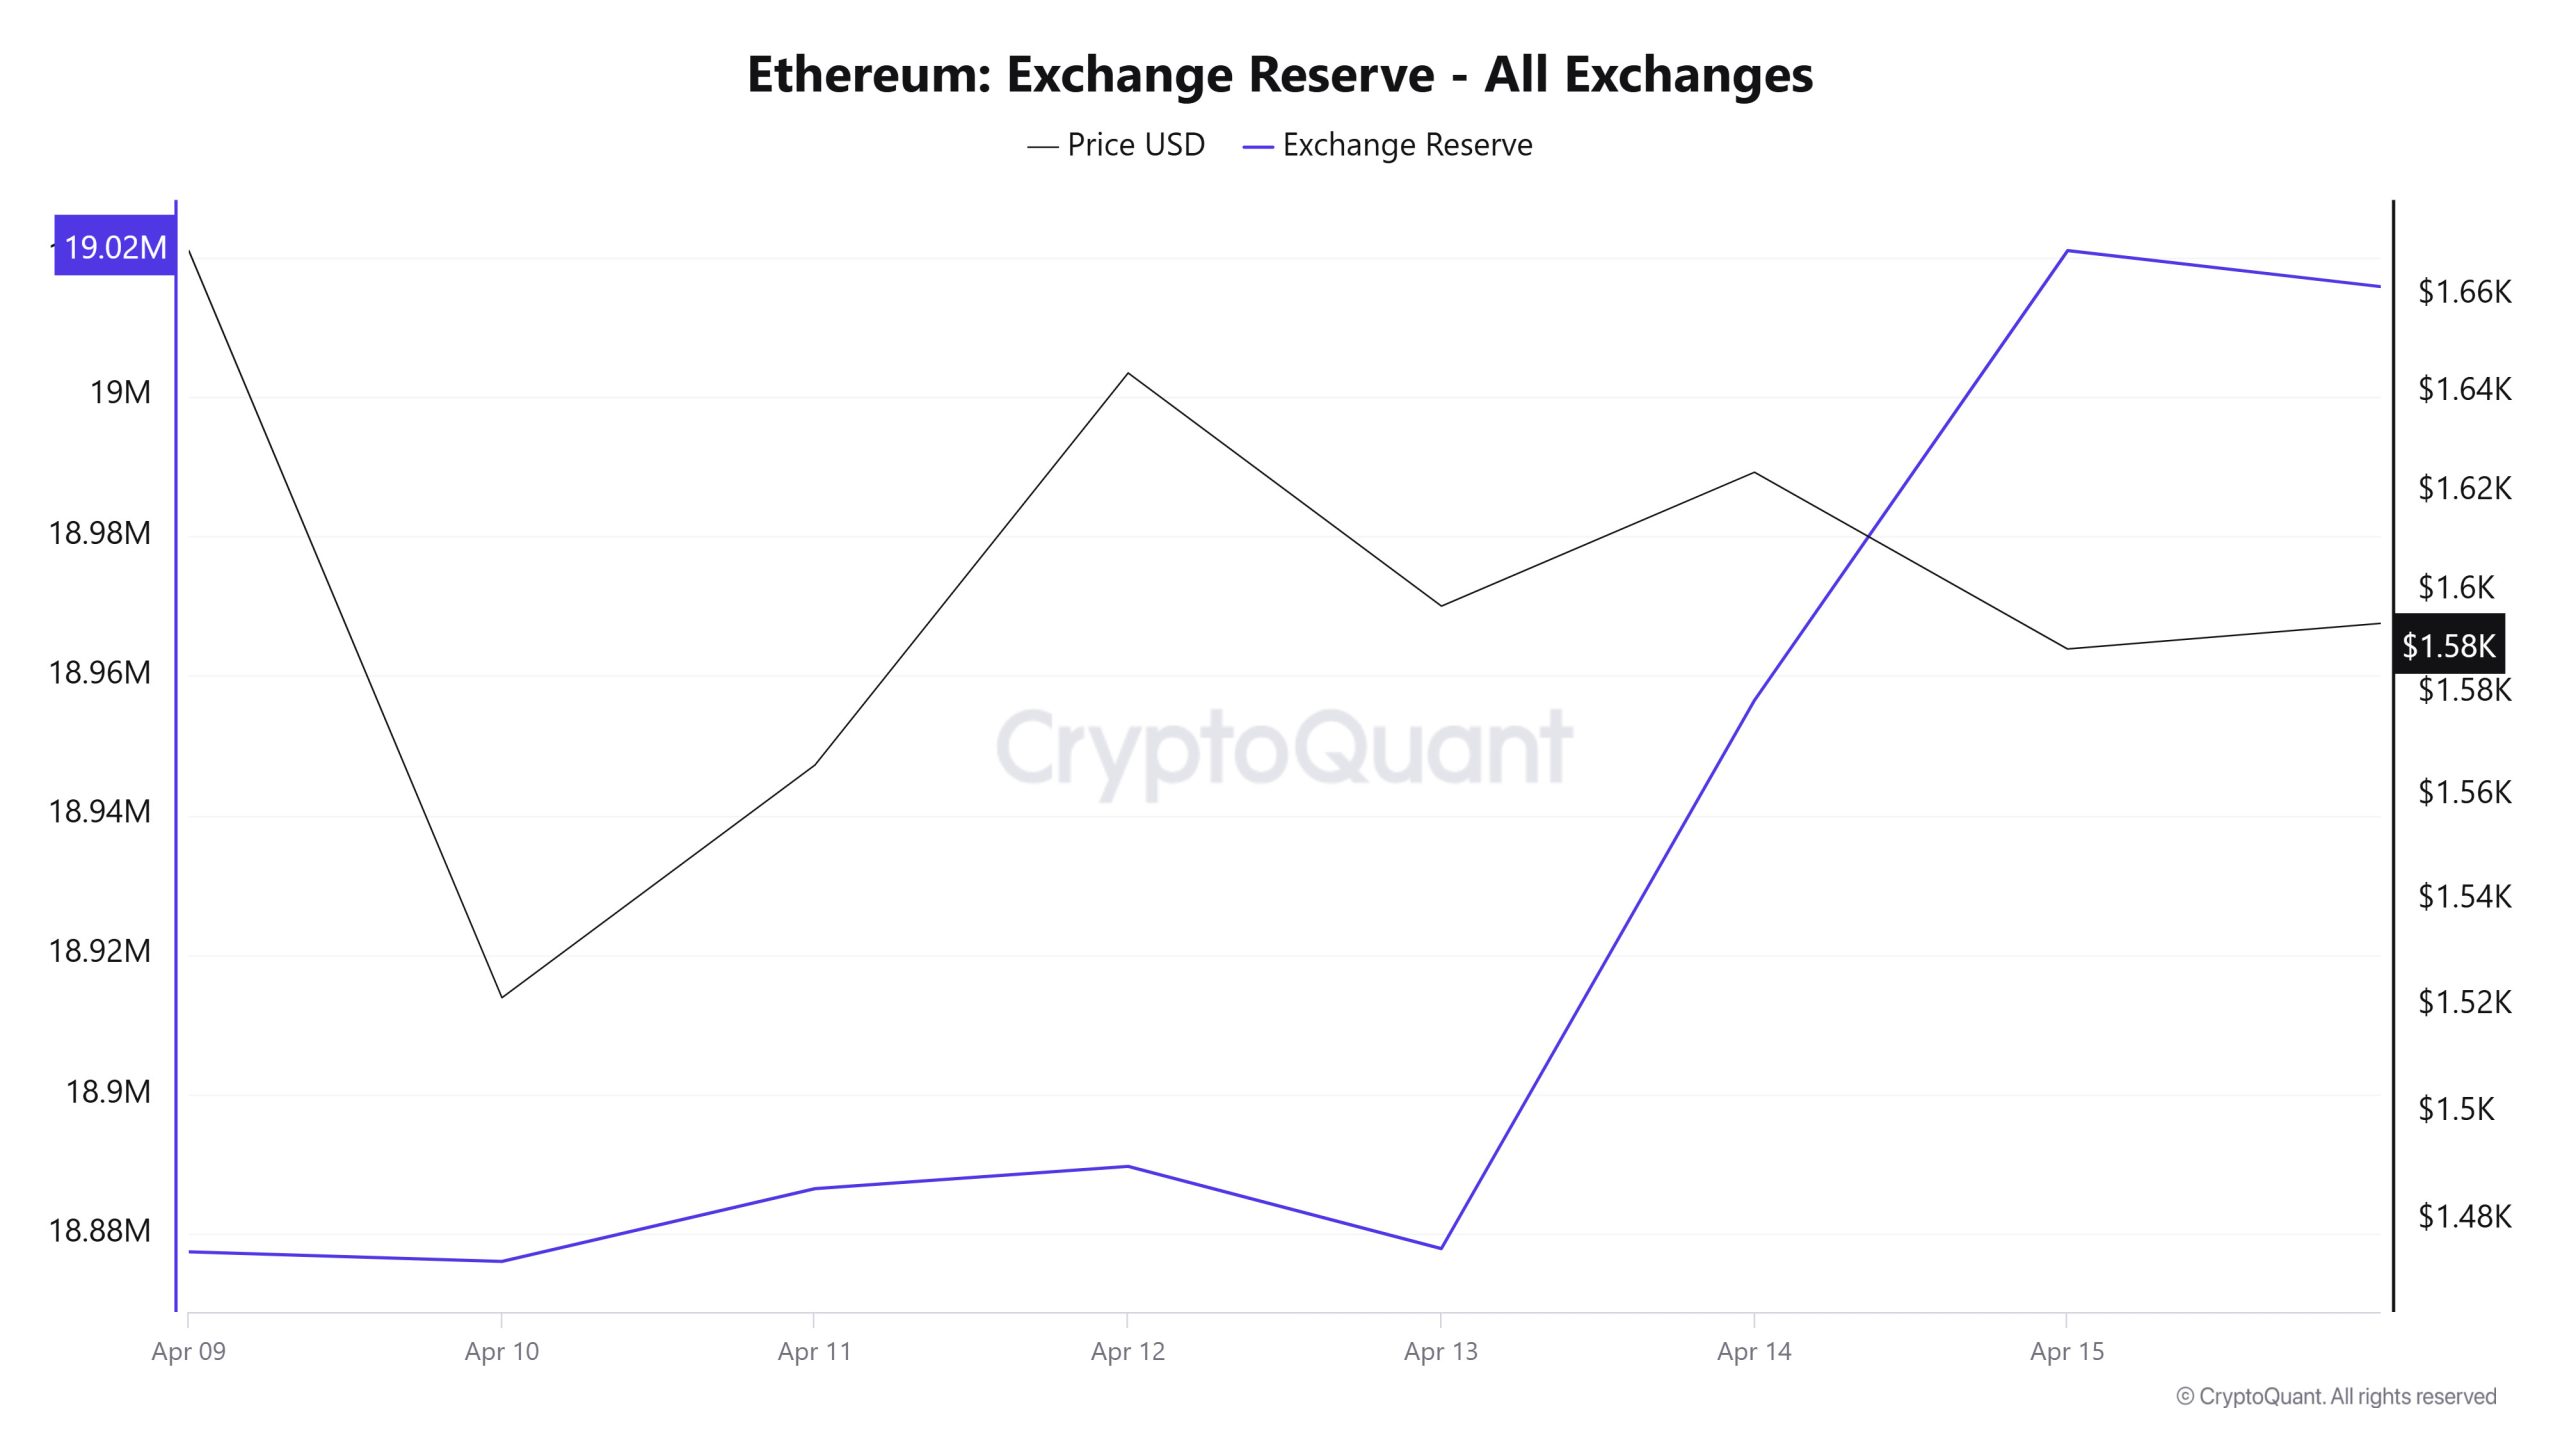
Between April 9-15, 2025, Ethereum reserves on exchanges increased from 18,877,445 ETH to 19,020,932 ETH. During this period, there was a total net inflow of 143,487 ETH and the Ethereum reserves of exchanges increased by 0.76%. The Ethereum price fell by approximately 4.8% during the same period. On April 9, 2025, Ethereum closed at $1,669, and on April 15, 2025, it closed at $1,589. Strong inflows to the stock markets indicate that investors may increase their selling positions. Recently, rising tariffs and economic uncertainties on a global scale have weakened investor confidence and put pressure on crypto markets. The continuation of this trend in the coming period may cause increased selling pressure on prices as strong inflows to stock exchanges continue.
| Date | 9-Apr | 10-Apr | 11-Apr | 12-Apr | 13-Apr | 14-Apr | 15-Apr |
| Exchange Inflow | 1,158,517 | 738,368 | 675,652 | 339,197 | 468,957 | 1,147,257 | 776,762 |
| Exchange Outflow | 1,183,600 | 739,740 | 665,223 | 336,005 | 480,739 | 1,068,681 | 712,320 |
| Exchange Netflow | -25,082 | -1,372 | 10,429 | 3,193 | -11,782 | 78,576 | 64,442 |
| Exchange Reserve | 18,877,445 | 18,876,074 | 18,886,503 | 18,889,696 | 18,877,914 | 18,956,490 | 19,020,932 |
| ETH Price | 1,669 | 1,521 | 1,566 | 1,644 | 1,597 | 1,624 | 1,589 |
Fees and Revenues
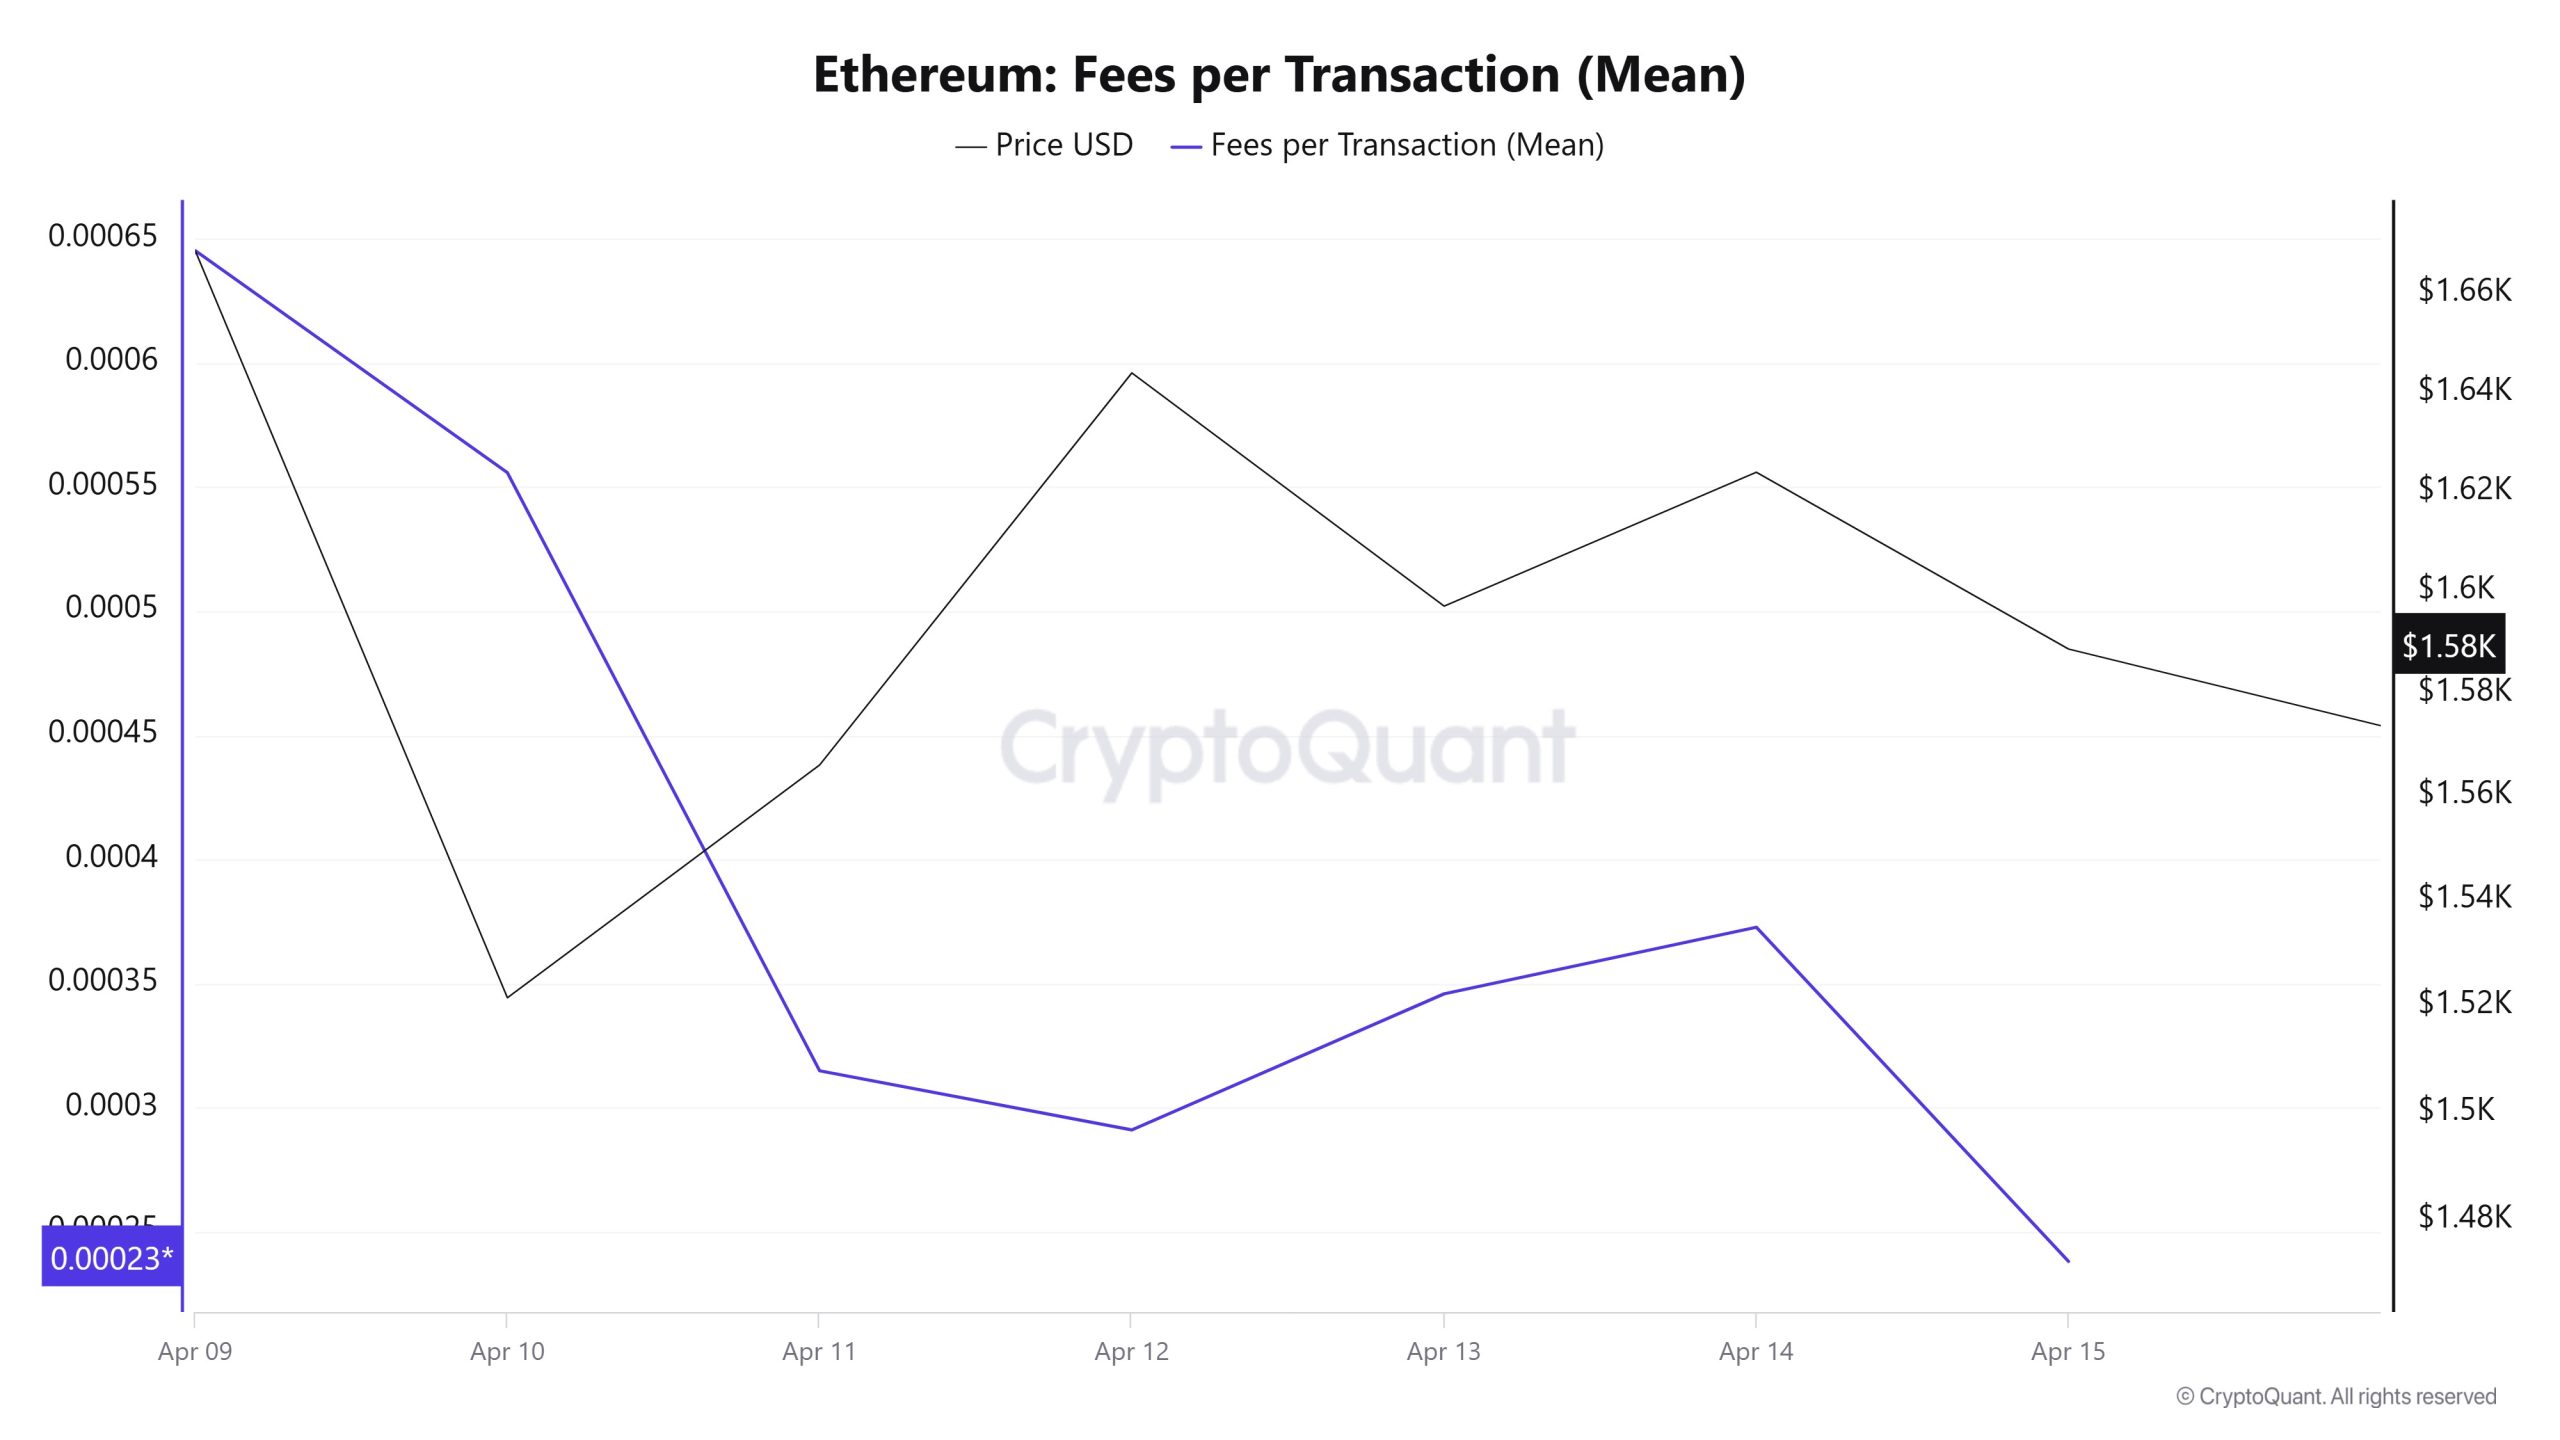
When the Ethereum Fees per Transaction (Mean) data between April 9 and April 15 is analyzed, it is seen that this value was at the level of 0.000645322513572928 on April 9, the first day of the weekly period. Until April 12, the value, which showed a downward trend, decreased to 0.000290966319644798 on this date.
Since then, with the fluctuations in the Ethereum price, the value has gained upward momentum again, reaching as high as 0.000372626078134687 on April 14.
On April 15, the last day of the weekly period, Ethereum Fees per Transaction (Mean), which was suppressed again, closed at 0.000237947246927063. This level was the lowest value recorded on a weekly basis.
Bitcoin: Fees (Total)
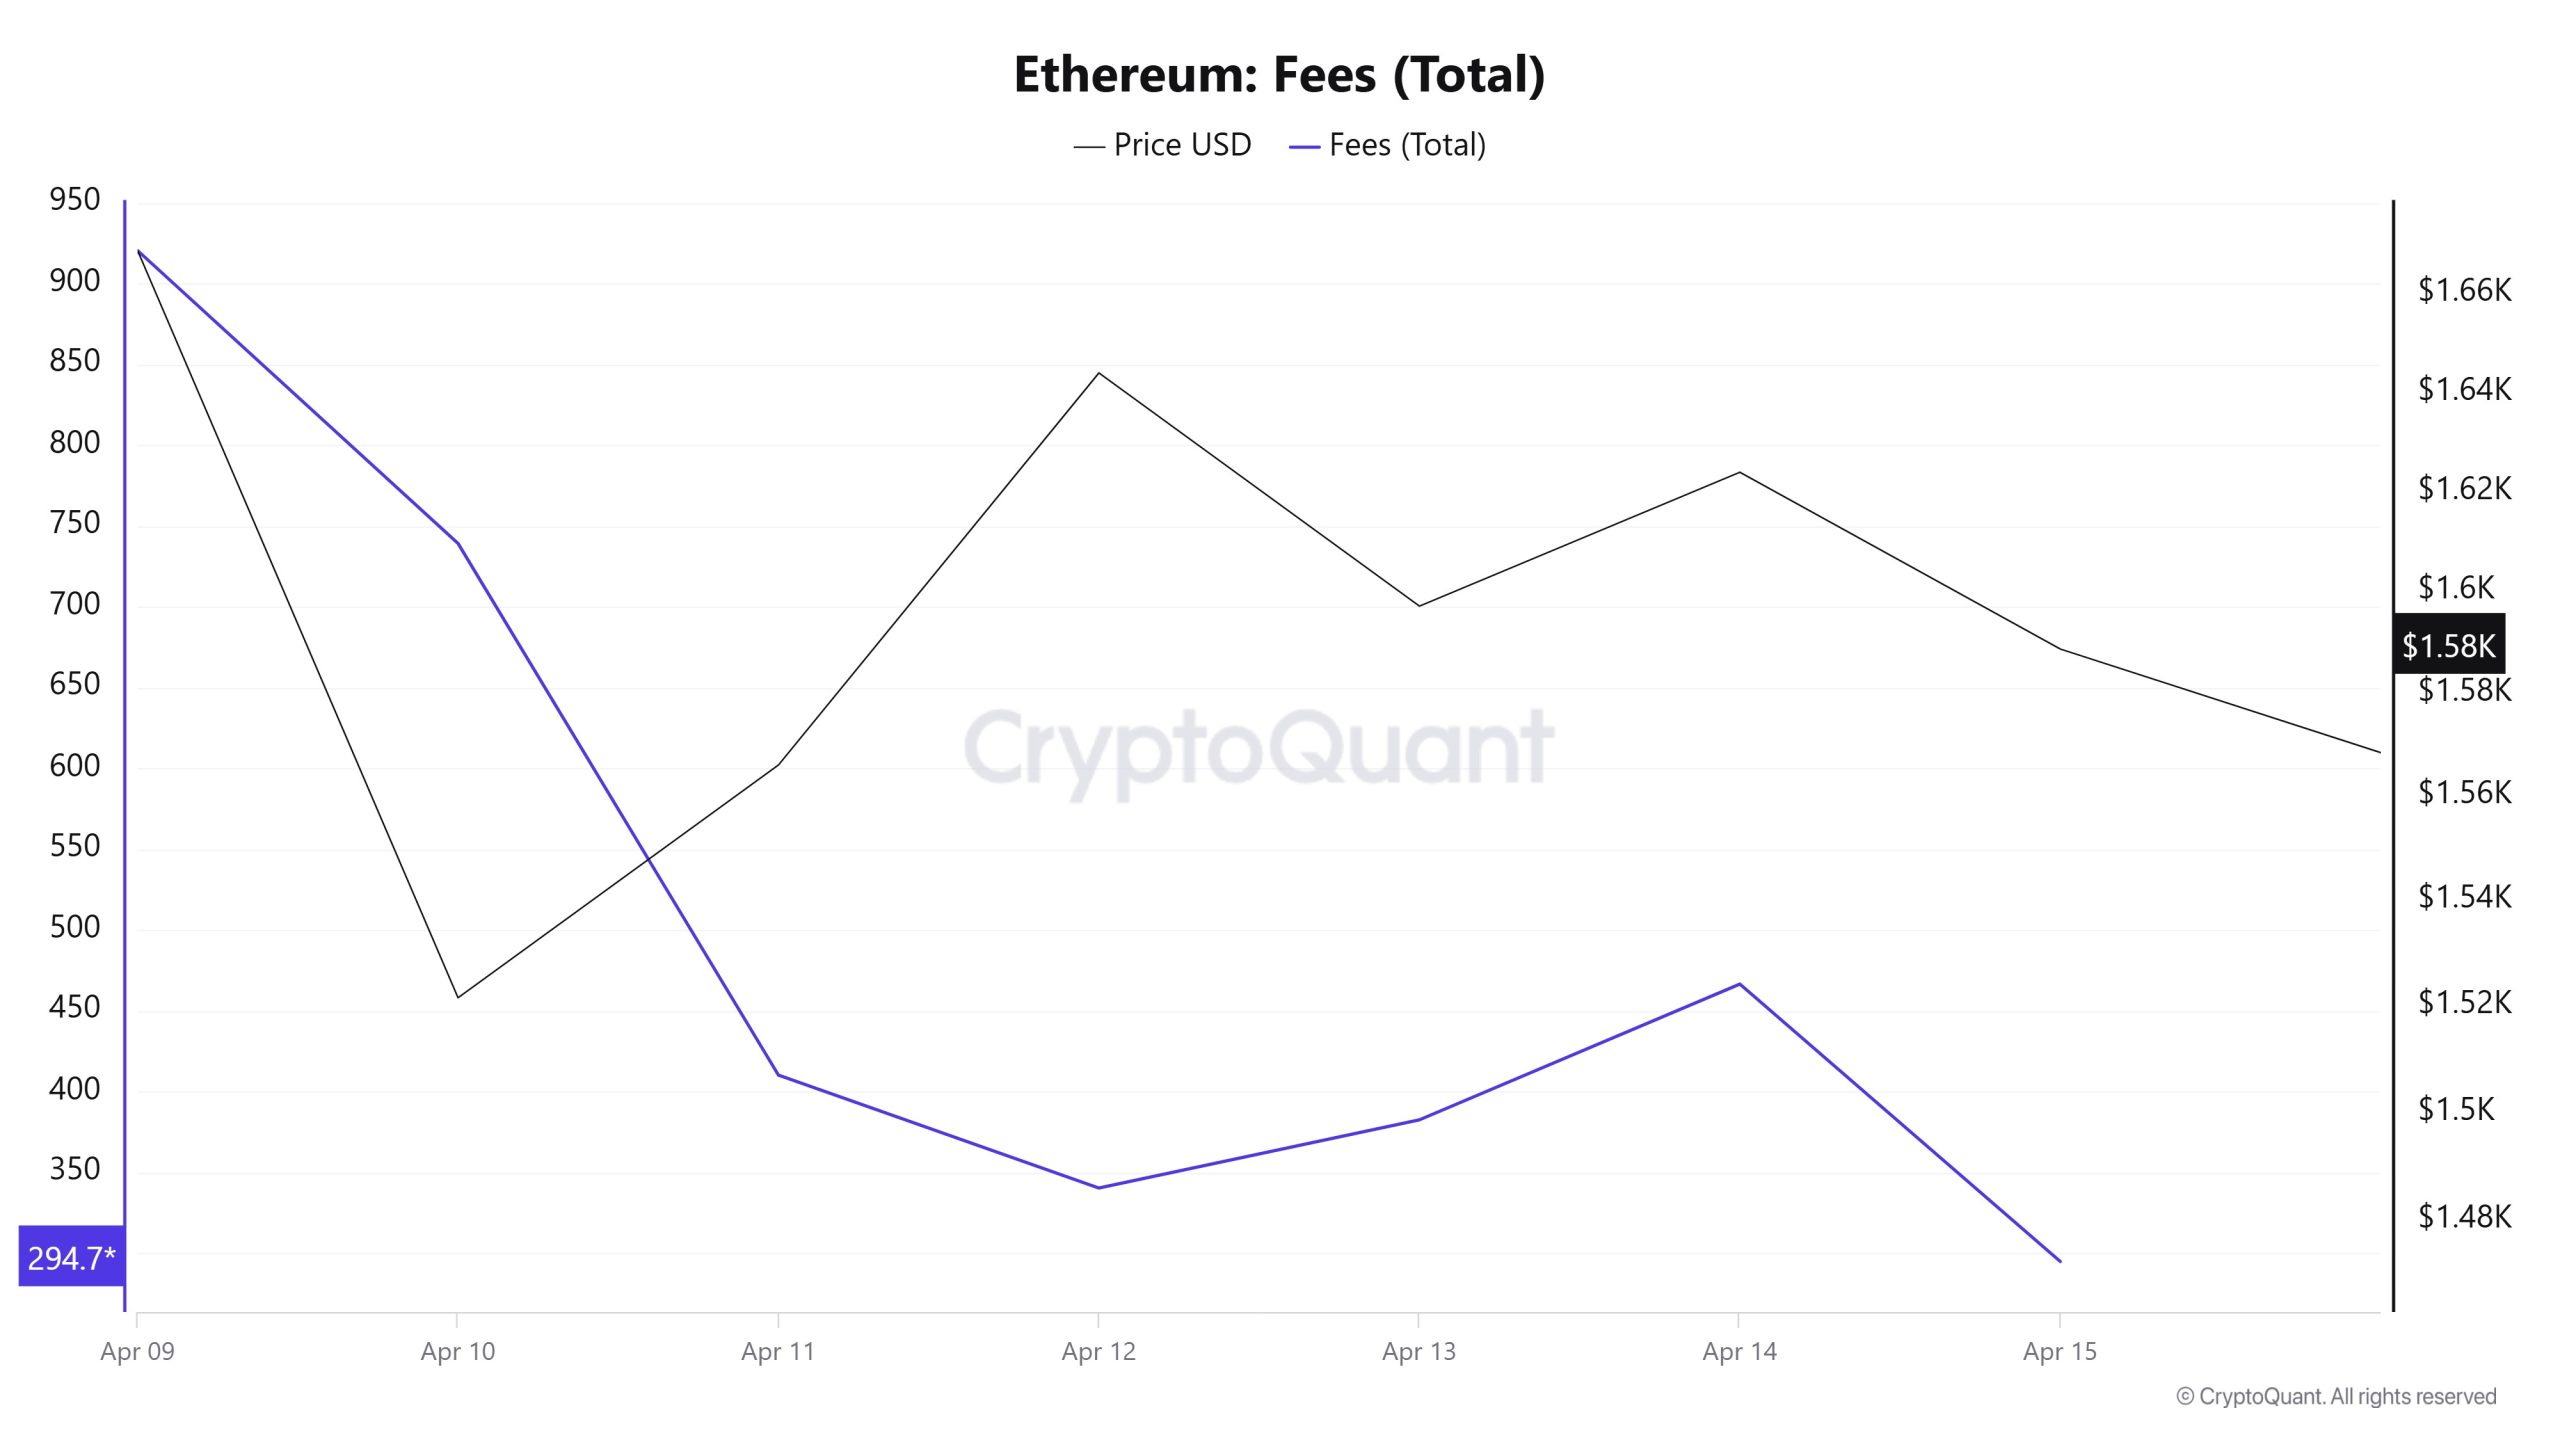
Similarly, when the Ethereum Fees (Total) data between April 9 and 15 were analyzed, it was seen that this value was at the level of 920.4977131981277 on April 9, the first day of the weekly period. Until April 12, the value, which showed a downward trend, decreased to 340.1690152630533 on this date.
Since then, with the fluctuations in the Ethereum price, the value has gained upward momentum again, reaching 466,42835866176586 on April 14.
On April 15, the last day of the weekly period, Ethereum Fees (Total), which was suppressed again, closed at 294.70599347281046. This level was the lowest value recorded on a weekly basis.
Blocks Mined
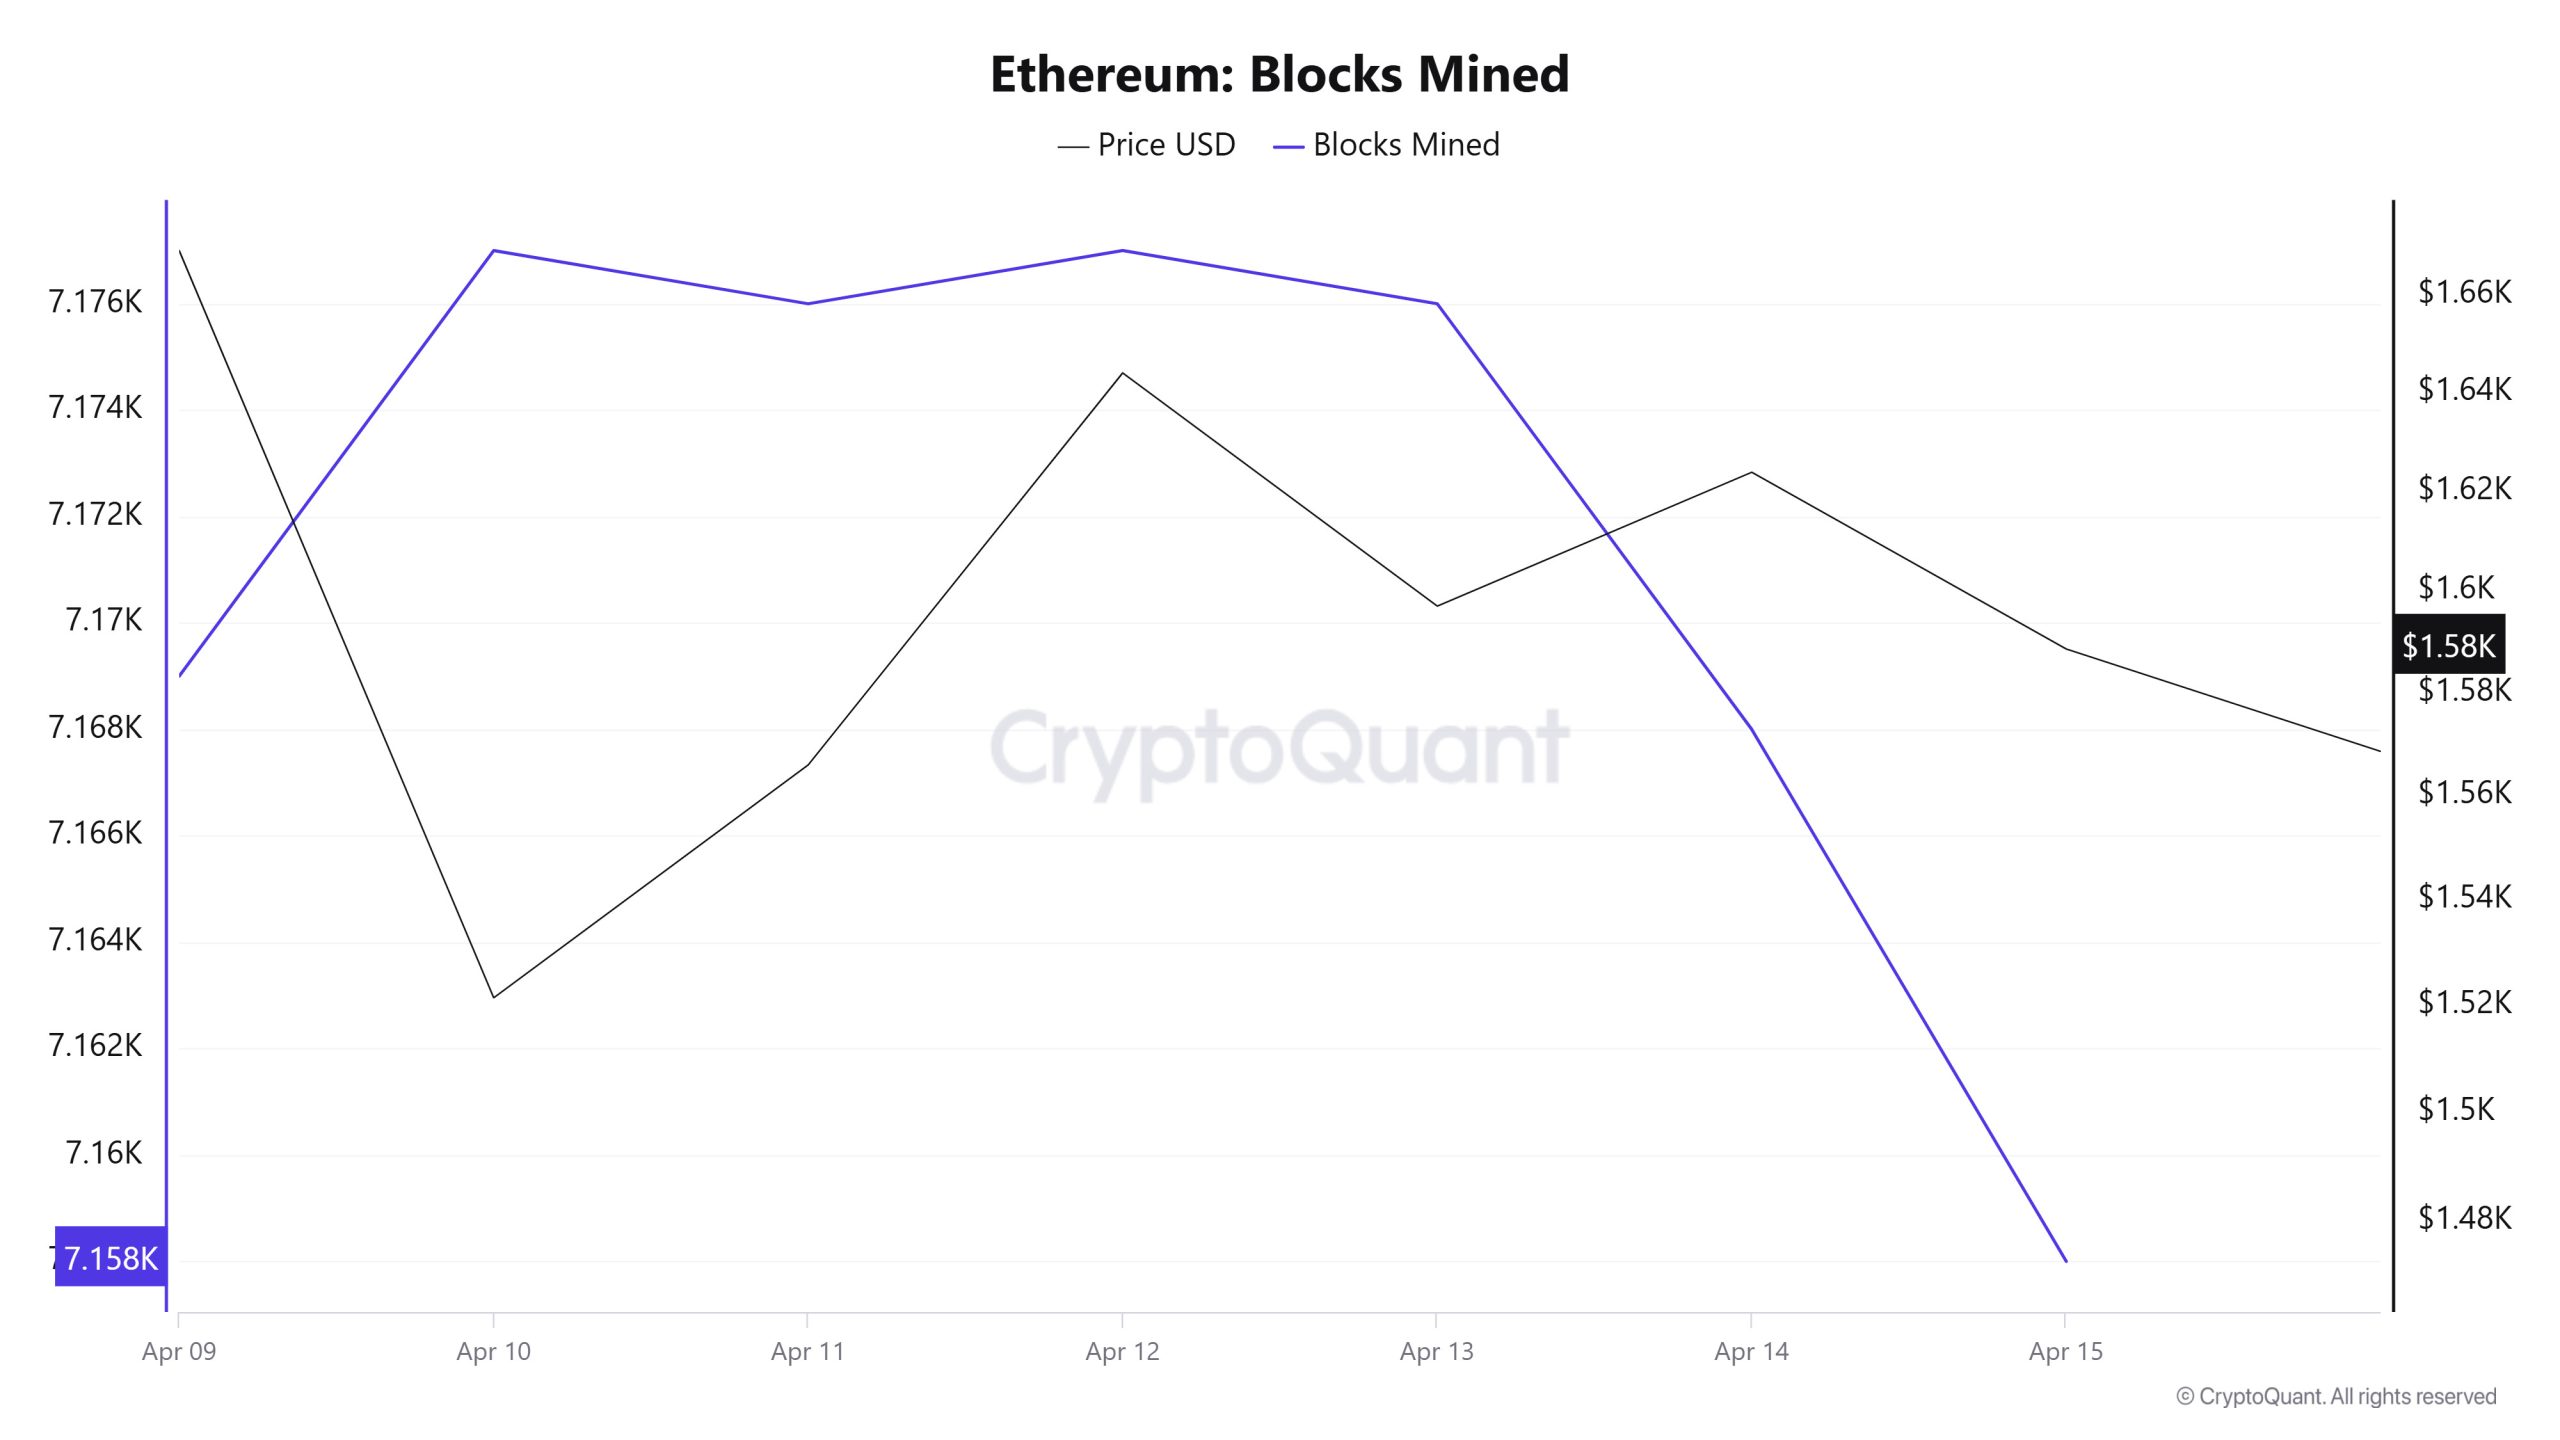
When we examine the Ethereum Blocks Mined table between April 9 – 15 , the number of blocks produced increased towards the middle of the week, but decreased towards the end of the week. While 7,169 blocks were produced on April 9, this number was 7,158 on April 15. Although there was a positive correlation between Blocks Mined and Ethereum price at the beginning of the week, the correlation turned negative by mid-week.
Block Size
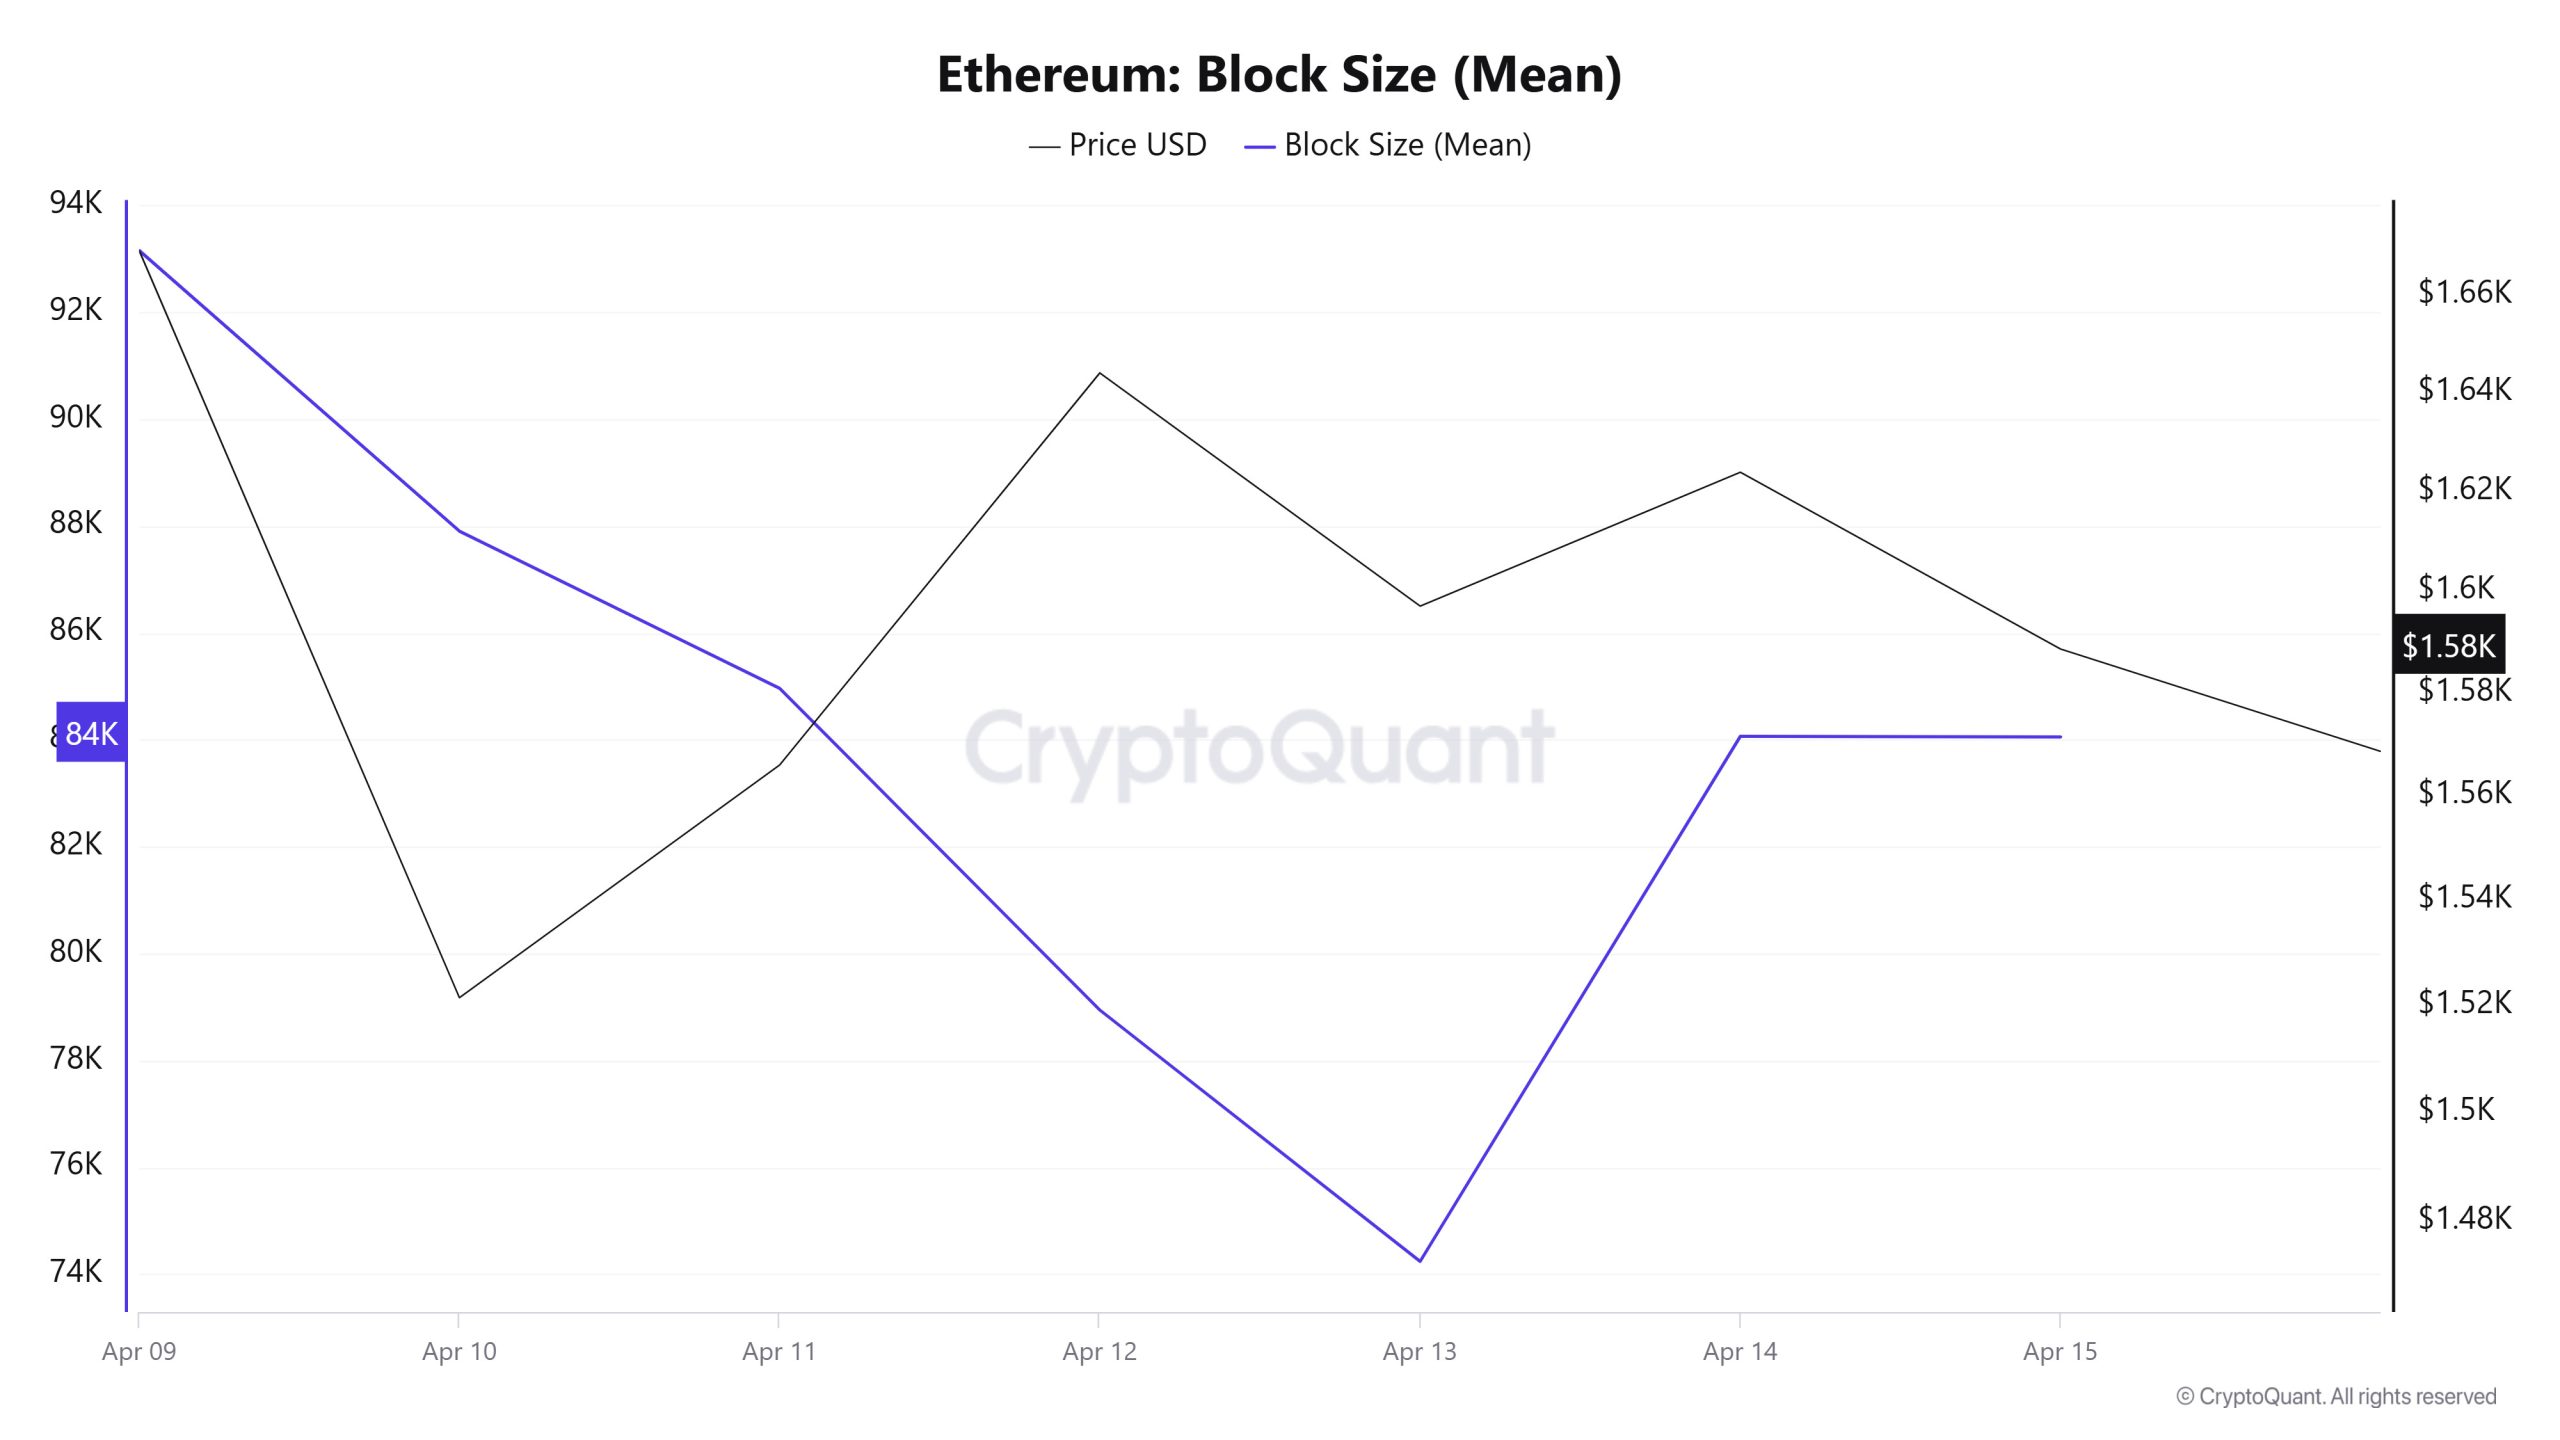
Between April 9 and April 15, when we examine the Ethereum Block Size table, there was a slight decrease in the middle of the week, but then it increased towards the end of the week. The block size, which was 93,151 bytes on April 9, reached 84,051 bytes by April 15. There was a positive correlation between Block Size and Ethereum price throughout the week.
Block Interval
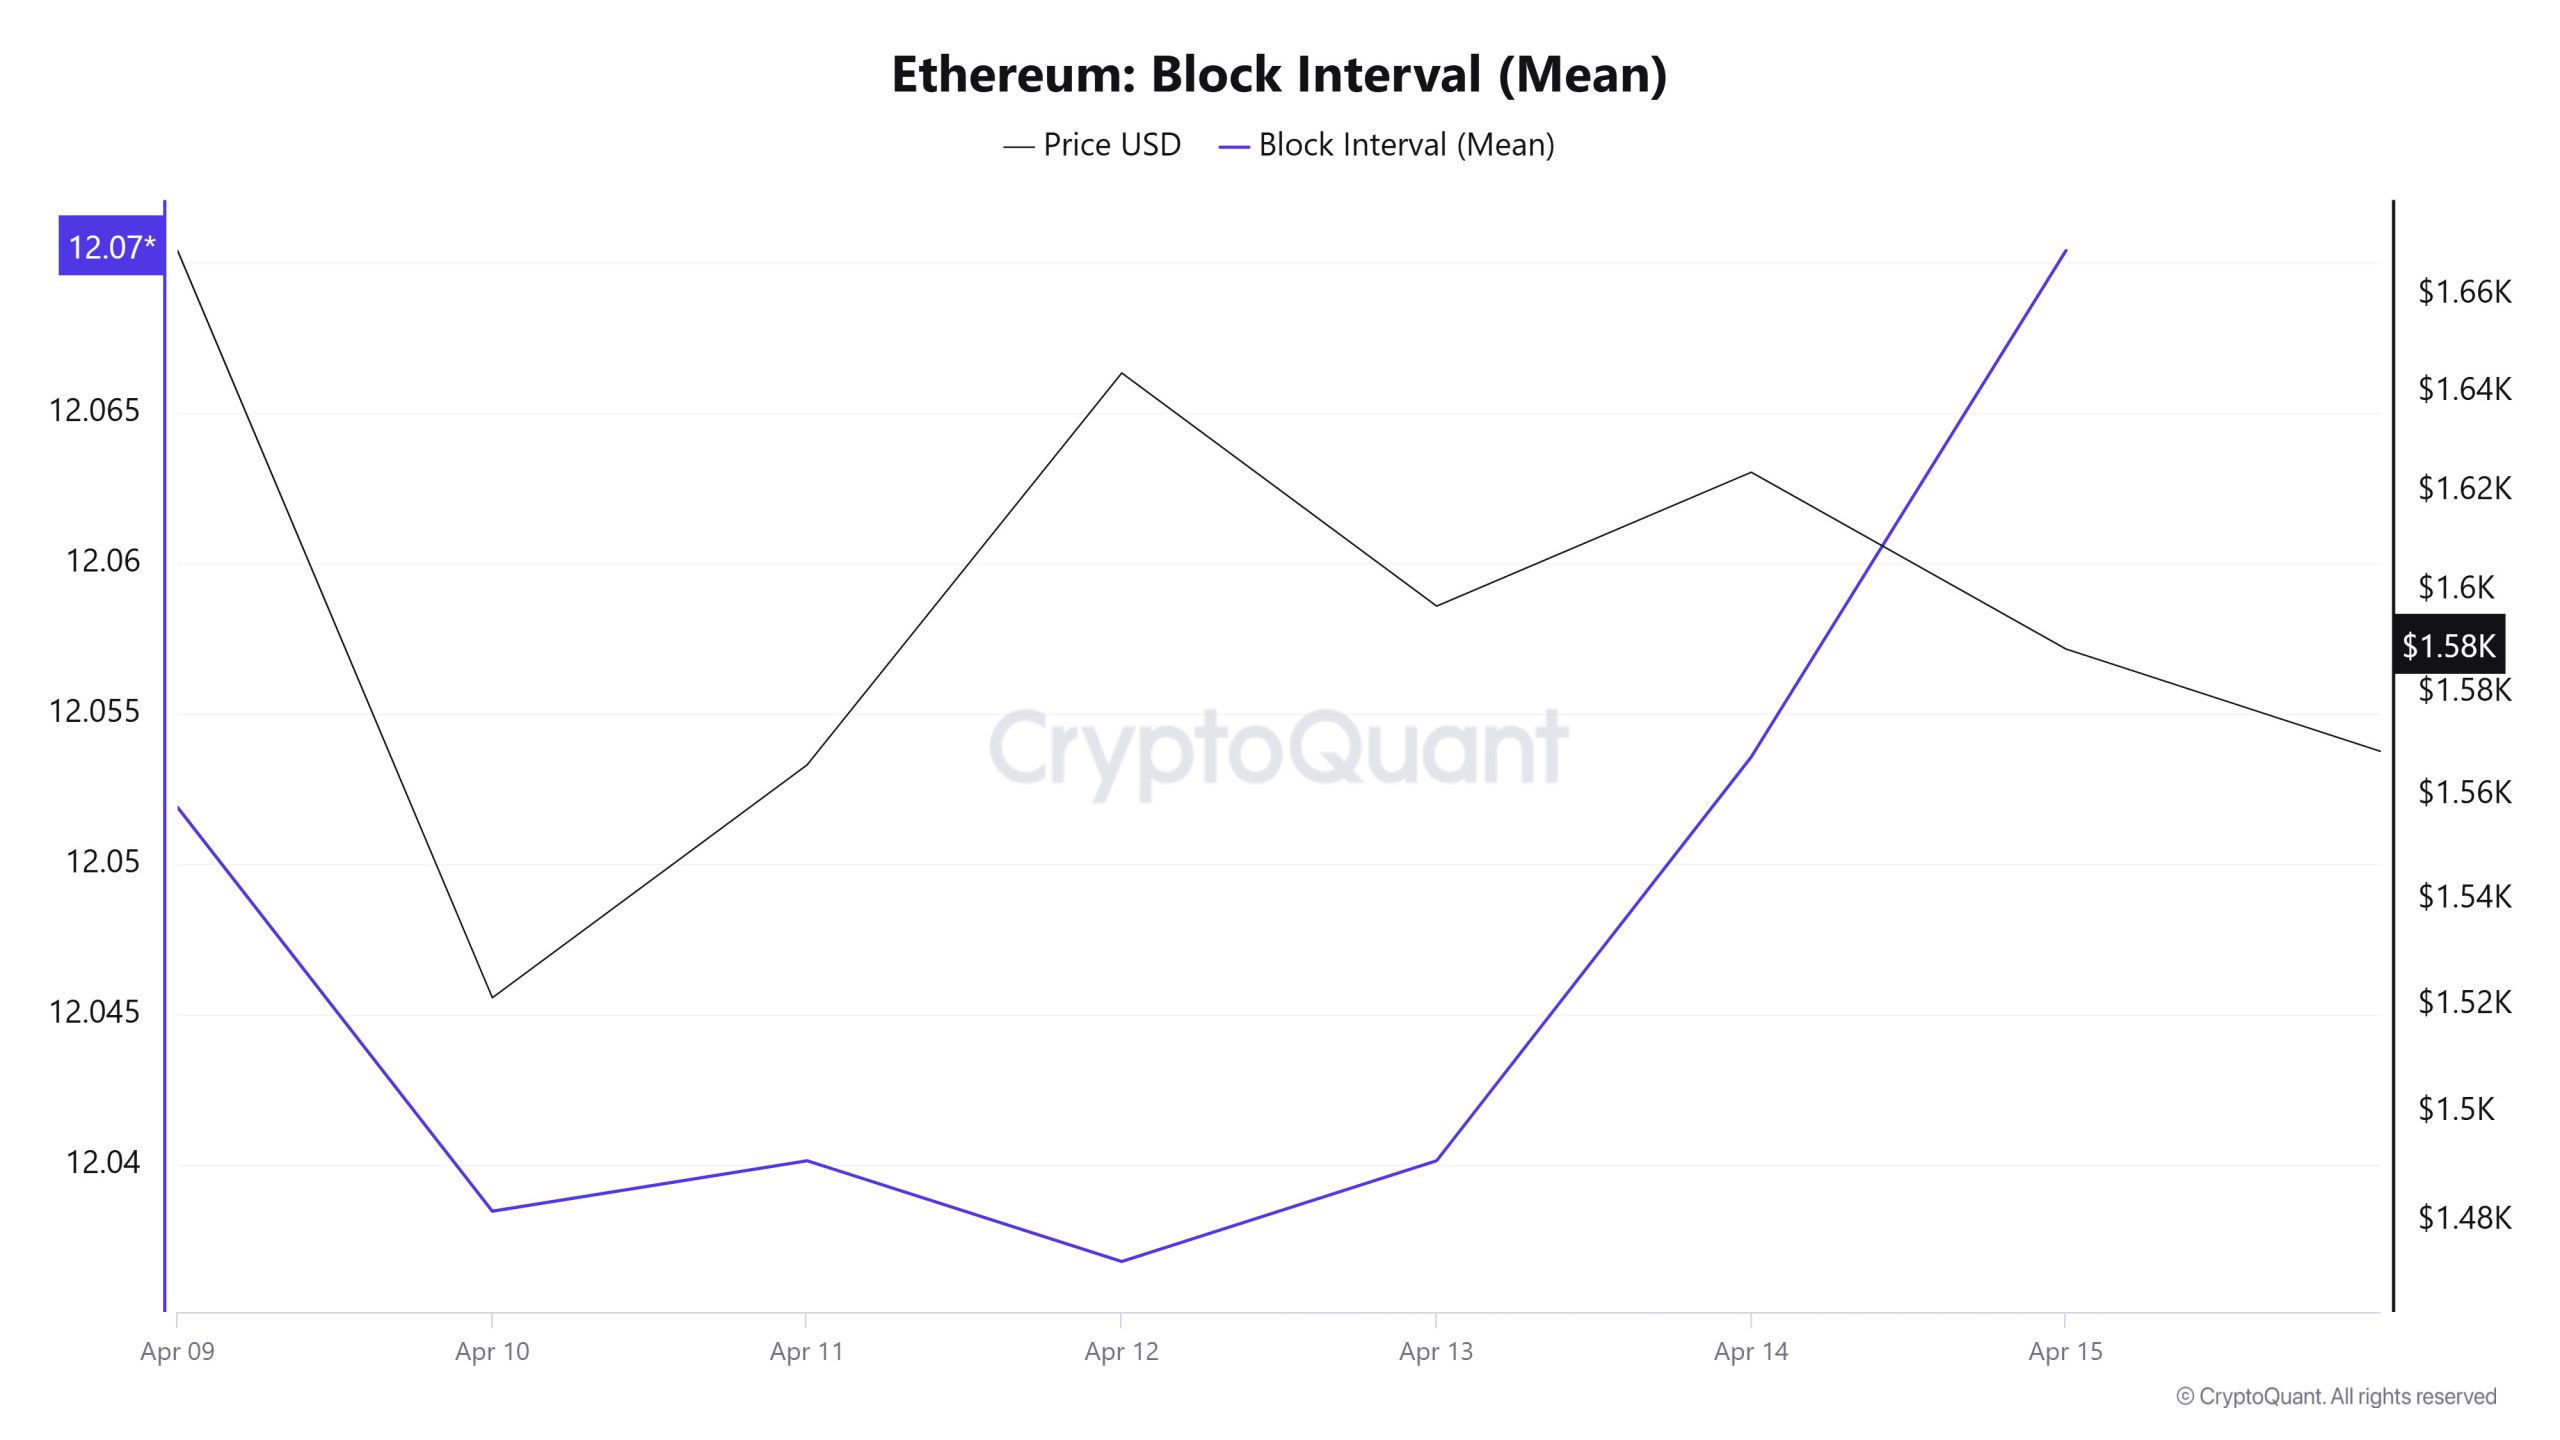
Between April 9 and April 15, when we examine the Ethereum Block Size table, there was a slight decrease in the middle of the week, but then it increased towards the end of the week. The block size, which was 93,151 bytes on April 9, reached 84,051 bytes by April 15. There was a positive correlation between Block Size and Ethereum price throughout the week.
Transaction
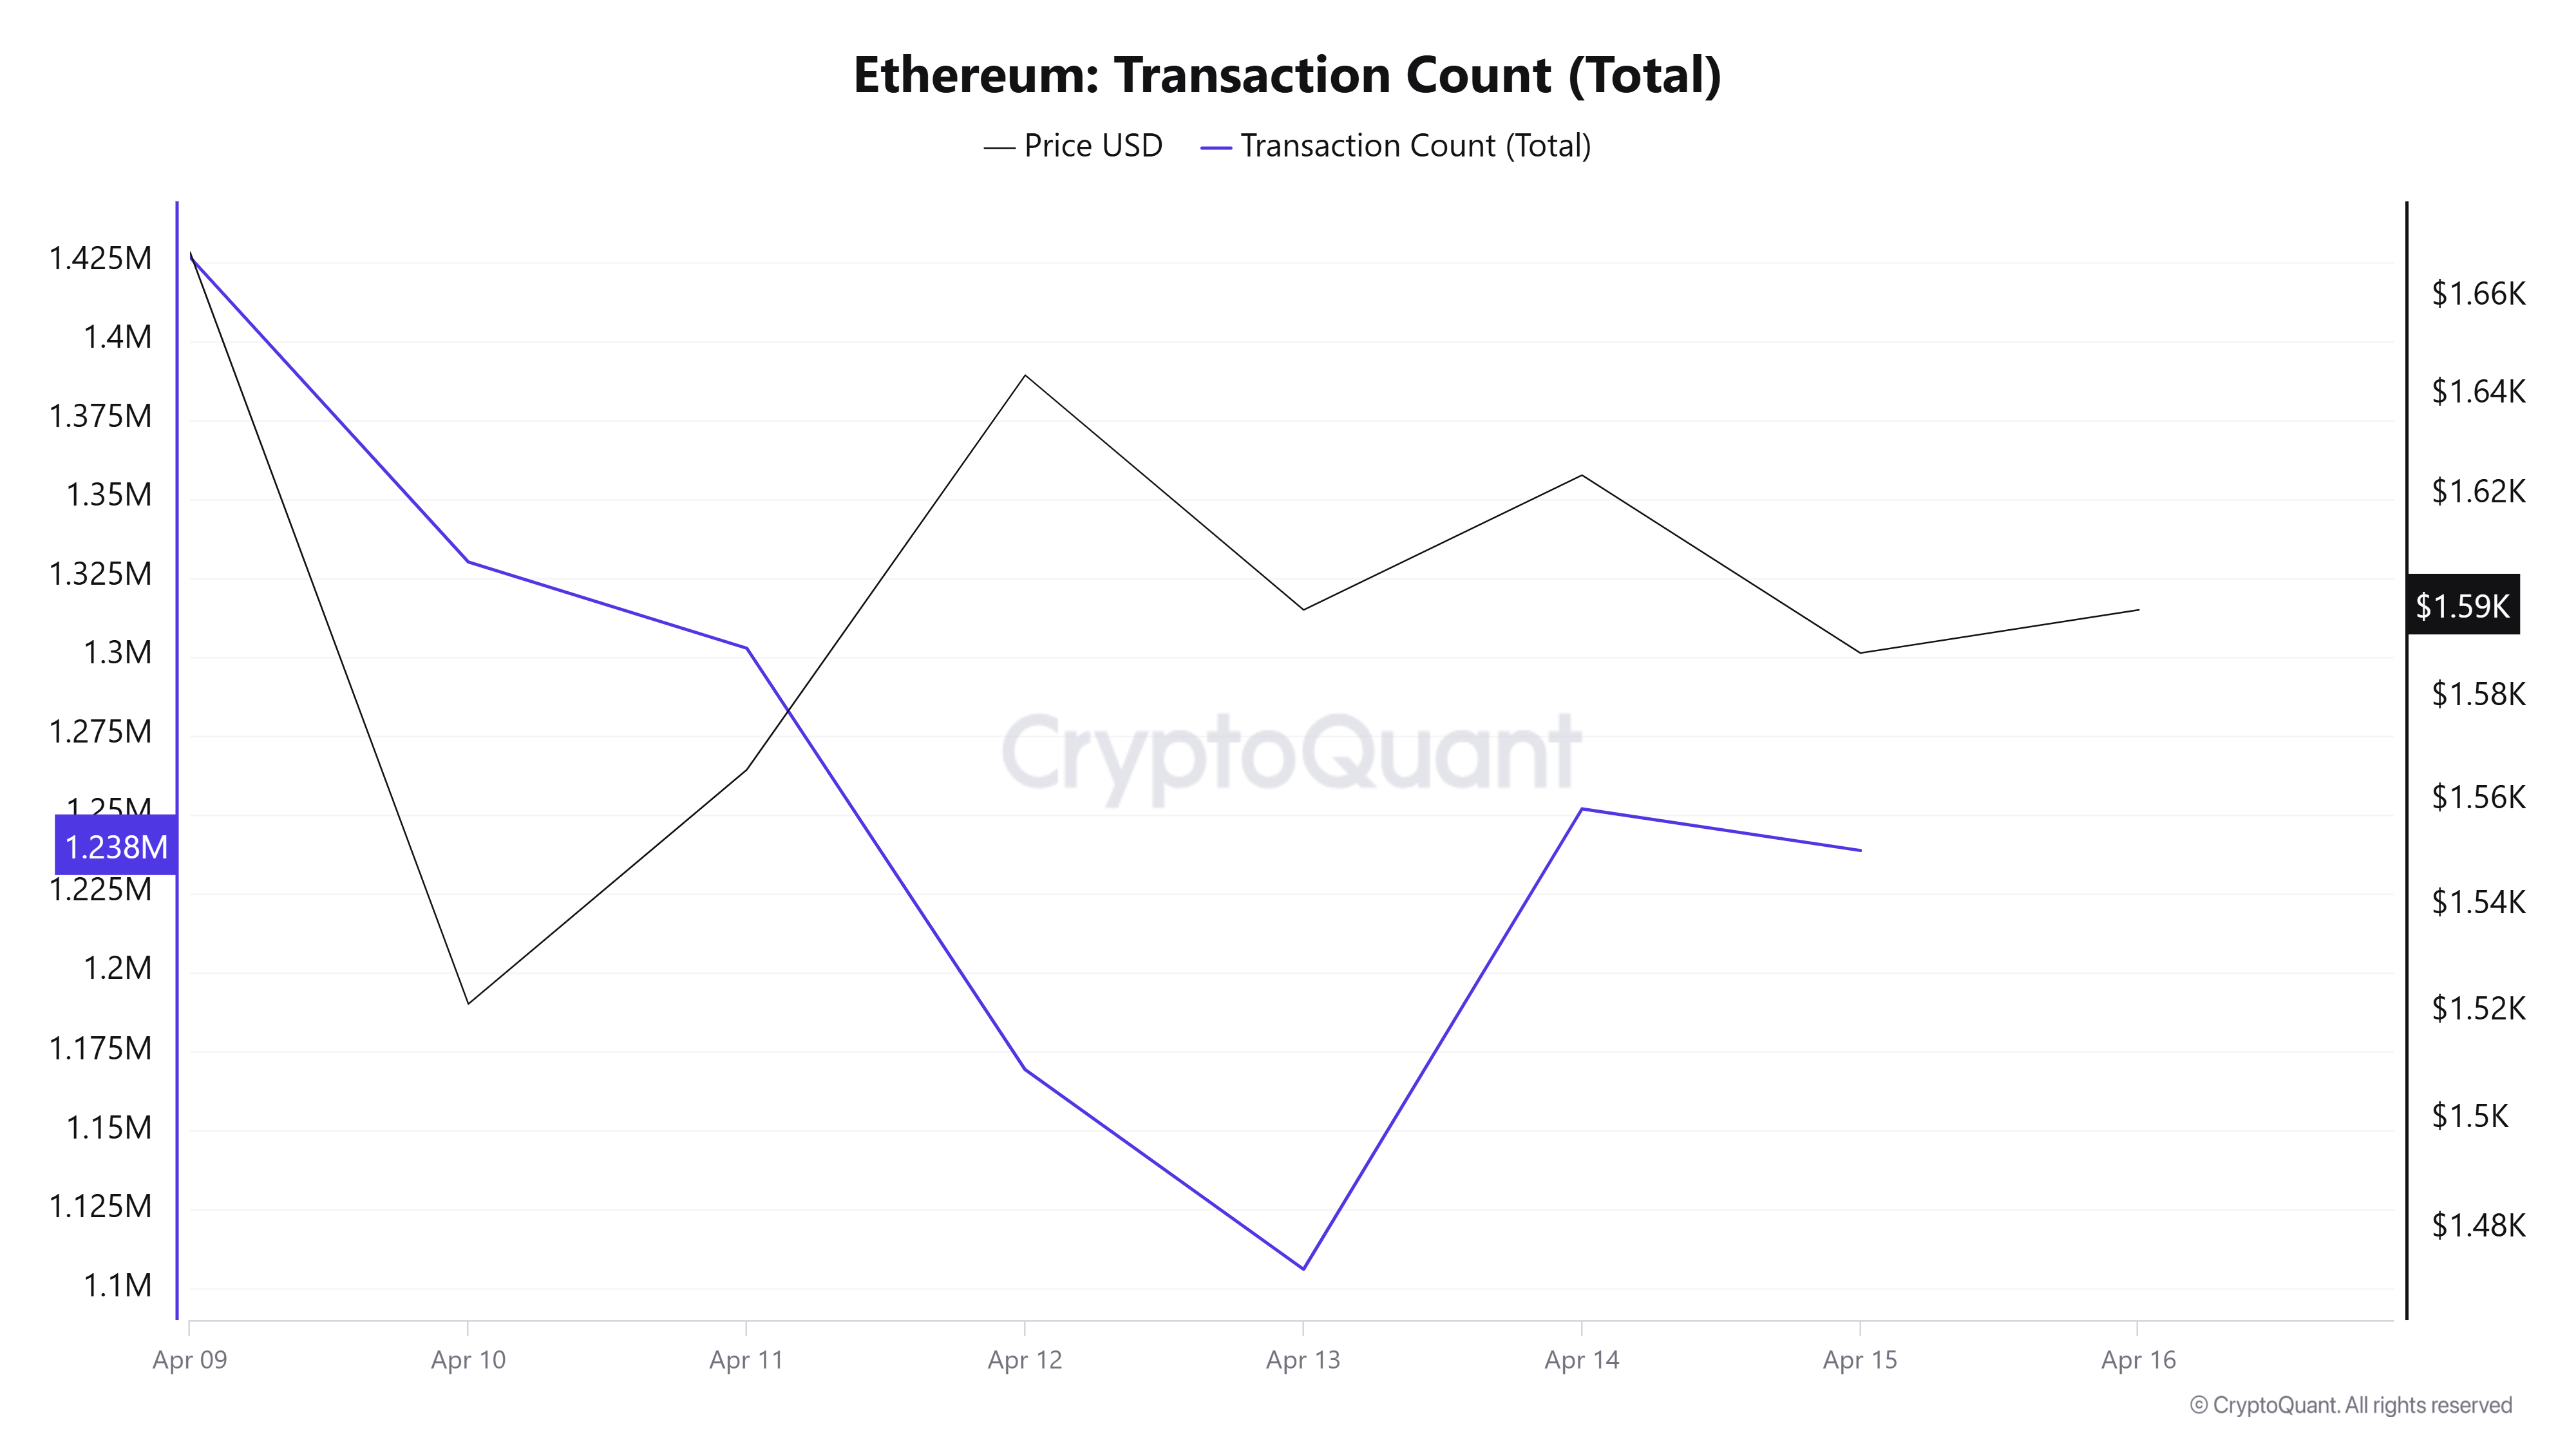
Last week, a total of 7,894,241 transactions were executed on the Ethereum network, while this week it decreased by approximately 19.77% to 6,333,877. The highest number of transactions on a weekly basis was 1,426,415 on April 9, while the lowest number of transactions was 1,105,874 on April 13.
This decrease in the number of transactions indicates that utilization on the network is declining and the negative trend continues. This drop in transaction volume points to a decline in the overall activity of the Ethereum network.
Tokens Transferred
While the total amount of ETH transferred on the Ethereum network last week was recorded as 12,523,626, it decreased by 1.48% to 12,338,310 this week. The transfer of 2,800,454 ETH on April 9 was the highest daily transfer amount of the week, while the lowest value of the week was recorded on April 12 with only 867,290 ETH transferred.
In addition to the decrease in the number of transactions, the decline in the amount of ETH transferred also reveals weakening activity on the network. These declines in the network suggest continued downward pressure on the market, raising concerns that this situation will continue to have an additional negative impact on the ETH price.
Estimated Leverage Ratio
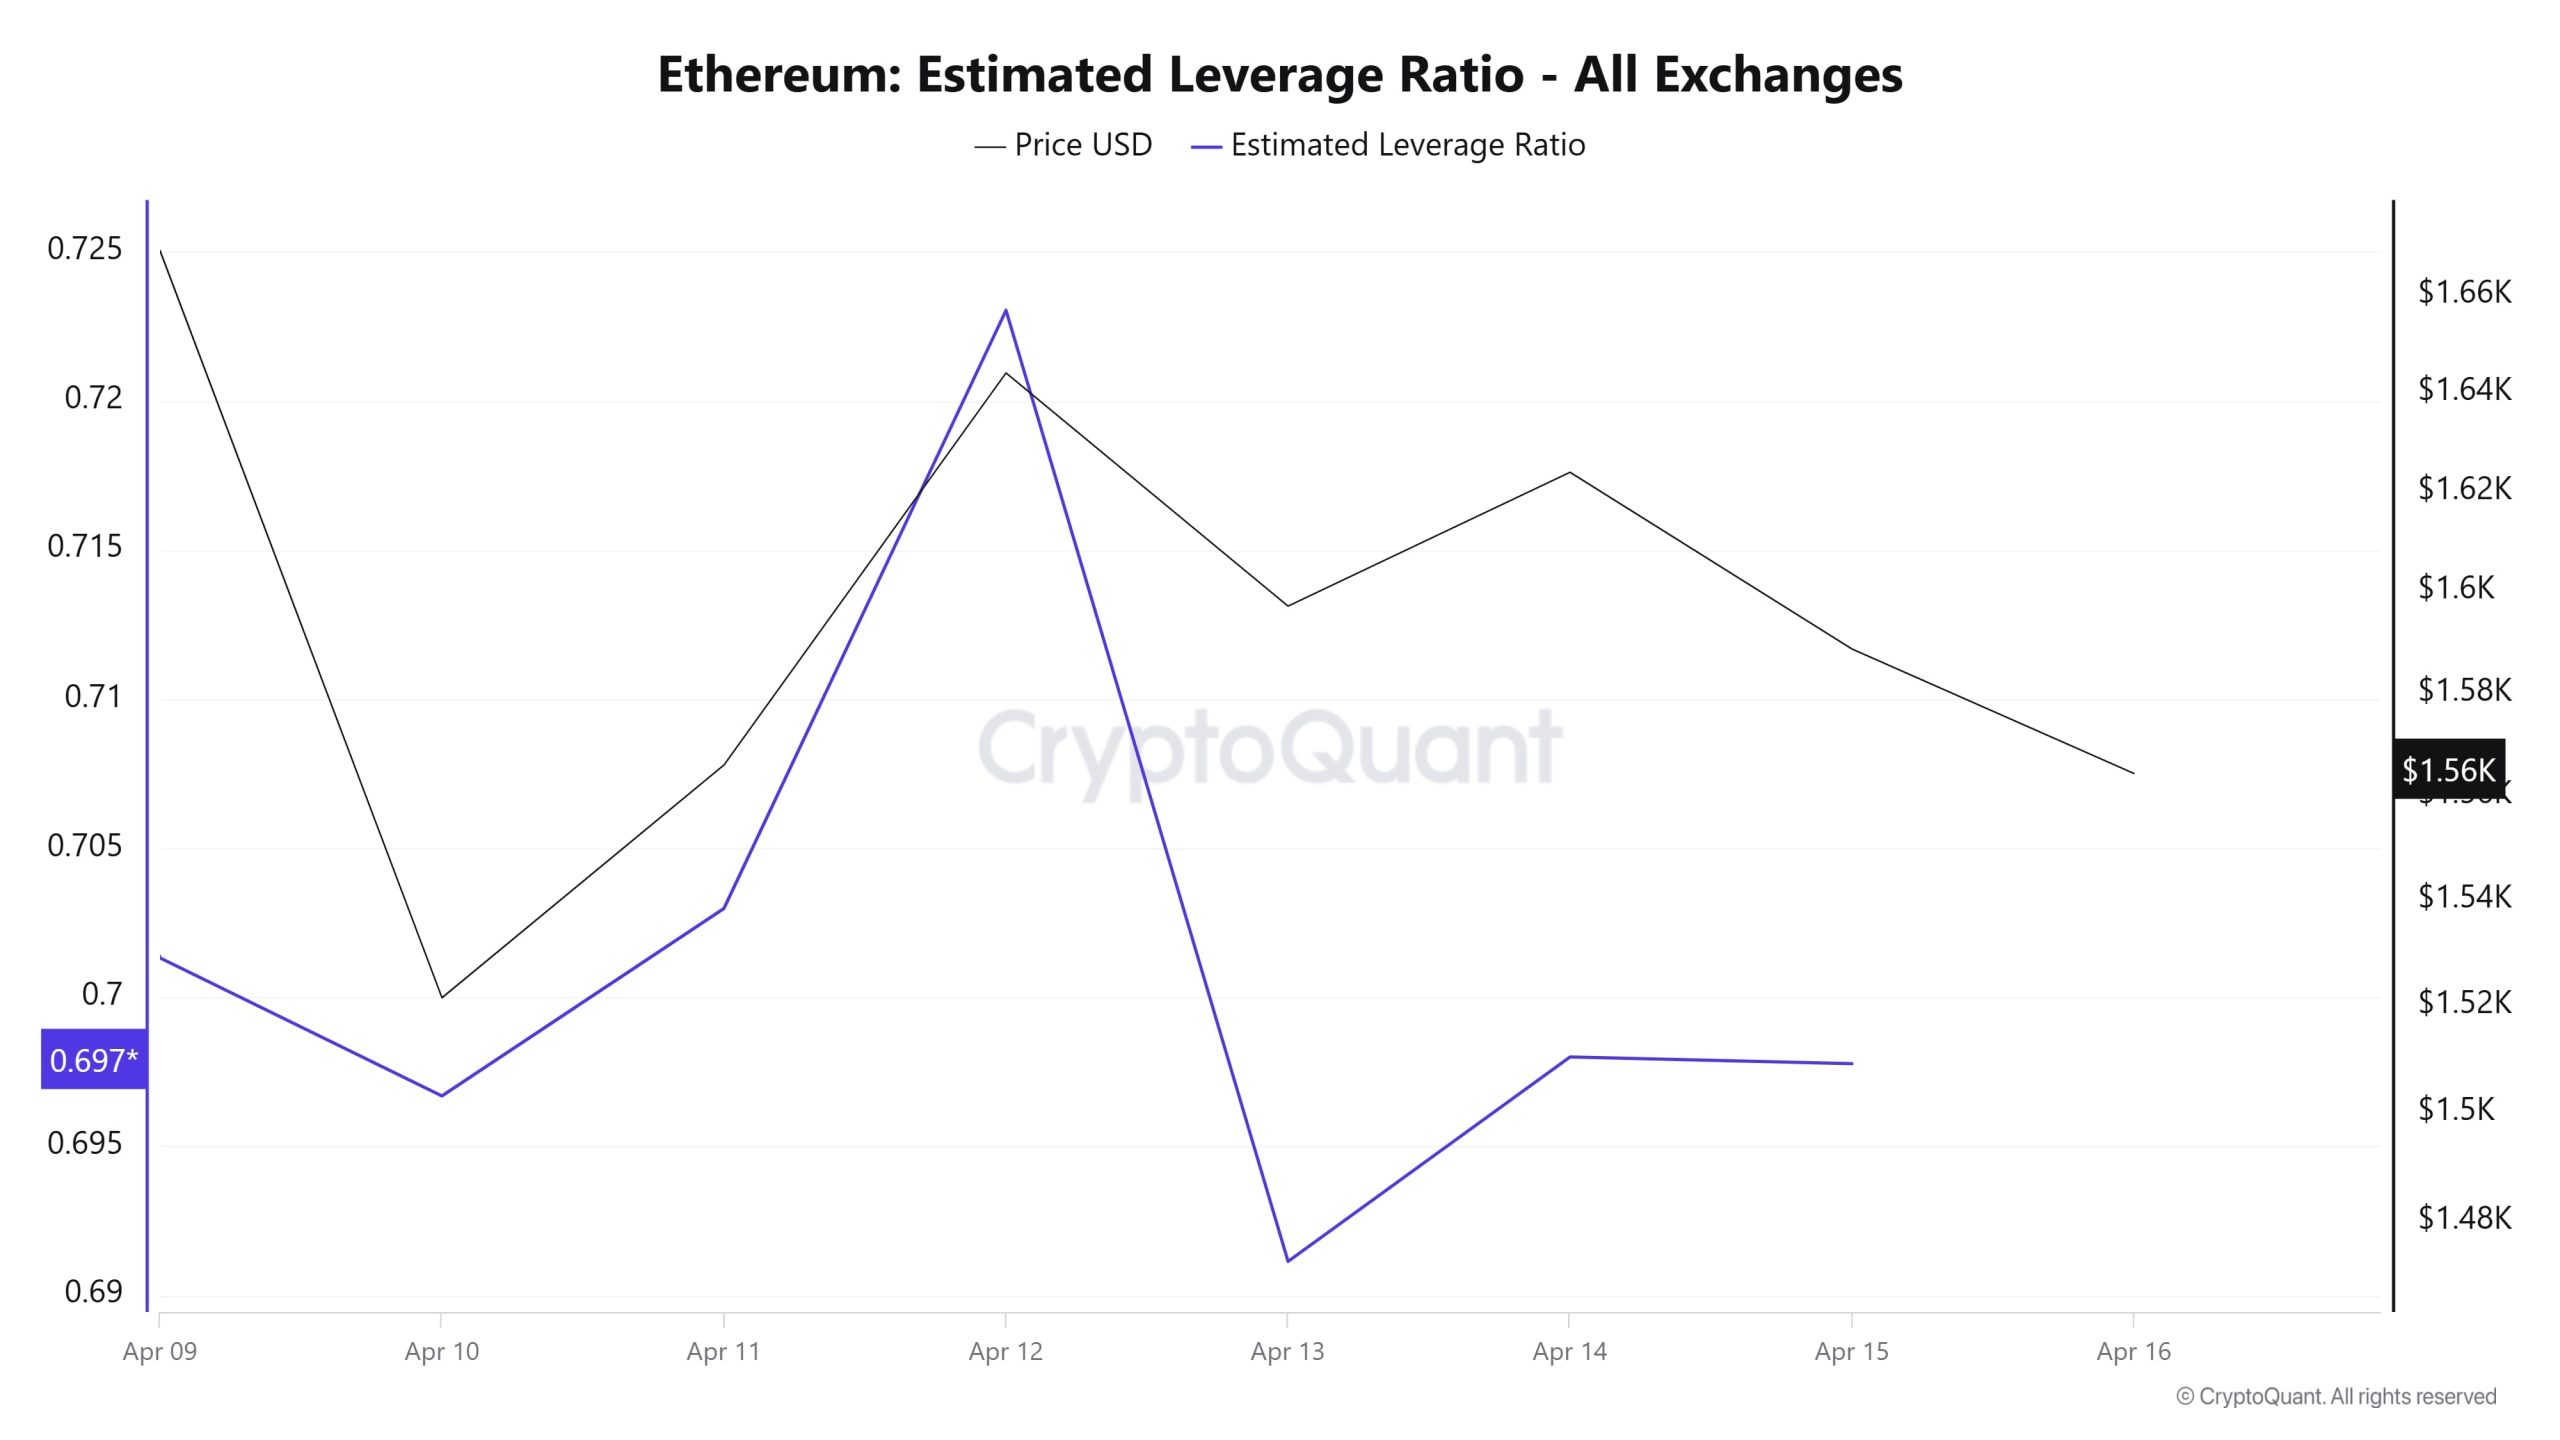
During the entire 7-day period, the metric exhibited a turbulent movement with a lot of volatility. ELR (Estimated Leverage Ratio), which had a value of 0.701 at the beginning of the process, increased towards the middle of the process and reached its peak value of 0.723 on April 12. In the last period of the process, it retreated from its peak and is currently at 0.697. A higher ELR implies that participants are willing to assume more risk and generally indicates bullish conditions or expectations. It should be noted that these rises can also be caused by a decrease in reserves. When we look at Ethereum reserves, while there were 18.87 million reserves at the beginning of the process, this figure continued to increase towards the end of the process and increased to 19.09 million. At the same time, Ethereum’s Open Interest is seen as 17.04 billion dollars at the beginning of the process. As of now, it is seen as 17.74 billion dollars with a slight increase in the process. With all this data, the ELR metric did not move stably. The price of the asset moved in parallel with the open interest and rose from $1,470 to $1,650. Towards the end of the process, the increase in the amount of reserves exceeded the increase in the open interest rate, which explains the decline in the ELR rate. As a result, the increase in reserves and open interest shows us that purchases have started in this market. Considering that the accumulation has increased along with the increase in volume-based transactions, the dynamics show us that it may be the beginning of an uptrend.
Legal Notice
The investment information, comments and recommendations contained in this document do not constitute investment advisory services. Investment advisory services are provided by authorized institutions on a personal basis, taking into account the risk and return preferences of individuals. The comments and recommendations contained in this document are of a general type. These recommendations may not be suitable for your financial situation and risk and return preferences. Therefore, making an investment decision based solely on the information contained in this document may not result in results that are in line with your expectations.
NOTE: All data used in Bitcoin onchain analysis is based on Cryptoqaunt.
