
Active Addresses
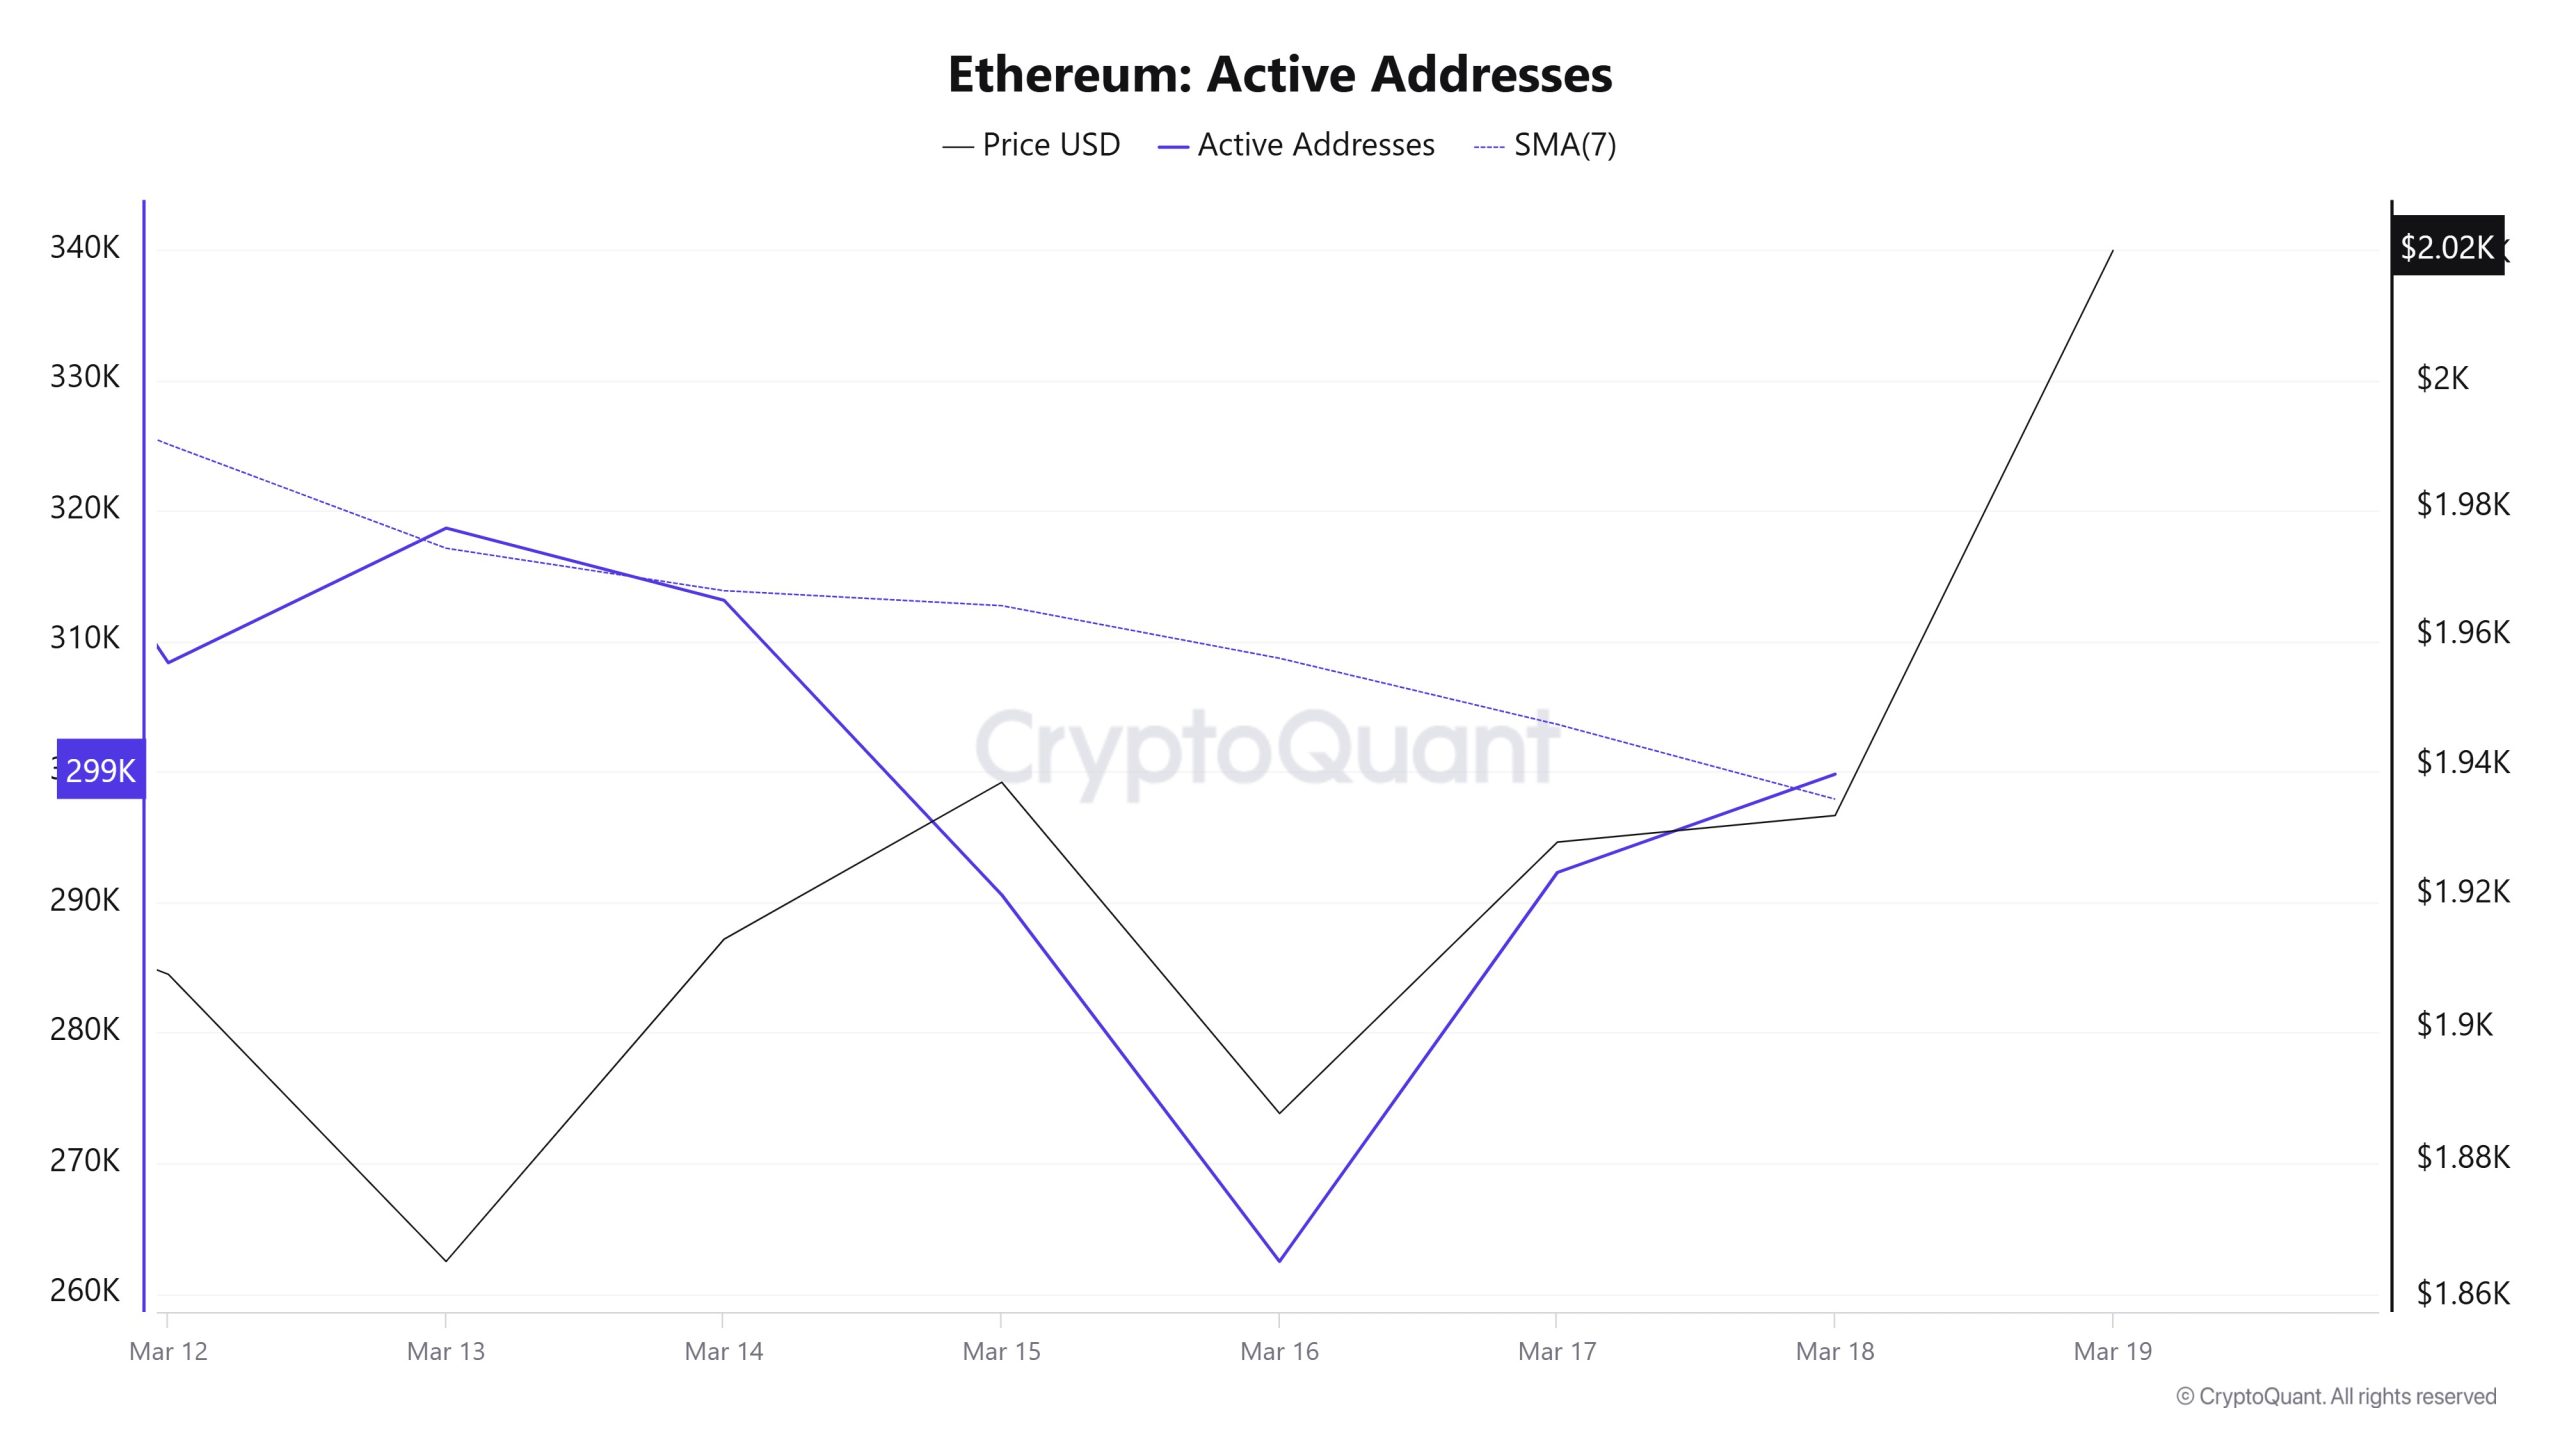
In the number of active addresses, there were 299,817 active entries to the ETH network between March 12 and March 19, 2025 this week. During this period, Ethereum fell to the $1865 level . The chart shows that Ethereum purchases are gradually decreasing in the area where the price and the number of active addresses intersect. When we follow the 7-day simple moving average, it is observed that the price follows a downward trend on the dates when this average cuts the price. This situation indicates that the Ethereum price is experiencing inflows at $ 1,932 levels
Active Sending Addresses
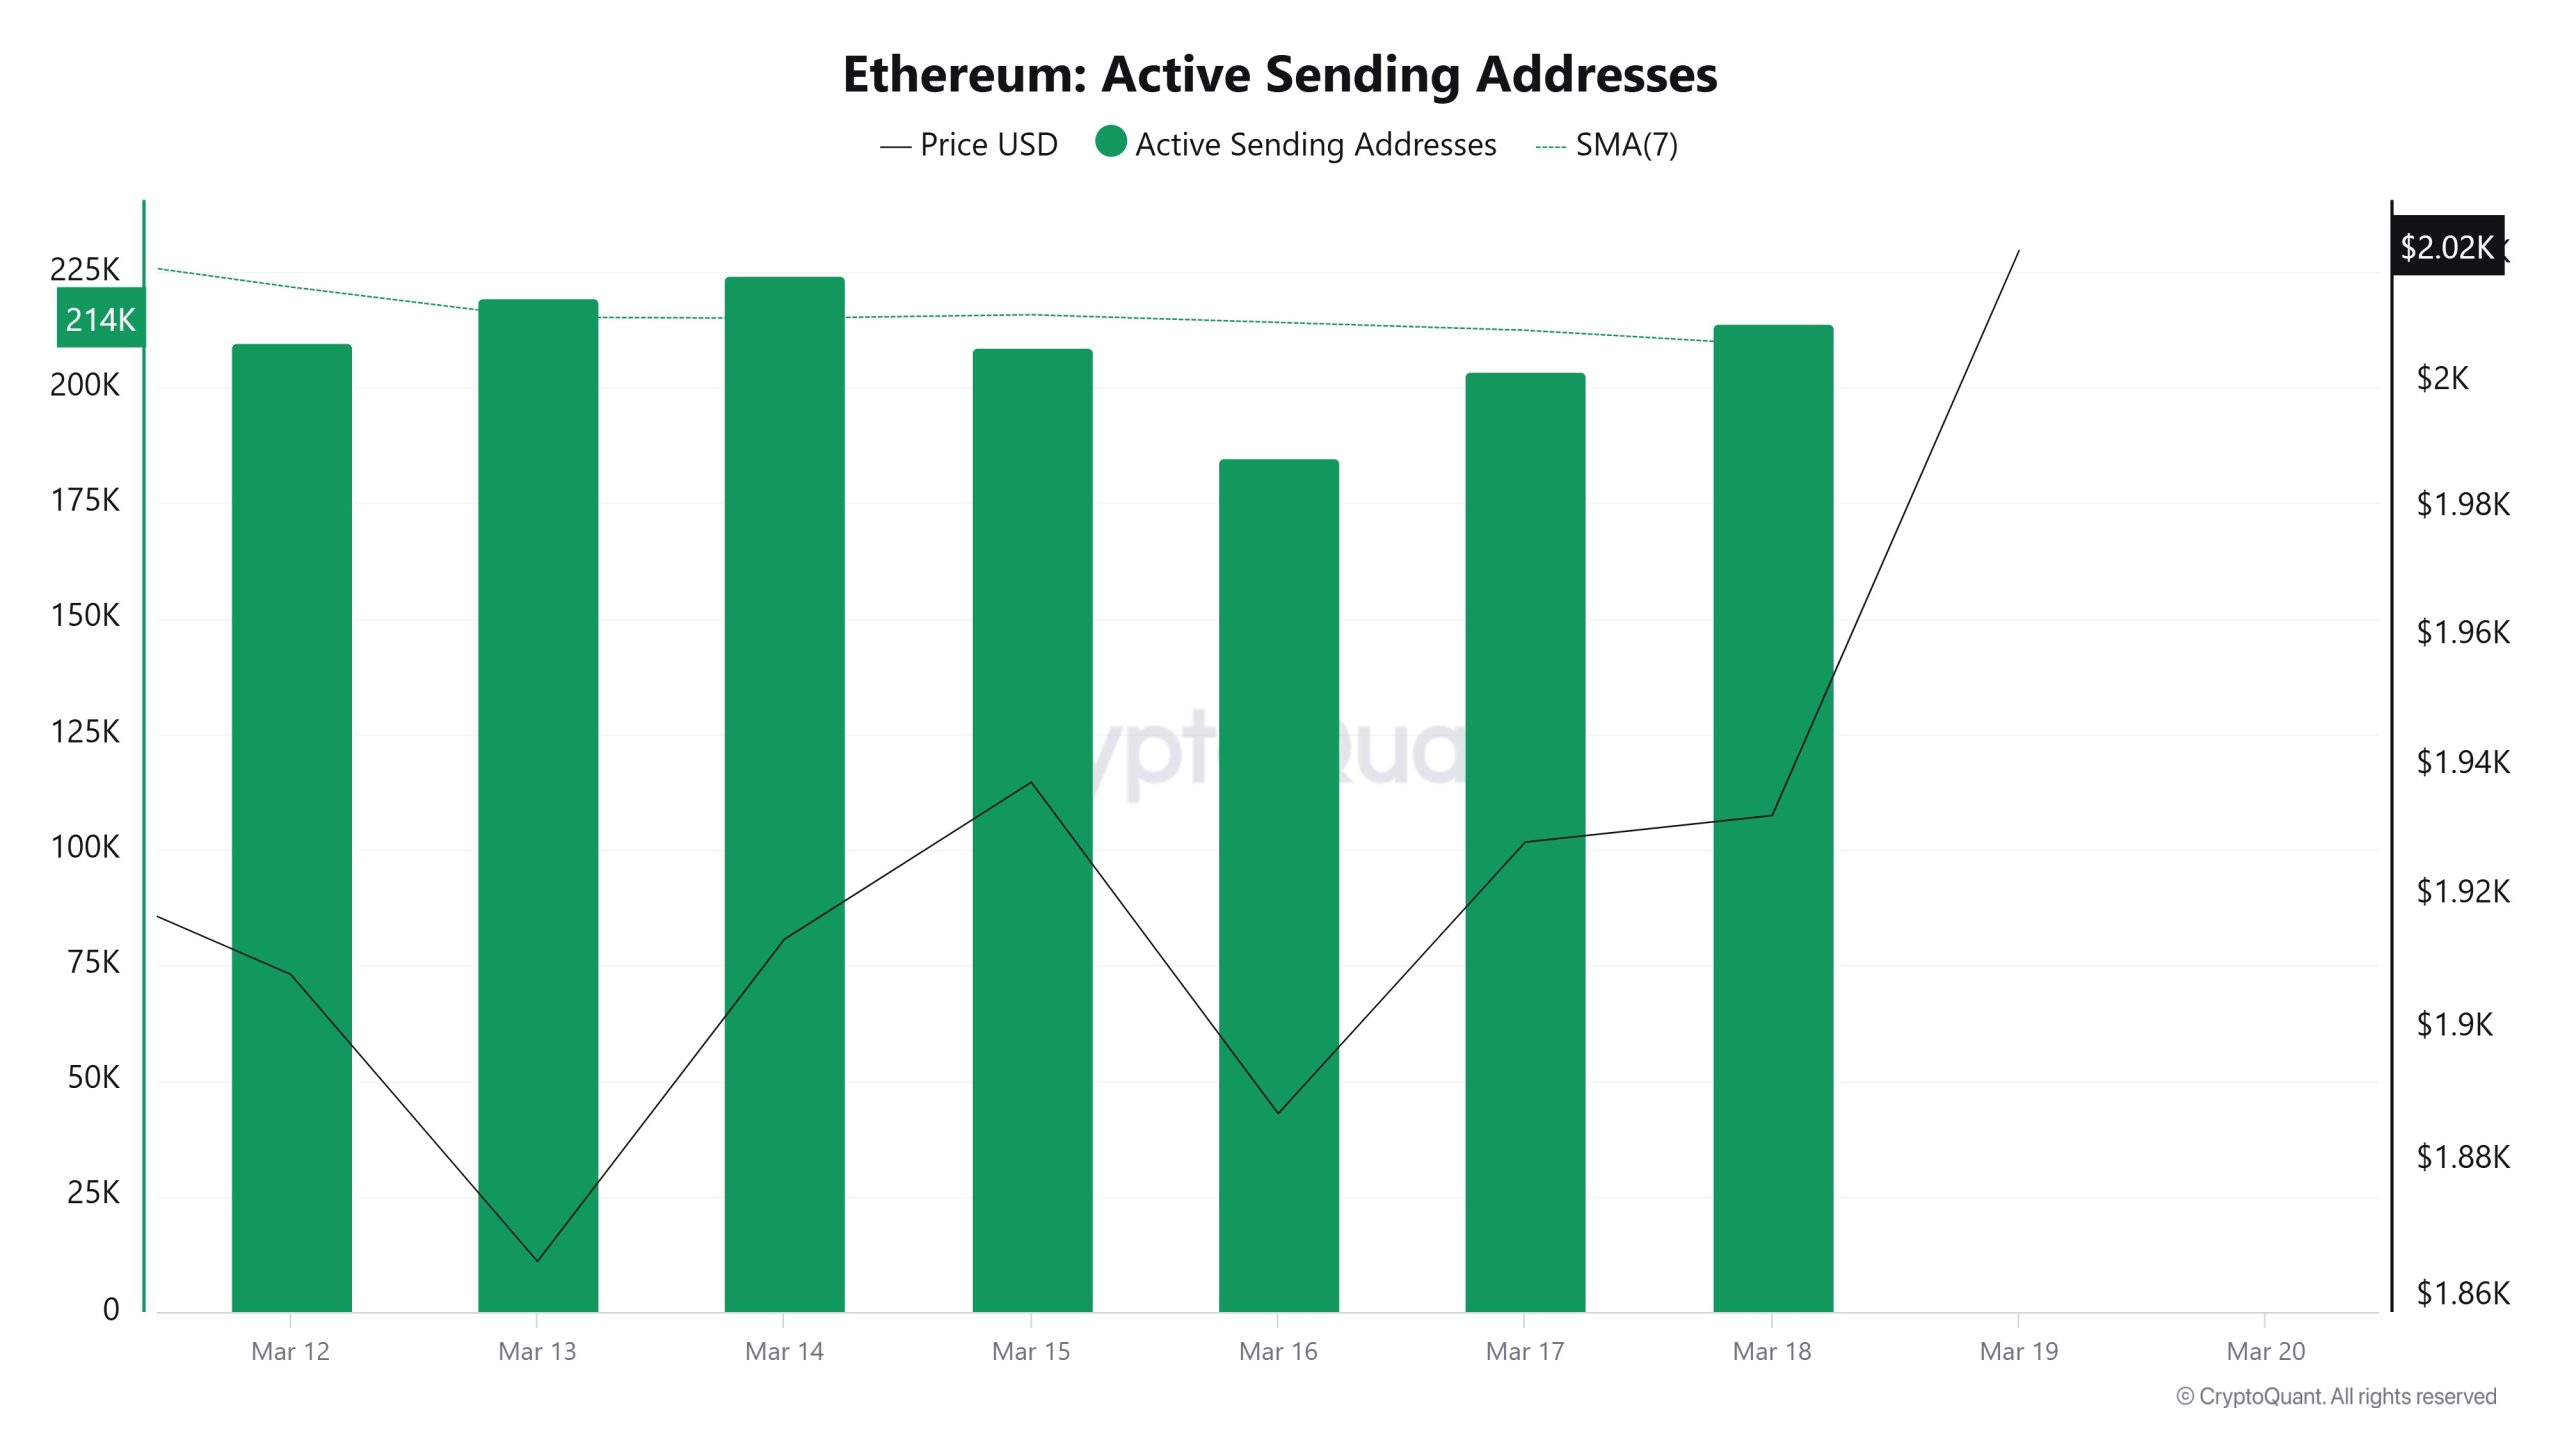
With the Black Line (price line) in active shipping addresses, there was a significant drop in active shipping addresses on March 13. On the day when the price hit its lowest point, active shipping addresses fell as low as 219,489 , indicating that buyers sold their positions as Ethereum remained at 1,865 for a while. As a result, it is seen that price drops cause an acceleration in sending addresses.
Active Receiving Addresses
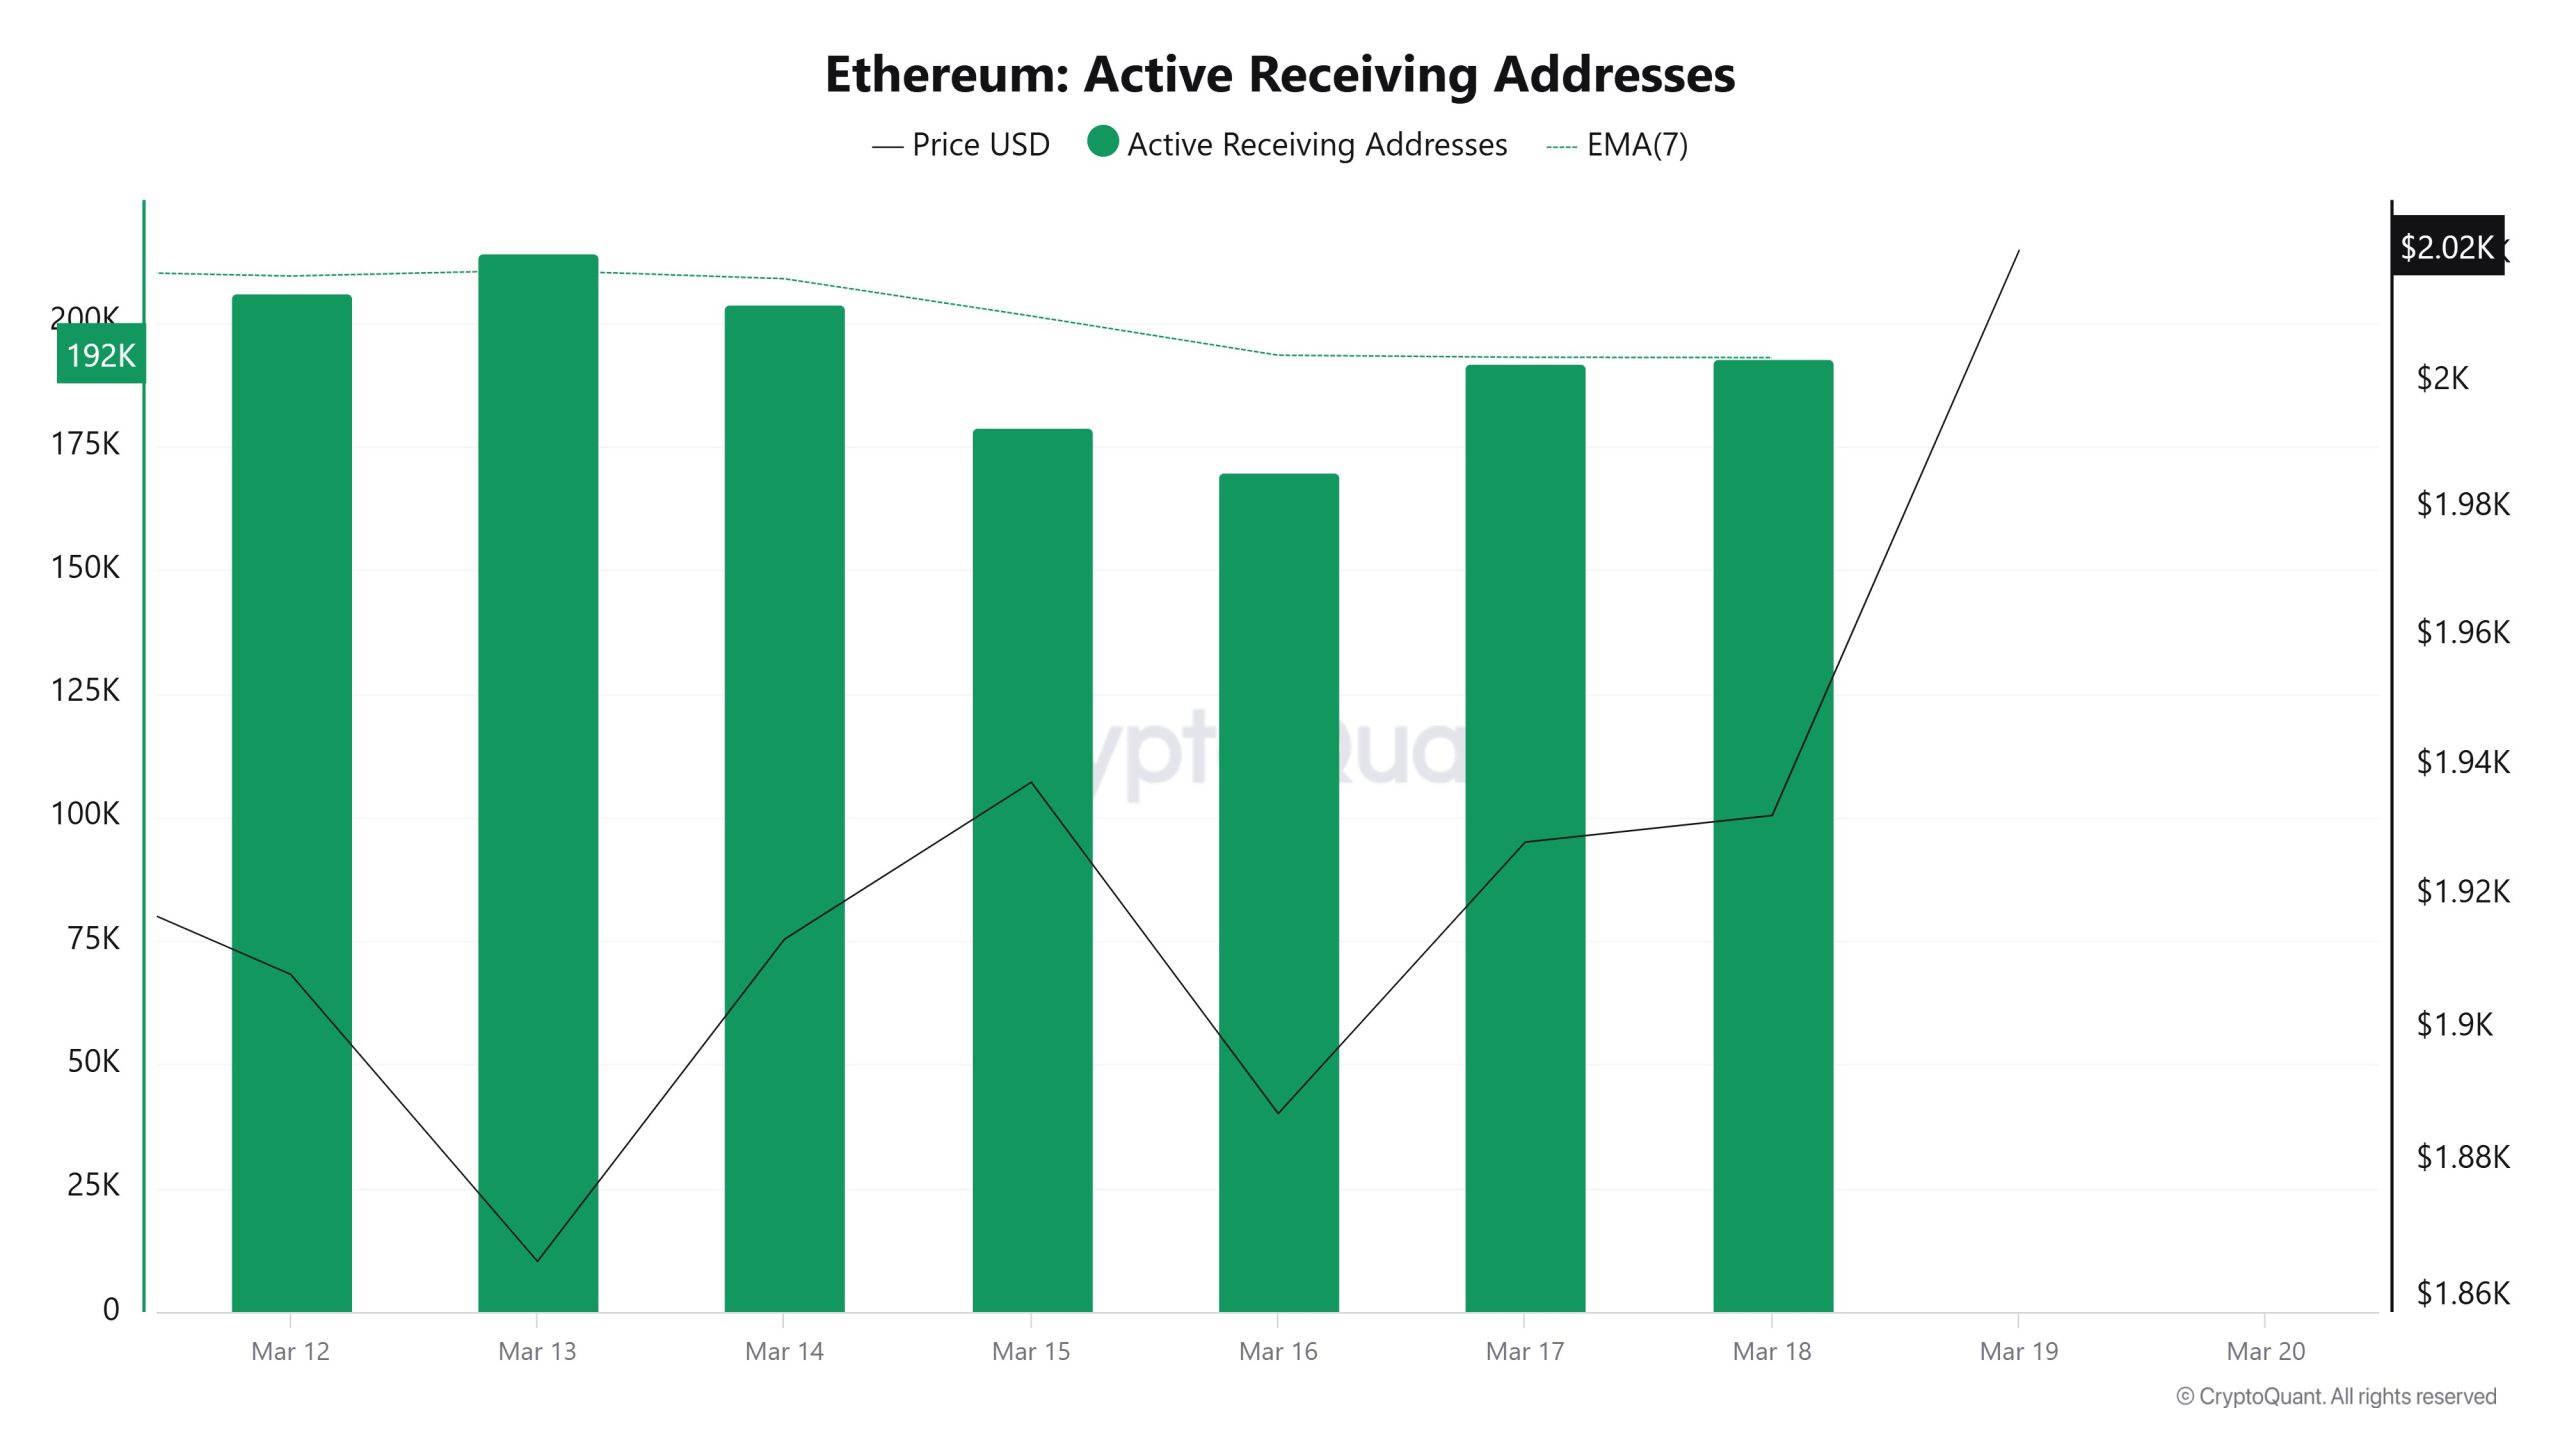
Active buyer addresses show that between March 13 and March 16, when the price was at 1,913, the number of buyers approached its lowest level of 214,092, and the longest level at which investors sold their Ethereum positions to reduce their holdings. This may be the last time buyers wait for the price before it falls.
Staking Inflows
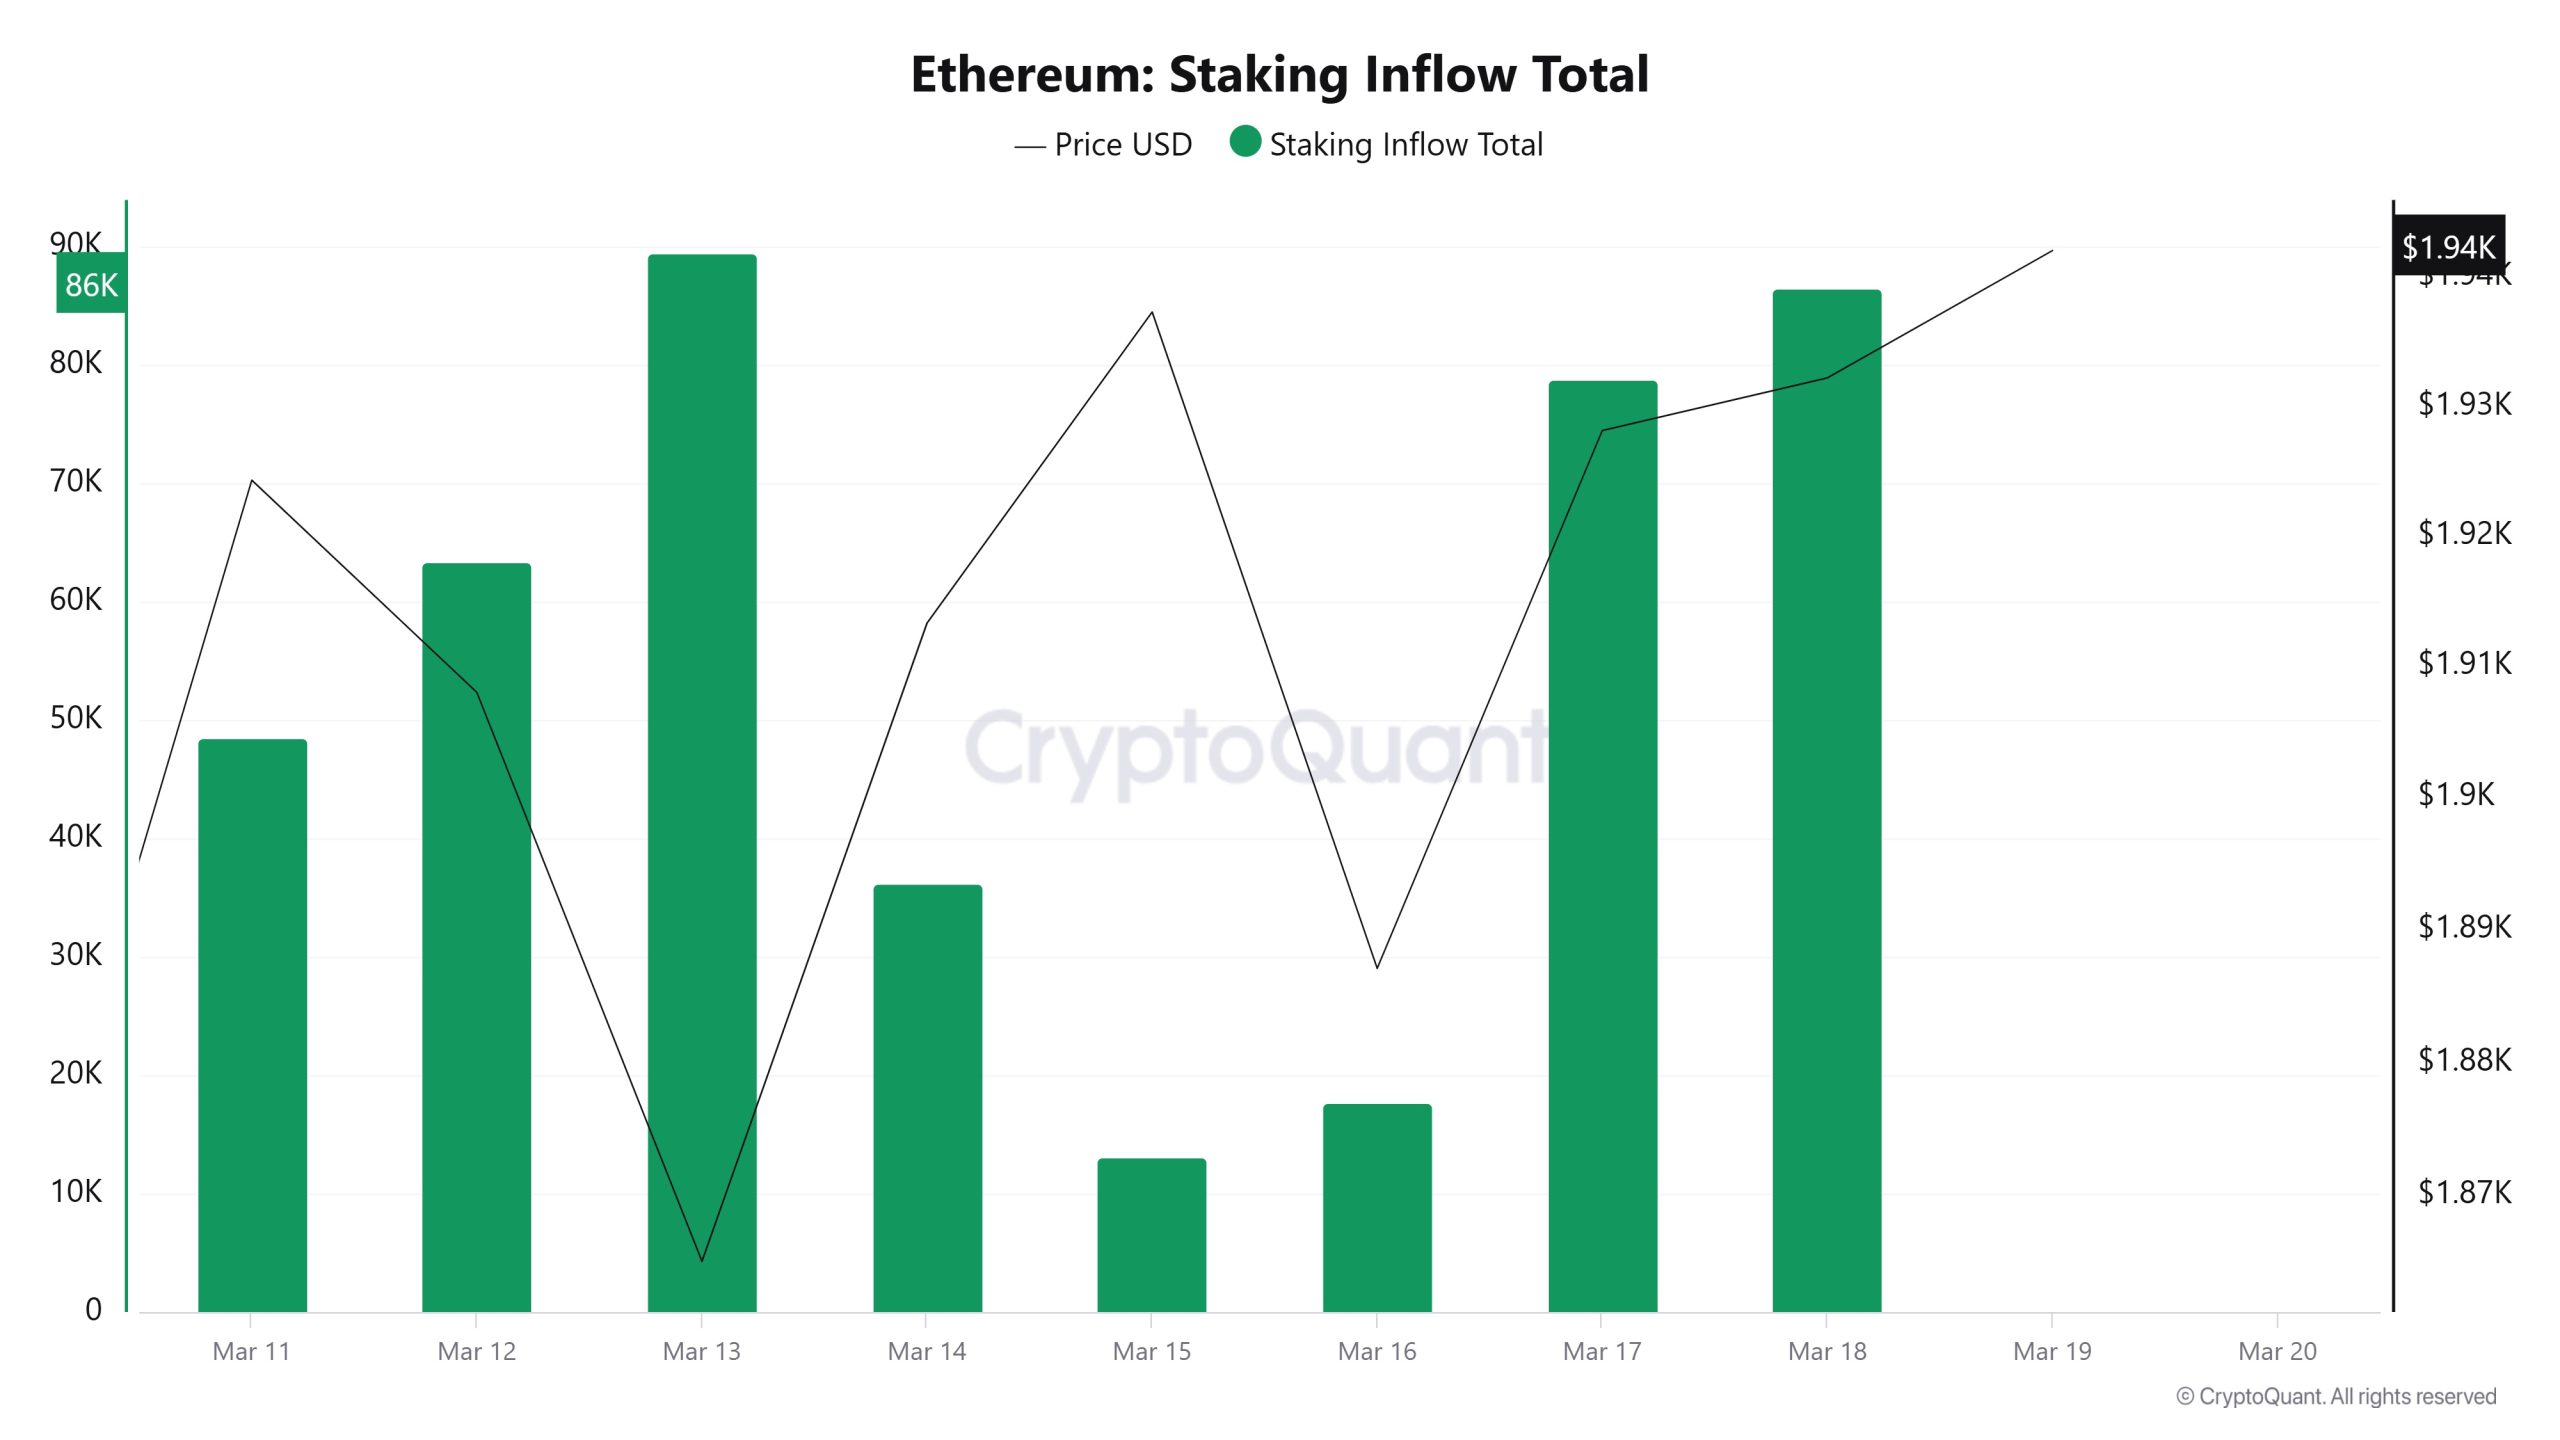
On March 12, ETH price was at 1,908 while Staking Inflow Ratio was 63,426. As of March 18, the ETH price was at 1,932, while the Staking Inflow Ratio was at 86,509. Compared to last week, there was a 1.26% increase in ETH price and a 36.4% increase in Staking Inflow Ratio.
Derivatives
Open Interest
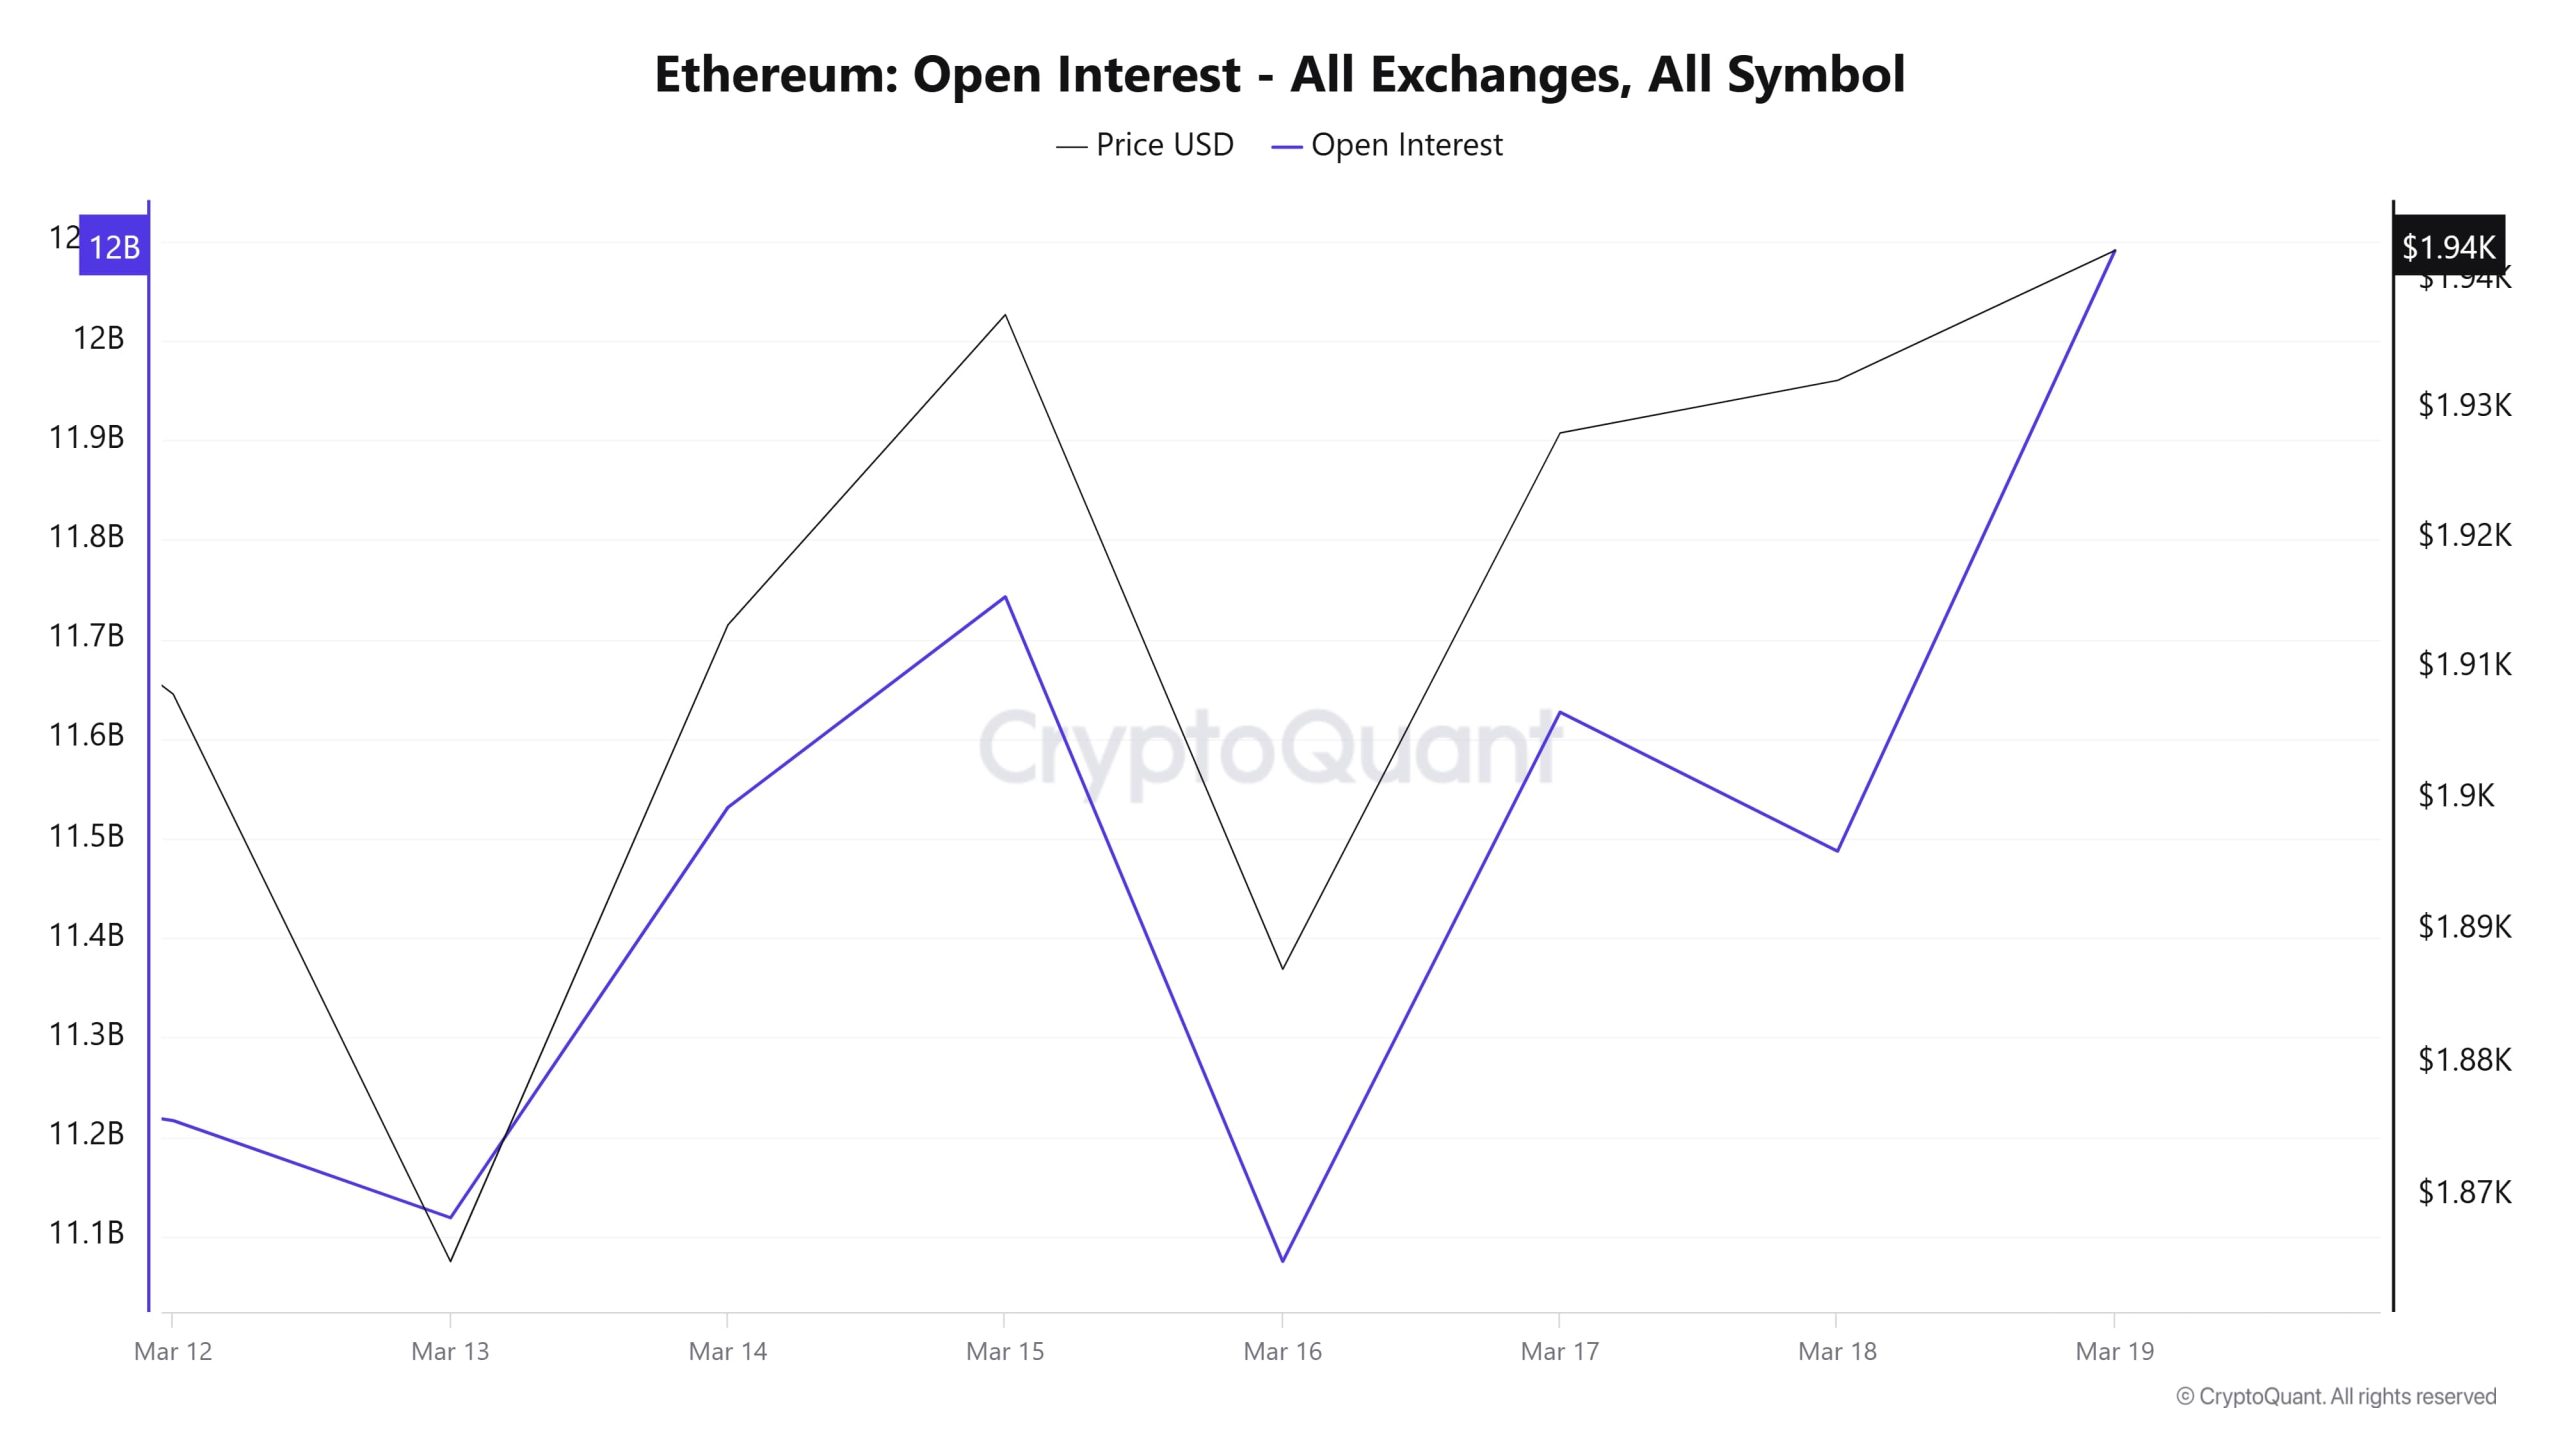
On March 12, open interest, which stood at around $11.2 billion, dropped significantly on March 13 to $11.1 billion. However, it recovered quickly from this level and reached $11.8 billion as of March 15. On March 16, a decline was seen again, returning to approximately $11.2 billion. As of March 17, open interest increased again, reaching $12 billion as of March 19. These fluctuations suggest that the market is sensitive to liquidity inflows and outflows and is going through a period of high volatility. The declines on March 13 and 16 may suggest that the market is experiencing high volatility and that some positions have been closed or liquidated. Open interest, which has increased in parallel with the recent rally, indicates that futures buying is intensifying, supporting a potential bullish scenario.
Funding Rate
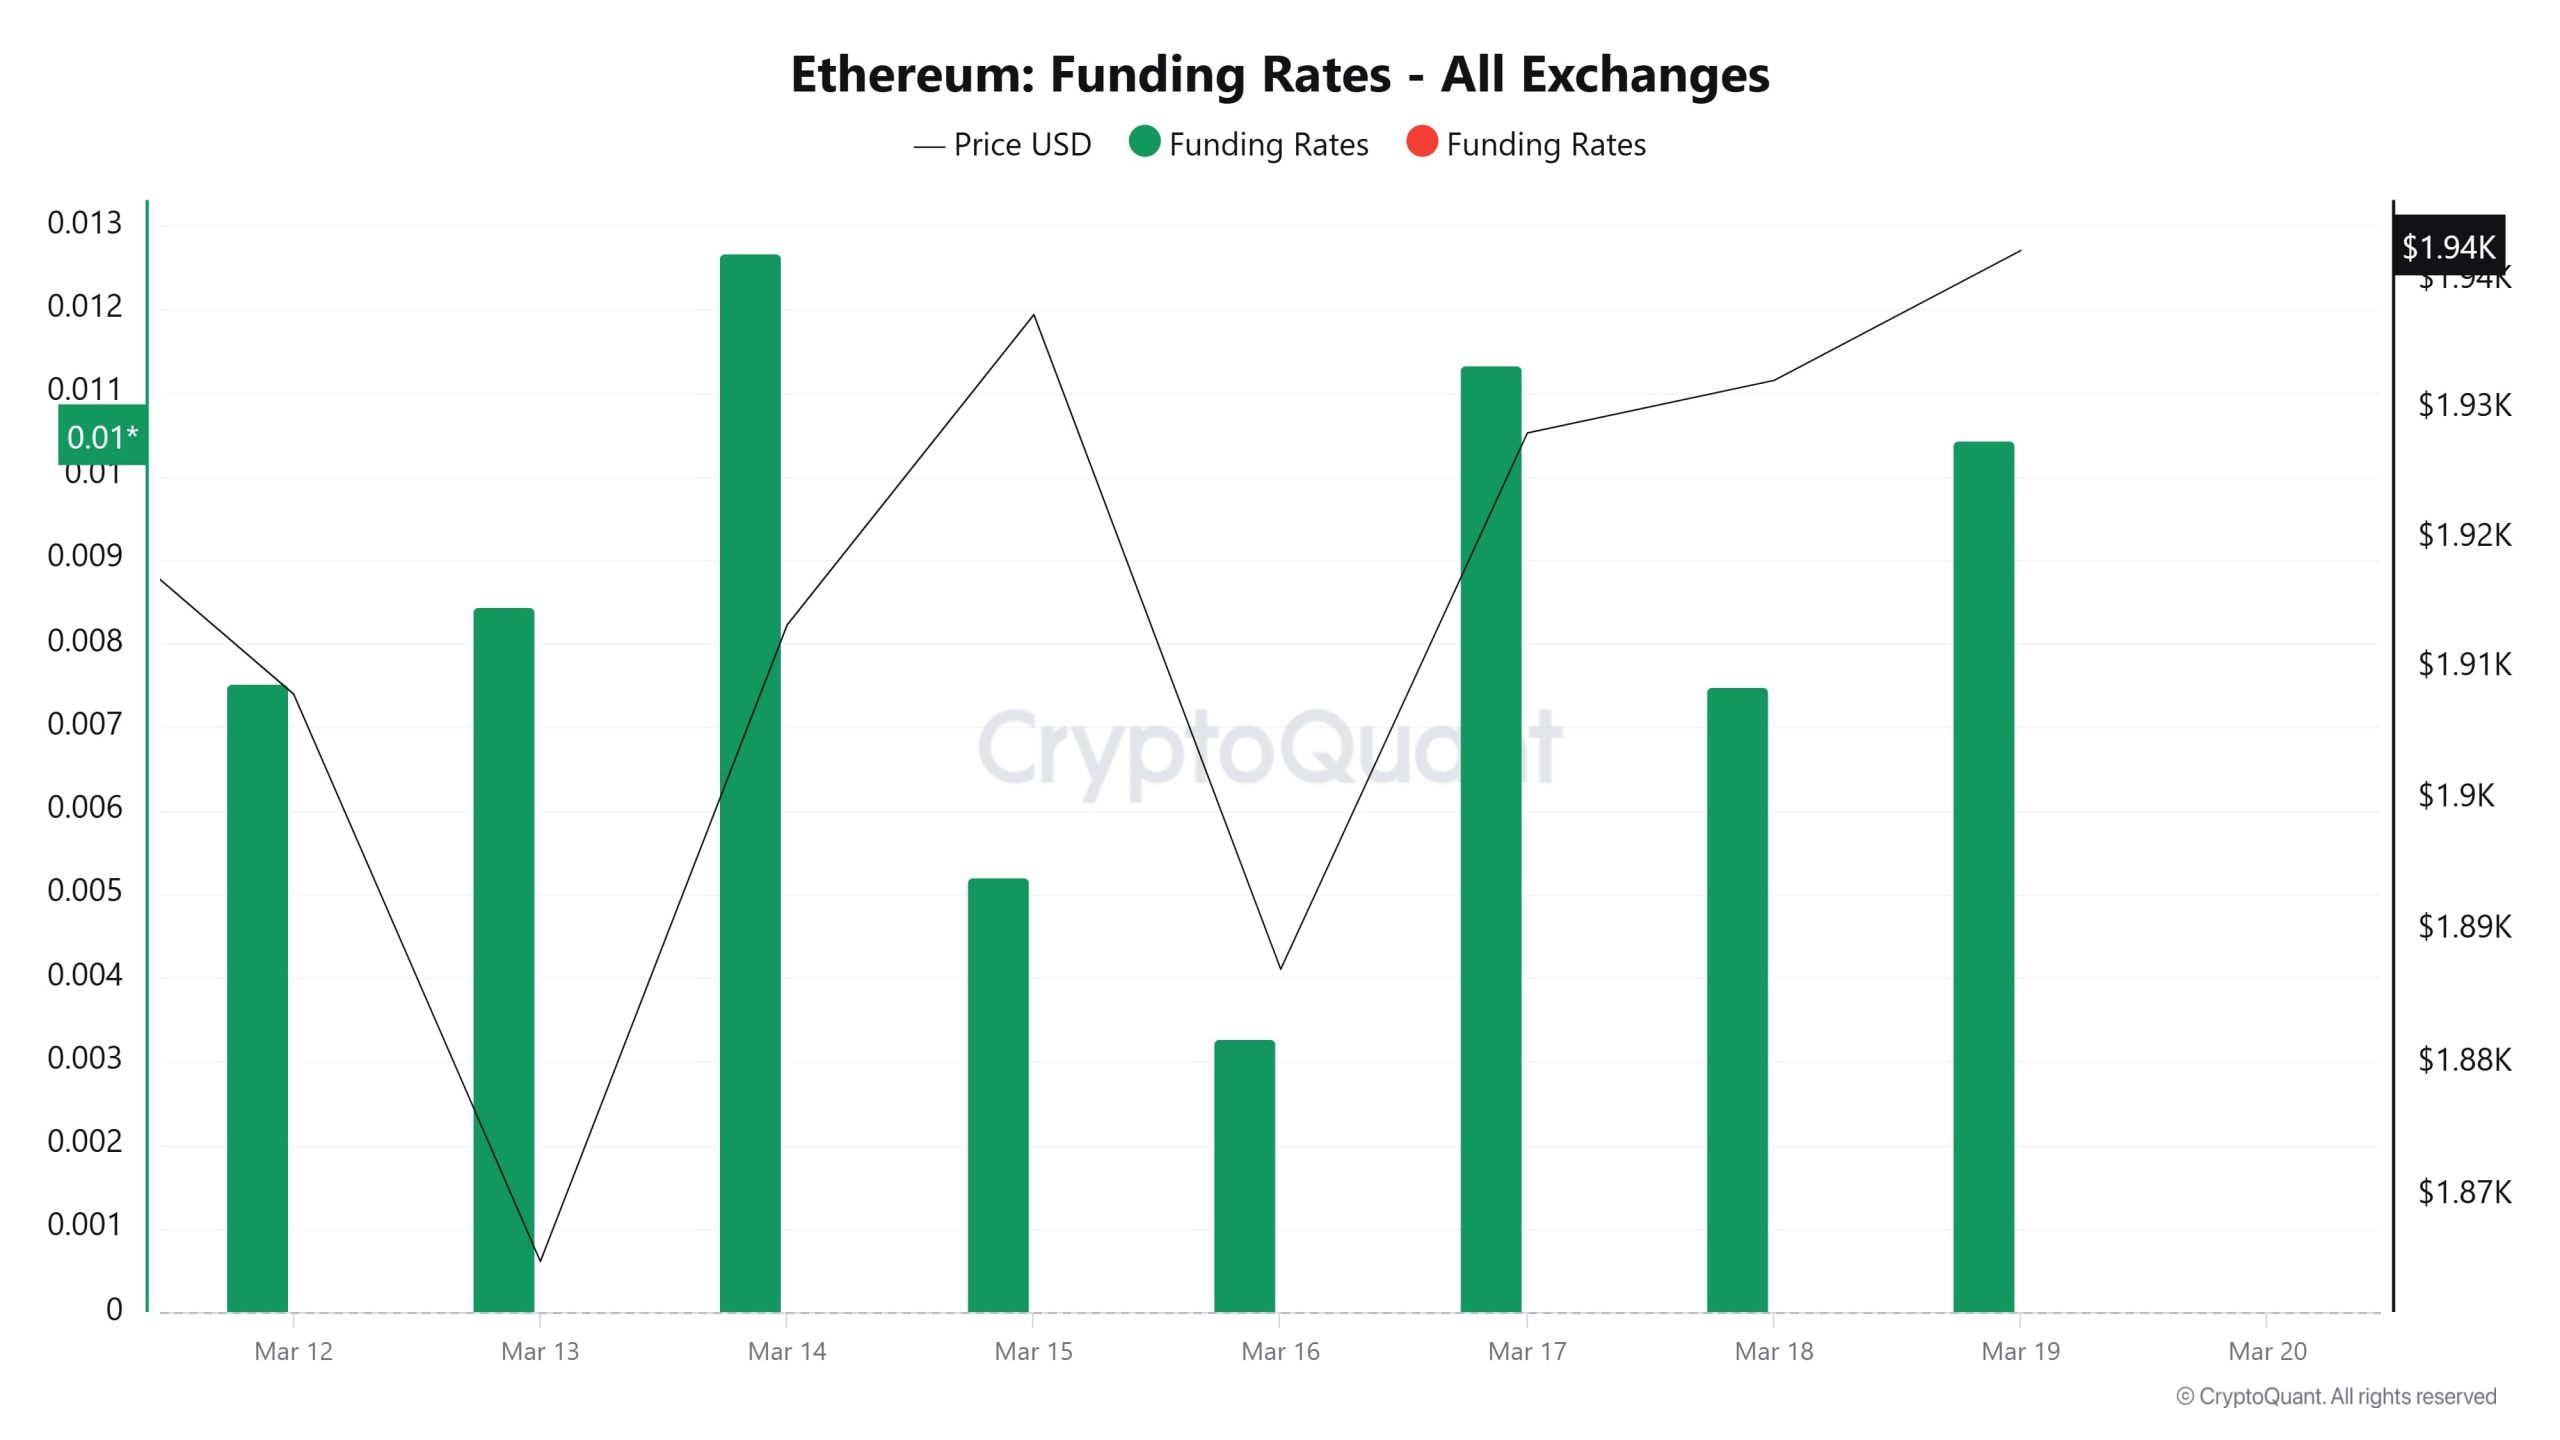
There are fluctuations in funding rates on a daily basis. On March 12, there was a relatively high funding rate, while there was a sharp drop on March 13. This could be related to a rapid reduction in long positions or an increase in short positions. However, on March 14th, there is a sharp rise in the funding rate again and this rise reaches its highest level. This suggests that the market is aggressively opening long positions. On March 15 and 16, the funding rate declined and stabilized a bit, but on March 17 it rose sharply again and on March 19 it moved up again. Overall, although there are significant fluctuations in funding rates, the dominance of long positions continues.
Long & Short Liquidations
| Date | Long Amount (Million $) | Short Amount (Million $) |
|---|---|---|
| March 12 | 61.04 | 35.25 |
| March 13 | 41.30 | 18.42 |
| March 14 | 7.98 | 22.04 |
| March 15 | 4.58 | 8.61 |
| March 16 | 44.10 | 10.17 |
| March 17 | 10.84 | 23.83 |
| March 18 | 28.45 | 11.41 |
| Total | 198.29 | 129.73 |
Supply Distribution
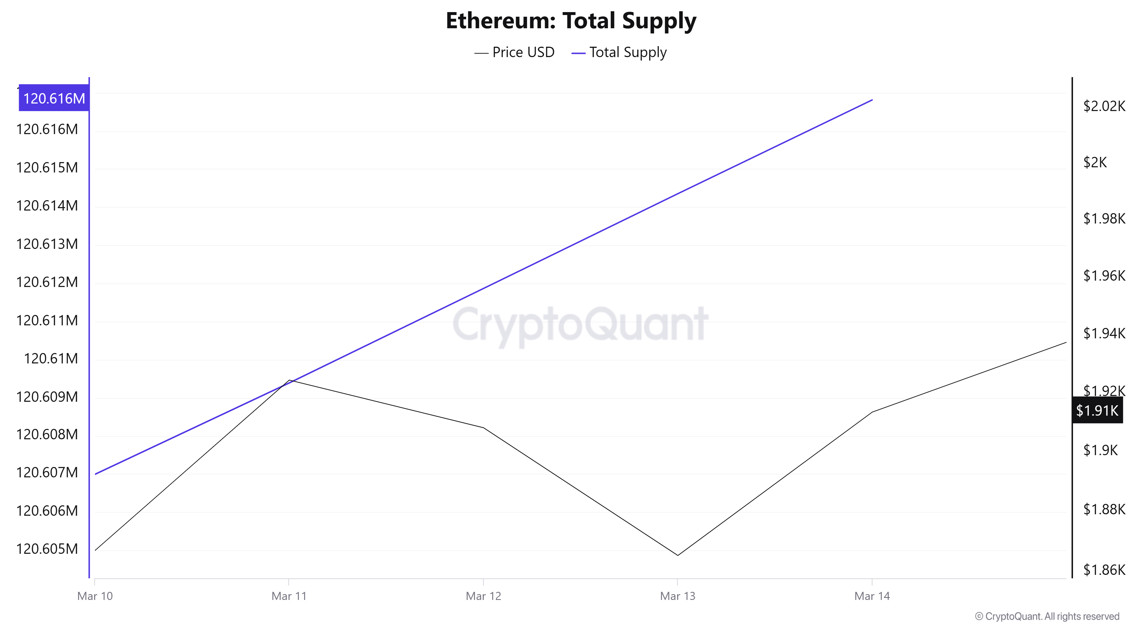
Total Supply: It reached 19,838,711 units, up about 0.01596% from last week.
New Supply: The amount of BTC produced this week was 3,165.
Velocity: Velocity, which was 13.74 last week, was 13.54 as of March 18.
| Wallet Category | 11.03.2025 | 18.03.2025 | Change (%) |
|---|---|---|---|
| < 1 BTC | 8.5343% | 8.5373% | 0.035% |
| 1 – 10 BTC | 11.759% | 11.77% | 0.094% |
| 10 – 100 BTC | 24.844% | 24.837% | -0.028% |
| 100 – 1k BTC | 28.17% | 28.064% | -0.0376% |
| 1k – 10k BTC | 18.258% | 18.417% | 0.0871% |
| 10k+ BTC | 8.431% | 8.373% | -0.688% |
When we look at the wallet distribution of the current supply, it is seen that there is an increase of 0.035% in the “< 1 BTC” category, where small investors are located. In the 1 – 10 BTC range, an increase of 0.094% is observed. While there was a slight decrease of 0.028% in the 10 – 100 BTC segment, it can be said that investors in this group remained largely stable. The 100 – 1K BTC category experienced a decrease of 0.376%, indicating that some of the mid-large investors reduced their holdings. 1K – 10K BTC holders saw an increase of 0.871%, while the 10K+ BTC category saw a decrease of 0.688%. This shows that some of the large-scale investors changed their allocation, but there was no major movement overall.
Exchange Reserve
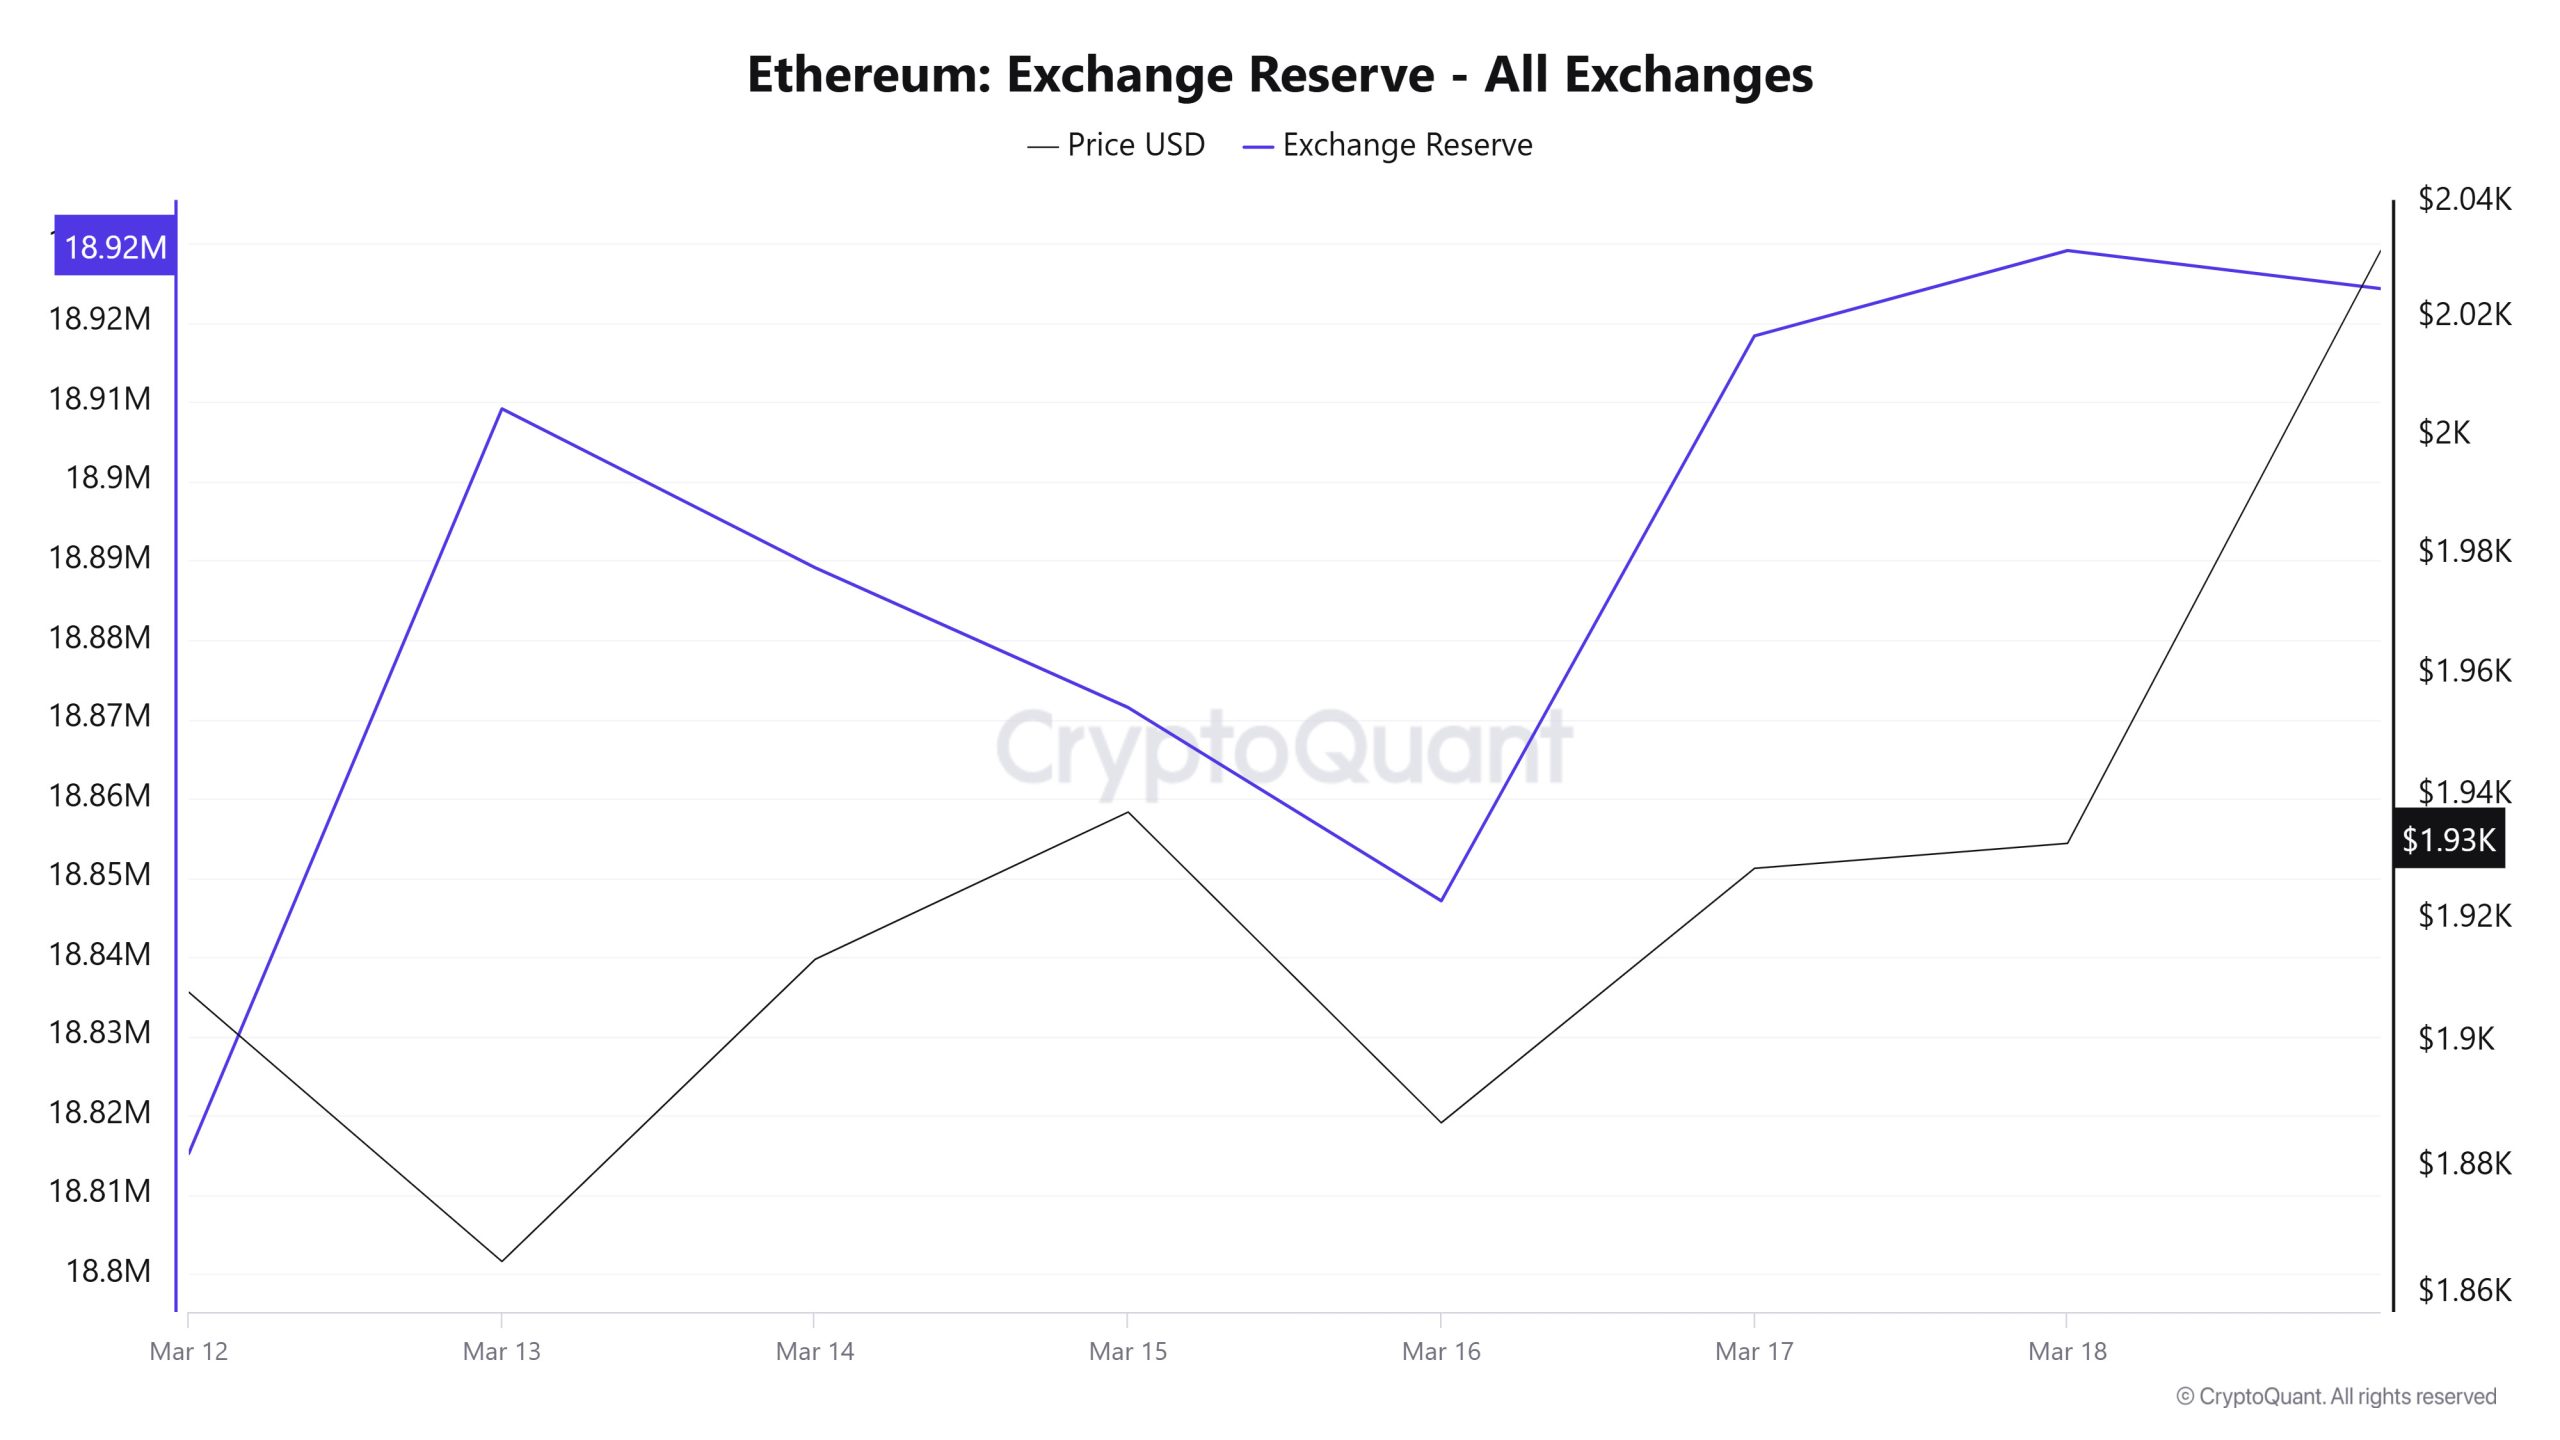
Between March 12-18, 2025, Ethereum reserves on exchanges increased from 18,815,227 ETH to 18,929,127 ETH. During this period, there was a total net inflow of 113,900 ETH and the exchanges’ Ethereum reserves increased by 0.61%. The Ethereum price increased by approximately 1.3% during this period. Ethereum, which closed at $1,908 on March 12, 2025, closed at $1,932 on March 18, 2025. Net inflows to exchanges may put selling pressure on the price in the short term. (Decline)
| Date | 12-Mar | 13-Mar | 14-Mar | 15-Mar | 16-Mar | 17-Mar | 18-Mar |
|---|---|---|---|---|---|---|---|
| Exchange Inflow | 1,186,357 | 846,207 | 677,110 | 257,625 | 244,899 | 787,456 | 1,130,242 |
| Exchange Outflow | 1,172,743 | 752,269 | 697,147 | 275,276 | 269,279 | 716,188 | 1,119,480 |
| Exchange Netflow | 13,614 | 93,938 | -20,036 | -17,652 | -24,380 | 71,268 | 10,762 |
| Exchange Reserve | 18,815,227 | 18,909,165 | 18,889,129 | 18,871,477 | 18,847,097 | 18,918,365 | 18,929,127 |
| ETH Price | 1,908 | 1,865 | 1,913 | 1,937 | 1,887 | 1,928 | 1,932 |
Fees and Revenues
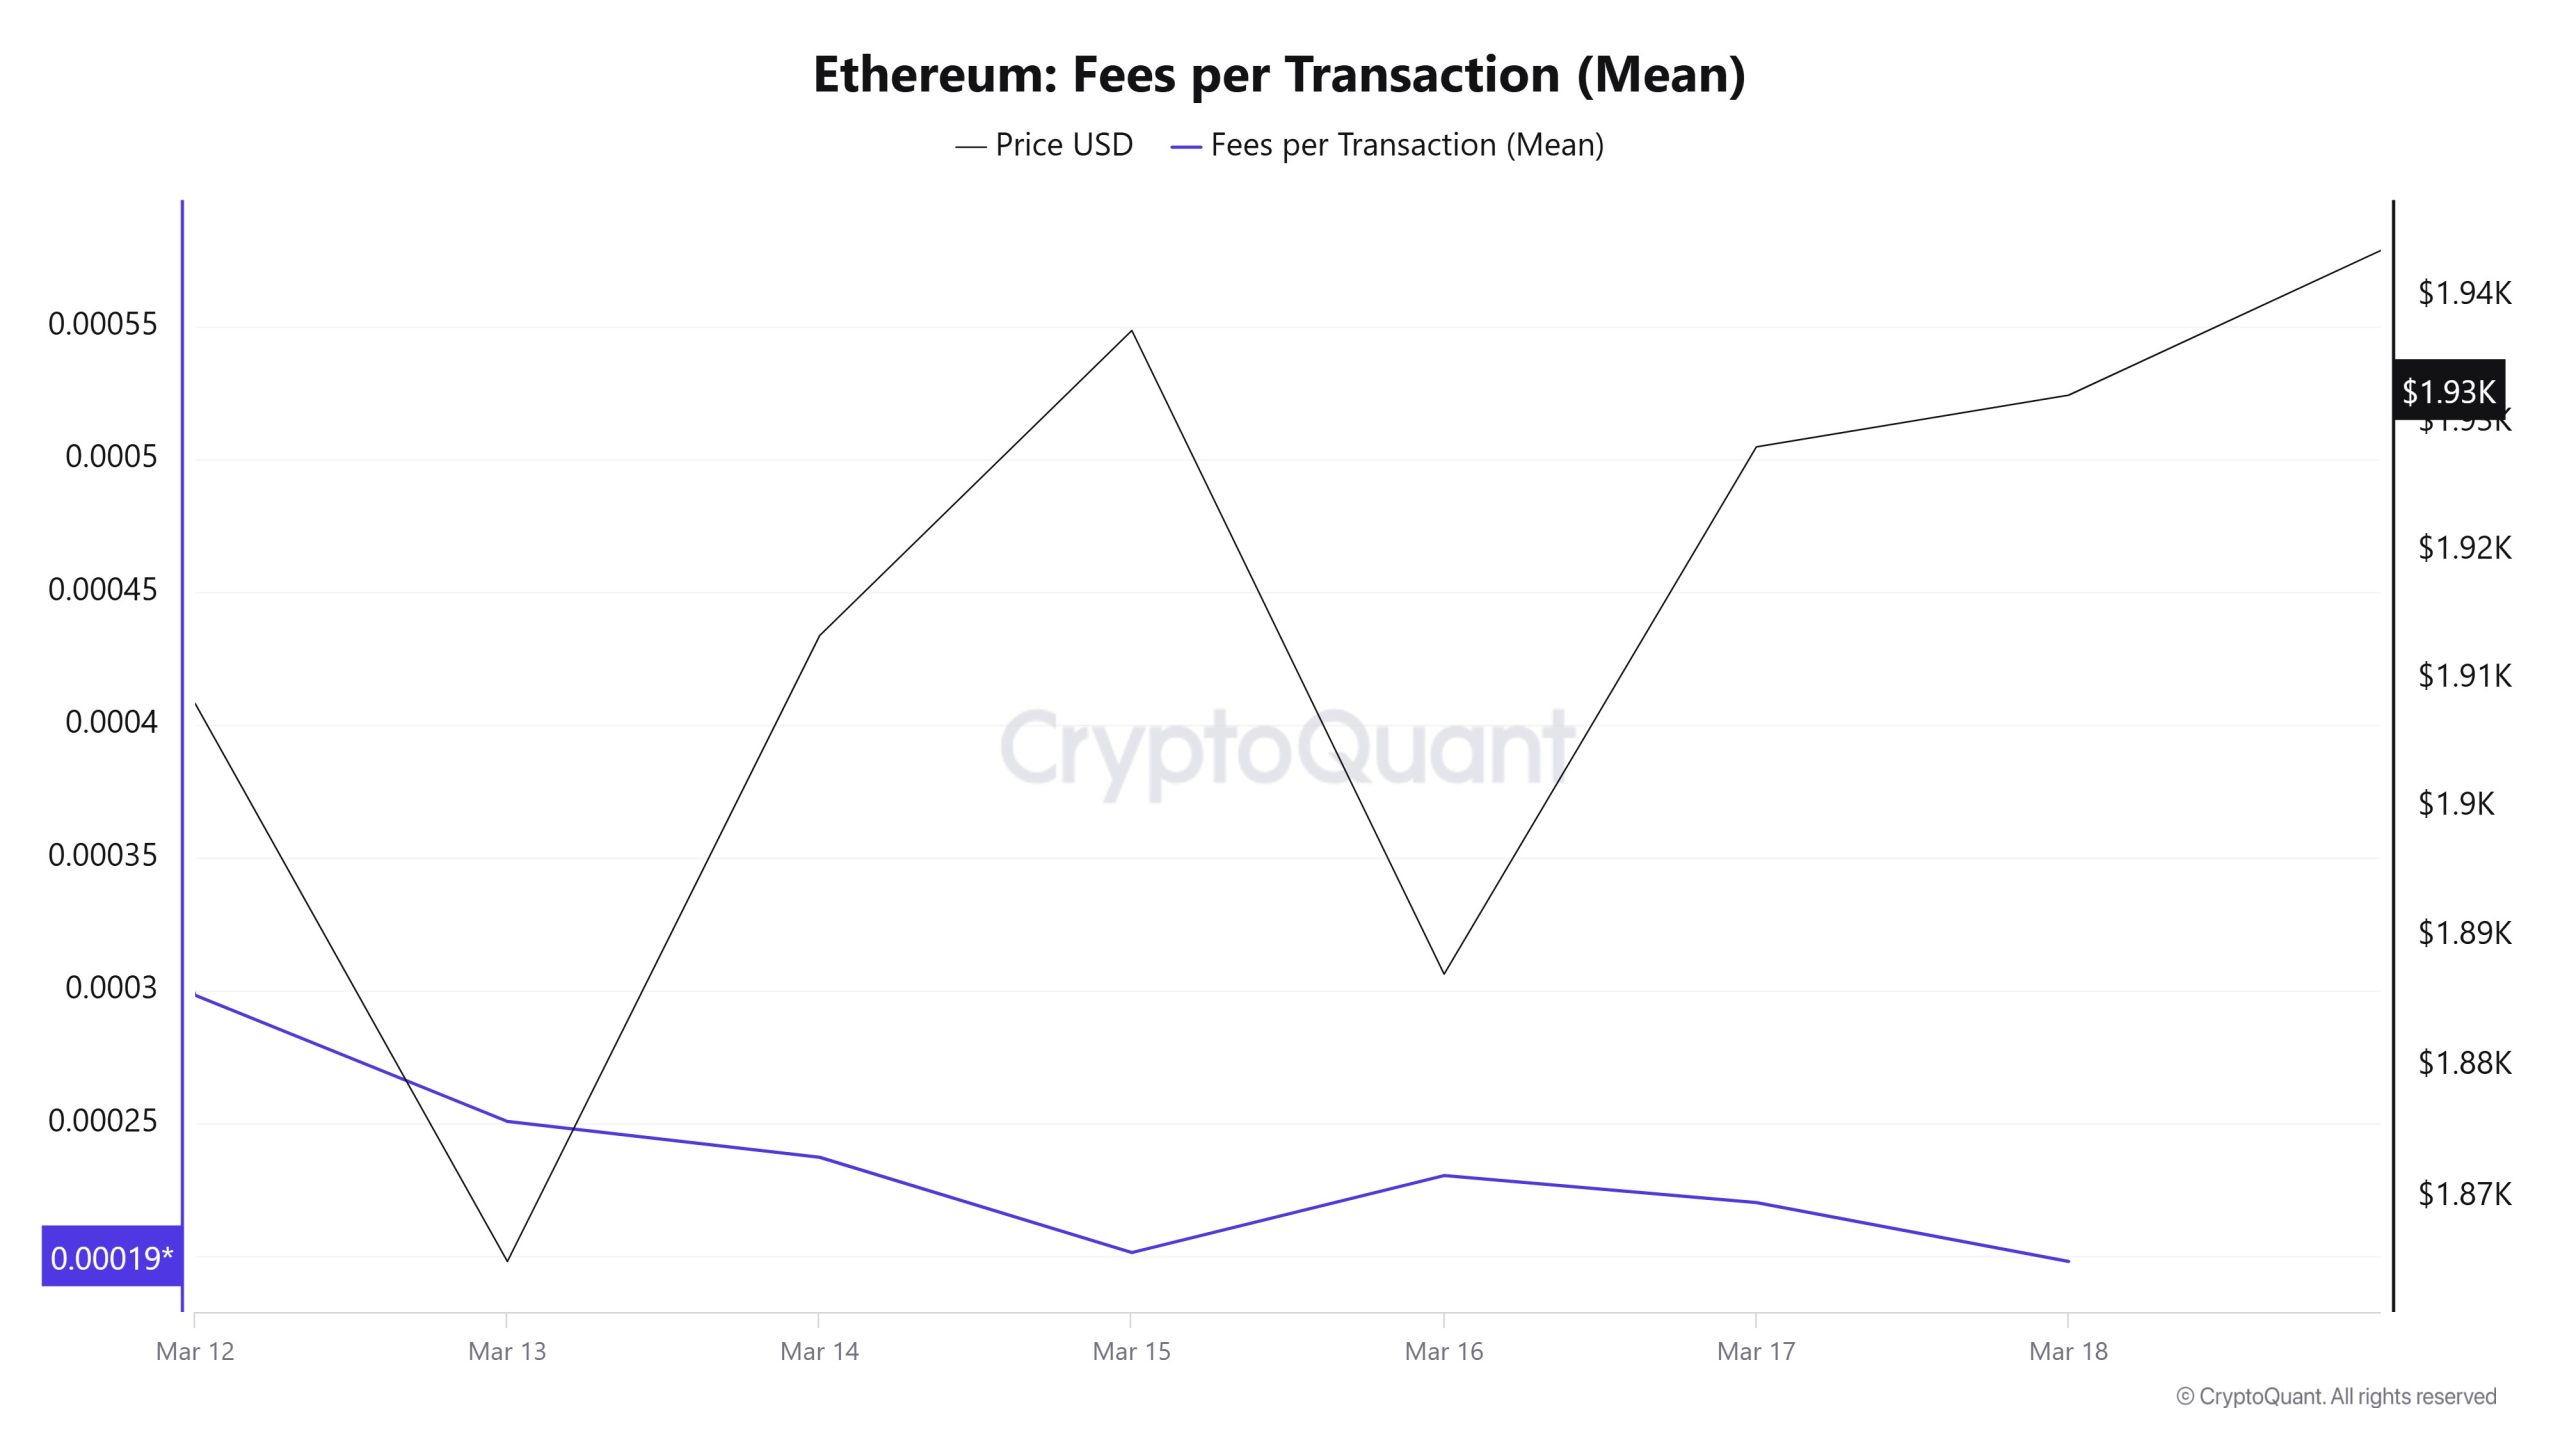
When the Ethereum Fees per Transaction (Mean) data between March 12 and 18, is analyzed, it was seen that this value was at the level of 0.000298379124588724 on March 12, the first day of the week. Until March 15, the value, which followed a relatively calmer movement compared to the horizontal movement seen in the Ethereum price, showed a downward trend until March 15. On March 16, the value increased again and reached 0.000230443155703349.
Fees per Transaction (Mean) value, which started to decrease again towards the last day of the weekly period, closed at the lowest value of the week on March 18 at 0.000198096241765523.
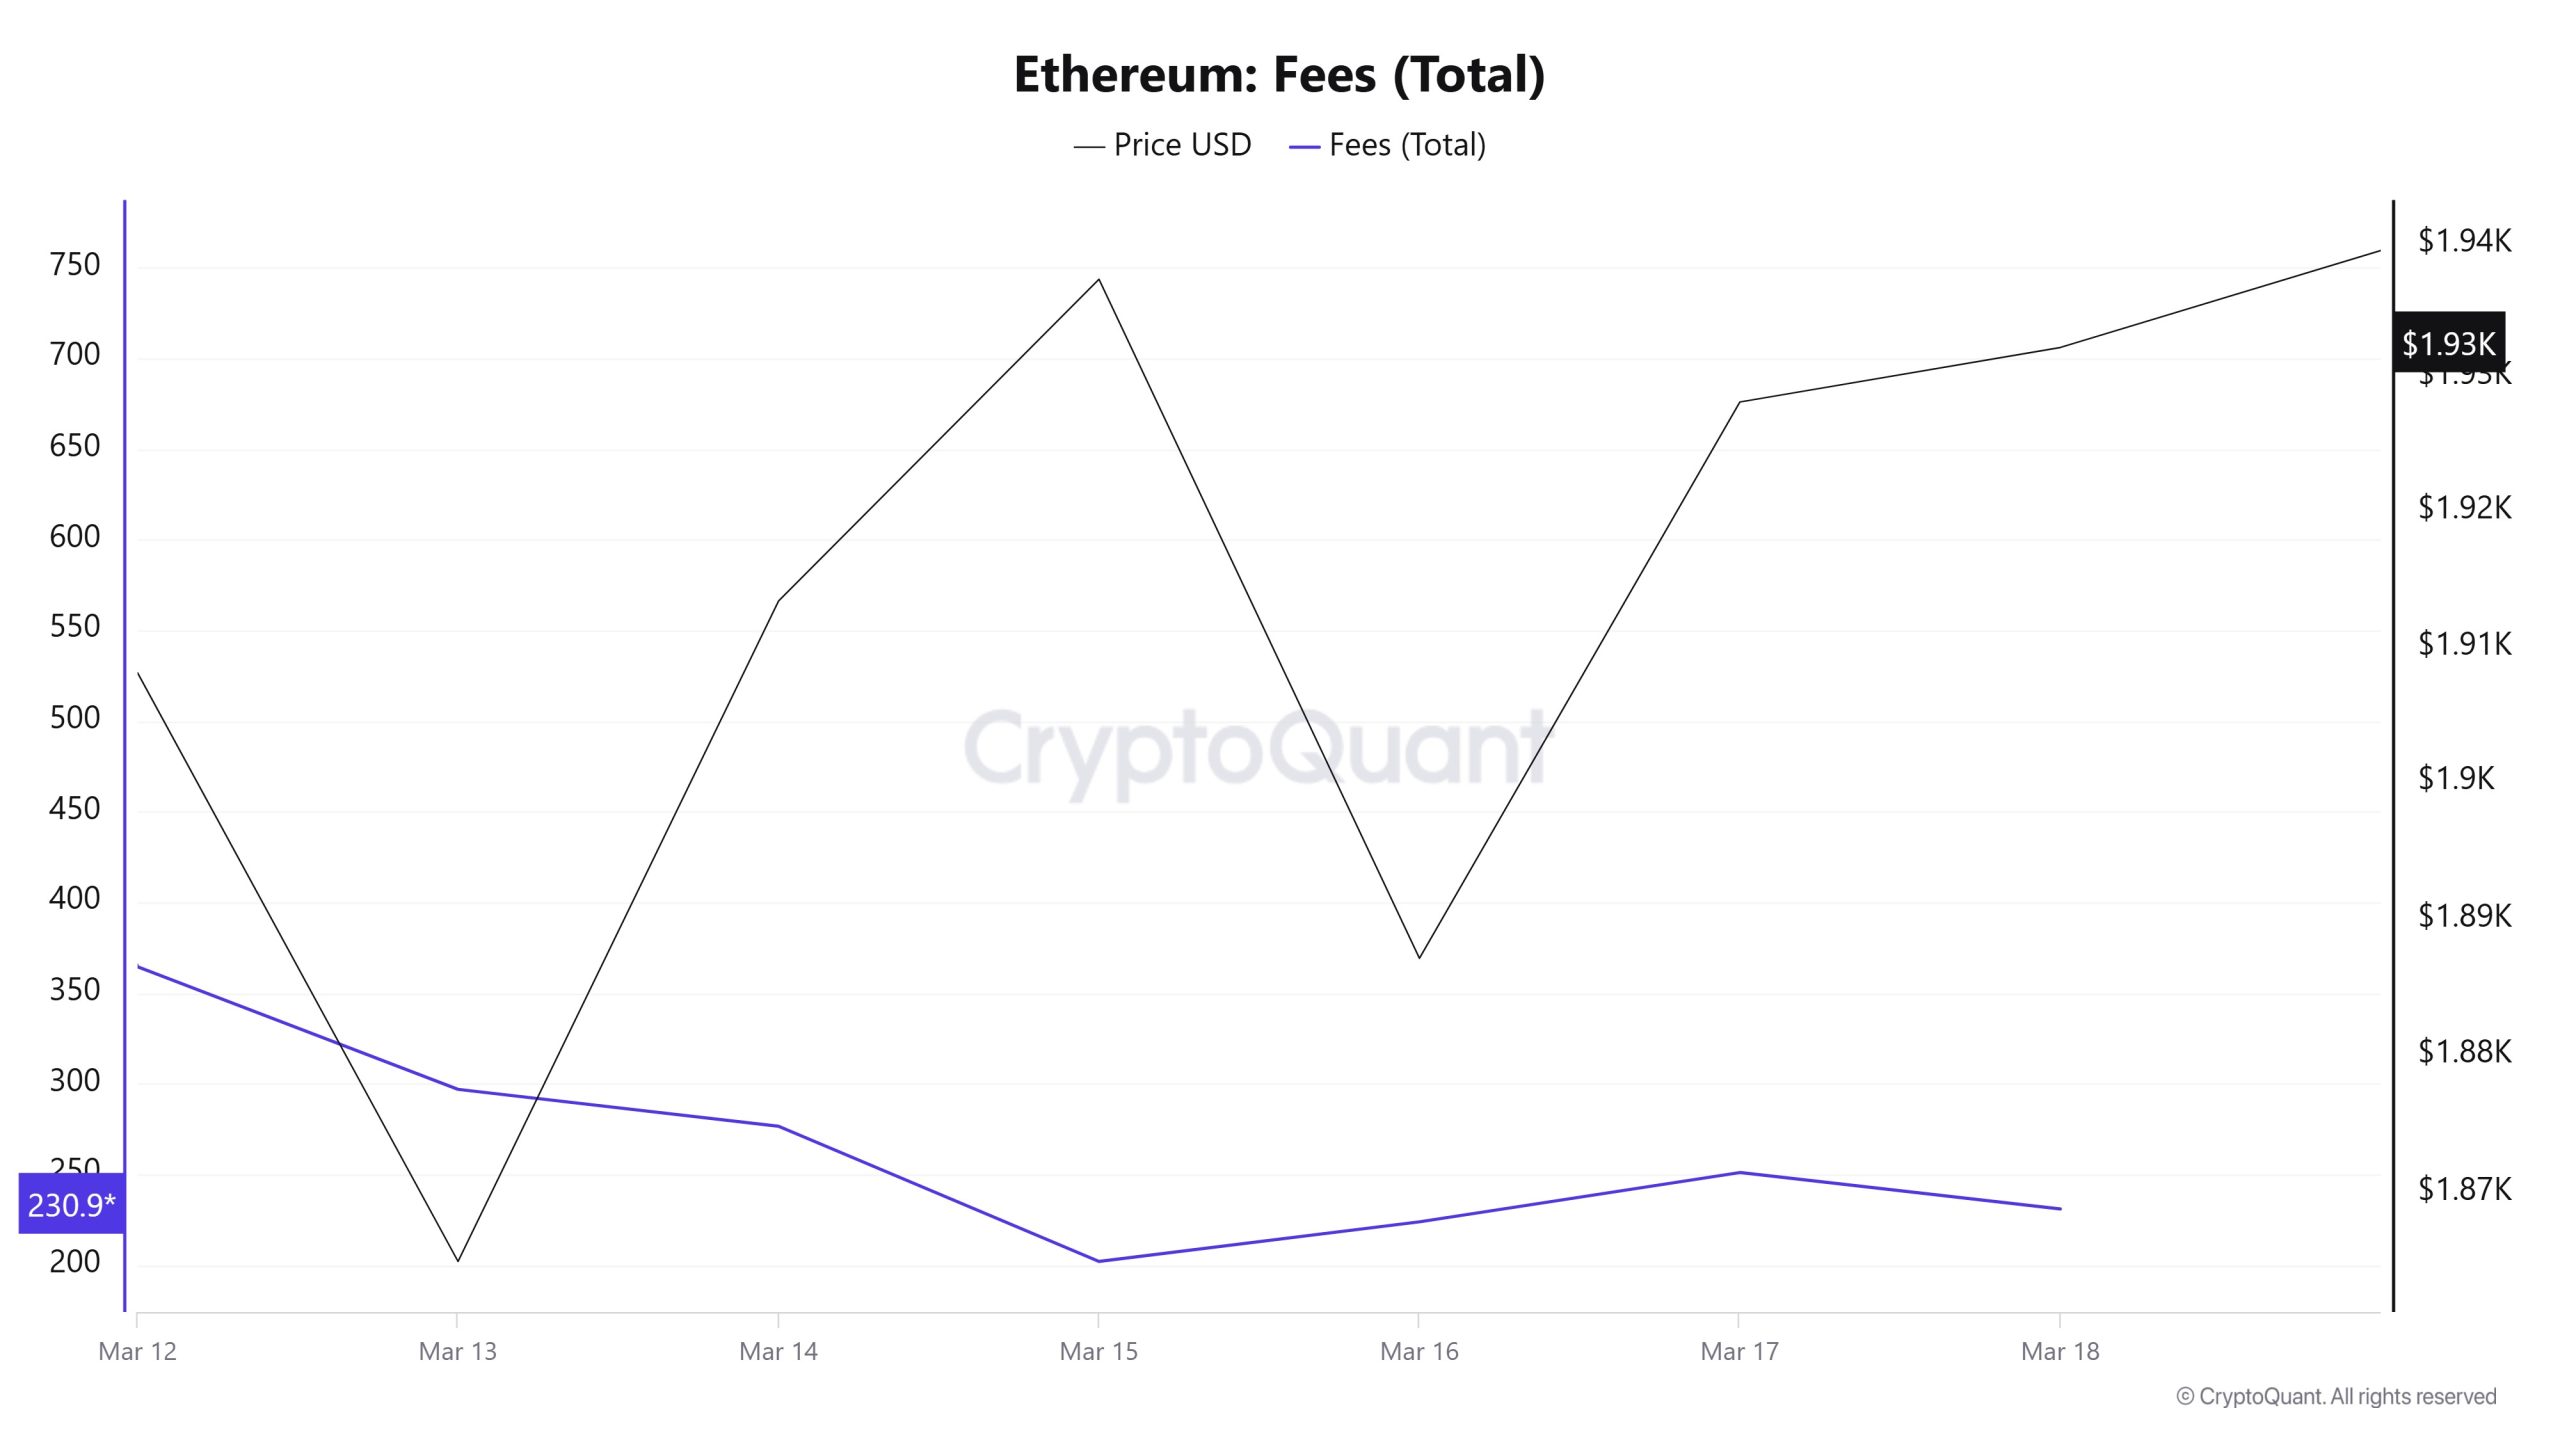
Similarly, when the Ethereum Fees (Total) data between March 12 and 18 is analyzed, it is seen that this value was 364.46293958613614 on March 12, the first day of the week. Until March 15, the value, which followed a relatively calmer movement compared to the Ethereum price, showed a downward trend until March 15. Thus, the value increased again on March 17, reaching the level of 250.97803095791872.
Fees (Total), which started to decline again towards the last day of the weekly period, closed at 230.91662900499284 on March 18.
Block Mined
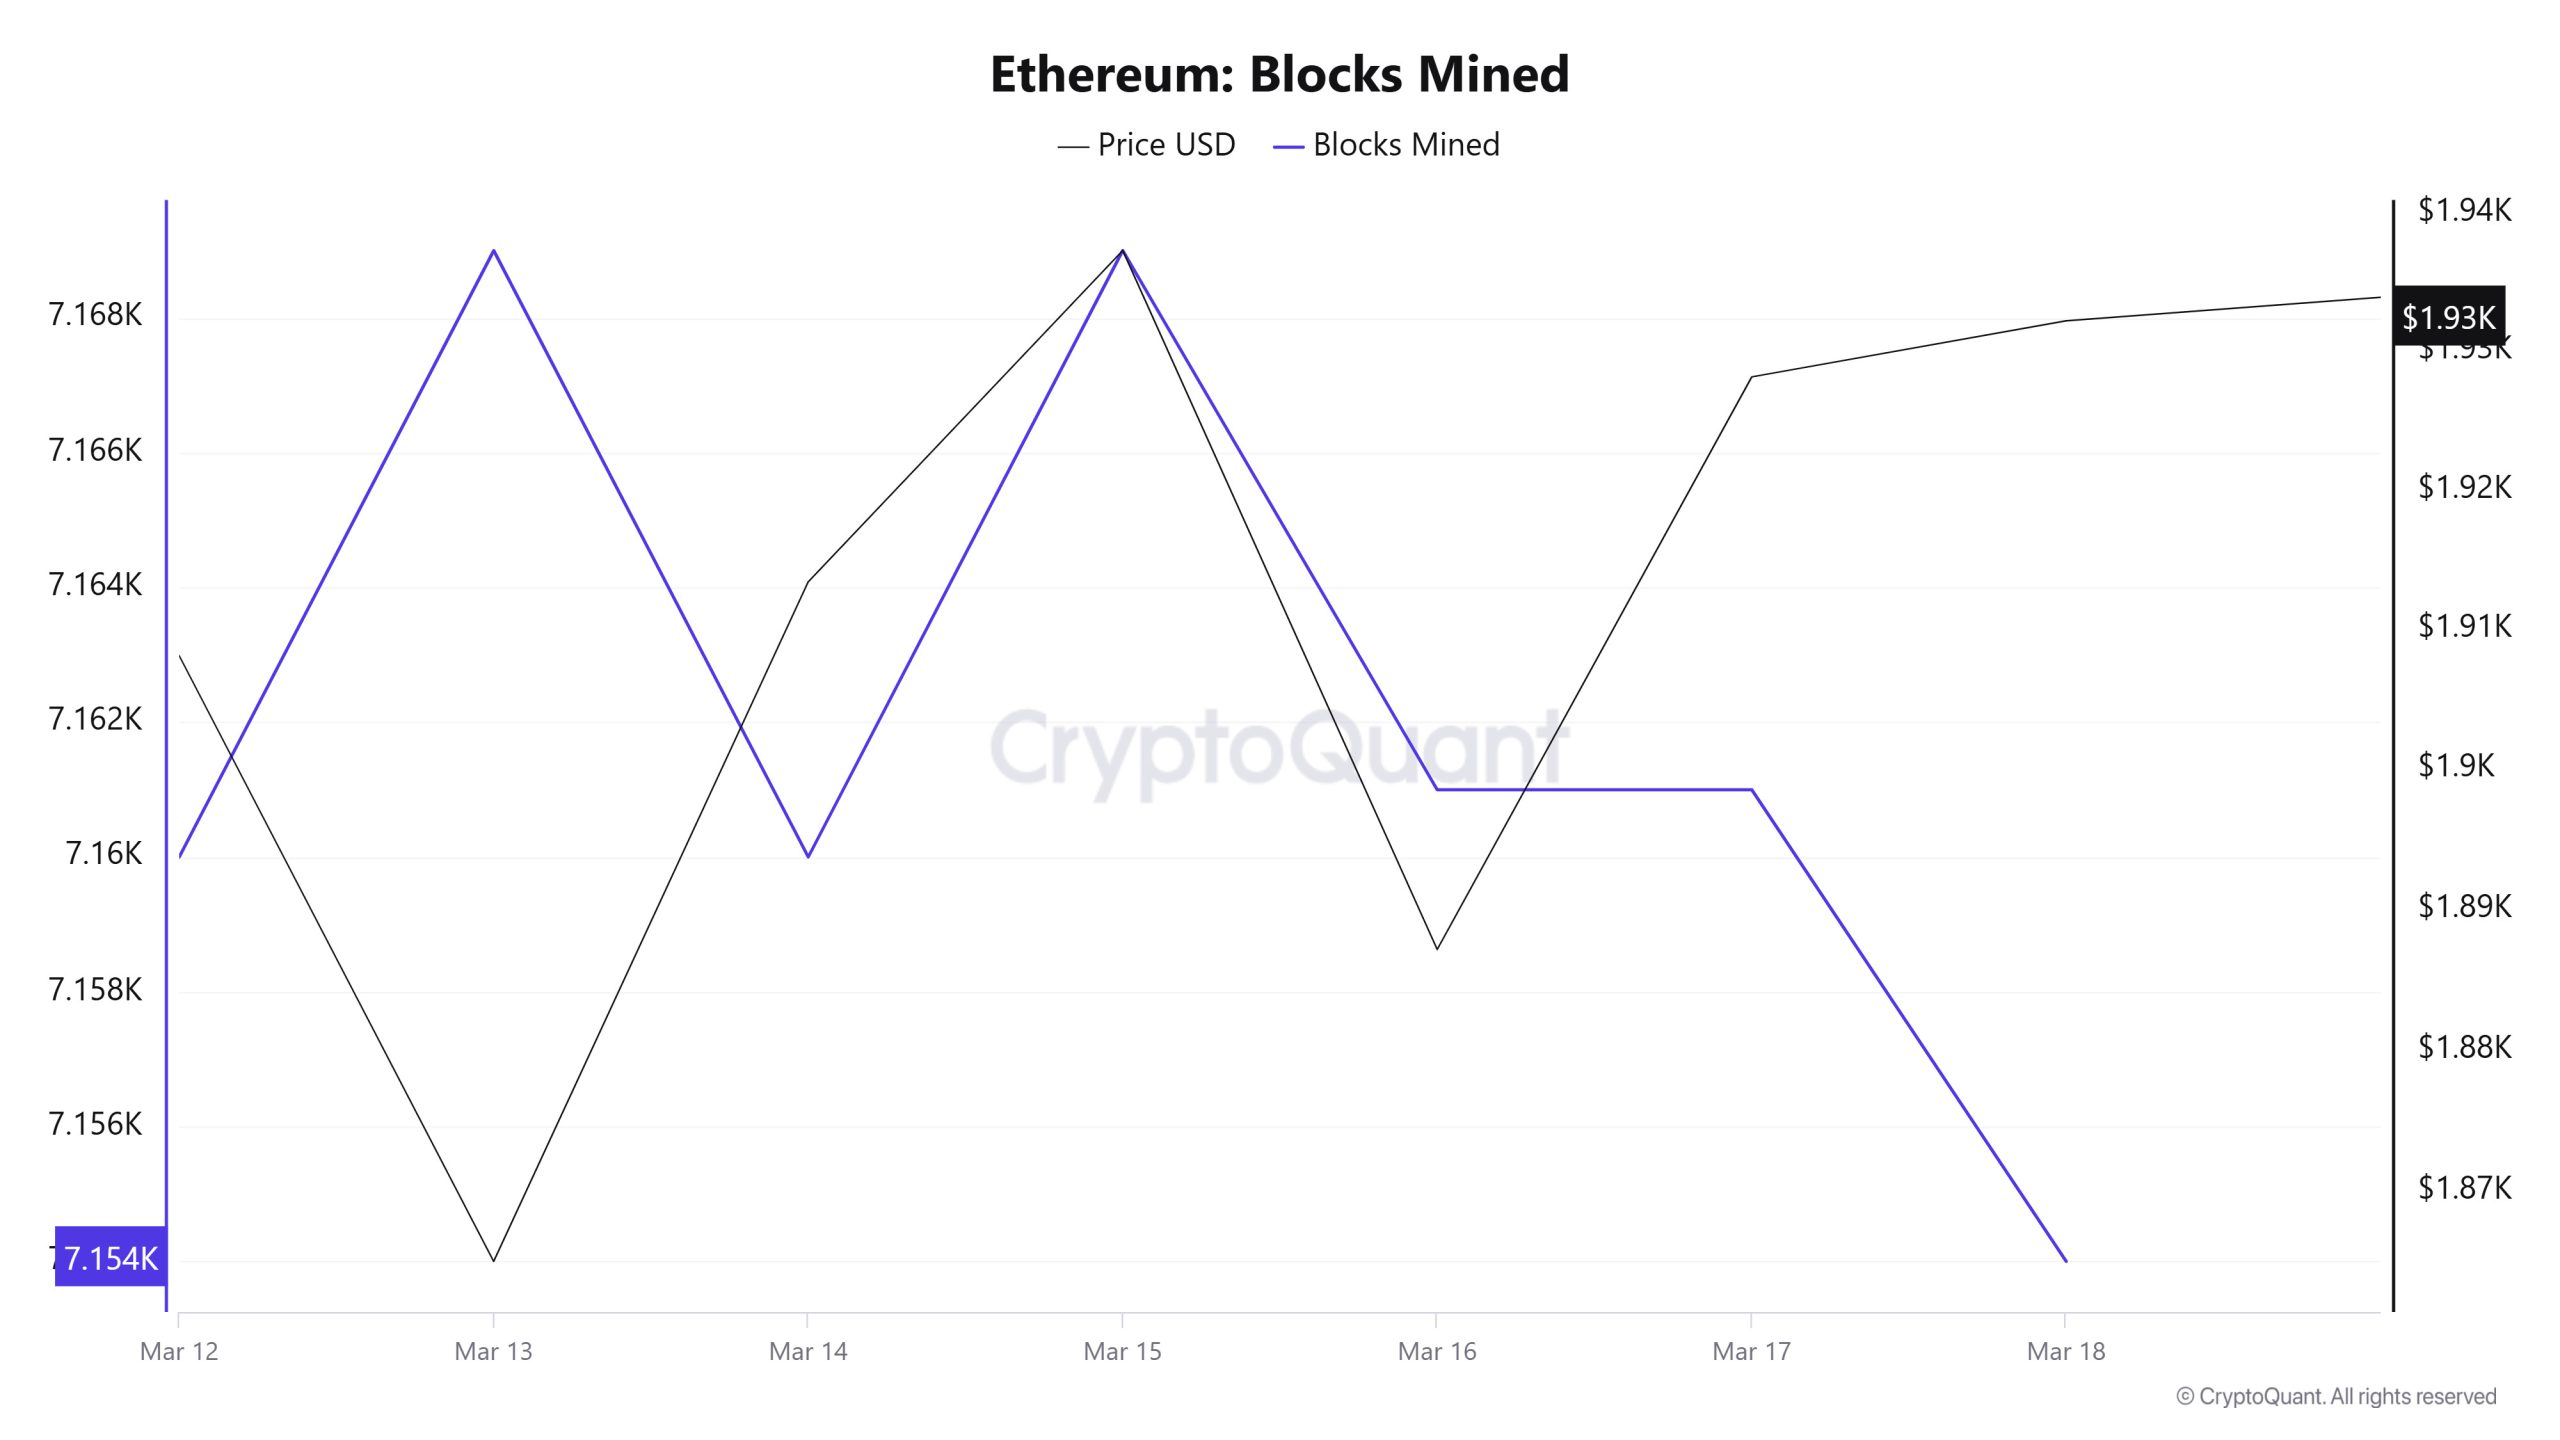
When we examine the Ethereum Blocks Mined table between March 12-18 , the number of blocks produced decreased towards the end of the week. While 7,160 blocks were produced on March 12, this number was 7,154 on March 18. There was a positive correlation between Blocks Mined and Ethereum price throughout the week.
Block
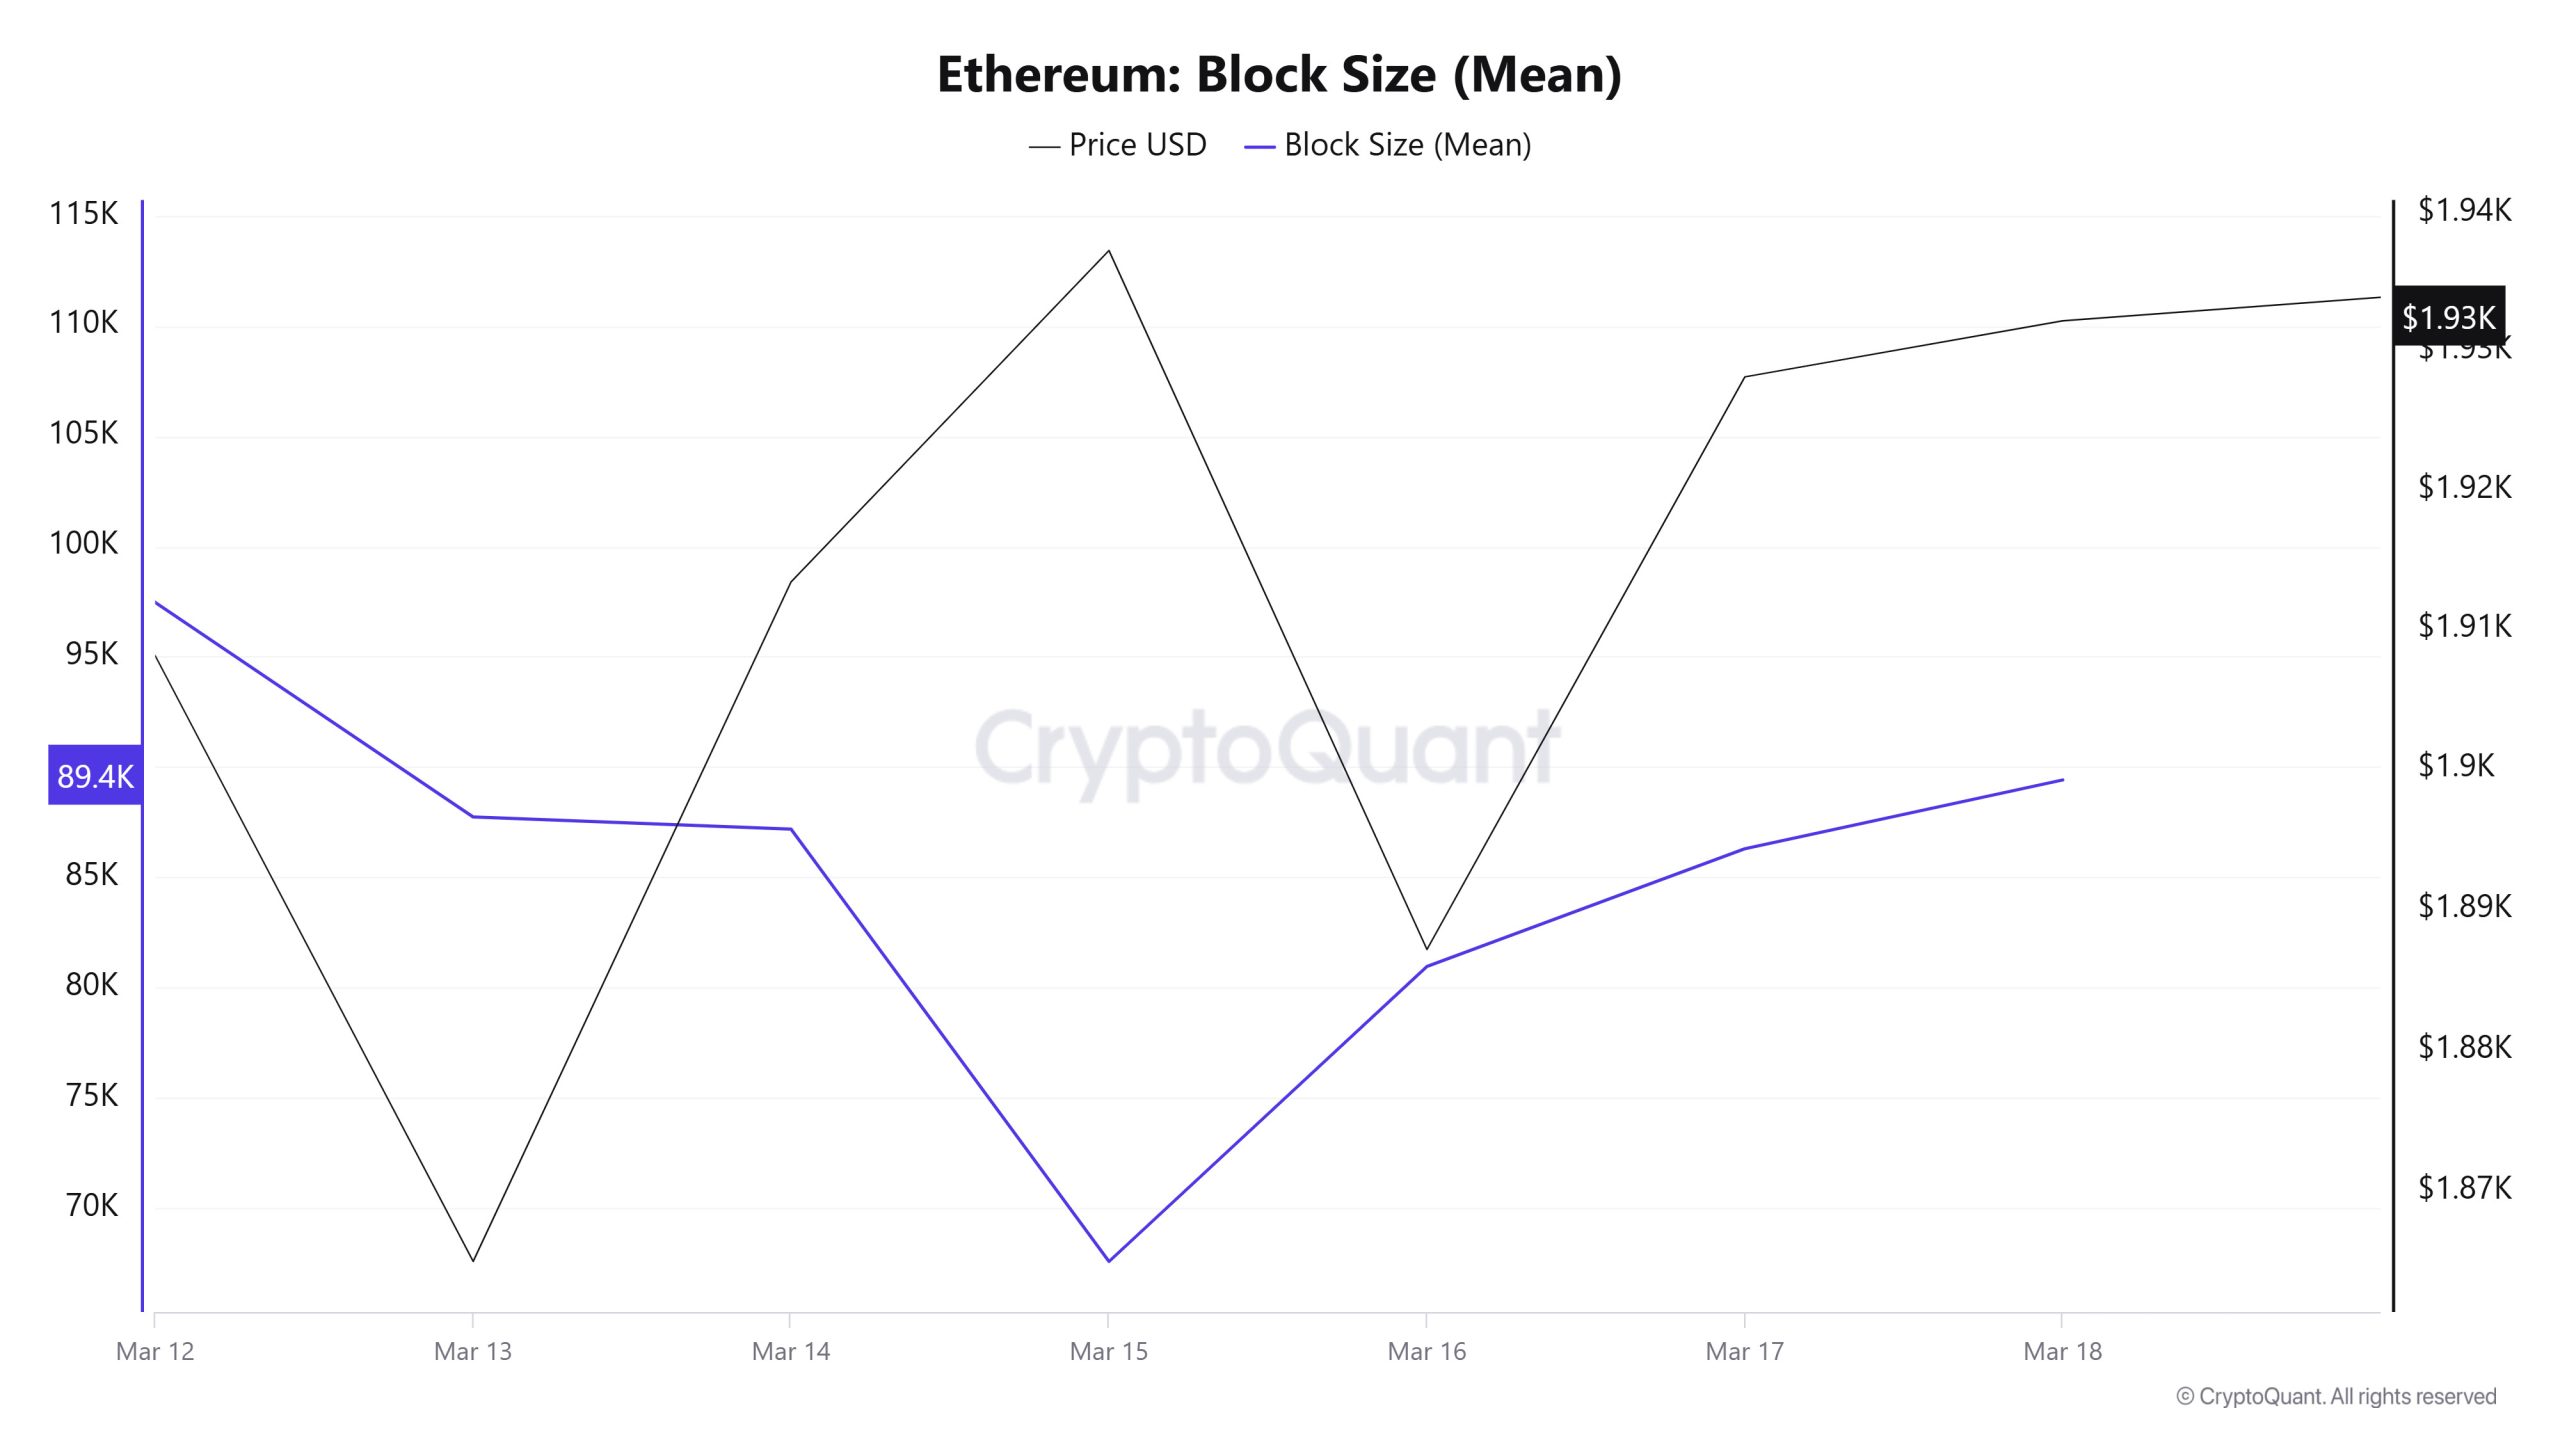
When we examine the Ethereum Block Size table between March 12-18, there was some increase in the middle of the week, but then it decreased towards the end of the week. The block size of 97,465 bytes on March 12 reached 89,415 bytes by March 18. Although there was a negative correlation between Block Size and Ethereum price at the beginning of the week, this correlation turned positive towards the end of the week.
Block Interval
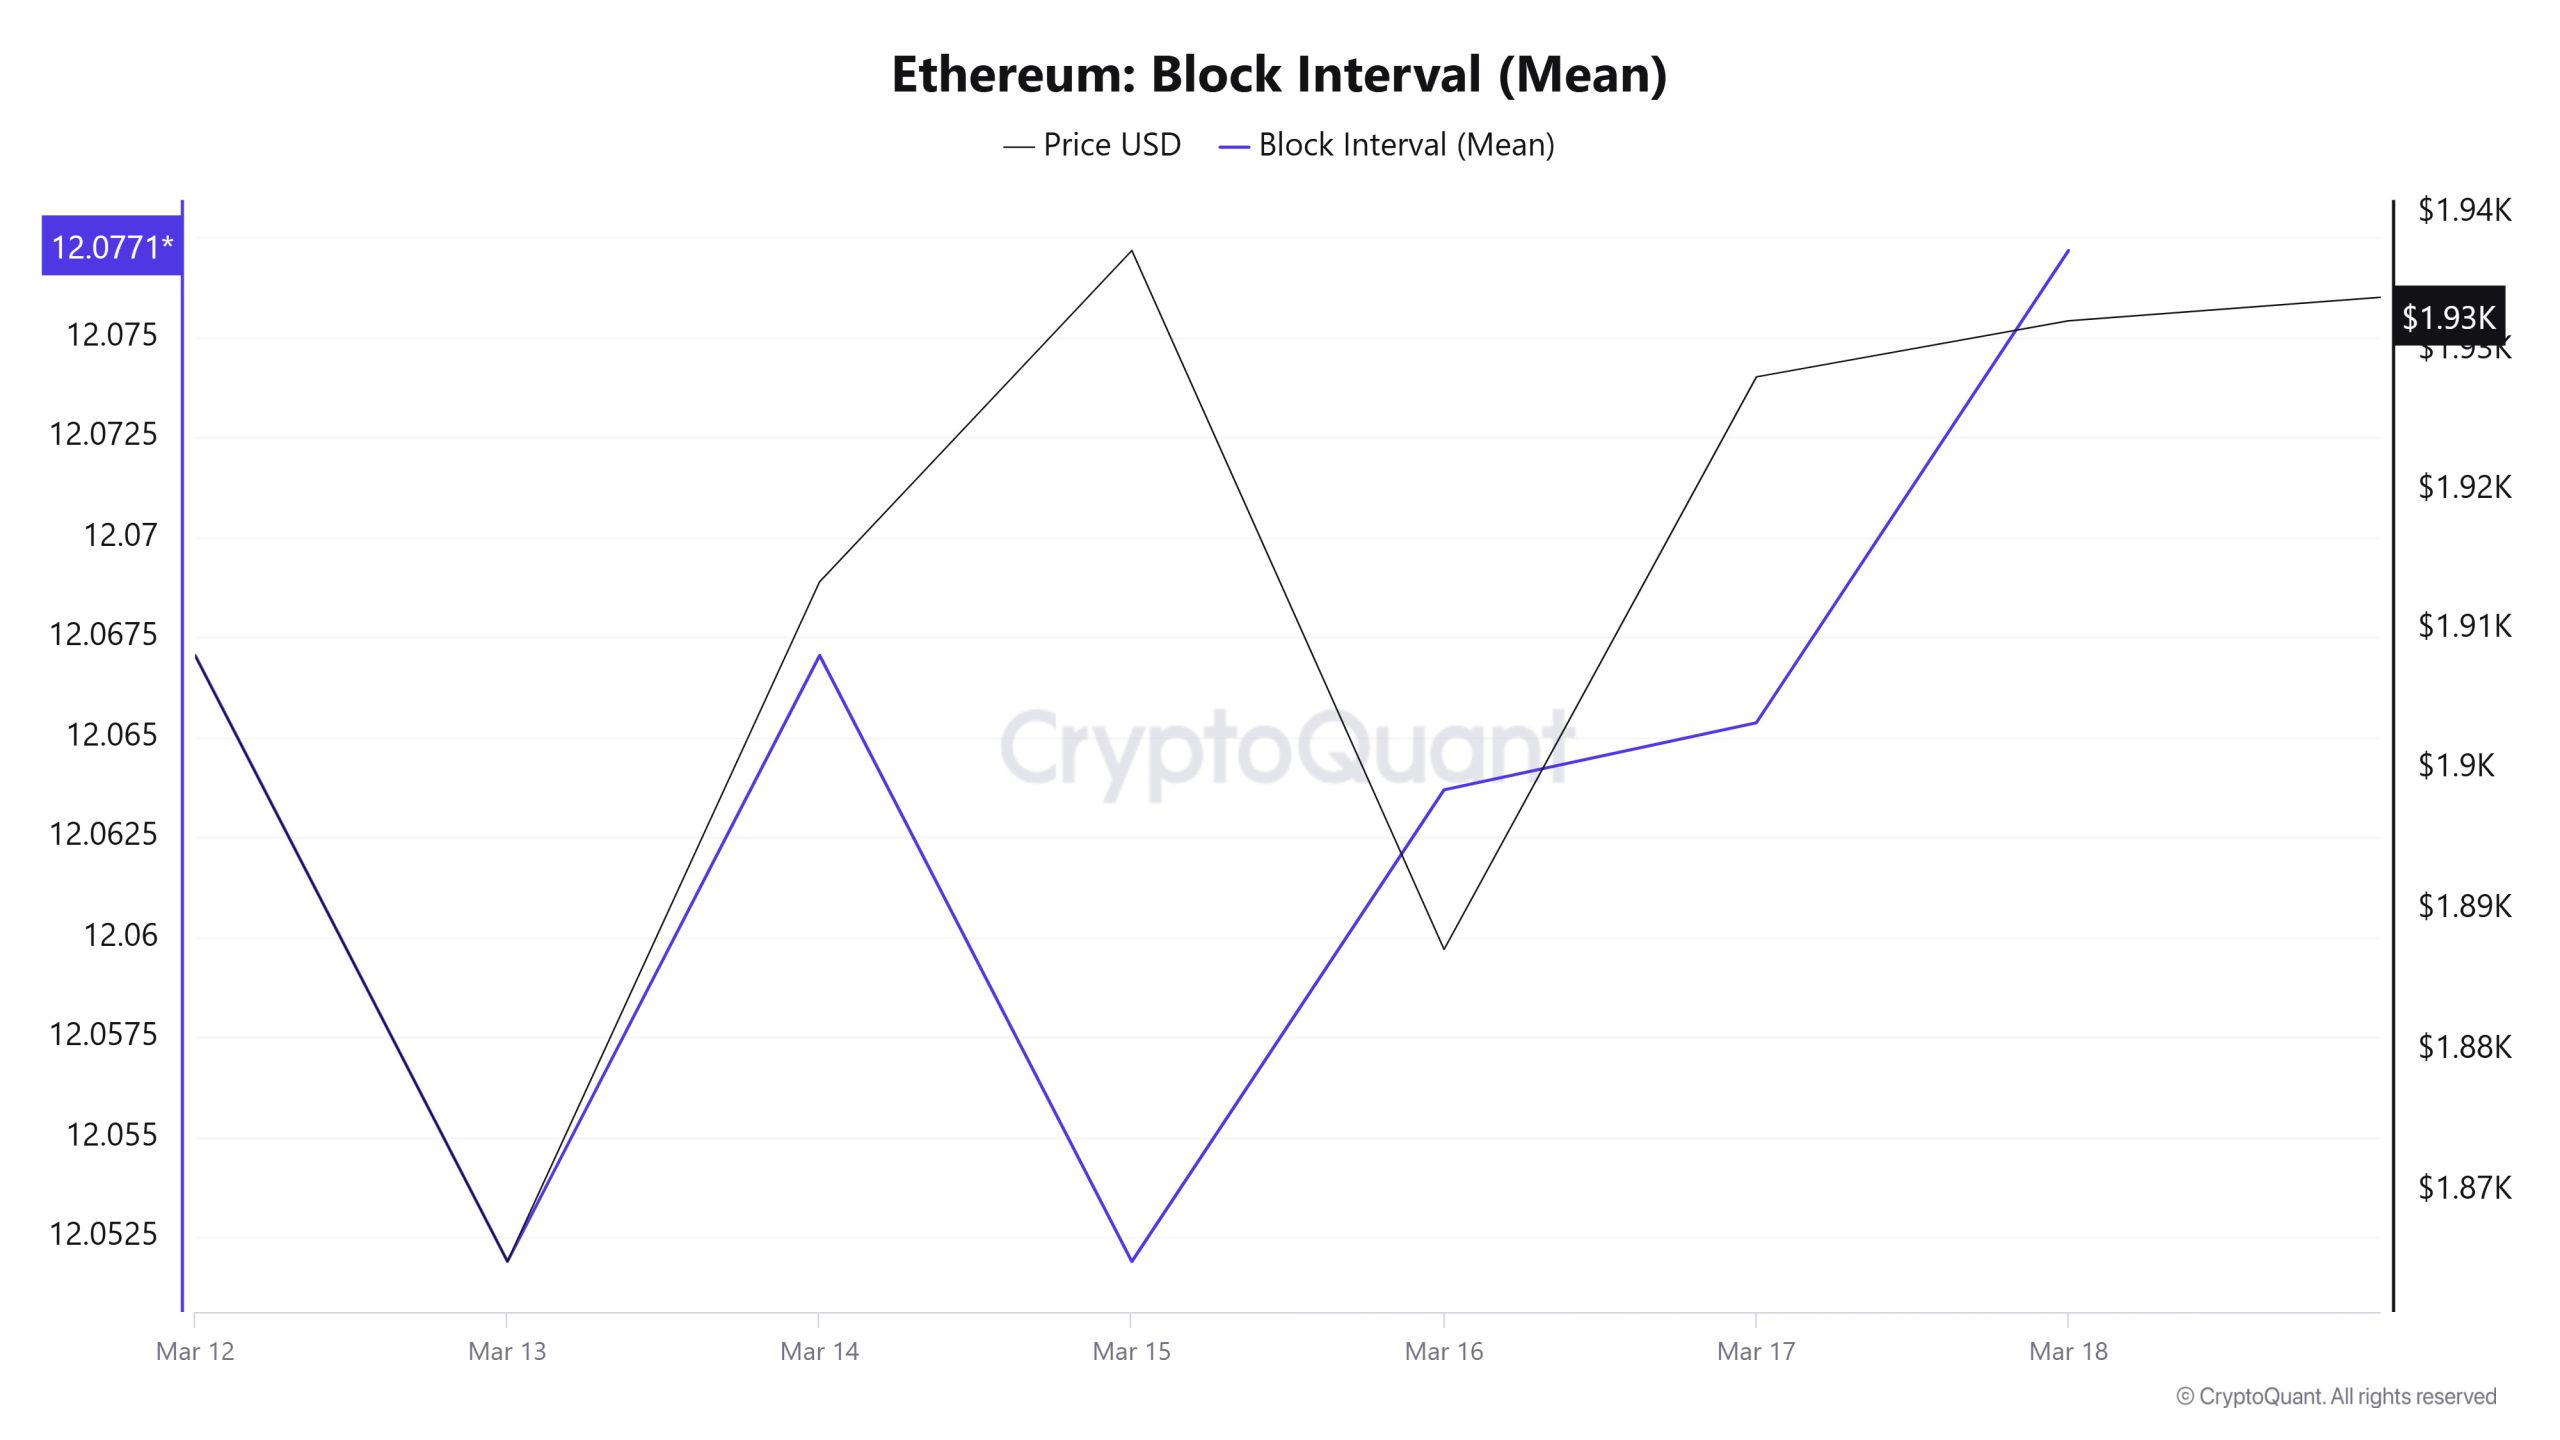
When we examine the Ethereum Block Interval table between March 12-18, although there was a decrease towards the middle of the week, there was a slight increase in the time between blocks towards the end of the week. On March 12, the time between blocks was 12.06 seconds, which remained the same at 12.07 seconds on March 18. Although there was a positive correlation between Block Interval and Ethereum price at the beginning of the week, the correlation turned negative afterwards.
Transaction
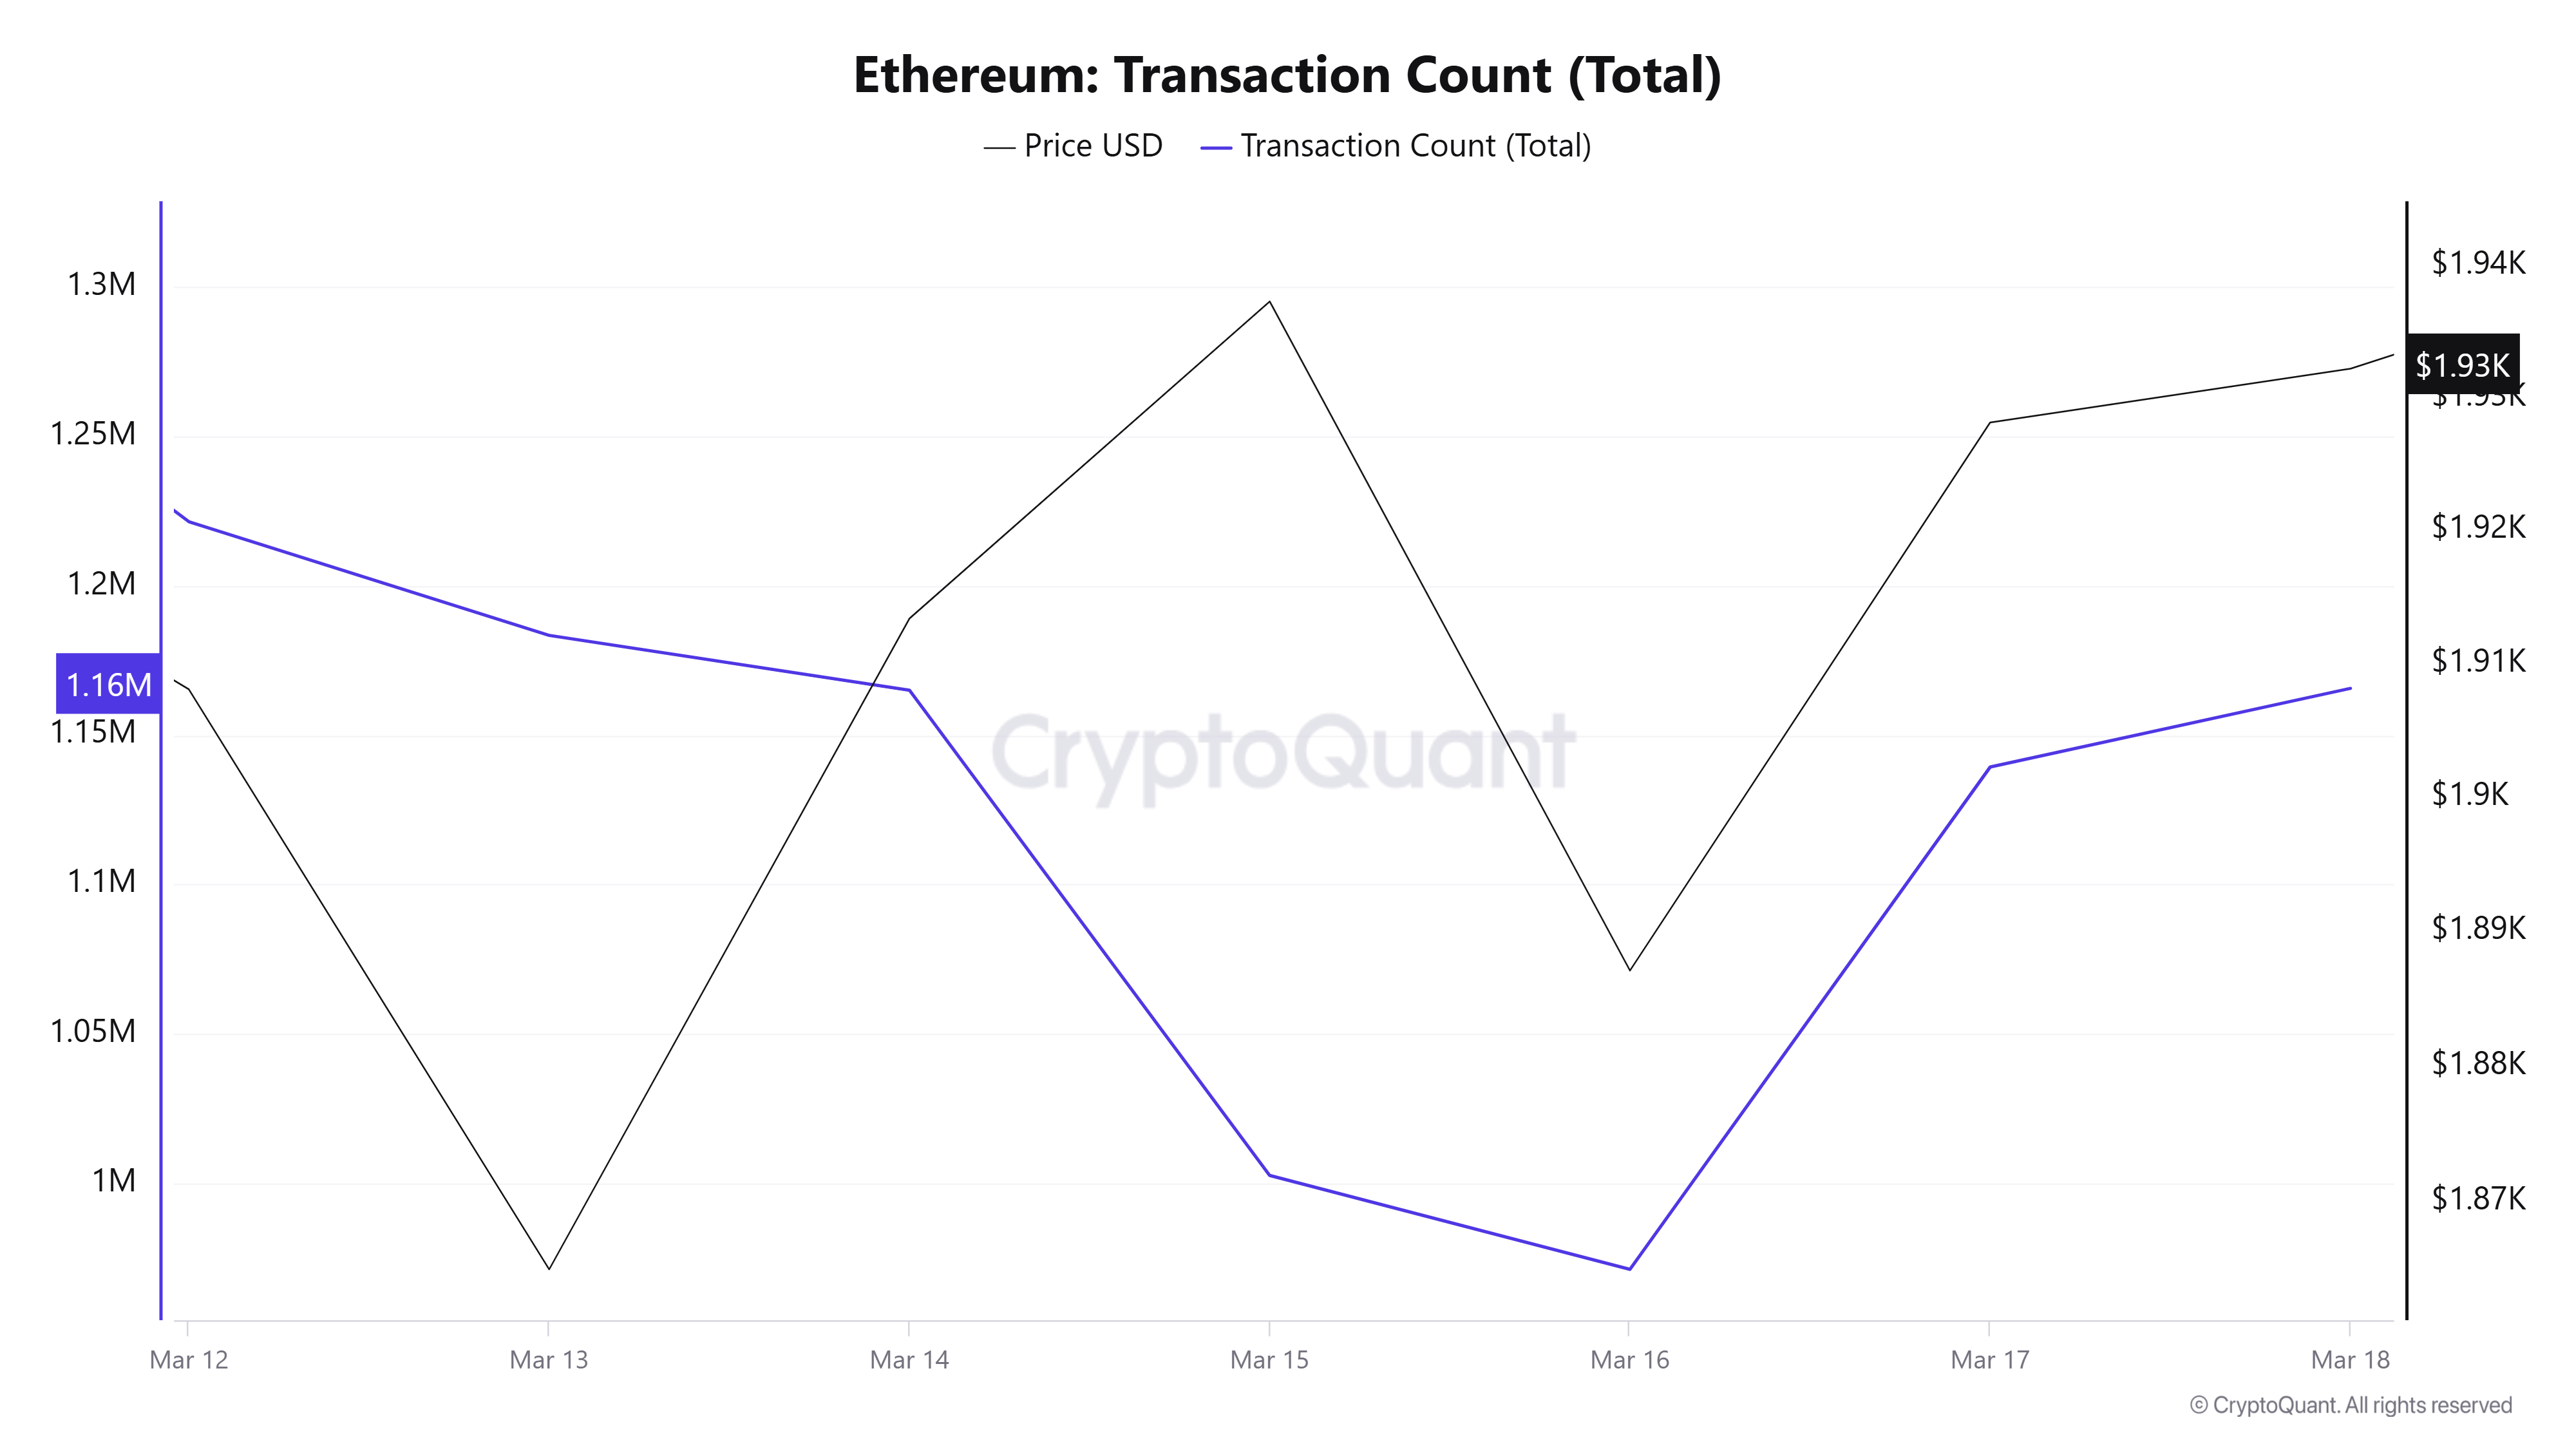
Last week there were 8,704,921 transactions, while this week’s number decreased by about 9.8% to 7,848,719. The highest number of transactions was 1,221,476 on March 12, while March 16 saw the lowest number of transactions on the network for the week with 971,166 transactions. Although the decrease in the number of transactions compared to the previous week seems to be negative in terms of network utilization, the increase in price and the positive correlation between the number of transfers and price throughout the week days should be interpreted positively. Since the intense selling pressure in the past weeks increased the number of transactions, it can be interpreted that the selling pressure has decreased to a level that can be observed on transactions this week.
Tokens Transferred
While the amount of Ethereum transferred last week was 13,590,564, 10,899,869 Ethereum was transferred this week, a decrease of 19.77%. On March 15, 744,944 Ethereum transfers were recorded as the lowest transfer amount of the week, while on March 12, 2,296,355 Ethereum transfers were recorded as the highest transfer amount of the week.
The decline in the number of transactions, as well as the significant drop in the amount of Ethereum transferred, may indicate that institutional selling pressure is fading and the share of individual users on the network is starting to increase. The decline in institutional investor sales may indicate the end of major selling pressures. This strengthens the likelihood that small investors may continue to maintain their activity on the network in a sideways manner for a while.
Estimated Leverage Ratio
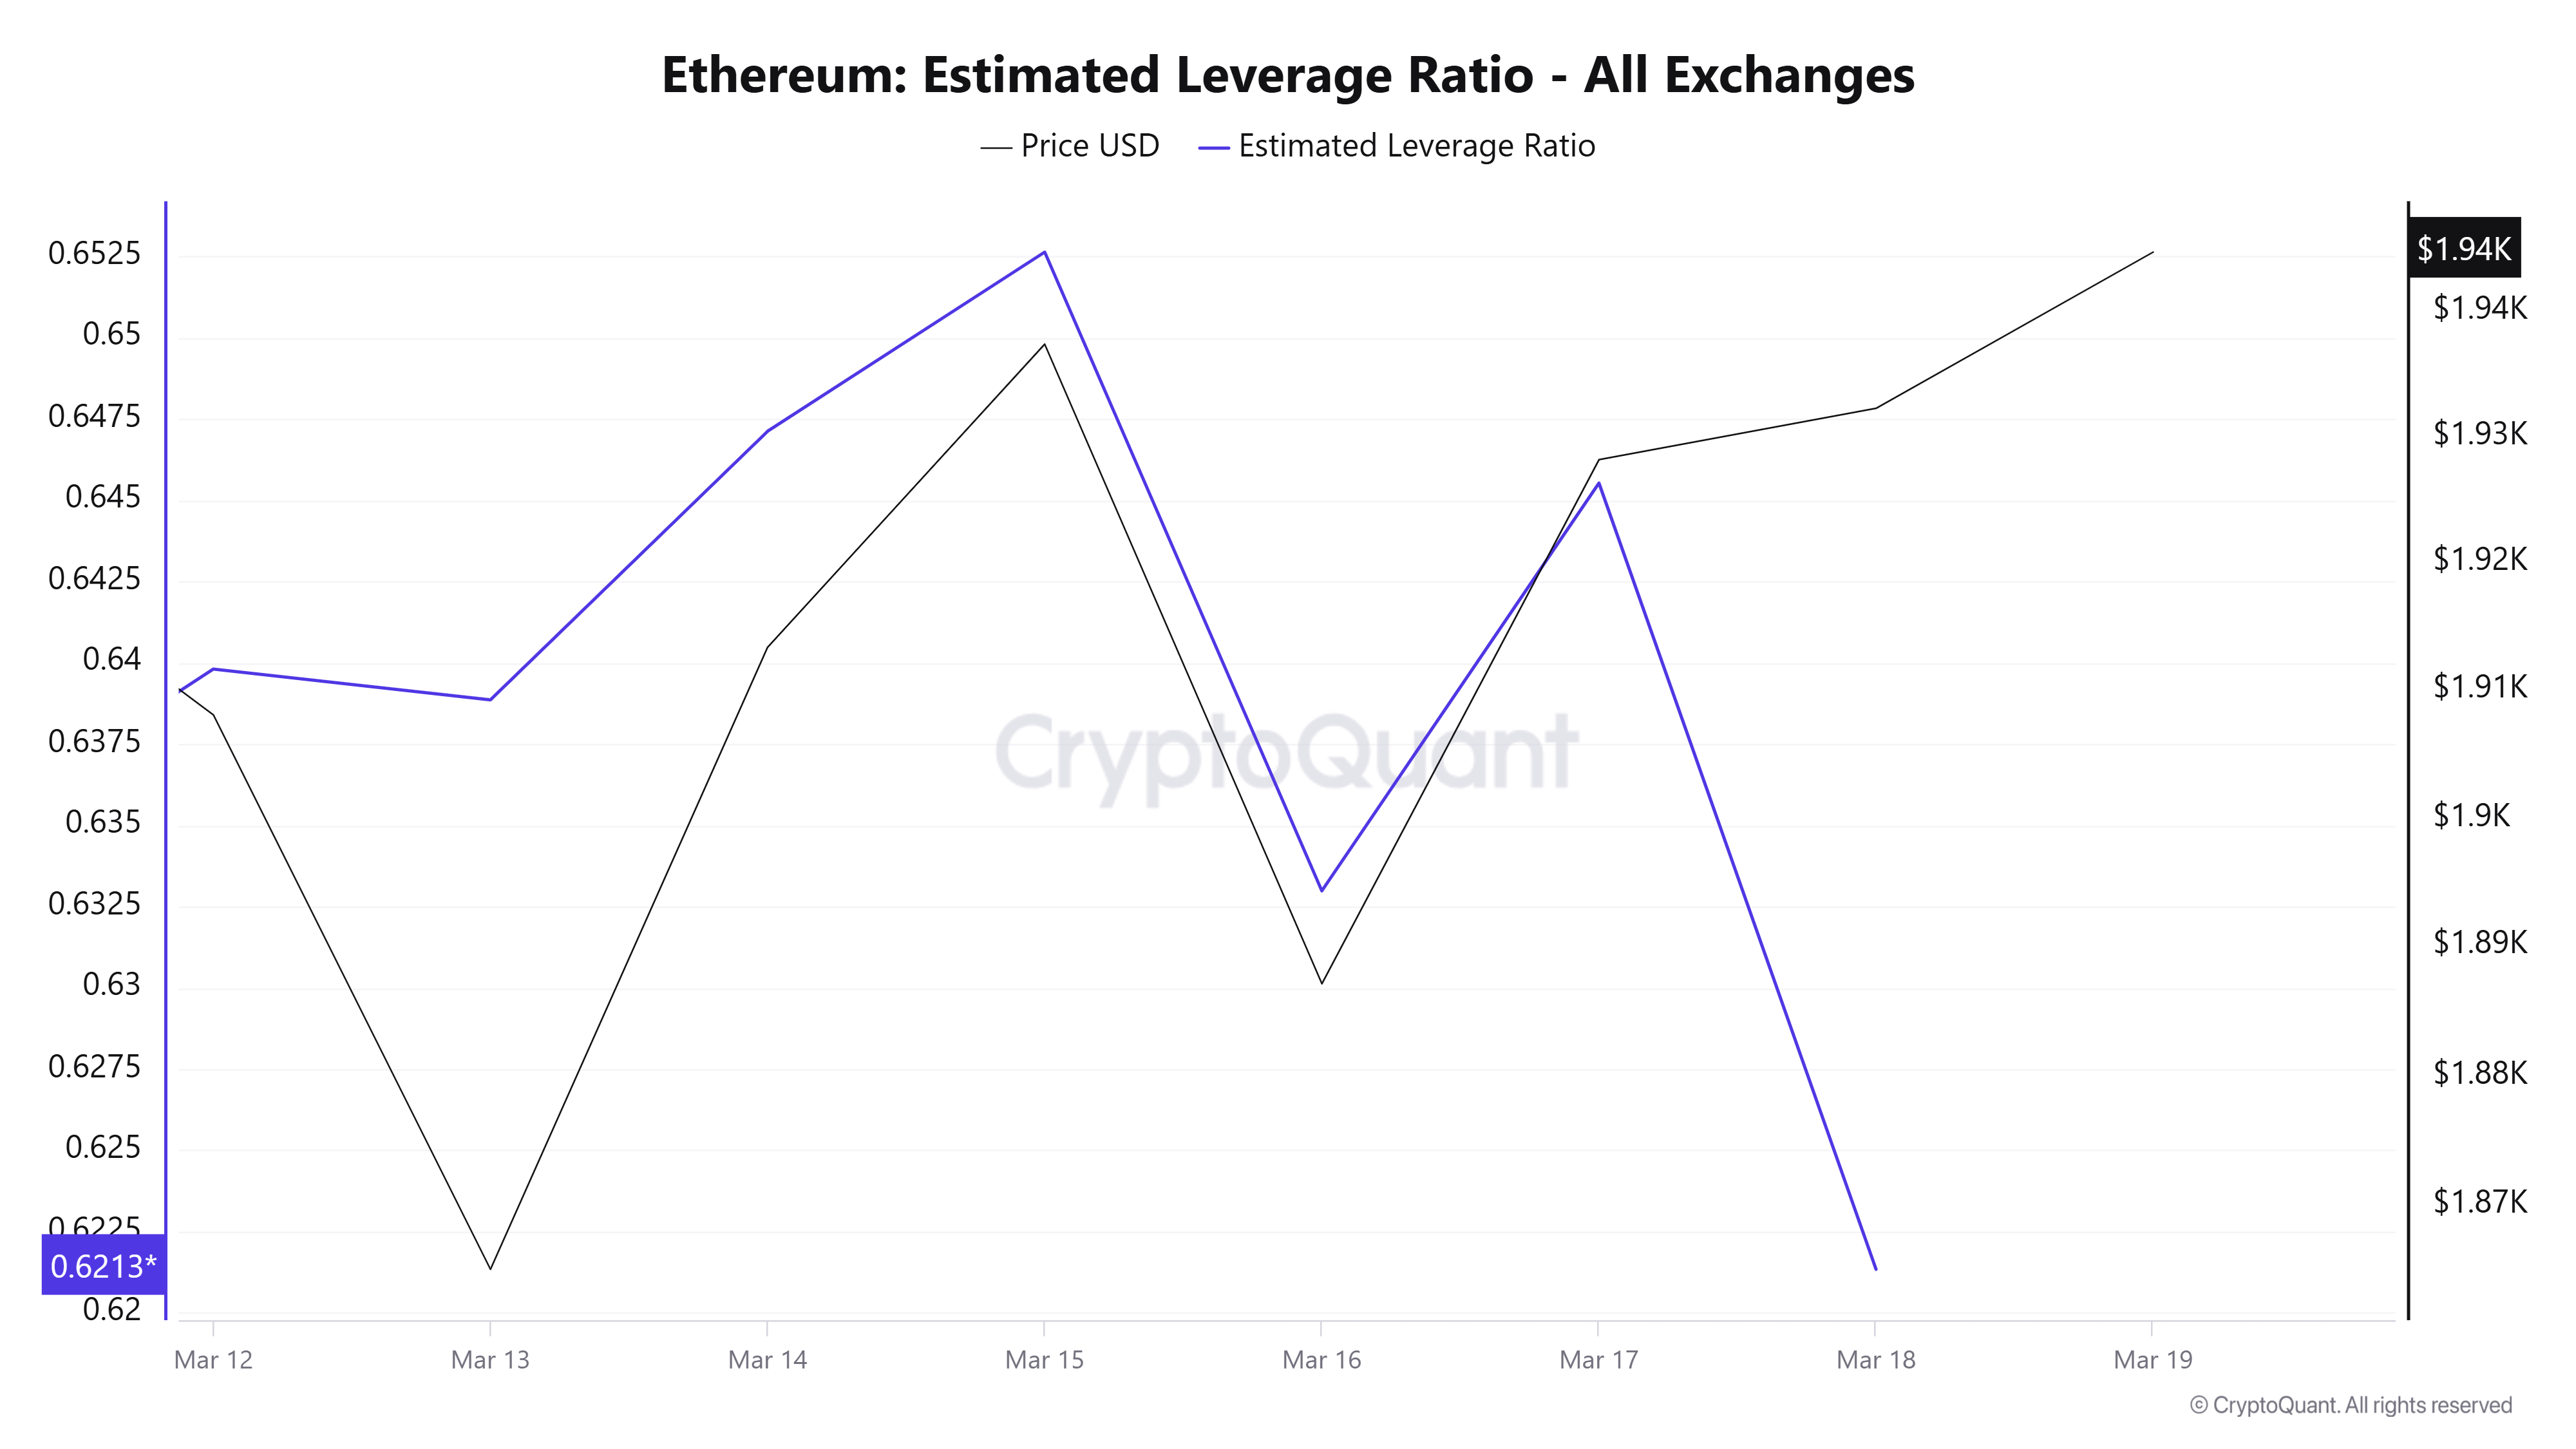
At the beginning of the 7-day period, the metric remained flat and then rose. Towards the end, it has entered a downward trend. ELR (Estimated Leverage Ratio), which had a value of 0.639 at the beginning of the process, rose in the middle of the process and reached 0.652, but retreated in the last period of the process and is currently at 0.621. A higher ELR means that participants are willing to take on more risk and generally indicates bullish conditions or expectations. It should be noted that these rises can also be caused by a decrease in reserves. When we look at Ethereum reserves, while there were 18.81 million reserves at the beginning of the process, this figure continued to increase towards the end of the process and rose to 18.92 million. Today, the amount of reserves, which has decreased slightly, is approximately 18.91 million. At the same time, Ethereum’s Open Interest moved horizontally. With all this data, we can say that the decline in the chart towards the end of the process is due to the increase in reserves. The price of the asset moved in parallel with this in the band of 1,851 and 1,940 dollars. The increase in the amount of reserves and the flat course of the open interest rate explain the decline in the ELR ratio. As a result, the increase in reserves and the flat open interest rate suggest that some of the decline in the ELR metric was artificial
LEGAL NOTICE
The investment information, comments and recommendations contained in this document do not constitute investment advisory services. Investment advisory services are provided by authorized institutions on a personal basis, taking into account the risk and return preferences of individuals. The comments and recommendations contained in this document are of a general type. These recommendations may not be suitable for your financial situation and risk and return preferences. Therefore, making an investment decision based solely on the information contained in this document may not result in results that are in line with your expectations.
NOTE: All data used in Bitcoin onchain analysis is based on Cryptoqaunt.
