
Technical Analysis
BTC/USDT
Bank of Japan Governor Kazuo Ueda’s dovish comments on monetary policy shaped expectations regarding the pace of interest rate hikes, while the University of Michigan’s consumer confidence and inflation expectations survey provided signals about the outlook for households in the US. Meanwhile, as Fed officials continue to disagree on the timing of rate cuts, the Fed chair nomination process is also being closely watched by the market. On the crypto front, M. Saylor published a BTC tracker showing that purchases are continuing.
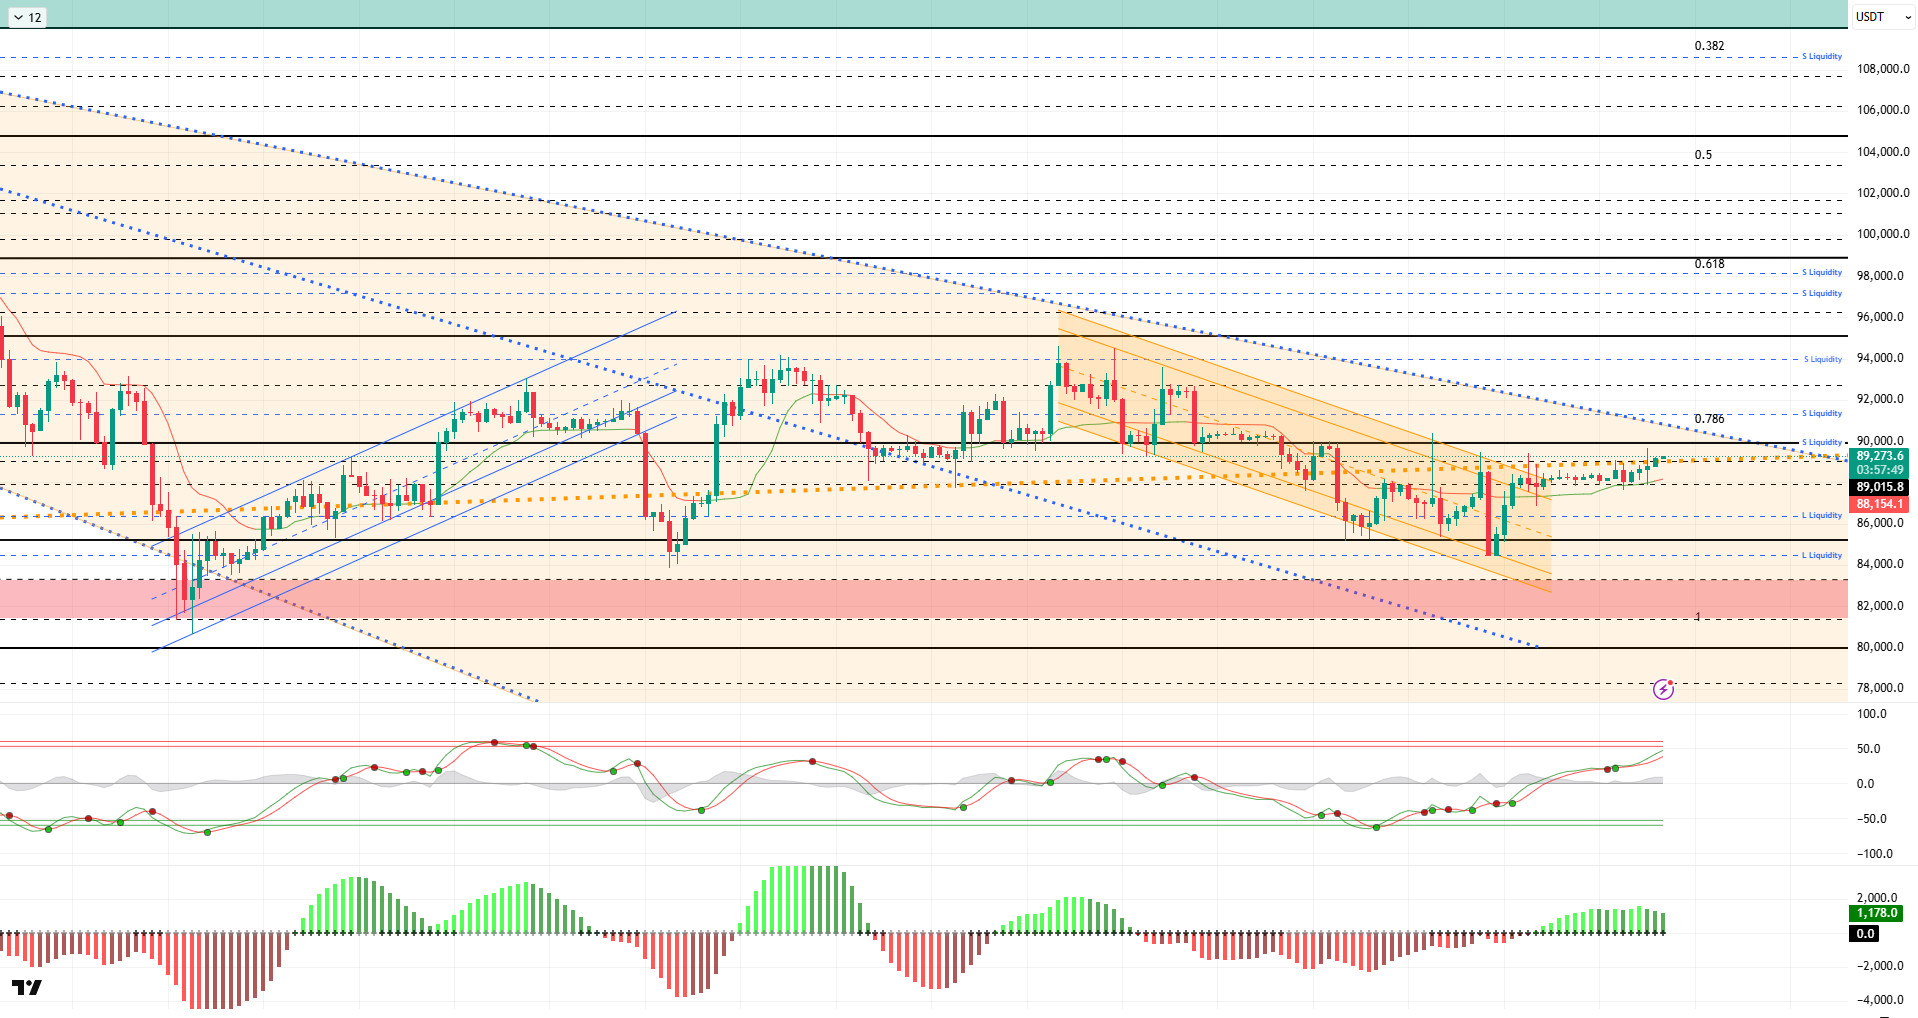
From a technical perspective, BTC broke out of the descending trend channel it had formed within the major descending orange band and moved into a horizontal band range. Over the weekend, the price was squeezed into a narrow band with low volume and volatility. BTC, which tested the major ascending trend channel, occasionally spiked above it but has not yet achieved a clear breakout. The horizontal price structure has shifted the narrowing band trend line to the 89,000 level. In this context, this level stands out as a critical point in the short term, and closing above the reference level of 90,000 will be decisive.
Technical indicators show that the Wave Trend (WT) oscillator continues to maintain its buy signal, despite reaching the oversold zone with its erroneous and volatile signals indicating an indecisive structure. The histogram on the Squeeze Momentum (SM) indicator provides a clearer picture, forming a decisive image of the price moving upwards with the transition to positive territory. The Kaufman moving average (KAMA) is currently trading below the price at $88,036.
Looking at liquidation data, fragmented buy orders formed at the 84,000 and then 86,000 levels following the recent rise in BTC. In contrast, sell orders maintained their intensity at the 90,000 level, while accumulation continued intensely above the 91,000 level over a broader time frame.
In summary, after the BoJ interest rate hike, Governor Ueda’s dovish comments eased some pressure on the markets. While US macro data created a favorable environment for interest rate cuts, the differences of opinion within the Fed were not reflected in CME Watch. The race for the Fed chairmanship has intensified. Amid all these developments, Strategy continues to buy BTC. Technically, BTC has moved from a minor downtrend channel into a horizontal band, beginning to challenge the major uptrend. Liquidity data shows that areas with concentrated short-term trading are being targeted, while long-term sell orders have yet to be tested.After this stage, the 89,000 level has become a critical point for the price to maintain its momentum as it passes through the major uptrend. Closings and pricing above this level are an important indicator for regaining momentum. In this context, 90,000 stands out as the next target area, and if it is passed, liquidity areas will be monitored again. In the event of potential selling pressure, the 88,000 level will be monitored as a support area.
Supports: 88,000 – 86,300 – 85,000
Resistances: 89,000 – 90,000 – 91,400
ETH/USDT
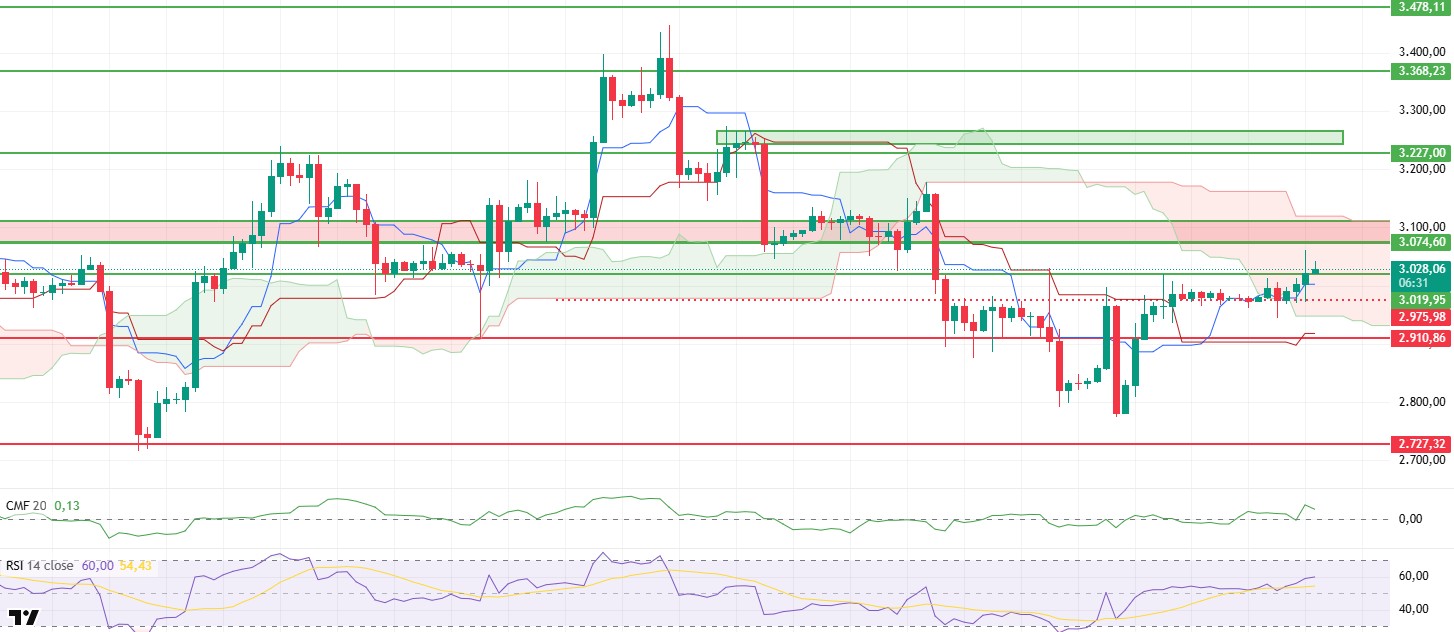
After trading in a narrow range over the weekend, the ETH price managed to break above the $3,020 resistance following the weekly close. Staying above this level indicates that the pressure seen in recent days is gradually easing and buyers are becoming more willing to push the price higher. While the calm structure persists during the day, the price holding above this band creates a positive ground for the evening hours.
The liquidity outlook continues to be supportive. The Chaikin Money Flow (CMF) indicator remaining in positive territory shows that capital is continuing to enter the market and that the uptrend is not limited to price movement alone. Continued liquidity flow may help limit any potential pullbacks.
The momentum front is also strengthening. The Relative Strength Index (RSI) continues its upward movement above the 50 level without producing any negative divergence, indicating that buyer momentum is maintained. This trend in the RSI signals that the upward price range has not yet closed.
Looking at the Ichimoku indicator, a more balanced picture emerges. The price entering the kumo cloud and the Tenkan level remaining above the Kijun level indicate an increased potential for the trend to change direction in the short to medium term. This technical structure is an important signal that upward movements may continue.
The $3,020 level continues to be the main reference point in the current outlook. If it manages to stay above this level, an upward movement area towards the region marked with a red rectangle on the chart may form. Conversely, if the $3,020 level is lost again, short-term and limited pullbacks are likely. When liquidity, momentum, and technical structure are evaluated together in the overall picture, an evening view emerges where the upward trend on the ETH side is being attempted to be maintained.
Below the Form
Supports: 3,019 – 2,910 – 2,727
Resistances: 3,074 – 3,227 – 3,368
XRP/USDT
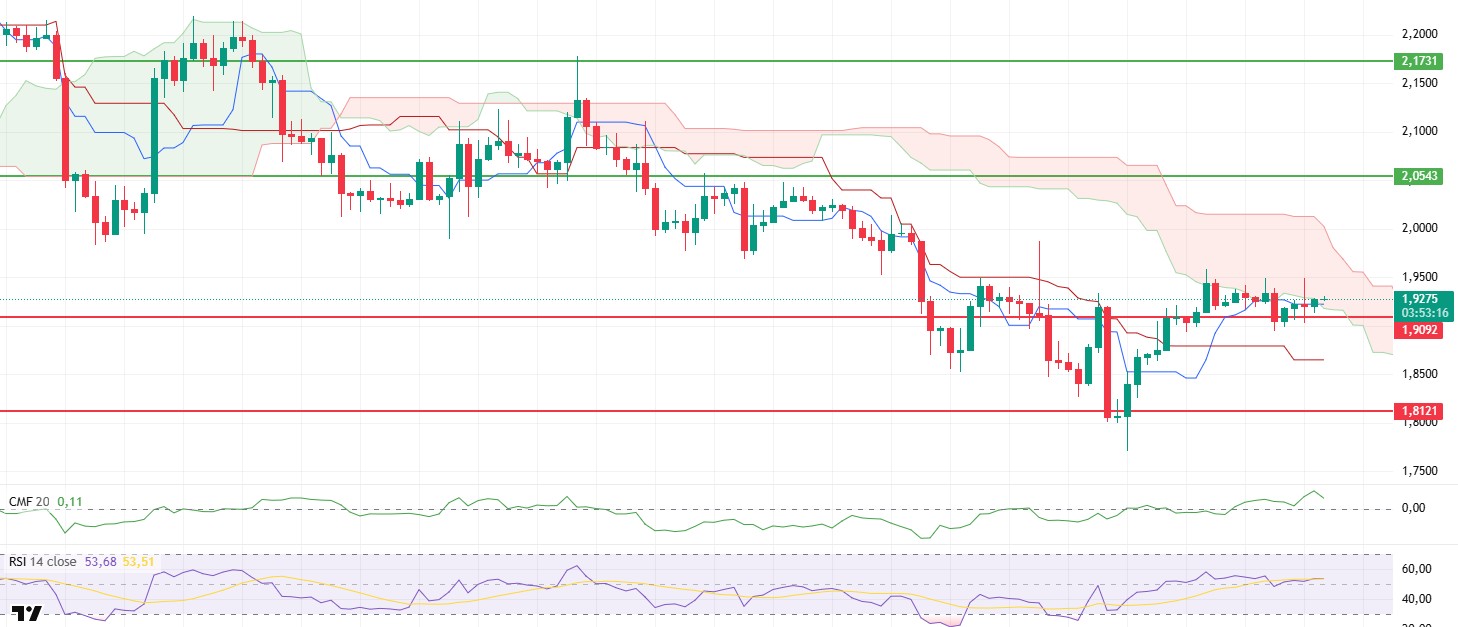
After breaking above the $1.90 level on Friday, the XRP price managed to stay above this region throughout the weekend. With selling pressure remaining weak, the price was protected on the upside and carried up to the $1.93 level. Entering the week at these levels indicates that buyers have clearly taken ownership of the $1.90 region and that the price is struggling to be pushed lower.
The liquidity outlook remains positive as of the morning hours. The Chaikin Money Flow (CMF) indicator continues its positive trajectory, signaling that capital entering the market is not being withdrawn. Maintaining liquidity support plays a key role in keeping the price stable above $1.90.
Strengthening is also noticeable on the momentum front. The Relative Strength Index (RSI) has settled above the 50 level and maintains its upward trend. This structure in the RSI indicates that buyers are not relinquishing control and that the desire for growth continues. There is currently no signal indicating a weakening on the momentum side.
From a technical perspective, the Ichimoku indicator is in a more constructive position compared to previous days. The price entering the kumo cloud and the Tenkan level remaining above the Kijun level indicate that a short- and medium-term trend reversal is on the agenda. This technical positioning signals that upward movements could progress more healthily.
In summary, the $1.90 level continues to be the main reference point. As long as the price remains above this level, the upward trend is likely to continue, and the price may test higher levels. Conversely, if the price falls back below $1.90, short-term pullbacks may occur. At this stage, when liquidity, momentum, and technical structure are evaluated together, a positive outlook for XRP is maintained.
Supports: 1.9092 – 1.8121 – 1.6224
Resistances: 2.0543 – 2.1731 – 2.2729
SOL/USDT
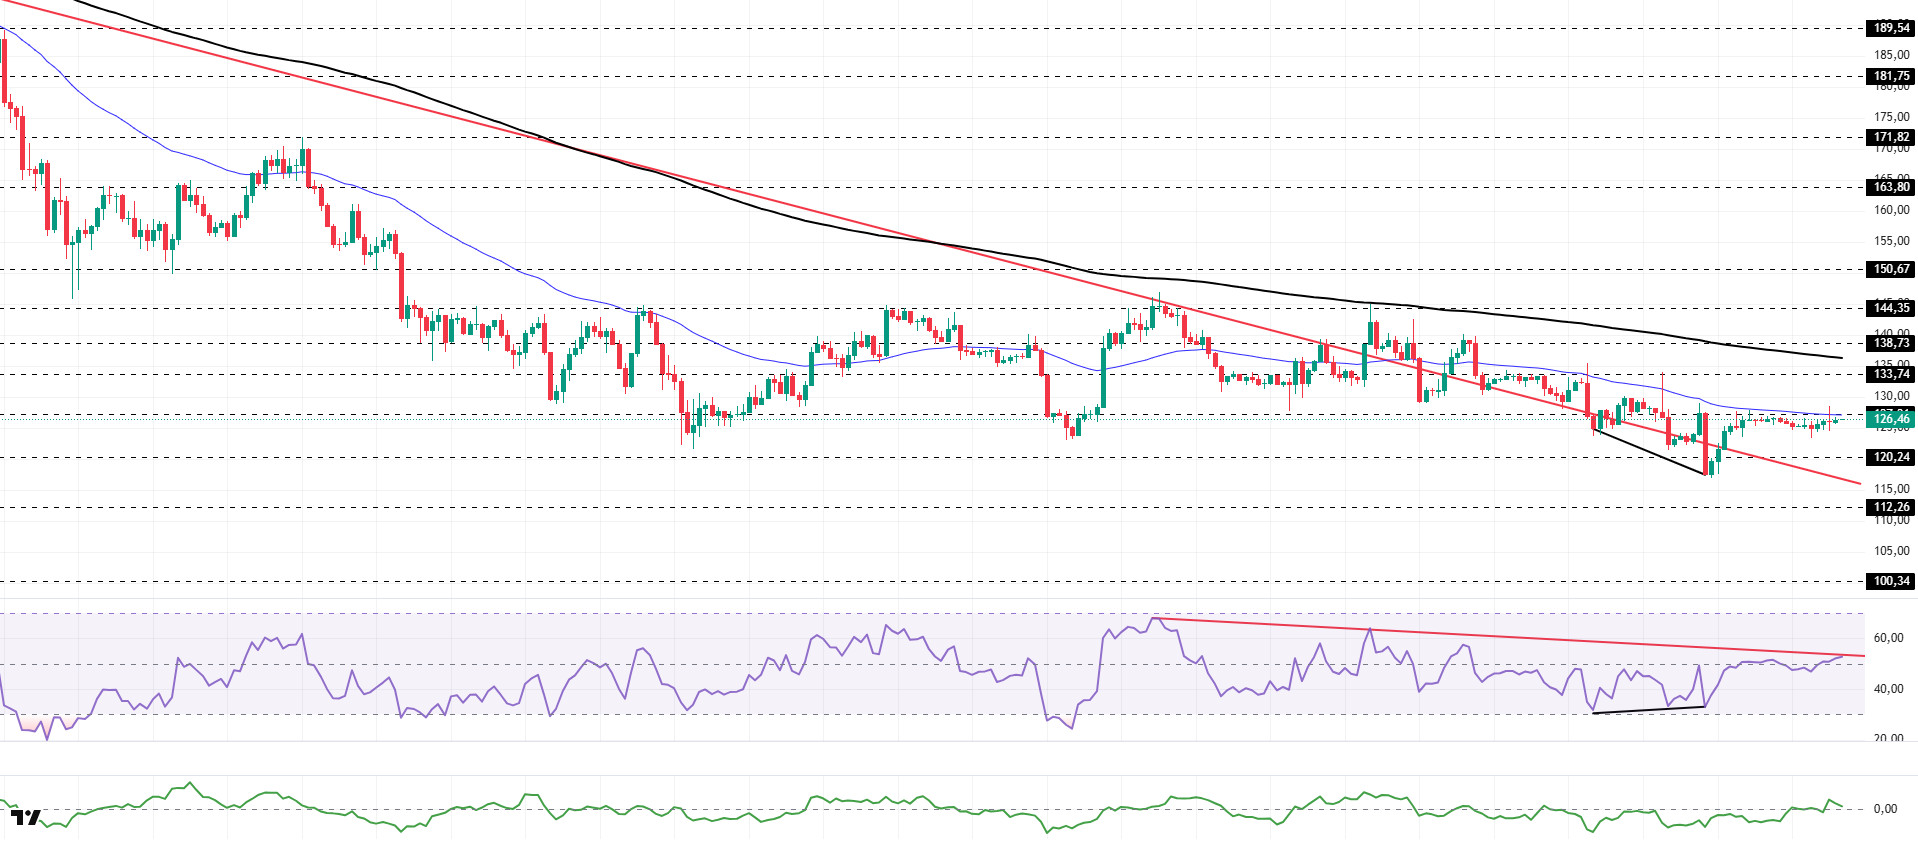
SOL price showed an upward trend. The asset continued to remain in the upper region of the downward trend that began on October 6. Currently testing the strong resistance level of $127.21 and the 50 EMA (Blue Line) moving average, the price may test the 200 EMA (Black Line) moving average as resistance in candle closes above this level. In case of a pullback, the $120.24 level can be monitored.
On the 4-hour chart, it continued to remain below the 50 EMA (Exponential Moving Average – Blue Line) and 200 EMA (Black Line). This indicates that it may be in a downtrend in the medium term. At the same time, the price being below both moving averages indicates that the asset is trending downward in the short term. The Chaikin Money Flow (CMF-20) has crossed into positive territory. However, a slight increase in money inflows may keep the CMF in positive territory. The Relative Strength Index (RSI-14) has risen from the middle of negative territory to positive territory. At the same time, it is currently testing the resistance level of the downward trend that began on December 3. If it breaks through this level, buying pressure may increase. However, positive divergence could push the price even higher. If there is an uptrend due to macroeconomic data or positive news related to the Solana ecosystem, the $138.73 level stands out as a strong resistance point. If this level is broken upwards, the rise is expected to continue. If there are pullbacks due to developments in the opposite direction or profit-taking, the $120.24 level may be tested. If there is a decline to these support levels, an increase in buying momentum may present a potential upside opportunity.
Supports: 120.24 – 112.26 – 100.34
Resistances: 127.21 – 133.74 – 138.73
DOGE/USDT
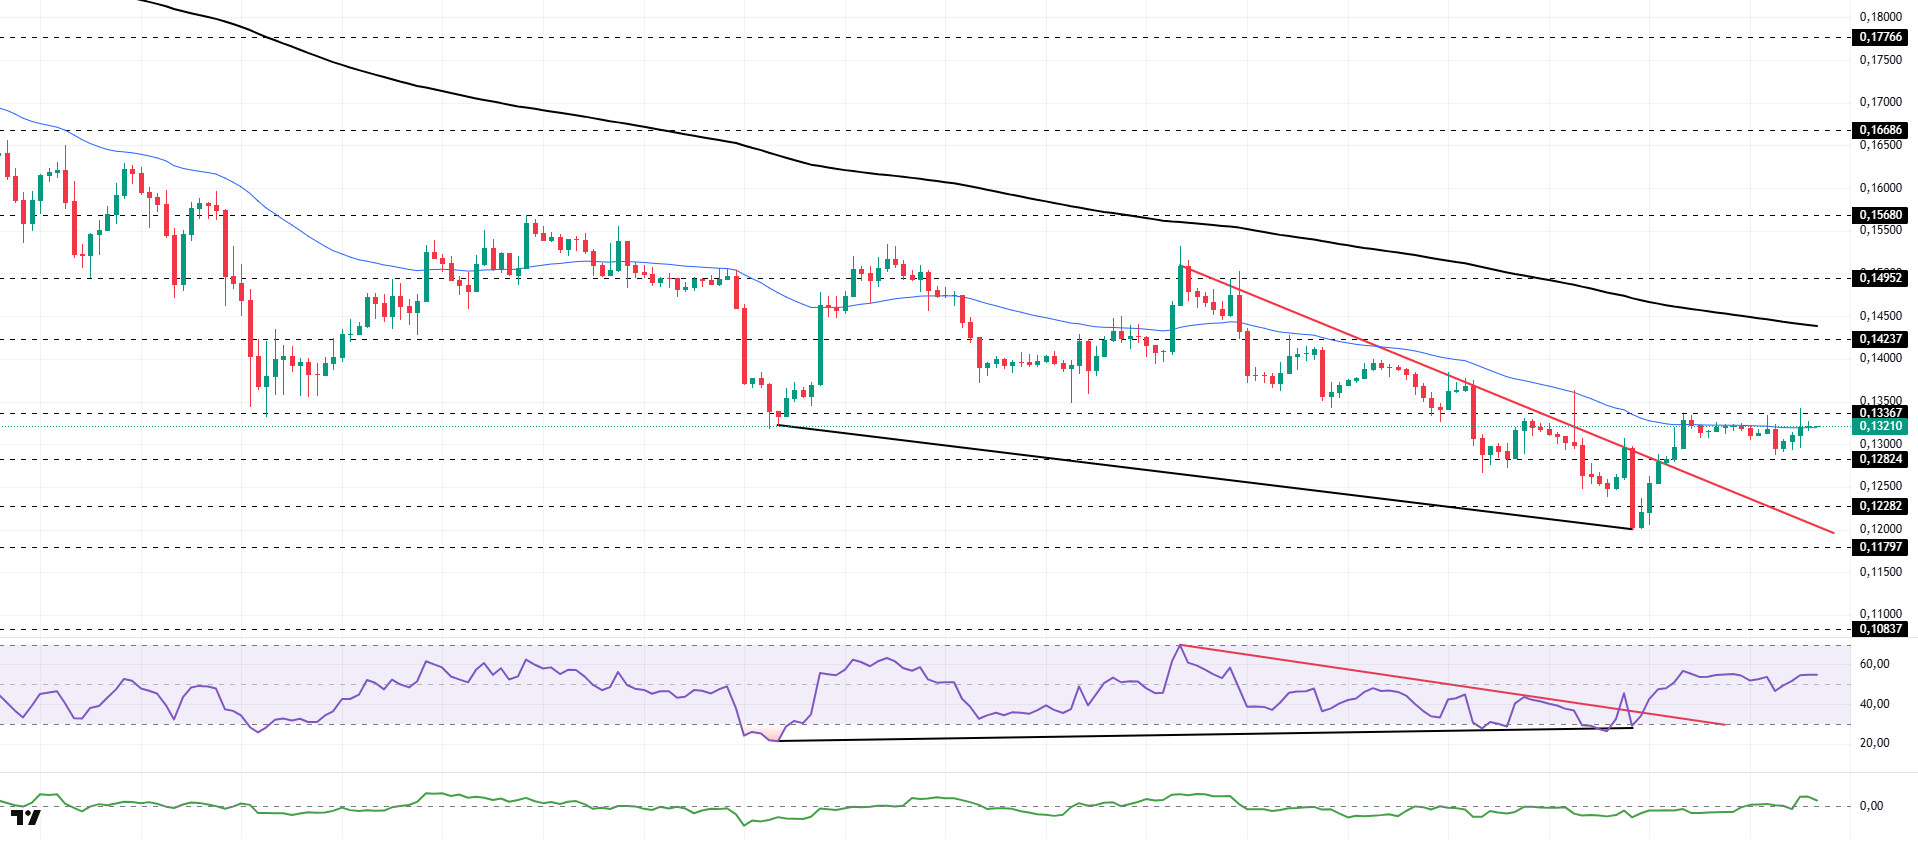
The DOGE price showed an upward trend. The asset moved to the upper region of the downward trend that began on December 9 and strengthened the upward signal. Currently testing the $0.13367 level and the 50 EMA (Blue Line) moving average as resistance, the price may test the 200 EMA (Black Line) moving average as resistance upon closing above this level. In case of a pullback, it may test the $0.12824 level as support.
On the 4-hour chart, the 50 EMA (Exponential Moving Average – Blue Line) remained below the 200 EMA (Black Line). This indicates that the downtrend may continue in the medium term. The price being below both moving averages indicates a downward trend in the short term. The Chaikin Money Flow (CMF-20) rose from neutral to positive territory. Additionally, the balance of money inflows and outflows may keep the CMF in positive territory. The Relative Strength Index (RSI-14) rose from the middle of the negative zone to the middle of the positive zone. At the same time, it remained in the upper region of the downward trend that began on December 9. This signaled increased buying pressure. On the other hand, the positive divergence remains valid. In the event of an uptrend driven by political developments, macroeconomic data, or positive news flow in the DOGE ecosystem, the $0.14237 level stands out as a strong resistance zone. Conversely, in the event of negative news flow, the $0.12282 level could be triggered. A decline to these levels could increase momentum and initiate a new wave of growth.
Supports: 0.12824 – 0.12282 – 0.11797
Resistances: 0.13367 – 0.14237 – 0.14952
BNB/USDT
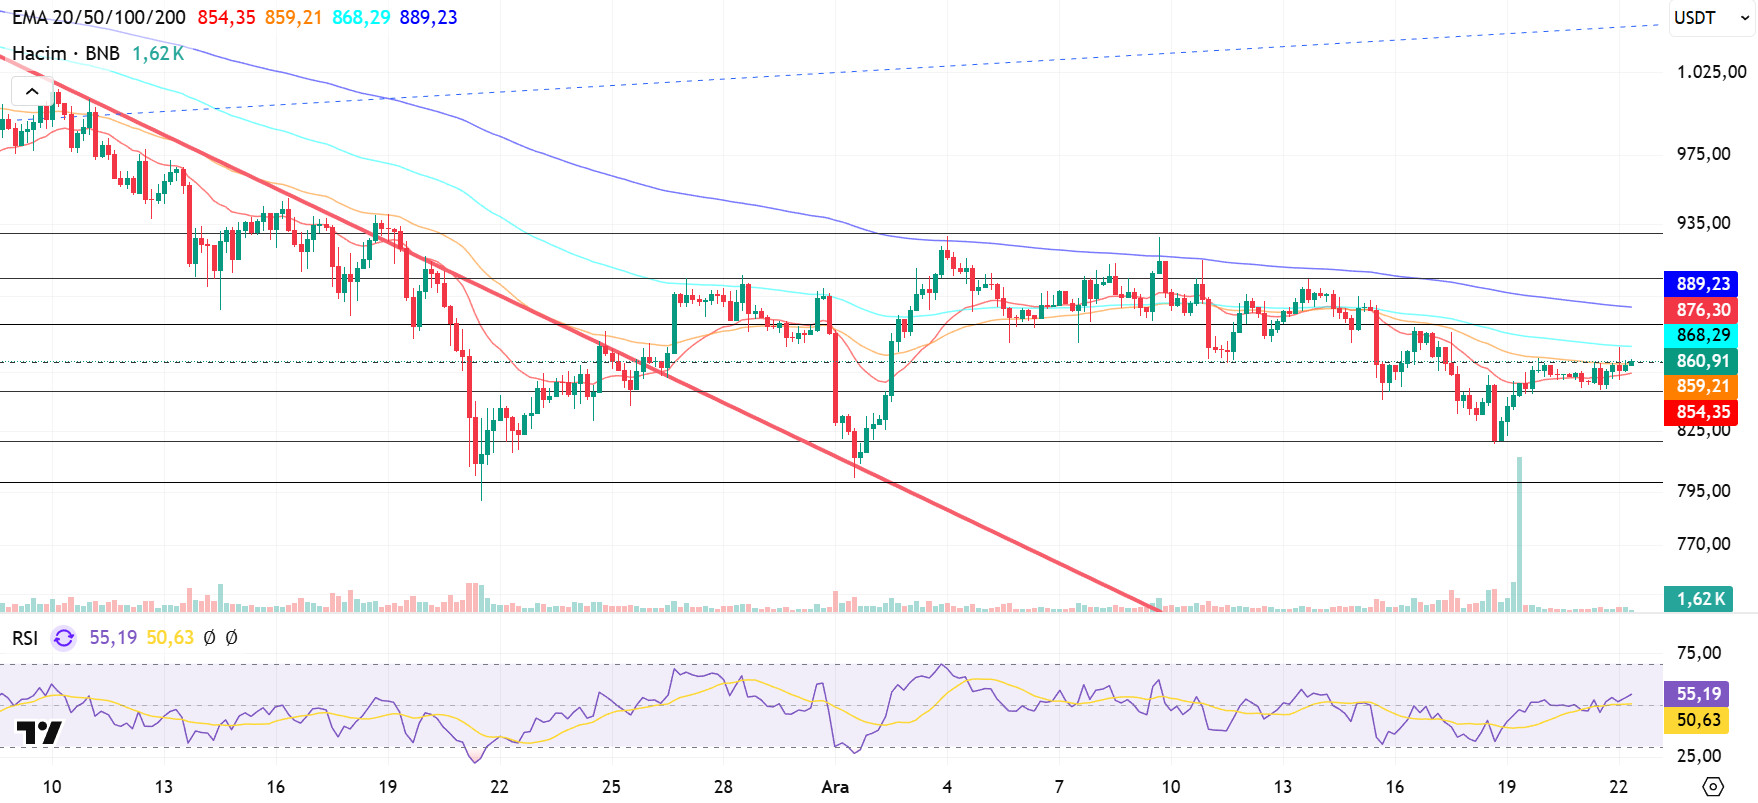
From a technical perspective, the correction that began after the all-time high (ATH) retreated to the $790 support zone identified in previous analyses. After seeking support at these levels for a while, BNB ended its downward momentum with the candlestick formations that emerged and turned its direction upward again. With this recovery, the price gained positive momentum towards the descending trend line; with the support of new candles, it broke the descending trend upwards and rose to the $940 level. Although some pressure was seen in this region depending on market conditions, the overall positive outlook was maintained.
The current outlook for BNB/USDT is generally positive. However, the price moving within a horizontal band raises questions about which direction it will continue in the coming period. Upward price movements are expected to reinforce the current positive outlook.
Technical indicators for BNB, currently trading in the $845-$880 range, show that low trading volumes are limiting the upward momentum. In addition, the RSI indicator appears to be hovering at relatively low levels due to weak momentum.
According to the technical picture, if buying appetite is maintained and market momentum strengthens, BNB is expected to retest the $880 resistance level in the first stage. If this level is exceeded, it appears likely that the falling trend line will be broken. If the trend is broken and the price remains above this level, a rise towards the $905 and $930 levels appears technically possible.
Conversely, if selling pressure increases, the price is expected to retest the $845 support level. If this level is broken, a pullback towards the $820 and $800 support zones will likely occur.
Supports: 845 – 820 – 800
Resistances: 880 – 905 – 930
LTC/USDT
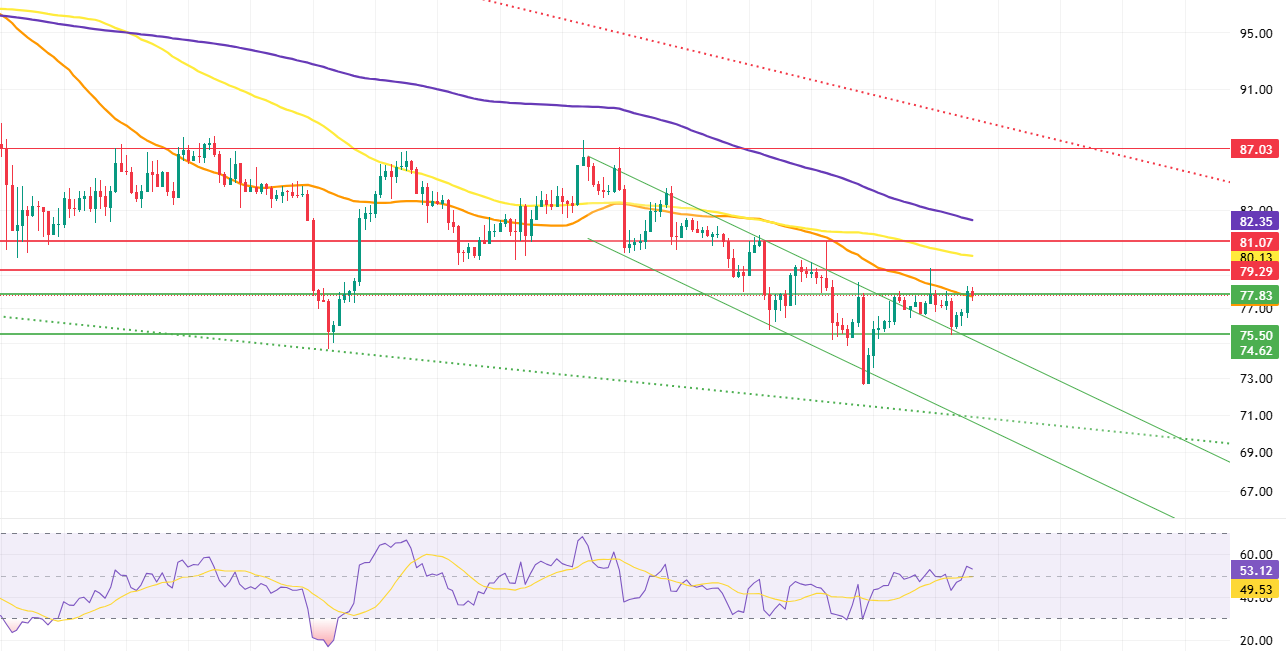
Litecoin (LTC) / USDT pair price movements closed the previous day with a 1.35% loss in value. During the same period, LTC’s 1.7% decline compared to Bitcoin shows that Litecoin reduced its own value despite the movement experienced by Bitcoin. On the futures side, the long/short position ratio opened in the last 24 hours being at 0.9869 indicates that derivative market participants’ downward expectations have decreased significantly but still remain slightly dominant.
A technical analysis of Litecoin’s 4-hour USDT pair shows that the price is below the 200 and 100-period moving averages (purple and yellow lines) but above the 50-period moving average. This outlook is consistent with the decline in short positions in the derivatives markets and indicates that the main trend is shifting from downward to neutral range. However, this structure carries signals that could evolve positively, in which case the first serious resistance level where the uptrend could be suppressed is expected to form at 79.29. This level, which is a horizontal resistance level, stands out as a critical zone for upward movements. If this level is exceeded, 81.07 will come to the fore as another important horizontal resistance level to be monitored during the day. If the upward movement gains momentum and the price moves towards the 82.35 level, the 200-period moving average may limit the upward movement as it acts as a stop for some derivatives market participants to close their long positions.
If the price moves downward from the neutral zone, the first support level to watch is 77.83. The fact that this region is also supported by the 50-period moving average (orange line) provides a stronger support structure, while a downward break could deepen selling pressure and bring the 75.50 and 74.62 support levels into focus. The 75.50 level, in particular, is a strong horizontal support. If the price drops to 74.62 and rebounds from there, the expectation is that this movement will be largely short-lived and we will return to neutral territory.
Supports: 77.83 – 75.50 – 74.62
Resistances: 79.29 – 81.07 – 82.35
Legal Notice
The investment information, comments, and recommendations contained herein do not constitute investment advice. Investment advisory services are provided individually by authorized institutions taking into account the risk and return preferences of individuals. The comments and recommendations contained herein are of a general nature. These recommendations may not be suitable for your financial situation and risk and return preferences. Therefore, making an investment decision based solely on the information contained herein may not produce results in line with your expectations.

