
Technical Analysis
BTC/USDT
Amid uncertainties in global markets centered on monetary policy, central bank independence, and crypto regulations, disagreements within the Fed and Trump’s moves regarding the Fed chairmanship continue to be decisive for pricing. Hawkish warnings about persistent inflation and expectations of easing due to cooling employment are making it difficult for the Fed to establish a clear direction, while the upcoming presidential transition is creating uncertainty about the future of monetary policy. At the same time, Japan’s shift towards a more competitive model for crypto taxation and Russia’s approach of definitively keeping crypto outside the official currency indicate a deepening divergence in regulation within the global digital asset ecosystem.
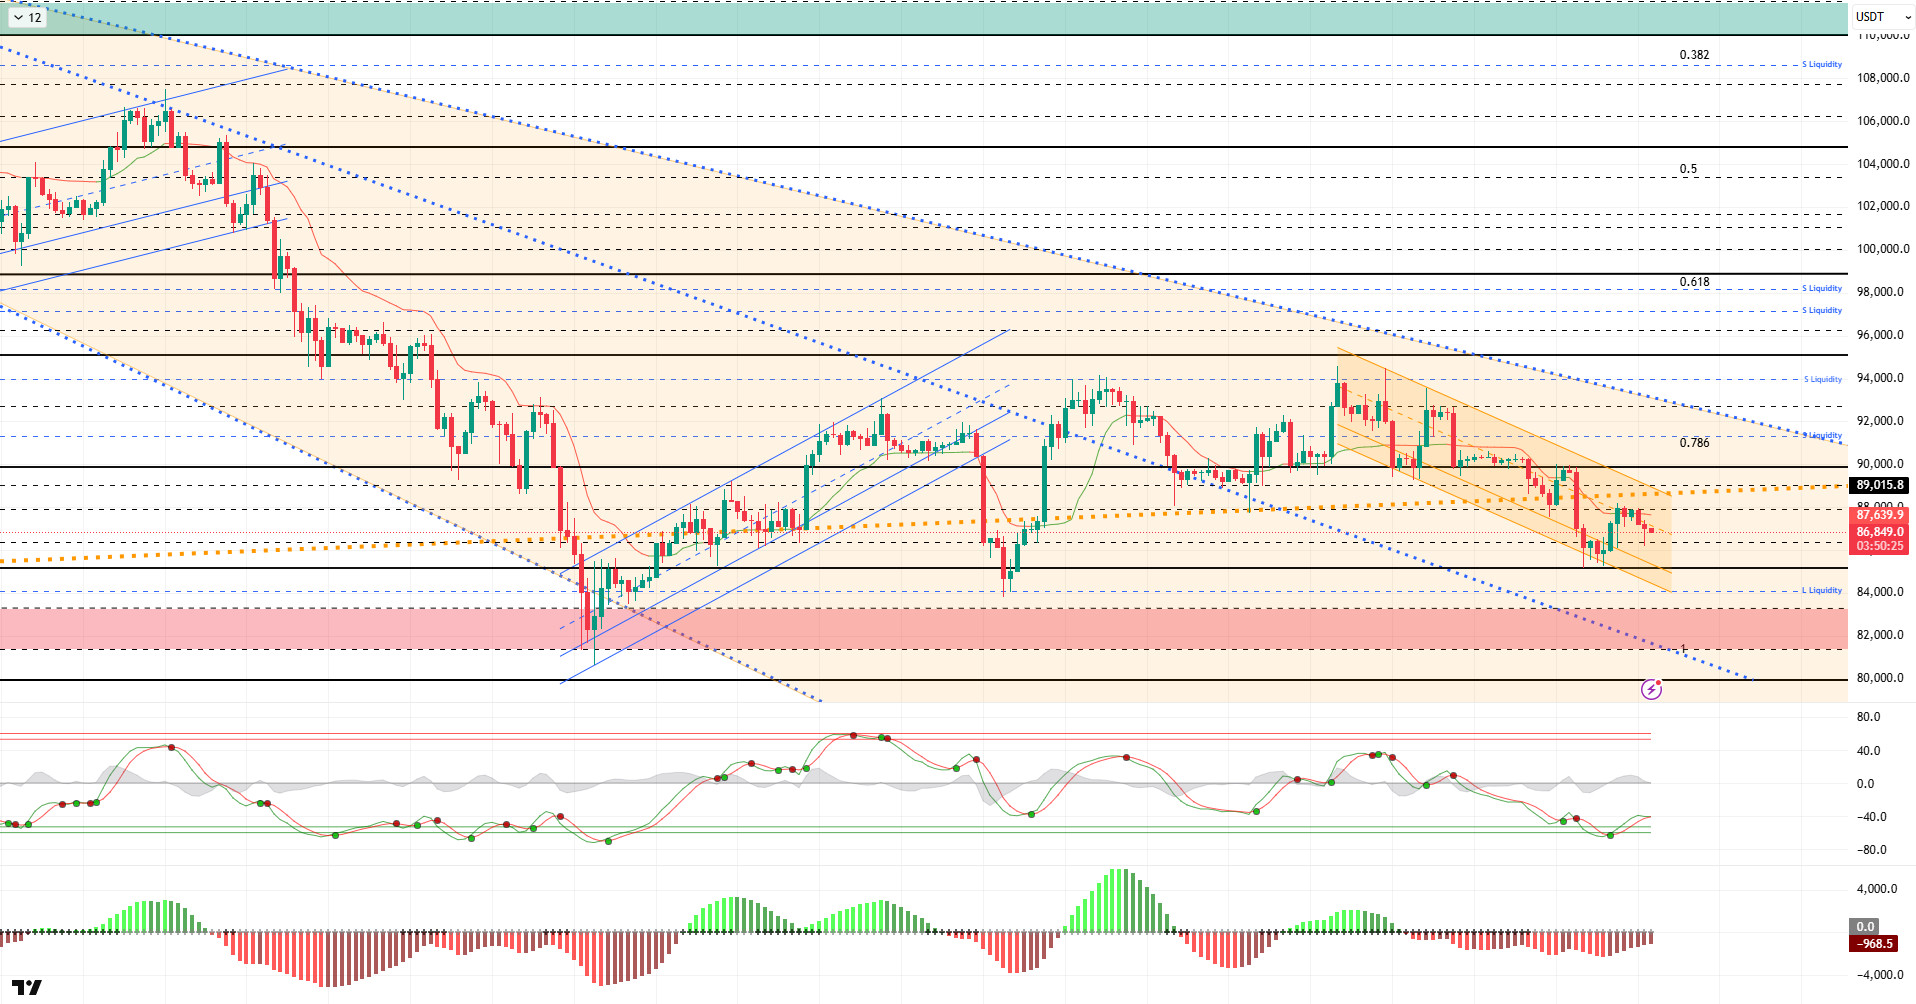
From a technical perspective, BTC continues to move within a descending trend channel, occasionally testing the 88,000 level but failing to break through it. BTC then turned downward again and spiked to the 83,300 support level. Moving forward with bearish structures in the short term under the major descending trend channel, the price may seek new lows. In this context, the 85,000 level will continue to be monitored as a critical reference area before the previously tested 80,500 level.
Technical indicators show that the Wave Trend (WT) oscillator continues to maintain a weakening buy signal just above the oversold zone. The histogram on the Squeeze Momentum (SM) indicator is attempting to gain momentum once again within the negative zone. The Kaufman Moving Average (KAMA) is currently trading above the price at the $87,685 level.
Looking at liquidation data, the short-term selling level is concentrated in the $88,000 range, while the buying level is concentrated around $85,000. In the long term, fragmented concentration continues above the $90,000 level.
In summary, while the US economy remains stuck between labor and inflation, Treasury Secretary Bessent indicated that the new Fed chair could be announced in January. It is understood that Trump is actively evaluating the selection process for the new Fed chair, with the names of Hassett, Warsh, and Waller being discussed. On the Asian front, Japan is moving towards interest rate hikes, while China has increased its money supply in response to deteriorating economic data. Technically, BTC, which retreated to the 80,500 level following the downtrend that formed after the ATH, rebounded strongly from this region. Subsequently, the price settled above the 90,000 level and entered a consolidation phase for a while, then retreated again, falling below the major uptrend line and testing the 85,000 level. When examining liquidity data, it is seen that areas with concentrated short-term trading are being targeted, while long-term sell orders have not yet been tested. After this stage, the 85,000 level has become a critical point for the price to maintain its momentum. Closes and pricing above this level are an important indicator for regaining momentum. In this context, 88,000 stands out as the next target area, and if it is passed, liquidity areas will be monitored again. In the event of a possible selling pressure, the 85,000 level will be monitored as the last obstacle to the price forming a double bottom at the 80,000 level.
Supports: 85,000 – 84,100 – 83,300
Resistances: 86,400 – 88,000 – 89,000
ETH/USDT
The $2,910 level has been defended since yesterday, and the price is moving sideways above this region. Although the support area was tested again in the morning and a bullish reaction occurred, indicating that buyers are defending this level for now, the weak movement signals continued indecision in the market.
The liquidity front presents a cautious outlook. Although the Chaikin Money Flow (CMF) has moved into positive territory, it has not gained significant momentum. Limited liquidity inflows reveal why the price has been reluctant in its upward attempts. The CMF’s weak performance in positive territory suggests that buyer interest has not yet reached a level sufficient to initiate a strong trend.
A similar picture emerges on the momentum front. Although the Relative Strength Index (RSI) has risen slightly in response to the oversold zone, it maintains a flat and weak appearance. This movement in the RSI indicates that heavy selling has subsided somewhat, but it is not enough to speak of strong upward momentum. It is clear that buyers remain cautious and the appetite for gains is limited.
The technical structure continues to be under pressure from the Ichimoku indicator. The price is trading below both the Kijun and kumo cloud levels. This positioning indicates that the short- and medium-term trend still favors sellers and that upward attempts are not technically supported. Pricing below the cloud increases the risk of potential rebound rallies encountering selling pressure.
On the futures market side, the funding rate turning positive again is also noteworthy. Combined with weak liquidity conditions, this structure indicates that the directional risk in the market is still on the downside. In an environment where buyers have not gained clear strength, a positive funding rate keeps alive the possibility of continued downward movement.
In the overall outlook, the main focus in the short term remains the $2,910 level. It seems likely that the price will retest this support during the day. If this level is lost, increased selling pressure and steeper declines could come into play ( ). For the upward scenario to gain strength, it is critical to break through the $3,020 resistance. Sustained movement above this region could pave the way for regaining the Kijun level and initiating a more meaningful recovery process.
Below the Form
Supports: 2,910 – 2,727 – 2,625
Resistances: 3,019 – 3,074 – 3,227

XRP/USDT
The outlook suggests that recovery efforts on the XRP side have been limited, and the weak structure has largely been preserved. After breaking through the $1.90 level yesterday, the price managed to rise to the $1.95 Kijun level, but the selling pressure in this region could not be overcome. With the incoming sales, the price retreated and is currently trying to hold at the $1.92 level. The upward move stopping at the Kijun level shows that buyers still cannot muster enough strength.
On the liquidity side, a more positive divergence compared to the previous day is noteworthy. The Chaikin Money Flow (CMF) indicator rising back to the zero line indicates increased liquidity inflows into the market and a temporary weakening of selling pressure. This recovery in CMF stands out as one of the key factors enabling the price to remain above $1.90. However, this increase in liquidity has not yet reached a level that would push the price above strong resistance zones.
It is difficult to speak of the same improvement on the momentum side. The Relative Strength Index (RSI) still maintains its weak appearance and has not produced a meaningful signal of strengthening. This stance in the RSI supports why upward attempts have remained limited and why the price is still advancing on fragile ground. Without a clear recovery in momentum, it seems difficult for the increases to be sustainable.
The trend outlook also remains negative from the Ichimoku indicator perspective. The price is trading below both the Kijun level and the kumo cloud. This structure indicates that the short- and medium-term trend is still negative and that upward movements are not technically supported. As long as the price remains below the kumo cloud, the risk of upward attempts encountering selling pressure remains high.
In the current scenario, the $1.90 level remains a critical threshold. If this region is lost, downward volatility is likely to intensify and the downtrend is likely to continue. Conversely, if the price continues to hold above $1.90 and liquidity inflows on the CMF side continue, a short-term recovery attempt towards the $2.05 resistance level could come into play.
Supports: 1.9092 – 1.8121 – 1.6224
Resistances: 2.0543 – 2.1731 – 2.2729

SOL/USDT
Project Eleven, a company specializing in post-quantum cryptography, has partnered with the Solana Foundation to strengthen the Solana ecosystem against emerging quantum computing threats. Solana is entering Brazil’s main exchange with Valour’s expansion of regulated crypto access.
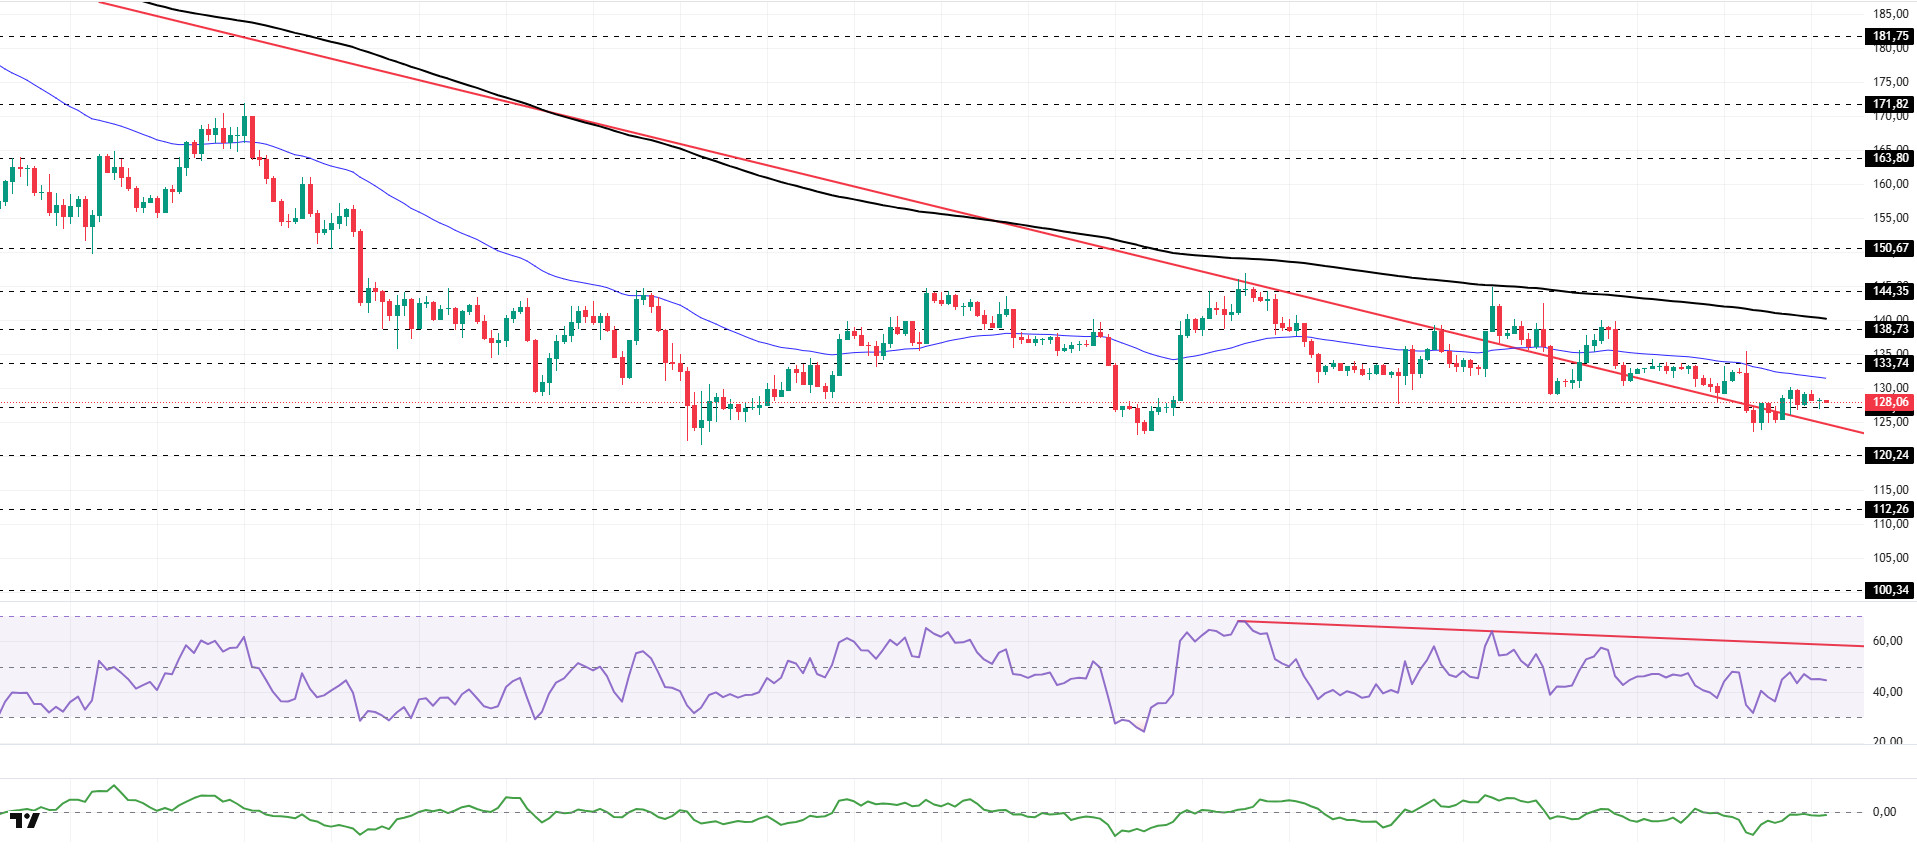
The SOL price has been trading sideways. The asset has remained in the upper region of the downtrend that began on October 6. Currently trading in a narrow band between the downward trend line and the 50 EMA (Blue Line) moving average, the asset could test the 200 EMA (Black Line) moving average as resistance if it experiences an uptrend. In the event of a pullback, the $120.24 level could be monitored.
On the 4-hour chart, it continued to trade below the 50 EMA (Exponential Moving Average – Blue Line) and 200 EMA (Black Line). This indicates that it may be in a downtrend in the medium term. At the same time, the price being below both moving averages indicates that the asset is trending downward in the short term. The Chaikin Money Flow (CMF-20) is in the negative zone, close to the neutral level. However, the balance of money inflows and outflows may keep the CMF in the negative zone. The Relative Strength Index (RSI-14) remained in the middle of the negative zone. It also remained below the downward trend line that began on December 3. This indicates that selling pressure continues. If there is an uptrend due to macroeconomic data or positive news related to the Solana ecosystem, the $138.73 level stands out as a strong resistance point. If this level is broken upwards, the uptrend is expected to continue. Conversely, if pullbacks occur due to developments in the direction of or profit-taking, the $120.24 level could be tested. A decline to these support levels could increase buying momentum, presenting a potential upside opportunity.
Supports: 127.21 – 120.24 – 112.26
Resistances: 133.74 – 138.73 – 144.35
DOGE/USDT
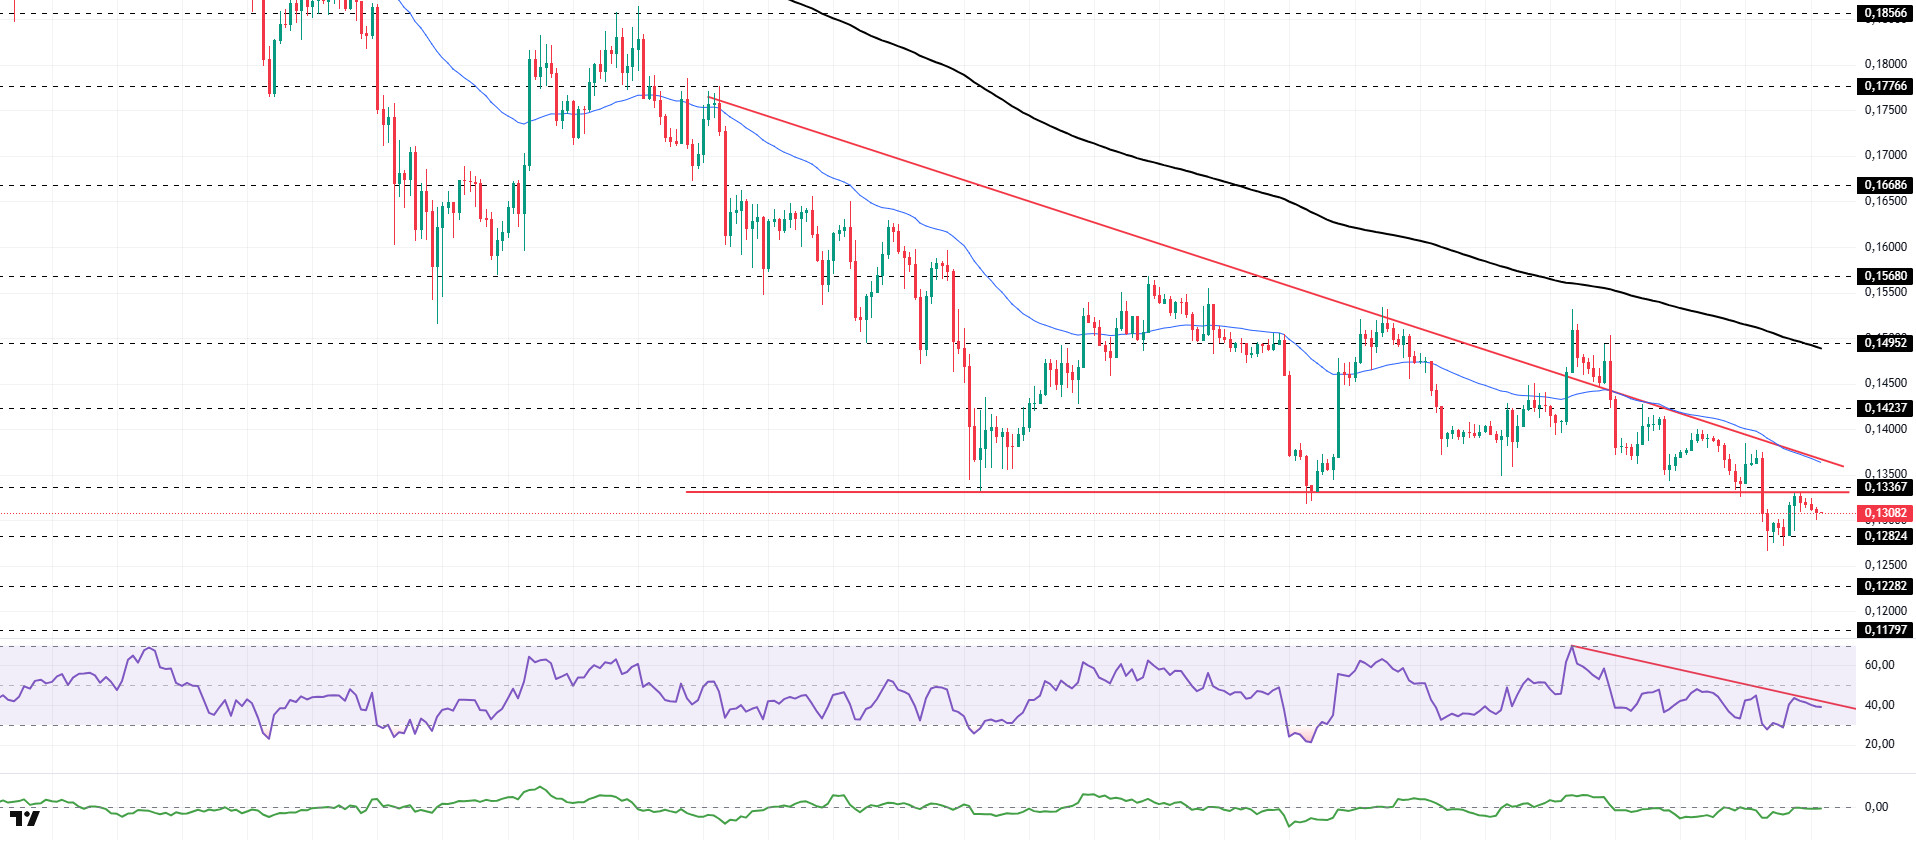
The DOGE price experienced a slight pullback. The asset experienced a pullback by breaking below the base level of the descending triangle formation that began on November 13. Currently showing a slight increase, the price tested the base level of the descending triangle formation, which is a strong resistance level, and continued to experience a slight pullback. If the pullback continues, it may test the $0.12282 level as support. If it rises, it may test the 50 EMA (Blue Line) moving average or the top level of the descending triangle formation as resistance.
On the 4-hour chart, the 50 EMA (Exponential Moving Average – Blue Line) remained below the 200 EMA (Black Line). This indicates that the downtrend may continue in the medium term. The price being below both moving averages indicates a downward trend in the short term. The Chaikin Money Flow (CMF-20) remained at a neutral level. Additionally, an increase in money outflows could push the CMF into negative territory. The Relative Strength Index (RSI-14) rose from the oversold level in negative territory to the mid-level of the negative zone. It also tested the resistance level of the downward trend that began on December 9 but experienced a slight pullback. This signaled increased selling pressure. In the event of potential increases driven by political developments, macroeconomic data, or positive news flow within the DOGE ecosystem, the $0.14952 level stands out as a strong resistance zone. Conversely, in the event of negative news flow, the $0.11797 level could be triggered. A decline to these levels could increase momentum and initiate a new wave of growth.
Supports: 0.12824 – 0.12282 – 0.11797
Resistances: 0.13367 – 0.14237 – 0.14952
Legal Notice
The investment information, comments, and recommendations contained herein do not constitute investment advice. Investment advisory services are provided individually by authorized institutions taking into account the risk and return preferences of individuals. The comments and recommendations contained herein are of a general nature. These recommendations may not be suitable for your financial situation and risk and return preferences. Therefore, making an investment decision based solely on the information contained herein may not produce results in line with your expectations.

