
Technical Analysis
BTC/USDT
The Senate’s agreement on temporary funding signals the end of the six-week federal government shutdown, while Trump’s promise of a “$2,000 dividend for every American” from tariffs sparked debate in the markets ahead of the Supreme Court ruling. On the Fed front, Jefferson and Williams delivered cautious messages, highlighting that bank reserves are at the limit. In other developments, China and the Netherlands moving closer to an agreement on Nexperia strengthened hopes for stability in the semiconductor supply chain.
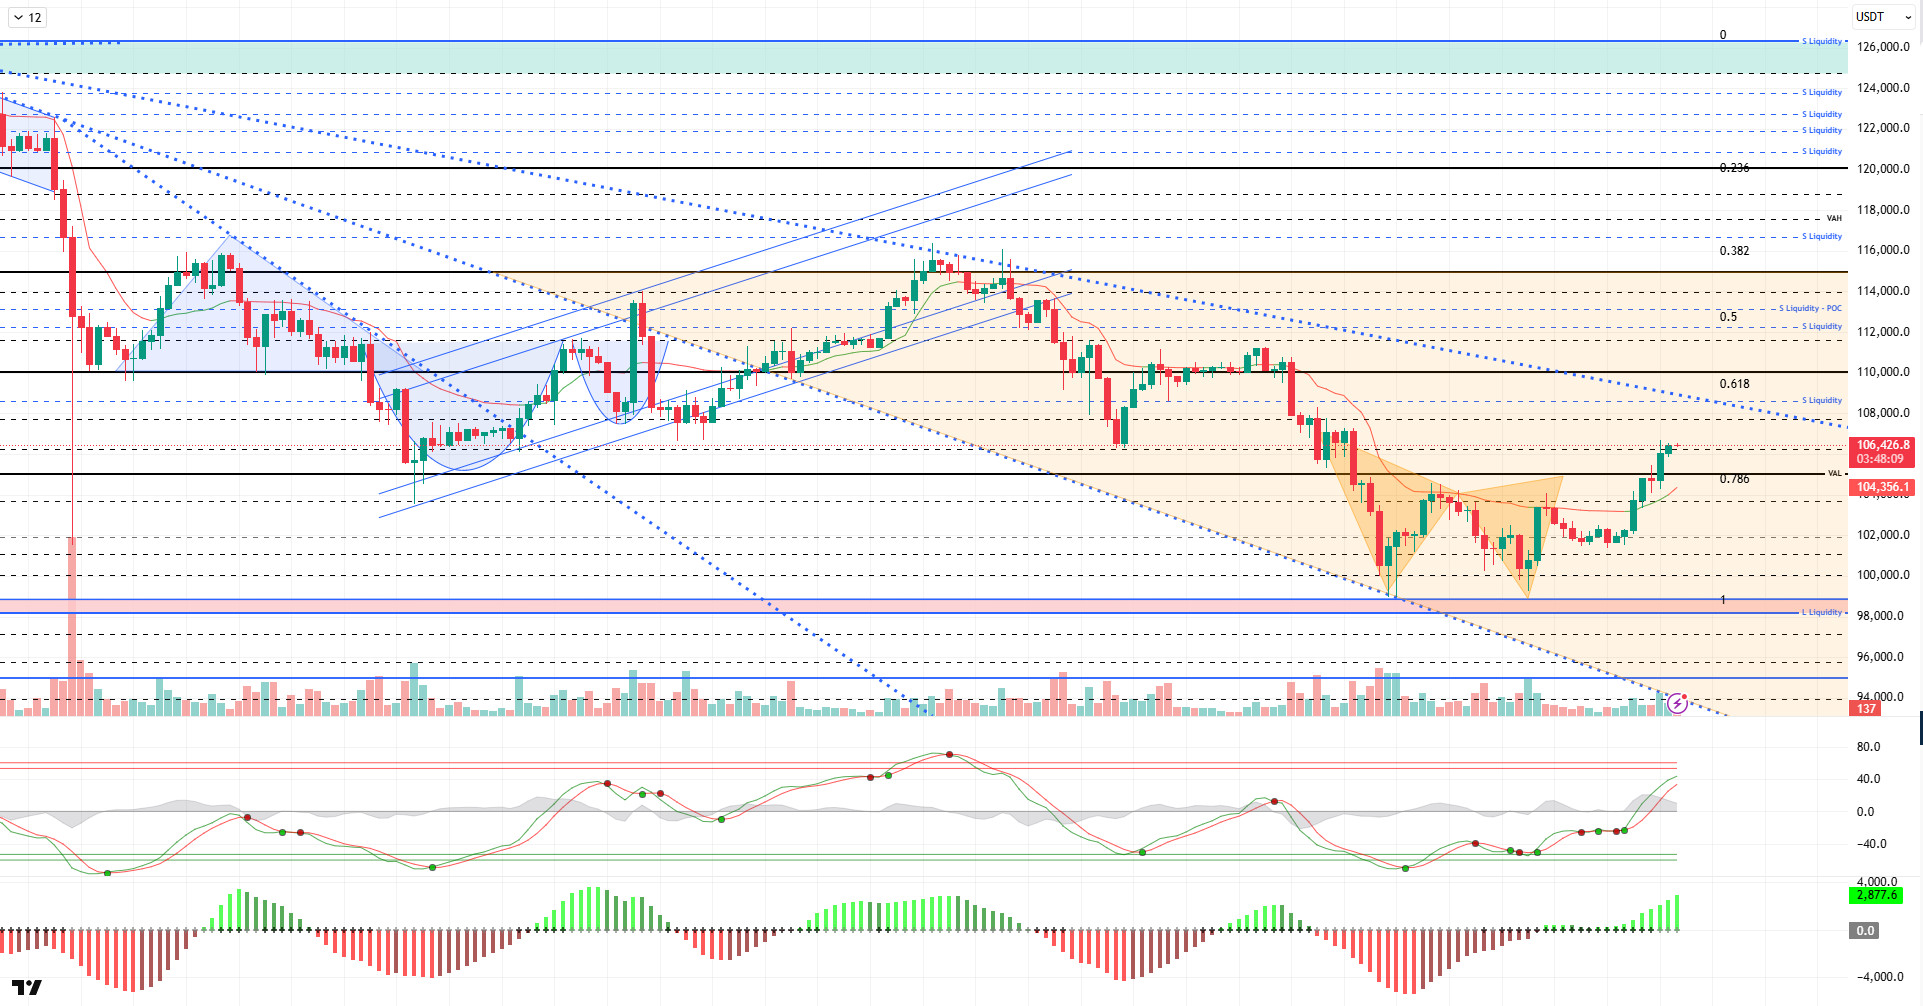
Technically, BTC turned upward after its second dip at the 99,000 level, reaching 106,400. The price, which spent the weekend in a horizontal band, surpassed the 105,000 reference zone in the first hours of the week with the minor cup formation it created.
Technical indicators formed an upward trend parallel to the buy signal given by the Wave Trend (WT) Oscillator in the oversold zone and reached the overbought zone. The Squeeze Momentum (SM) indicator’s histogram successfully gained strength after reaching maximum weakness in the negative zone, confirming the rise. The Kaufman Moving Average (KAMA) is currently at $104,300, positioned below the price.
According to liquidation data, investors who saw the decline as an opportunity recorded a concentration at the 98,000 level, while another concentration at the 100,000 level was liquidated with the latest decline. In contrast, the selling level was liquidated at 102,500 – 103,500 and 105,600. Another selling level has accumulated at the 112,000 level.
In summary, the Senate agreement on the US government reopening stood out as an optimistic development. While uncertainty about the Fed’s interest rate cuts persists, Trump’s statements on tariffs have reignited debate. In liquidity data, the dominance of the selling tier was one of the main factors pushing the price up.Technically, if the price holds above the 105,000 level and daily closes occur, the next reference point of 110,000 will come into focus. On the other hand, in the event of potential selling pressure, 105,000 will continue to be monitored as a critical support level.
Supports: 105,000 – 103,300 – 101,800
Resistances: 106,600 – 108,800 – 110,000
ETH/USDT
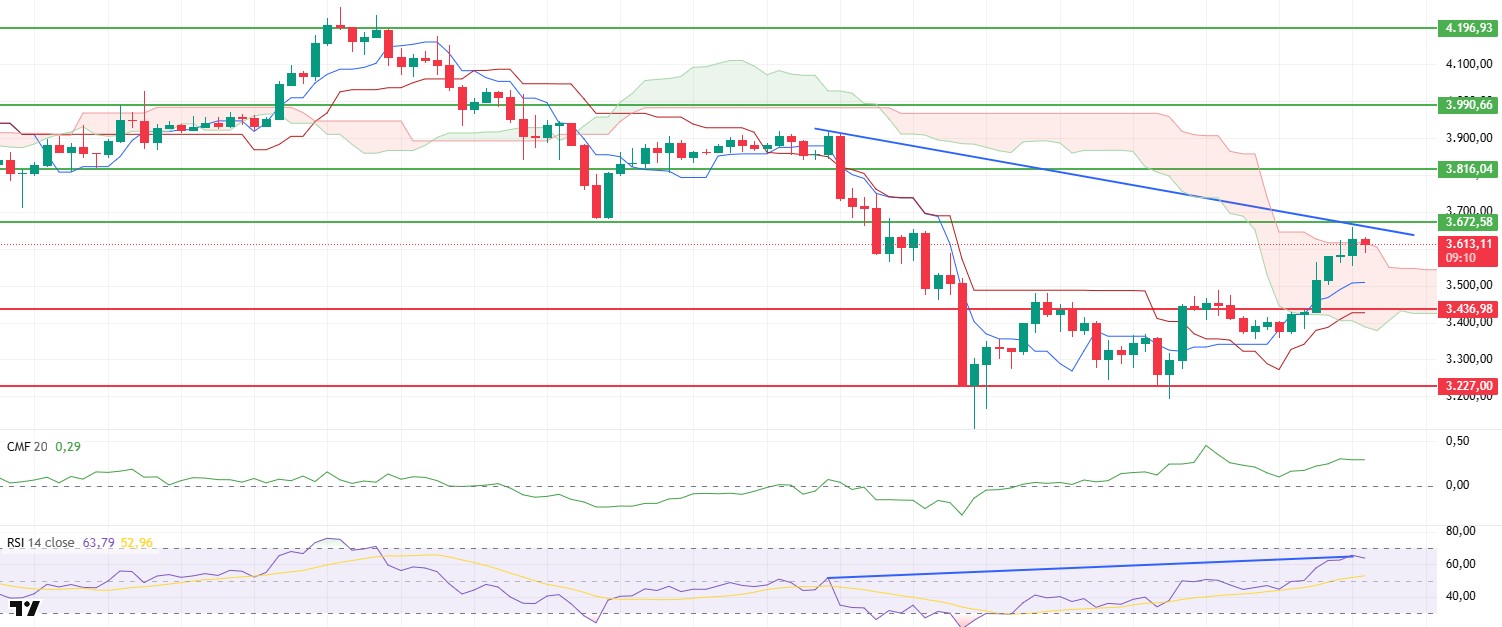
The ETH price rose on Friday after receiving a strong reaction at the $3,227 level, breaking through the $3,436 resistance and maintaining its momentum throughout the weekend. On Sunday, the price rose to $3,672, a level previously noted as critically important. Although it experienced a slight pullback due to selling pressure from this region, it is currently holding above $3,600.
The Chaikin Money Flow (CMF) indicator accompanied this rise over the weekend, maintaining its upward momentum in positive territory. Continued liquidity inflows indicate that the upward movement is still strongly supported.
The Relative Strength Index (RSI) indicator, meanwhile, approached the overbought zone alongside the rise, experiencing a limited pullback from these levels. The negative divergence forming on the RSI suggests that it could create pressure on the price during the day and that the possibility of a short-term correction is on the agenda.
Looking at the Ichimoku indicator, the price breaking above the Tenkan, Kijun, and lower band of the kumo cloud supports the short-term positive outlook. However, the reaction from the upper band of the kumo cloud signals that a short-term correction may begin. If the upper band of the kumo cloud is broken permanently, a stronger and more voluminous upward movement may come into play.
Overall, with the negative divergence on the RSI, it seems likely that the price will pull back to the $3,508 level, which corresponds to the Tenkan level, during the day. On the other hand, breaking above the $3,672 level could invalidate this negative scenario and allow the uptrend to continue.
Below the Form
Supports: 3,436 – 3,227 – 3,020
Resistances: 3,672 – 3,816 – 3,990
XRP/USDT
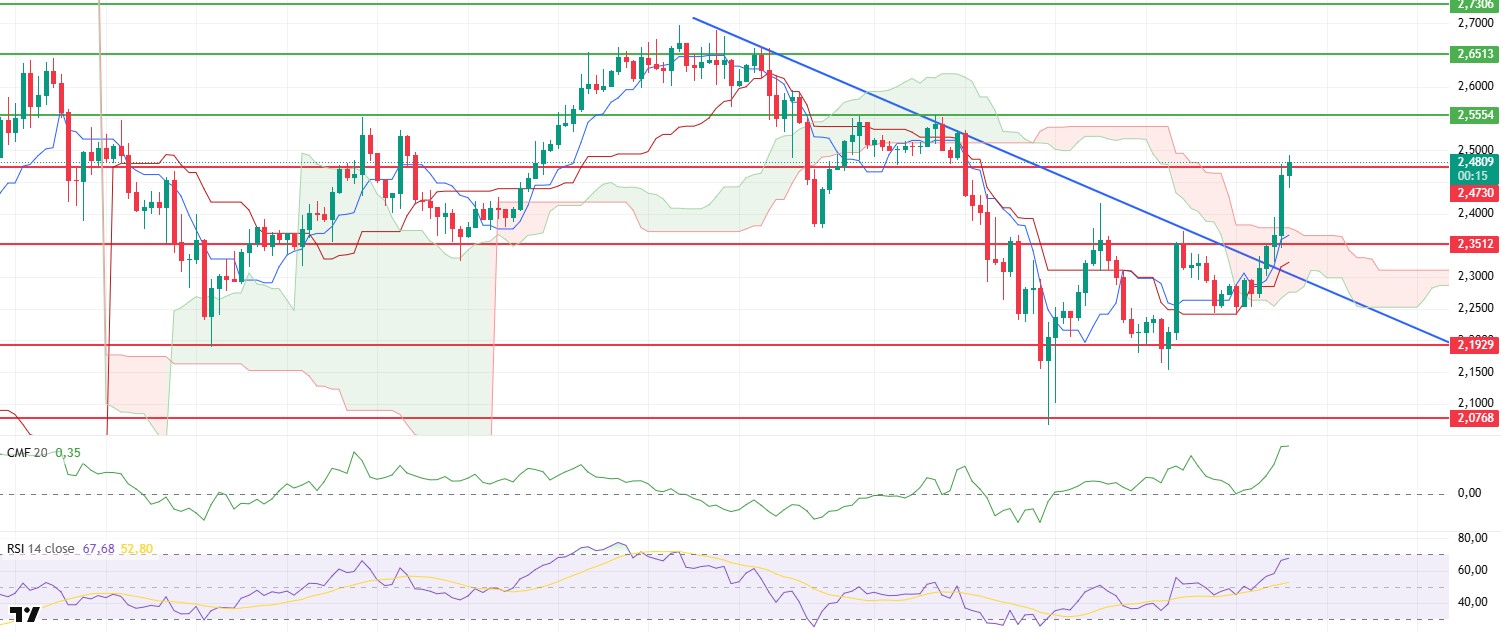
The XRP price entered an uptrend on Friday with a strong rebound from the support zone at $2.19. After breaking through the $2.35 resistance, the price accelerated its momentum and climbed above the $2.47 level. The break of the trend indicated by the blue line on the chart on Sunday shows that short-term momentum has strengthened and buyers have regained control.
The Chaikin Money Flow (CMF) indicator gained strength in positive territory, accompanying the upward movement. The significant increase in liquidity inflows indicates that the rise is supported by the spot market and that capital flows in the market are continuing in a healthy manner.
The Relative Strength Index (RSI) indicator has risen to the upper limit of the overbought zone, indicating that momentum has strengthened considerably. Strong buyer appetite supports the possibility that the upward trend could be maintained in the short term.
In the Ichimoku indicator, the price rising above the Tenkan and Kijun levels and breaking through the kumo cloud boundaries to turn green strengthens the medium-term positive outlook. This technical structure signals that the trend reversal has been confirmed and that the uptrend could extend over a broader timeframe.
If the $2.47 level is maintained during the day, the upward movement is expected to continue. However, losing this level could lead to a correction down to the $2.41 region in the short term.
Supports: 2.4730 – 2.3512 – 2.1929
Resistances: 2.5554 – 2.6513 – 2.7306
SOL/USDT
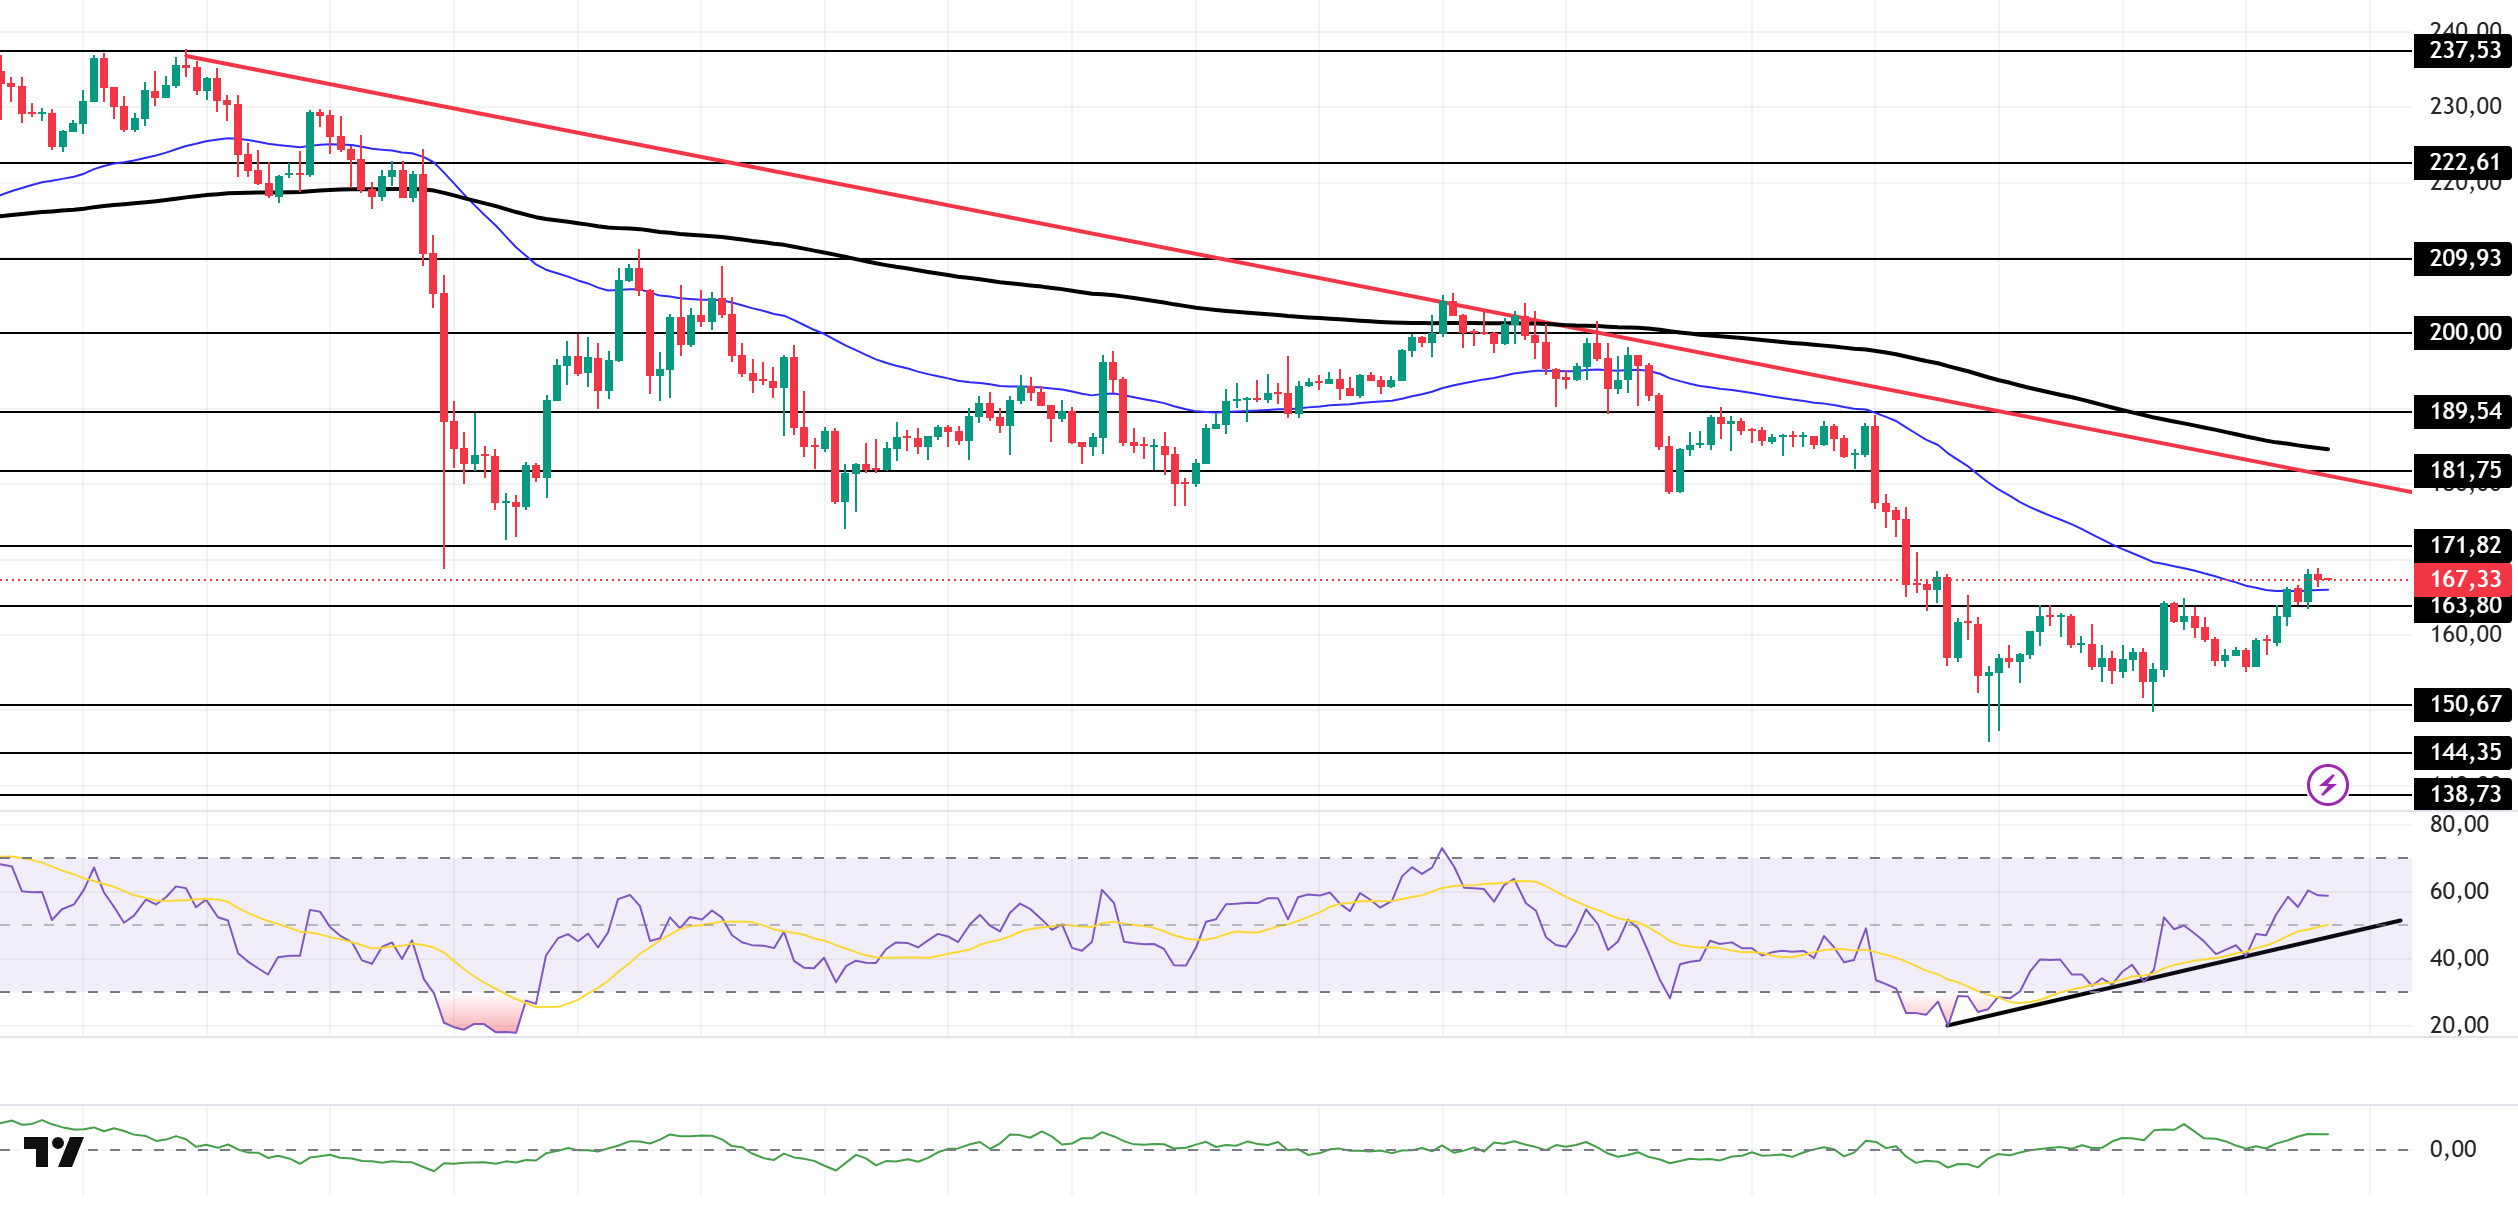
The SOL price experienced an increase. The asset tested and broke through the strong resistance level of $163.80 and the 50 EMA (Blue Line) moving average, continuing its upward movement. However, it remained in the lower region of the downward trend that began on October 6. Currently, the price remains above the 50 EMA moving average and could test the downward trend line as resistance if the upward movement continues. In the event of a pullback, it could track the $163.80 level.
The price continued to remain below the 50 EMA (Exponential Moving Average – Blue Line) and 200 EMA (Black Line) on the 4-hour chart. This indicates a potential downtrend in the medium term. At the same time, the price being between both moving averages shows us that the asset is in a decision phase in the short term. The Chaikin Money Flow (CMF-20) is at a positive level. However, an increase in cash inflows could push the CMF to the upper levels of the positive zone. The Relative Strength Index (RSI-14) rose to the middle of the positive zone. It also continued to stay in the upper region of the upward trend that began on November 4. These indicate increased buying pressure. If there is an uptrend due to macroeconomic data or positive news related to the Solana ecosystem, the $181.75 level stands out as a strong resistance point. If this level is broken upwards, the uptrend is expected to continue. In the event of pullbacks due to developments in the opposite direction or profit-taking, the $150.67 level could be tested. A decline to these support levels could increase buying momentum, presenting a potential opportunity for an uptrend.
Supports: 163.80 – 150.67 – 144.35
Resistances: 171.82 – 181.75 – 189.54
DOGE/USDT
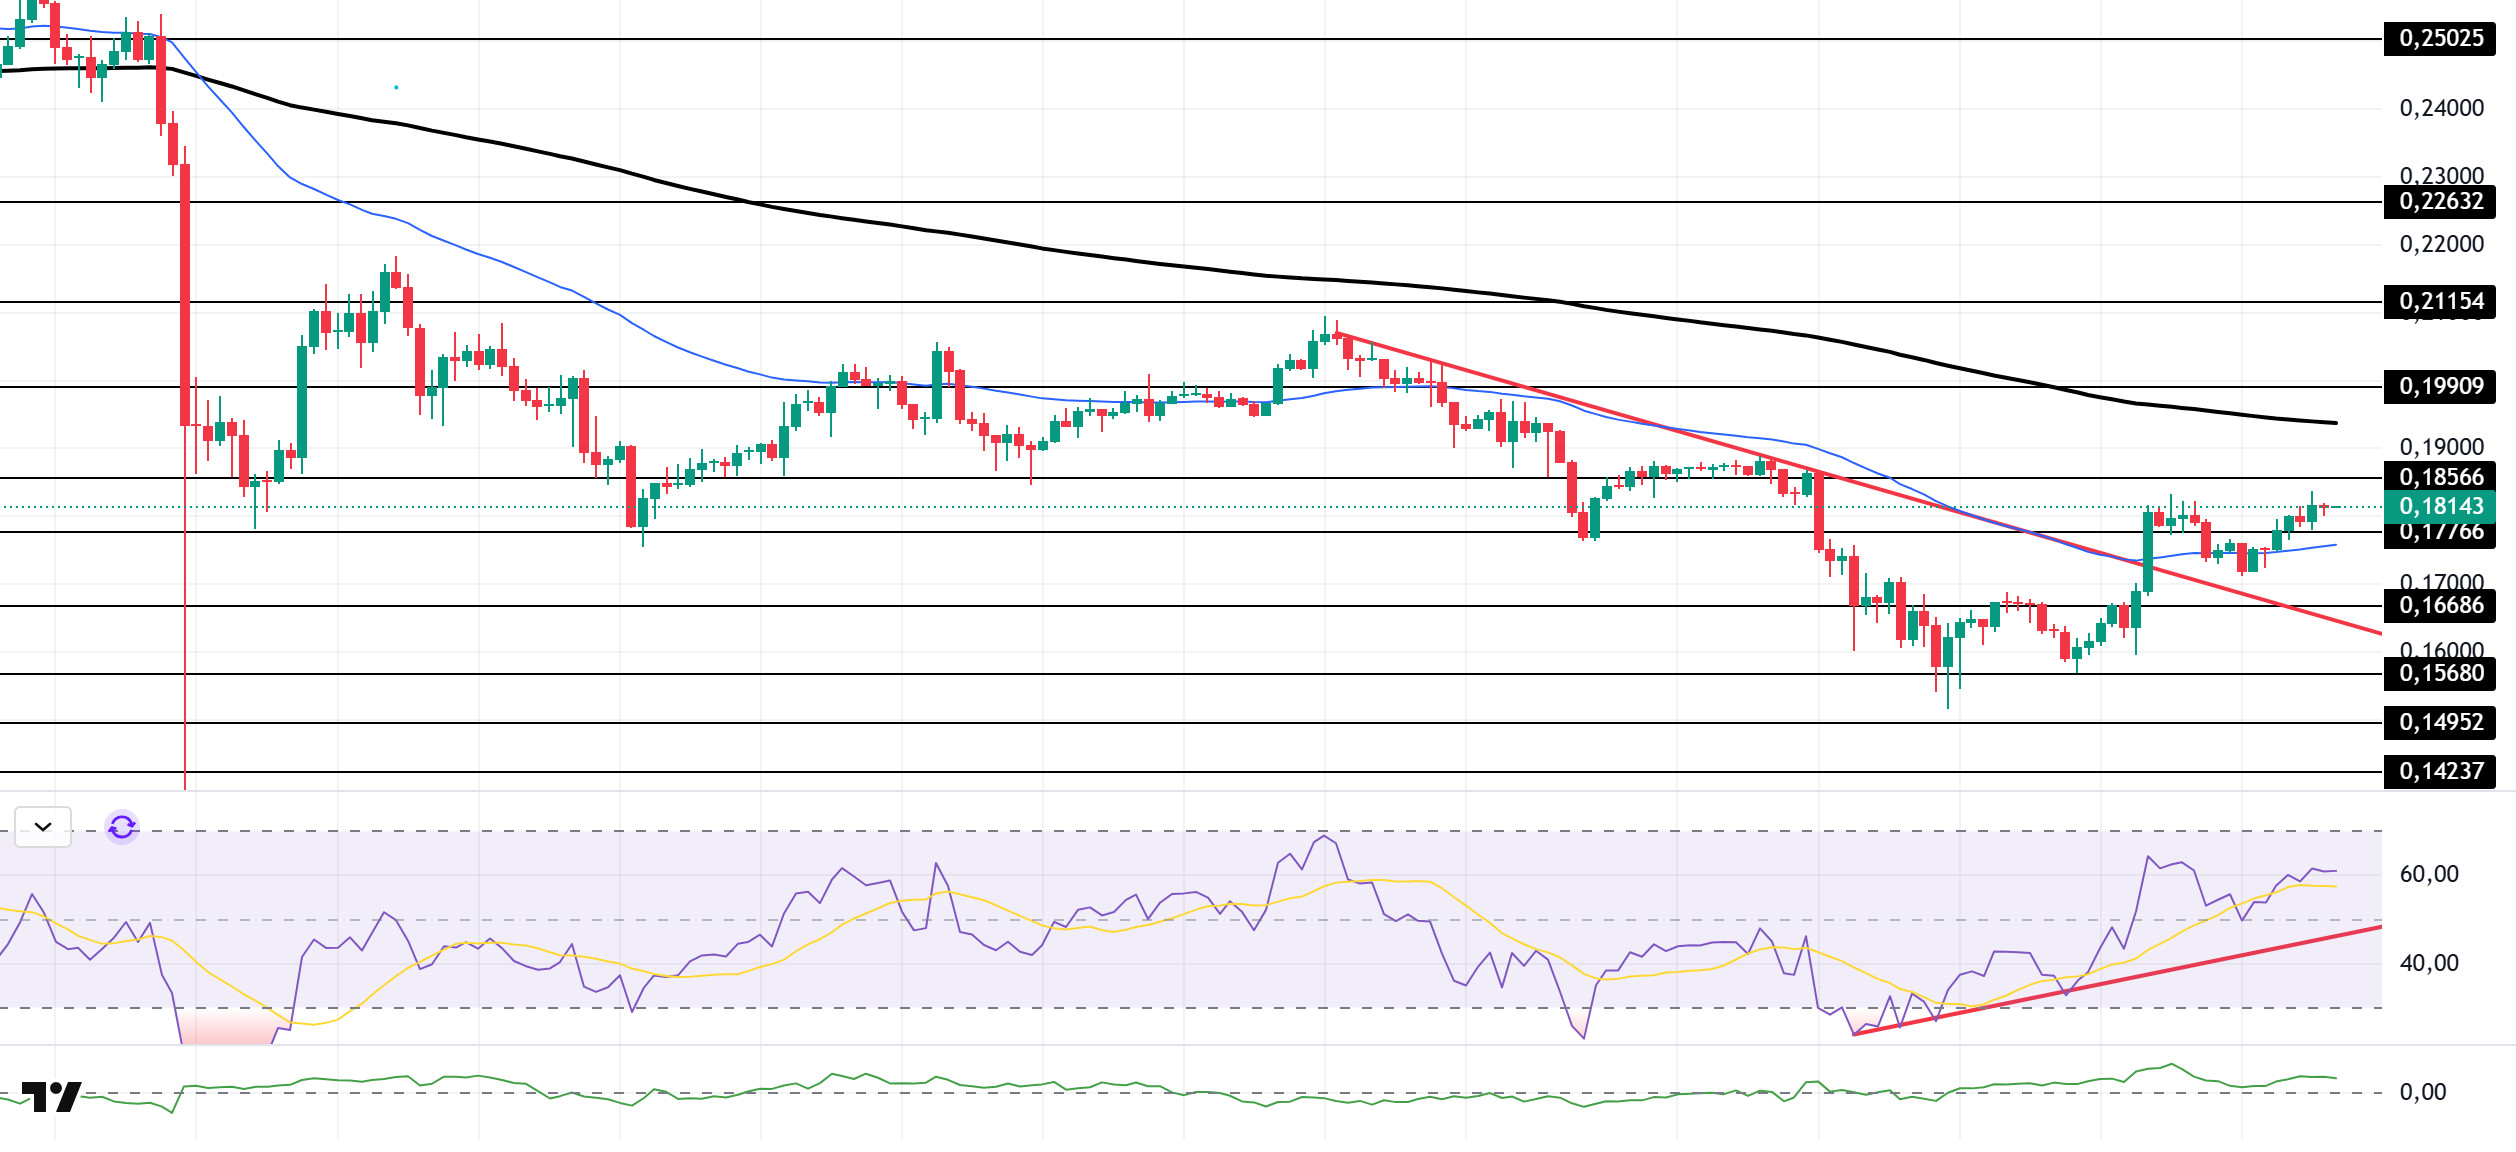
The DOGE price experienced an uptrend. The asset broke above the downward trend that began on October 27 with a strong bullish candle. The price, which continues its upward movement supported by the 50 EMA (Blue Line) moving average, continues to maintain its current level. If the upward trend continues, it may test the 200 EMA (Black Line) moving average as resistance. In case of a pullback, it may retest the 50 EMA moving average.
On the 4-hour chart, the 50 EMA (Exponential Moving Average – Blue Line) remained below the 200 EMA (Black Line). This indicates that a downtrend may begin in the medium term. The price being between the two moving averages indicates that the price is in a decision phase in the short term. The Chaikin Money Flow (CMF-20) continued to be in the positive zone, close to the neutral zone. Additionally, a decrease in money inflows could push the CMF into negative territory. The Relative Strength Index (RSI-14) rose towards the middle of the positive zone. It also remained above the upward trend that began on November 3. These developments signaled buying pressure. In the event of potential increases driven by political developments, macroeconomic data, or positive news flow within the DOGE ecosystem, the $0.19909 level stands out as a strong resistance zone. Conversely, in the event of negative news flow, the $0.16686 level could be triggered. A decline to these levels could increase momentum and initiate a new wave of growth.
Supports: 0.17766 – 0.16686 – 0.15680
Resistances: 0.18566 – 0.19909 – 0.21154
LTC/USDT
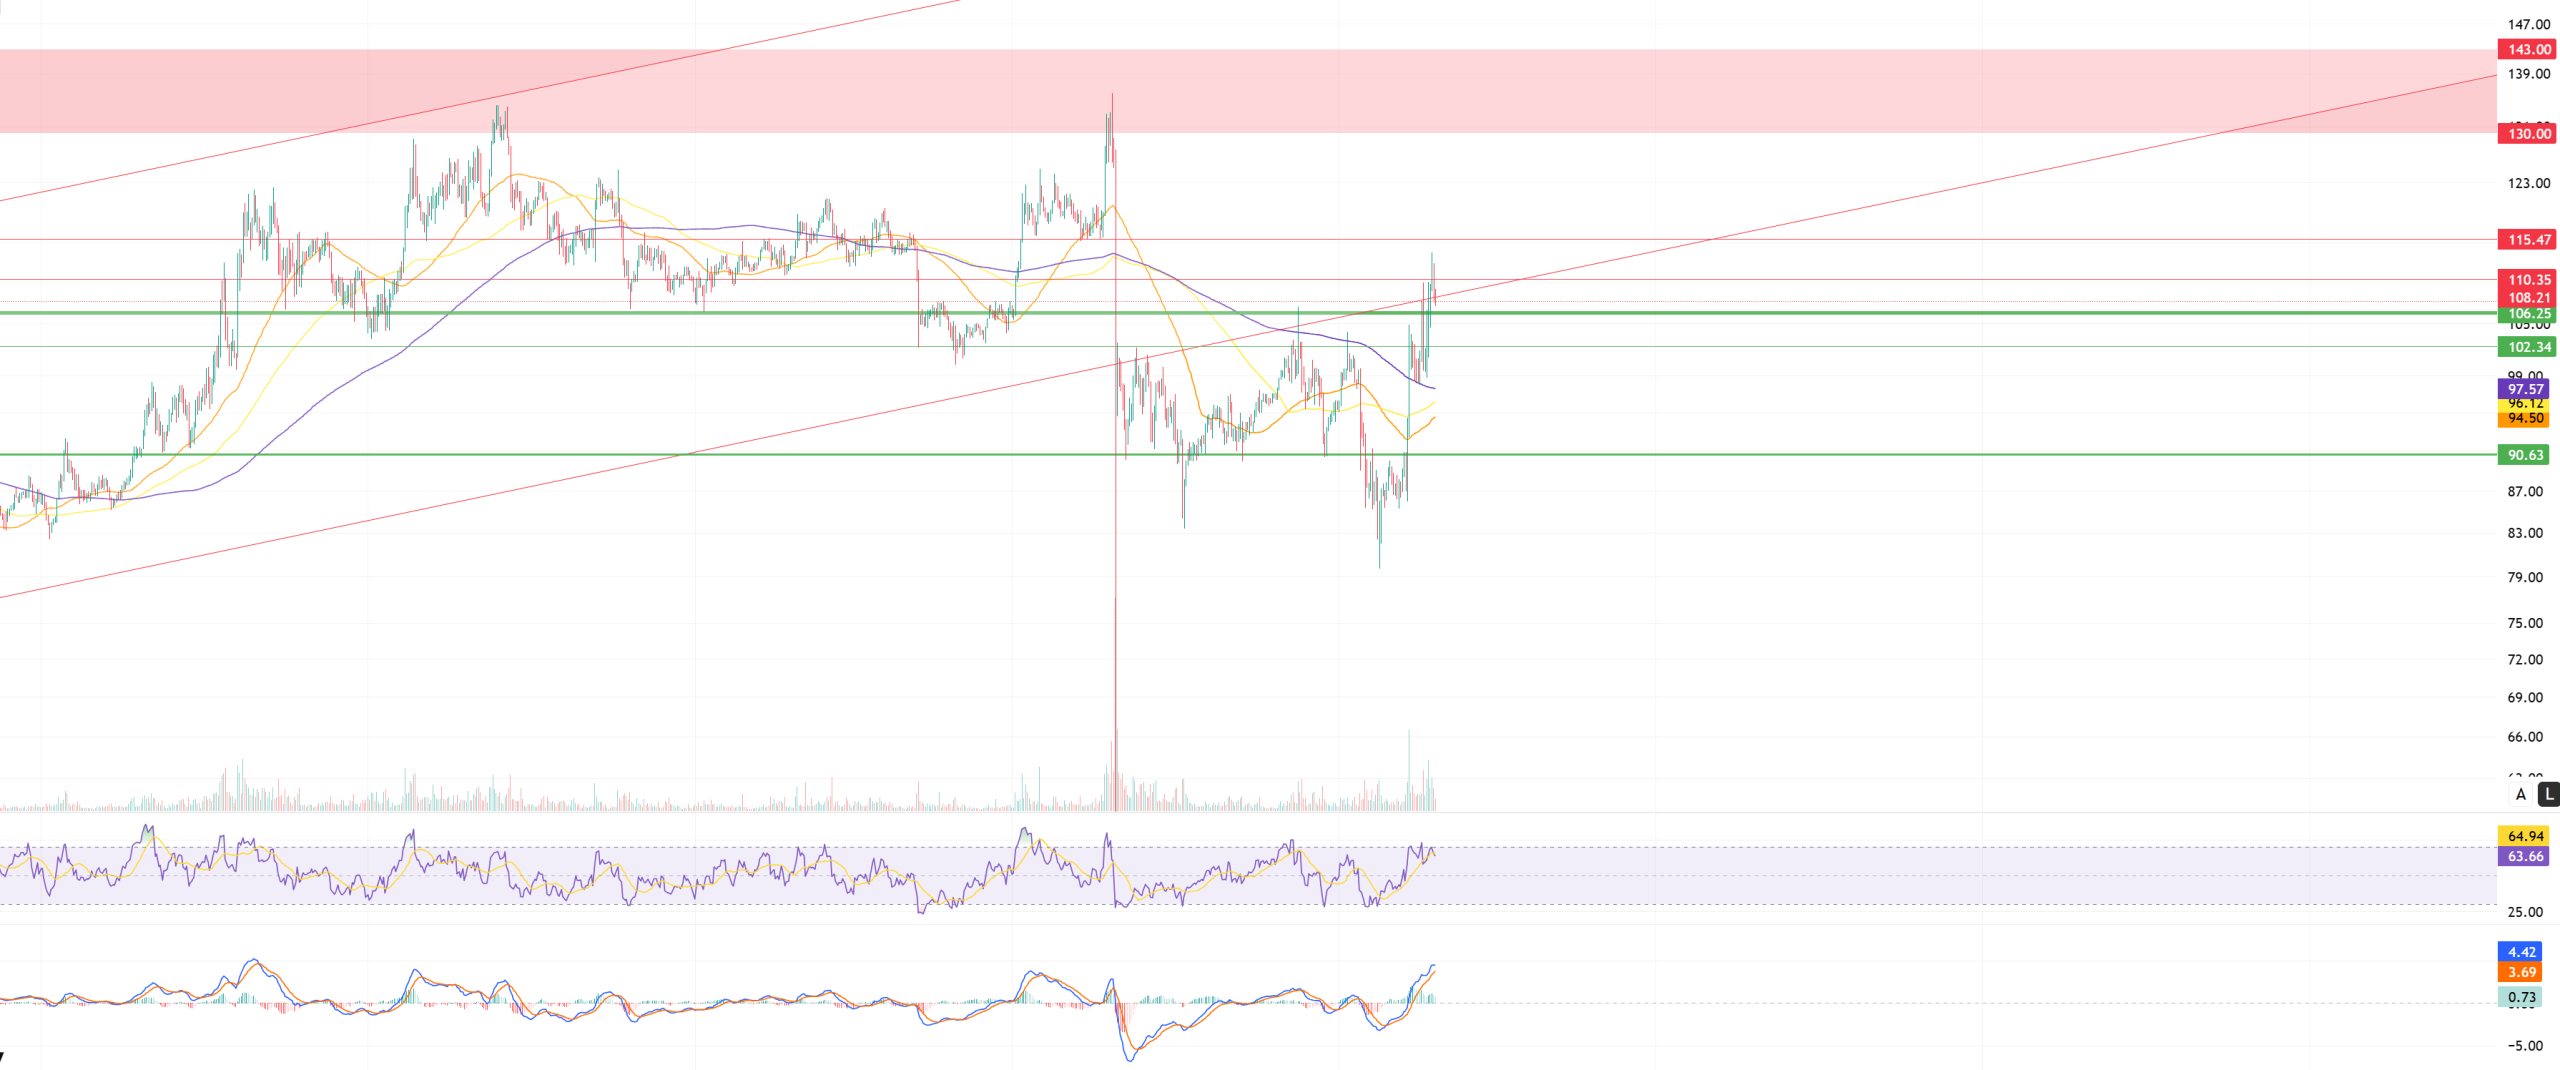
The price movements in the Litecoin (LTC) / USDT pair closed the previous day with a 3.14% increase in value. During the same period, LTC showed a 0.77% increase compared to Bitcoin, indicating that Litecoin increased its own value above the market average in addition to the rise experienced by Bitcoin. On the futures side, the long/short position ratio opened in the last 24 hours being at 0.9798 reveals that derivative market participants’ expectations for a decline are slightly heavier. In addition, funding rates are in the neutral zone.
Technically, examining Litecoin’s 4-hour USDT pair chart, the price continues above all moving averages but below the rising trend, indicating that short positions dominate the derivatives market, but the overall expectation is technically at a decision point. Although the overall investor sentiment is currently bearish, upward movements are also technically possible. If this possibility materializes, the first point where the rise could be suppressed is one of the former supports at the 108.21 level and the resistance at the lower band of the rising trend. Potential rejections could be observed at this level. Then, the 110. 35 level emerges as another important level that could create horizontal selling pressure. Finally, the horizontal level at 115.47 is among the potential selling points anticipated for the first half of the day.
If the decline occurs in line with expectations, the 106.25 level could be seen as a stage where the price may find its first support and short positions could be closed. If the price remains below this level, the 102.34 level stands out as a strong and critical support point. A downward break of the critical support could create an intermediate zone on the 4-hour chart, where the 50-100-200 period moving averages (Orange-Yellow-Purple) could support price retention, but it would not change the main support at 90.63.
Supports: 106.25 – 102.34 – 90.63
Resistances: 108.21 – 110.35 – 115.47
BNB/USDT
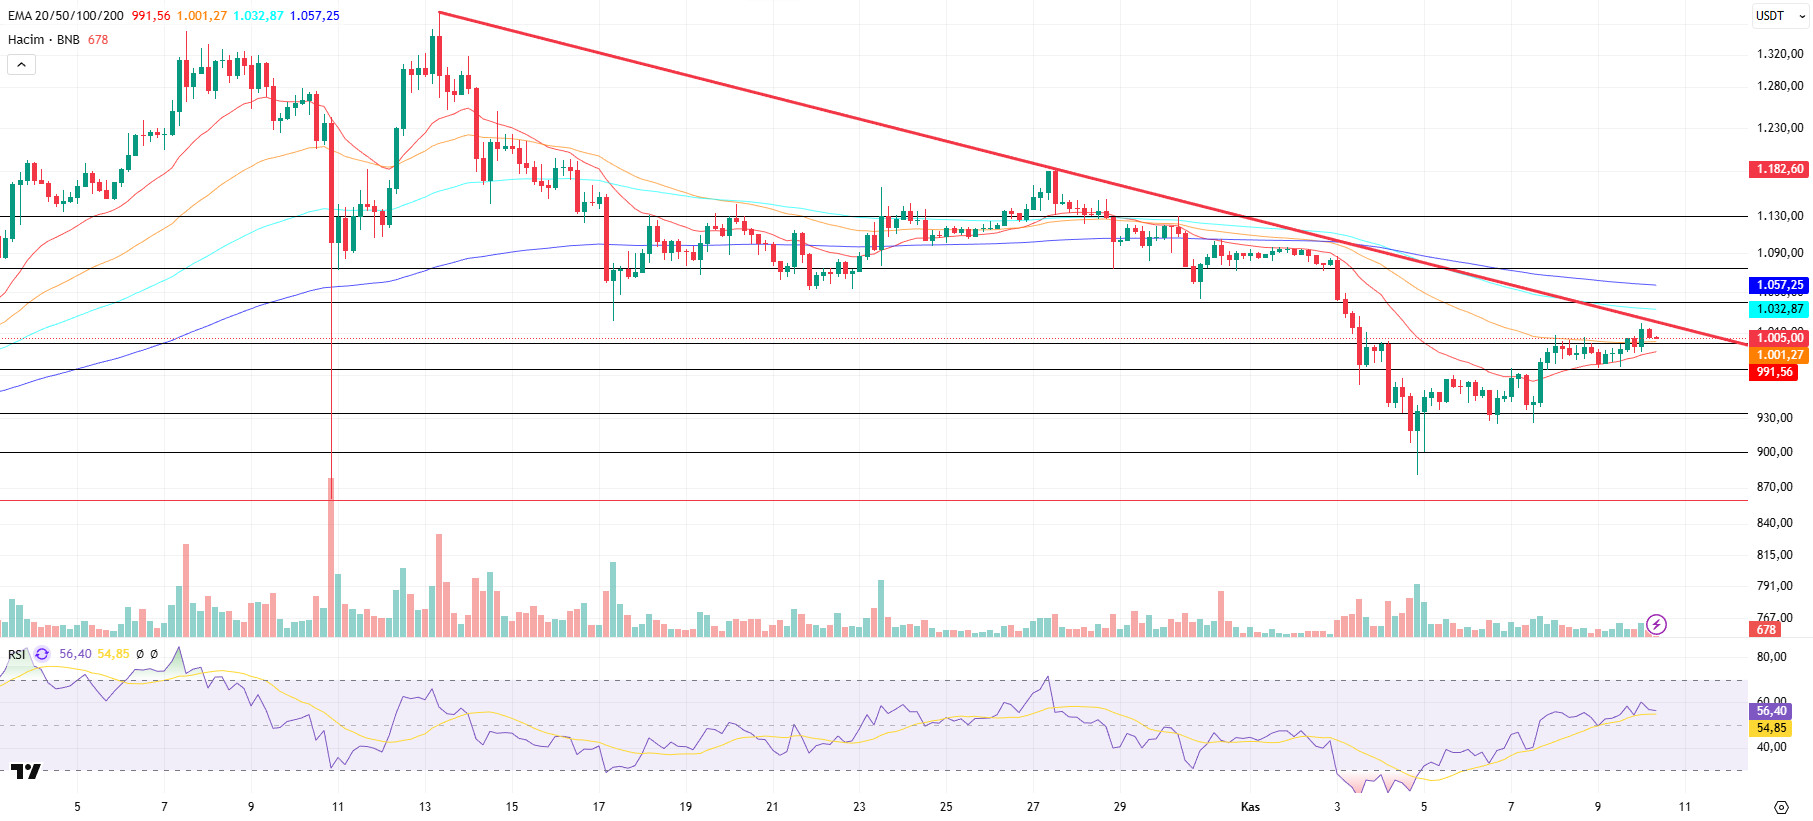
From a technical perspective, the correction that began after the all-time high (ATH) resulted in a pullback to the $900 support zone identified in previous technical analyses. After seeking support above these levels for a while, the asset ended its downward momentum with the new candles that formed and turned its direction upward again. With this rise, the price showed positive acceleration up to the falling trend zone.
Currently, BNB/USDT has broken through the psychological price level of $1,100 and is showing a positive outlook, but it has encountered resistance below the downtrend line and is now searching for direction.
Technical indicators for BNB, currently trading in the $1,000–1,040 range, suggest that the positive trading volume observed in recent rallies is supporting the upward momentum. Additionally, the Relative Strength Index (RSI) indicator has risen above the 50 level due to recent buying pressure, strengthening its positive outlook with support from this level.
Based on the current technical picture, if buying appetite is maintained and market momentum recovers, BNB is expected to break above the falling trend line in the first stage. If the downward trend is broken upward and sustainability is achieved at this level, the price is likely to retest the $1,040 resistance level. If this level is exceeded, it is technically possible for the price to rise towards the $1,075 and $1,130 levels, respectively.
On the other hand, if selling pressure increases again, the price is expected to test the psychological support level of $1,000. If this level is broken downward, the price may retreat to the support zones of $975 and $935, respectively.
Supports: 1,000 – 975 – 935
Resistances: 1,040 – 1,075 – 1,130
ADA/USDT
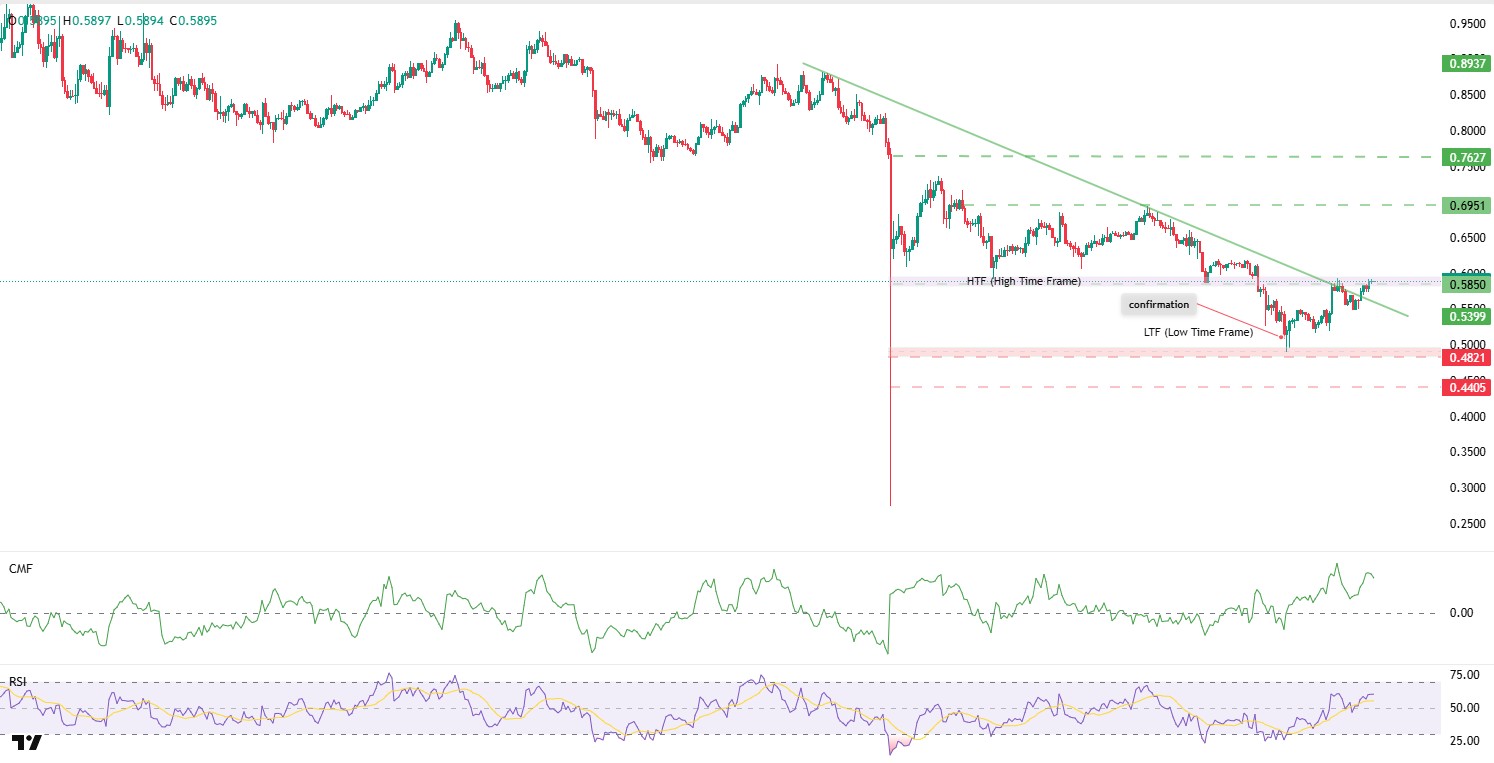
ADA started the first half of the day with a decline but rose 4.76% within 24 hours, showing its first reaction to the downtrend. Entering a minor uptrend and maintaining stability above the $0.5800 level, it is waiting for liquidation at $0.5975 levels with 179,588 ADA.
The Relative Strength Index (RSI-14) rose to 60 levels, giving a bullish signal along with the Chaikin Money Flow (CMF-20). The increase in cash inflows may keep the CMF in positive territory. With intraday gains, the price has reached the Fibonacci level of $0.5850 again. The price rising to the resistance point of $0.6951 can be monitored as an important resistance level. If the price reaches this area, it may indicate that the upward trend could continue in the medium term.
If there is an increase due to macroeconomic data or positive news related to the Cardano ecosystem, the $0.7627 level stands out as a second strong resistance point. If this level is broken upwards, the increase is expected to continue.
If Trump and FED members make statements during the day and volatility in the market decreases as a result of macroeconomic data, the ADA price is expected to return to the lowest time frame (LTF) level of $0.4821 with increased selling pressure. In this scenario, the price intersects with the confirmation zone, which is the entry zone of the low time frame (LTF), at the $0.4405 level. This technically increases the importance of the zone.
Supports: $0.3896 – $0.4455 – $0.4821
Resistances: 0.6951 – 0.7627 – 0.7985
Legal Notice
The investment information, comments, and recommendations contained herein do not constitute investment advice. Investment advisory services are provided individually by authorized institutions taking into account the risk and return preferences of individuals. The comments and recommendations contained herein are of a general nature. These recommendations may not be suitable for your financial situation and risk and return preferences. Therefore, making an investment decision based solely on the information contained herein may not produce results in line with your expectations.

