
Technical Analysis
BTC/USDT
The third quarter GDP data for the US economy exceeded expectations, confirming the resilience of domestic demand, while the dollar index showed a marked strengthening after the announcement. At the same time, supportive statements from the US administration regarding the integration of crypto assets into the financial system came to the fore, while Trump’s comments on unemployment data brought discussions about economic policies back to the agenda.
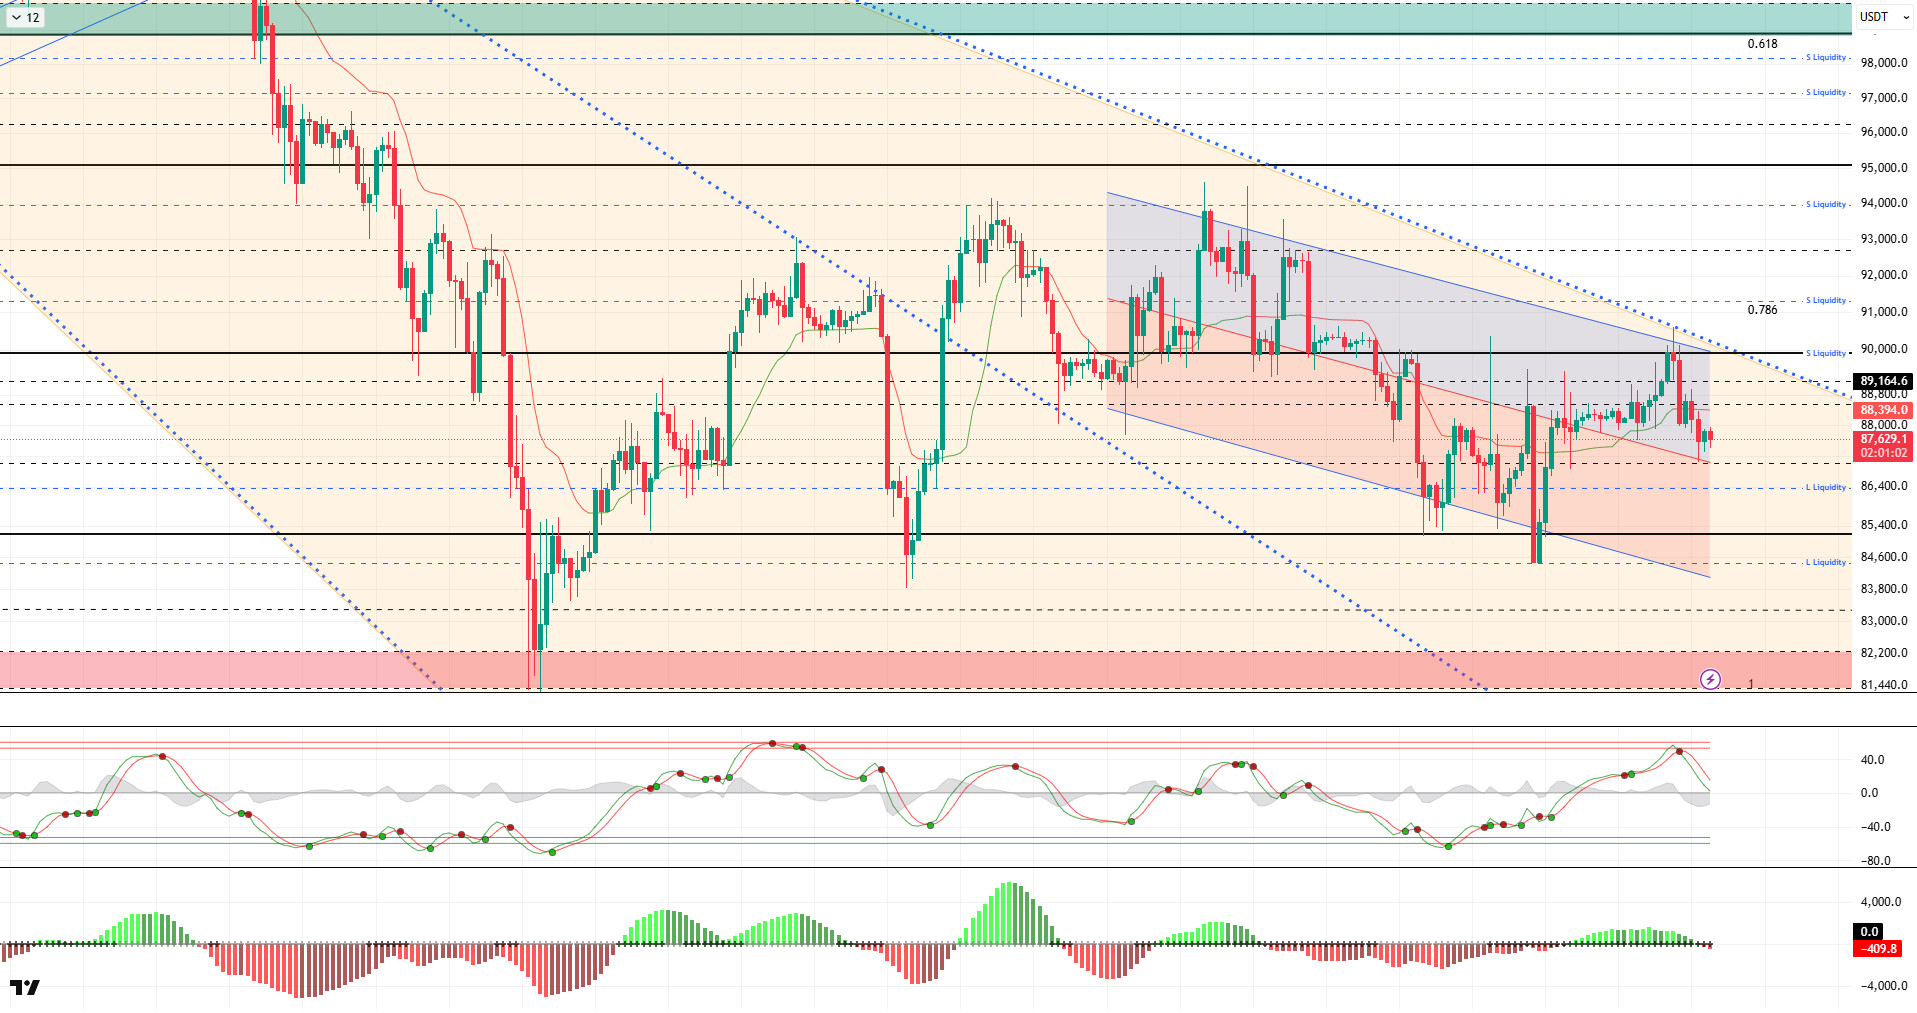
From a technical perspective, BTC failed to gain the 90,000 reference area and subsequently sold off, retreating to the 87,000 level. The price continued to trade slightly bearish during the day, and in the extended version of the minor trend structure, the medium-term trend was observed to be declining. Consequently, the price recorded a slight recovery as the trend’s middle line acted as support. At the same time, the 87,000 level, which we use as a support point, appears as the last obstacle before the trend’s lower red band.
Technical indicators show that the Wave Trend (WT) oscillator has given a sell signal in the overbought zone, and the price has declined accordingly. The histogram on the Squeeze Momentum (SM) indicator weakened significantly in the positive zone and moved into negative territory, aligning with the oscillator. The Kaufman Moving Average (KAMA) is currently hovering just above the price at the $88,393 level.
Looking at liquidation data, after the recent rise in BTC, fragmented buy levels formed at 84,000 and then 86,000. In contrast, sell levels resulted in liquidation at the 90,000 level. In a broader time frame, heavy accumulation continues above the 91,000 level.
In summary, the US third-quarter growth data, which exceeded expectations and is the focus of the markets, has once again reduced the likelihood of a Fed interest rate cut. On the global geopolitical front, Trump’s Greenland remarks and the Russia-Ukraine conflict are in the spotlight. Meanwhile, as we approach the end of the year, the Christmas lull in the markets is noticeable, and the year-end tax exemption situation may cause shares to change hands. Technically, BTC continues to price with the indecisive structures it has formed, and no clear upward movement has yet emerged.When examining liquidity data, it is seen that areas with concentrated short-term transactions are being targeted, while long-term selling levels have not yet been tested. After this stage, the 89,000 level will be monitored as a critical point where the major upward trend passes, for the price to regain momentum. Closes and price action above this level are important indicators for regaining momentum. If selling pressure deepens, 86,000 emerges as a short-term liquidity area, while the 85,000 level is an important reference point.
Supports: 86,300 – 85,000 – 84,400
Resistances: 88,000 – 89,000 – 90,000 –
ETH/USDT
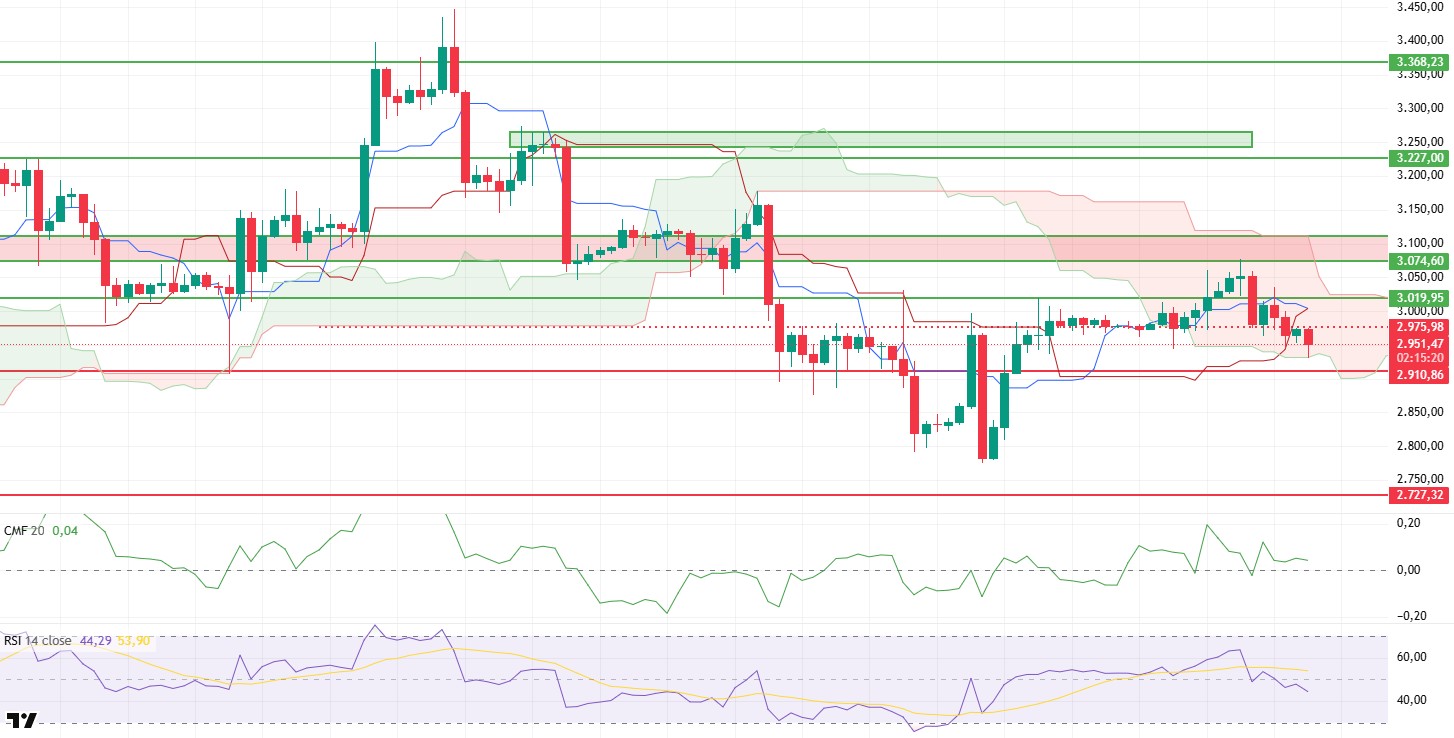
Although the ETH price tried to continue its upward movement during the day, it failed to break through the intermediate resistance at the $2,975 level. Following the sell-off in this region, the release of the U.S. Gross Domestic Product (GDP) data, which came in above expectations at 4.3%, accelerated the selling pressure, and the price retreated to the $2,931 level, which corresponds to the lower band of the Kumo cloud. This movement following the macro data indicates that risk appetite in the market has weakened in the short term and buyers have taken a back seat.
The liquidity outlook is not completely deteriorated, but signs of weakening are increasing. Although the Chaikin Money Flow (CMF) indicator remains in positive territory, it continues its downward movement. This structure indicates that liquidity outflows from the market have begun, albeit limited. While the CMF is not yet at an alarming level, it is clear that there is currently no liquidity flow strong enough to support further gains.
The Strength Index (RSI) continues to decline, revealing a continued loss of momentum. The RSI remaining below the 50 level suggests that buyers have lost control and upward moves are becoming increasingly difficult. Unless momentum recovers, it seems unlikely that the price will return to resistance levels.
The technical outlook indicates increased risks on the Ichimoku indicator side. The recent pullback, coupled with the intersection of the Tenkan and Kijun levels, signals that downward pressure is intensifying. The price approaching the lower band of the Kumo cloud creates a critical threshold. If this band is breached downward, the likelihood of intensified selling and a faster decline may increase.
The main focus in the current picture is the $2,931 level. Closings below this region could strengthen the bearish scenario in technical terms. Conversely, if this level is maintained and the price breaks above $3,020 again, an upward trend ( ) could continue. At this stage, liquidity is limited, momentum is weak, and the technical structure is in a delicate balance.
Supports: 2,910 – 2,727 – 2,625
Resistances: 3,019 – 3,074 – 3,227
XRP/USDT
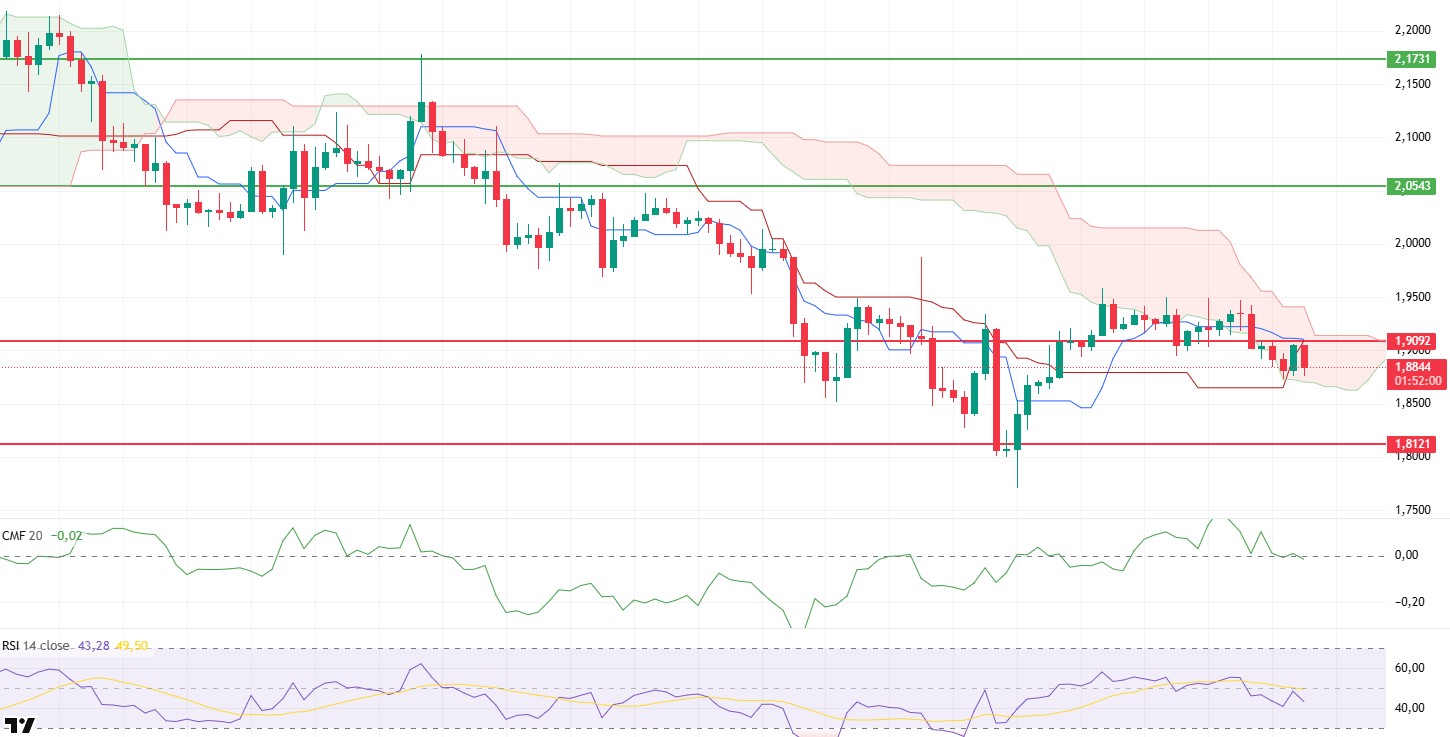
The XRP price rose to the $1.90 level during the day with an attempt to recover but then retreated again with selling pressure from this region following the announcement of the US Gross Domestic Product (GDP) data, which came in above expectations at 4.3%. Increased selling pressure after the macro data brought the price back down to the $1.88 level. The failure to break above $1.90 indicates that upward momentum remains weak and buyers have been unable to establish a foothold in this region.
The liquidity outlook has worsened further. The Chaikin Money Flow (CMF) indicator has fallen into negative territory, signaling accelerated liquidity outflows. The increase in capital leaving the market clearly explains why the intraday rally attempt fizzled out so quickly. As long as liquidity remains this weak, it seems unlikely that the price will sustain upward movements.
The picture on the momentum front remains unchanged. The Relative Strength Index (RSI) continues to stay below the 50 level, and momentum continues to lose strength. The lack of a clear recovery signal on the RSI side indicates that buyers are still weak and that selling pressure has not been balanced.
The technical outlook has reached a riskier point on the Ichimoku indicator. The approaching intersection of the Tenkan and Kijun levels increases the risk of a short-term decline. Although the price remaining within the kumo cloud provides a temporary balance, pressure towards the lower band of this area is increasing. The lower band of the kumo cloud at the $1.86 level creates a critical threshold for downward movements.
Overall, the technical structure remains weak. If the $1.86 level is lost, selling could intensify, and a deeper pullback could be on the cards. Conversely, if the price regains the $1.90 level, it could weaken the current negative outlook and create room for a short-term rebound. Under current conditions, liquidity outflows, weak momentum, and a fragile technical structure indicate that a cautious stance should be maintained on the XRP side.
Supports: 1.8121 – 1.6224 – 1.5146
Resistances: 1.9092 – 2.0543 – 2.1731
SOL/USDT
The Solana Foundation launched Kora, a fee relay and signature node. OpenEden announced that it is bringing cUSDO, a regulated, yield-bearing stablecoin fully backed by tokenized US Treasury bonds, to the Solana ecosystem.
The SOL price traded sideways during the day. The asset remained in the upper region of the downtrend that began on October 8. The price, which experienced a pullback after encountering resistance from the 50 EMA (Blue Line) moving average, is currently testing the downtrend as support. If the candle closes below this level, the $120.24 level can be monitored. In the event of an uptrend, it may test the 200 EMA (Black Line) moving average as resistance.
On the 4-hour chart, it continued to remain below the 50 EMA (Exponential Moving Average – Blue Line) and 200 EMA (Black Line). This indicates that it may be in a downtrend in the medium term. At the same time, the price being below both moving averages indicates that the asset is trending downward in the short term. The Chaikin Money Flow (CMF-20) remained in positive territory. However, a slight decrease in money inflows could push the CMF to neutral levels. The Relative Strength Index (RSI-14) fell from the positive zone to the negative level after encountering direct resistance starting on December 3. This signaled increased selling pressure. If there is an upturn due to macroeconomic data or positive news related to the Solana ecosystem, the $138.73 level stands out as a strong resistance point ( ). If this level is broken upwards, the rise is expected to continue. If there are pullbacks due to developments in the opposite direction or profit-taking, the $112.26 level could be tested. If there is a decline to these support levels, an increase in buying momentum could present a potential upside opportunity.
Supports: 120.24 – 112.26 – 100.34
Resistances: 127.21 – 133.74 – 138.73

DOGE/USDT
The DOGE price traded slightly sideways during the day. The asset remained below the 50 EMA (Blue Line) moving average, signaling continued pullback pressure. Unable to break through the strong resistance level of $0.13367, the price retreated and is currently trading below the 50 EMA moving average. If the pullback continues, it may retest the $0.12824 level as support. If it rallies, the $0.13367 level should be monitored.
On the 4-hour chart, the 50 EMA (Exponential Moving Average – Blue Line) remained below the 200 EMA (Black Line). This indicates that the downtrend may continue in the medium term. The price being below both moving averages indicates a downward trend in the short term. The Chaikin Money Flow (CMF-20) remained at a neutral level. Additionally, a decrease in money inflows could push the CMF into negative territory. The Relative Strength Index (RSI-14) maintained its position in negative territory. It also remained below the upward trend that began on December 18. This signaled increased selling pressure. On the other hand, positive divergence remains valid. In the event of potential increases driven by political developments, macroeconomic data, or positive news flow within the DOGE ecosystem, the $0.14237 level stands out as a strong resistance zone. Conversely, in the event of negative news flow, the $0.12282 level could be triggered. A decline to these levels could increase momentum and initiate a new wave of growth.
Supports: 0.12824 – 0.12282 – 0.11797
Resistances: 0.13367 – 0.14237 – 0.14952

BNB/USDT
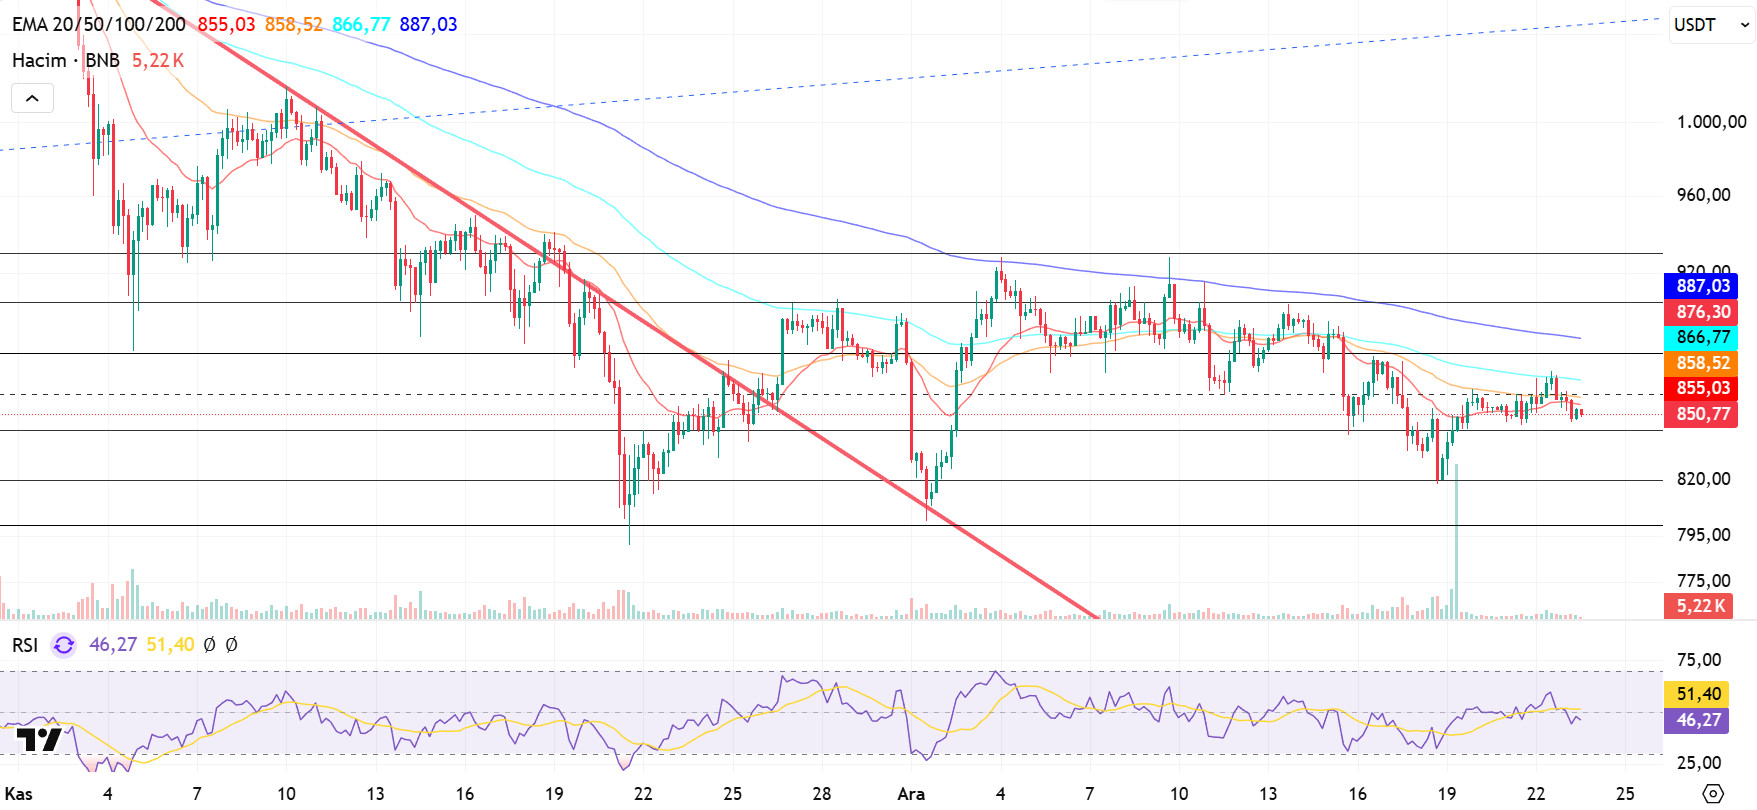
From a technical perspective, BNB/USDT, which had been searching for support for a while, ended its downward momentum with the candlestick formations that formed and turned its direction back up. With this recovery process, BNB broke the downward trend with the support provided by the new candlesticks and rose to the $940 level. Although limited pressure is observed in this region depending on market conditions, the overall positive outlook is maintained.
The current outlook for BNB/USDT is generally positive. However, the price moving within a horizontal band raises questions about which direction it will continue in the coming period. Upward price movements are expected to reinforce the current positive outlook.
Technical indicators for BNB, currently trading in the $845-$880 range, show that low trading volumes are limiting the upward momentum. In addition, the RSI indicator appears to be hovering at relatively low levels due to weak momentum.
According to the technical picture, if selling pressure increases, the price is expected to retest the $845 support level. If this level is broken, a pullback towards the $820 and $800 support zones will be on the agenda.
Conversely, if buying appetite is maintained and market momentum strengthens, BNB is expected to retest the $880 resistance level in the first stage. If this level is exceeded, it is likely that the falling trend line will be broken, and if the trend is broken and the price remains above this level, a rise towards the $905 and $930 levels appears technically possible.
Supports: 845 – 820 – 800
Resistances: 880 – 905 – 930
LTC/USDT
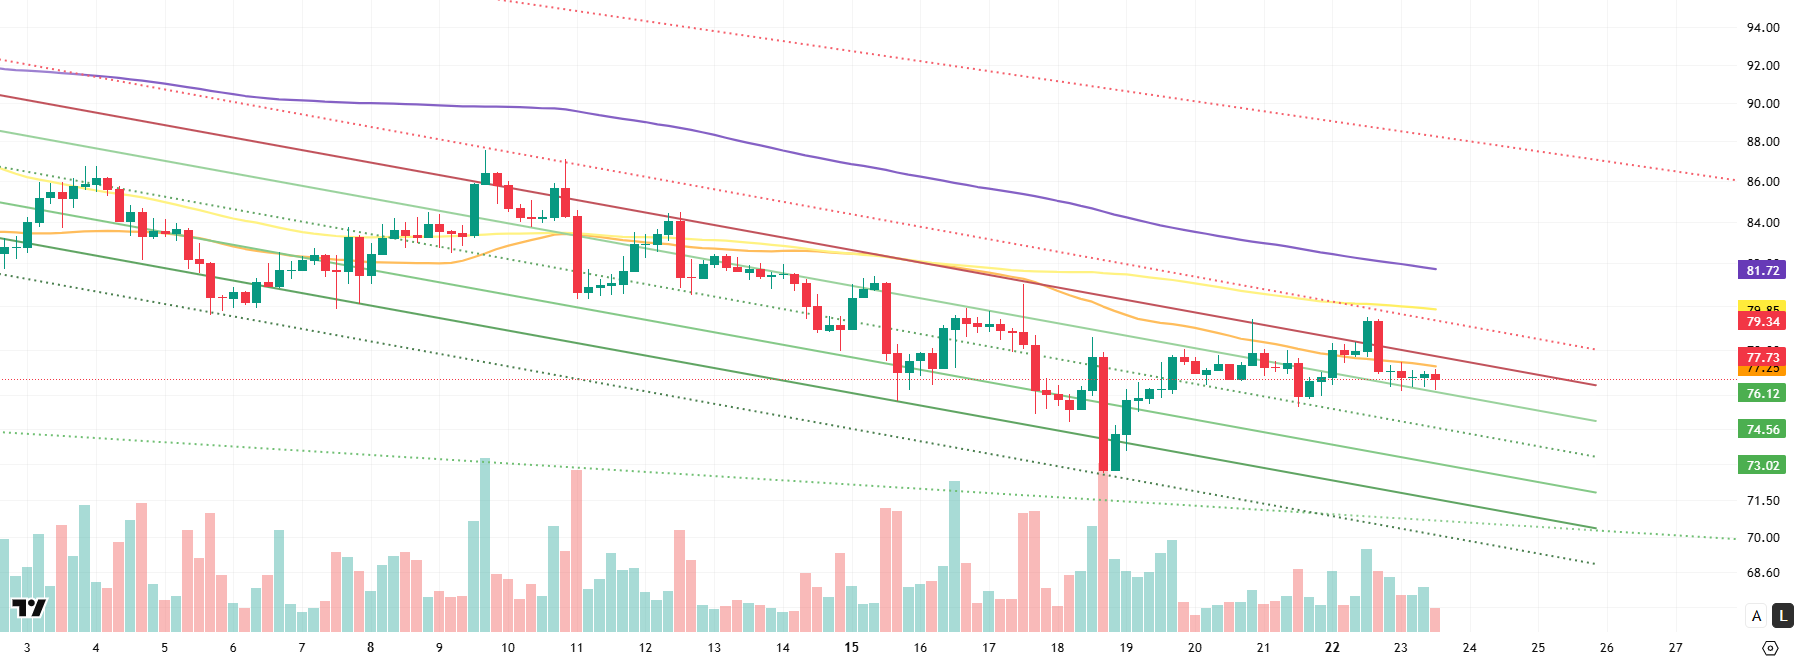
The price movements in the Litecoin (LTC) / USDT pair continued with a 0.47% loss in value for the day. At the same time, LTC’s 0.46% gain against Bitcoin indicates that Litecoin performed relatively stronger against Bitcoin despite the general market movements. On the futures front, the long/short position ratio over the last 24 hours increased from 0.9461 to 0.9516, indicating that bearish expectations among derivatives market participants continue, albeit at a slightly reduced level.
A technical analysis of Litecoin’s 4-hour USDT pair shows that the price is trading below the 200, 100, and 50-period moving averages (purple, yellow, and orange lines, respectively). This outlook is consistent with the increase in short positions relative to long positions in the derivatives markets, confirming that the main trend has regained downward momentum.
However, the current structure also holds the potential to transition to a neutral outlook and potentially evolve into a positive one. In this scenario, the first strong resistance level that the upward movement may encounter is expected to be the 50-period moving average at the 77.25 level. This level, which is a horizontal resistance level, stands out as the first critical step towards neutralizing the negative outlook. If this level is breached, 77.73 will come into focus as another important falling trend resistance to monitor intraday. Should the uptrend gain momentum and head towards the 79.34 level, it is likely that the movement will remain limited, as seen in previous attempts, due to the influence of the 100-period moving average.
If the decline continues, the first important support level is monitored at 76.12. The possibility of this region also being a retest area provides a stronger structure in terms of support. However, if a downward breakout occurs, selling pressure is expected to increase, bringing the support levels of 74.56 and 73.02 into focus. The 73.26 level, in particular, holds strong reaction potential as it is located in the middle of the channel structure.
Supports: 76.12 – 74.56 – 73.02
Resistances: 77.25 – 77.73 – 79.34
LEGAL NOTICE
The investment information, comments, and recommendations contained herein do not constitute investment advice. Investment advisory services are provided individually by authorized institutions taking into account the risk and return preferences of individuals. The comments and recommendations contained herein are of a general nature. These recommendations may not be suitable for your financial situation and risk and return preferences. Therefore, making an investment decision based solely on the information contained herein may not produce results in line with your expectations.

