
Technical Analysis – October 08, 2025
BTC/USDT
As the US government shutdown continues, October 15 stands out as a critical date. While it is noted that a prolonged shutdown could cause lasting damage to economic activity, the White House announced that there is no guarantee of back pay for federal employees. While Fed members remain divided on interest rate cuts, Governor Milan supported an additional 50 basis point cut, while Minneapolis Fed President Kashkari opposed early easing. The New York Fed survey pointed to an increase in inflation expectations, while the government shutdown also slowed crypto regulation efforts. Meanwhile, BlackRock IBIT has been buying Bitcoin nonstop for seven weeks, reaching a total of 54,423 BTC.
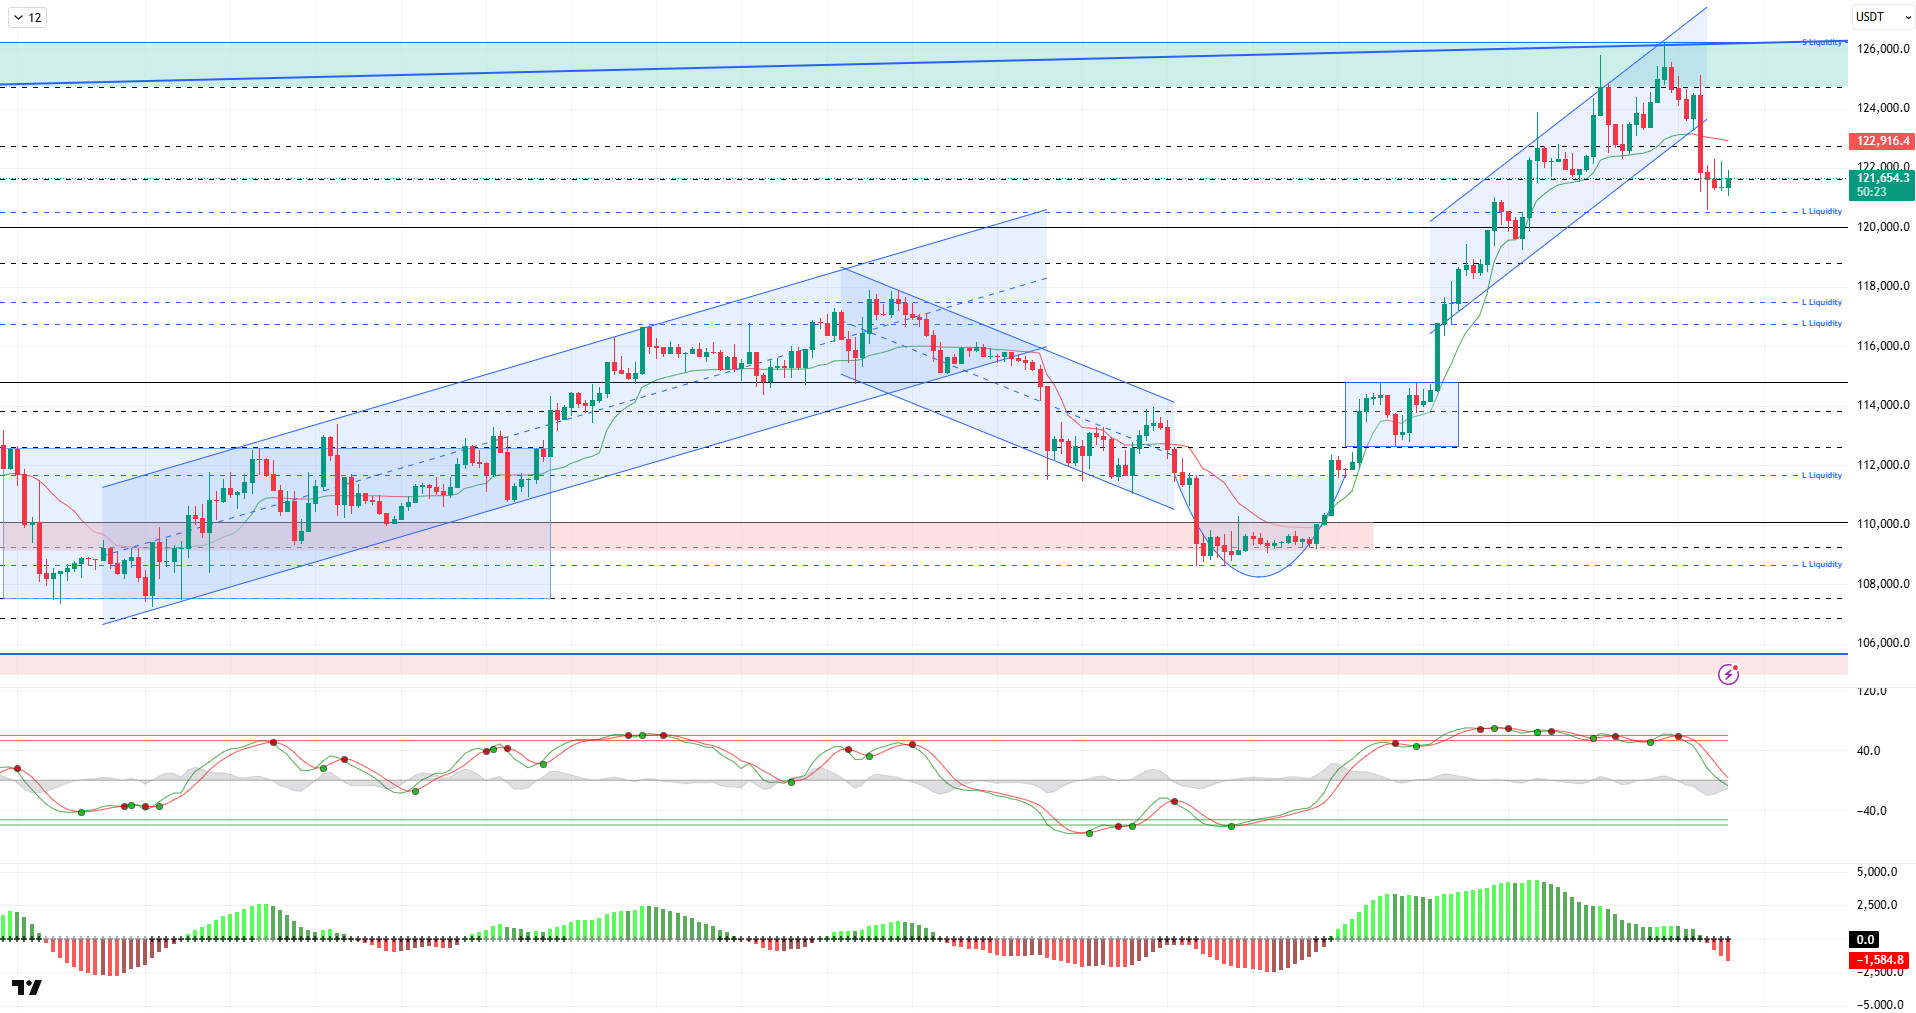
Looking at the technical picture, BTC broke its rising trend structure after correcting following its second peak attempt at the 126,198 level. Breaking through the trend line at 123,700 with high volume, the price tested the critical support level at 120,500. Rebounding from there, the price continues to trade at 121,700 at the time of writing.
Technical indicators show that the Wave Trend oscillator (WT) retreated to the middle band of the channel after giving a sell signal following consecutive buy-sell signals in the overbought zone, indicating indecision. The Squeeze Momentum (SM) indicator’s histogram moved into negative territory with the latest decline. The Kaufman moving average is currently trading above the price at 122,900.
Looking at liquidation data, the sell-off began to reappear with the recent upward movement, and heavy accumulation was recorded at the 126,400 level. In contrast, the buy-off was liquidated above the 120,500 level, and heavy accumulation was observed again at the 120,500 level. Furthermore, buying intensity continues at the 117,800 and 116,600 levels. Looking at the liquidation amount over the last 24 hours, buy-side transactions amounted to $119 million, while sell-side transactions amounted to $39 million. The total market recorded $666 million.
In summary, the rise in BTC is supported by institutional demand from ETFs, expectations of Fed interest rate cuts, correlation with gold, and cyclical movements in October. The technical outlook reached saturation point as the price tested the 126,198 ATH level, while liquidity data pushed the price into a correction. After this stage, if selling pressure deepens, 120,500 will be monitored as a critical reference area. A break below this level could push the price towards liquidity areas and deepen selling pressure. If the rise continues, 122,700 will be the resistance area.
Supports: 121,400 – 120,500 – 119,000
Resistances: 122,700 – 124,300 – 125,700
ETH/USDT
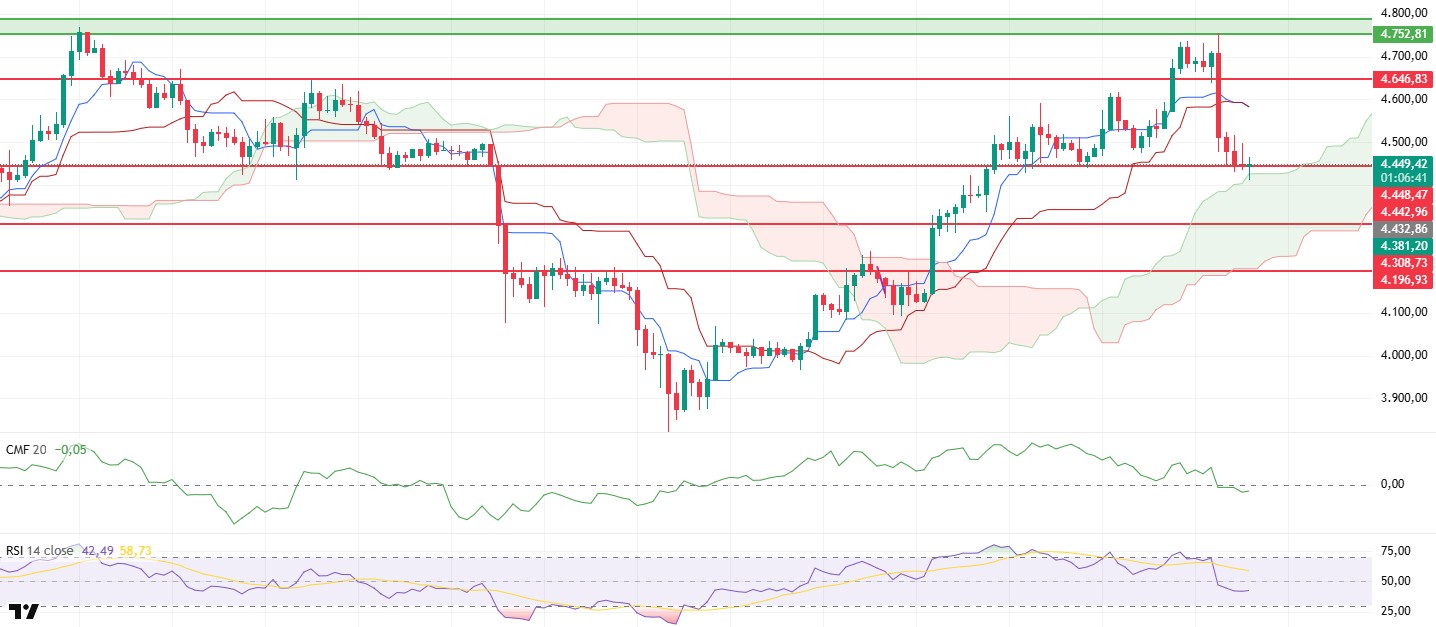
After reaching the $4,752 resistance level yesterday evening, the ETH price experienced a sharp pullback due to intense selling pressure from this area and fell to the $4,448 level. This movement shows that buyers have lost strength in the short term and that sellers have regained control. The rejection above $4,700, in particular, indicates that profit-taking is accelerating in the market and the risk of a short-term correction is increasing.
The Chaikin Money Flow (CMF) indicator, as highlighted in previous analyses, had not fully accompanied the uptrend. With the recent decline, the CMF moved back into negative territory, confirming accelerated liquidity outflows. This pattern signals that investors are exiting the market and that new capital inflows are weakening in the short term. The CMF remaining in negative territory sends a strong signal that selling pressure on prices may continue for some time.
The Relative Strength Index (RSI) indicator also pulled back sharply from the overbought zone, falling below the 50 level. This decline reveals that momentum has weakened significantly and that the market has lost its buyer-favorable momentum. The RSI remaining at these levels suggests that rebound buying may be limited.
According to the Ichimoku indicator, the price breaking below the Tenkan and Kijun levels and the Tenkan crossing below the Kijun signals that the short-term negative trend may continue. However, the price still trading above the kumo cloud indicates that the overall trend maintains its positive structure and that the upward trend persists in a broader timeframe.
In the overall outlook, if the price remains below the $4,448 level, a pullback to the $4,308 region may occur. On the other hand, if the price regains the $4,646 level, it may indicate that short-term risks have decreased, and the market is entering a recovery phase.
Top of Form
Below the Form
Supports: 4,448 – 4,308 – 4,196
Resistances: 4,646 – 4,752 – 4,857
XRP/USDT
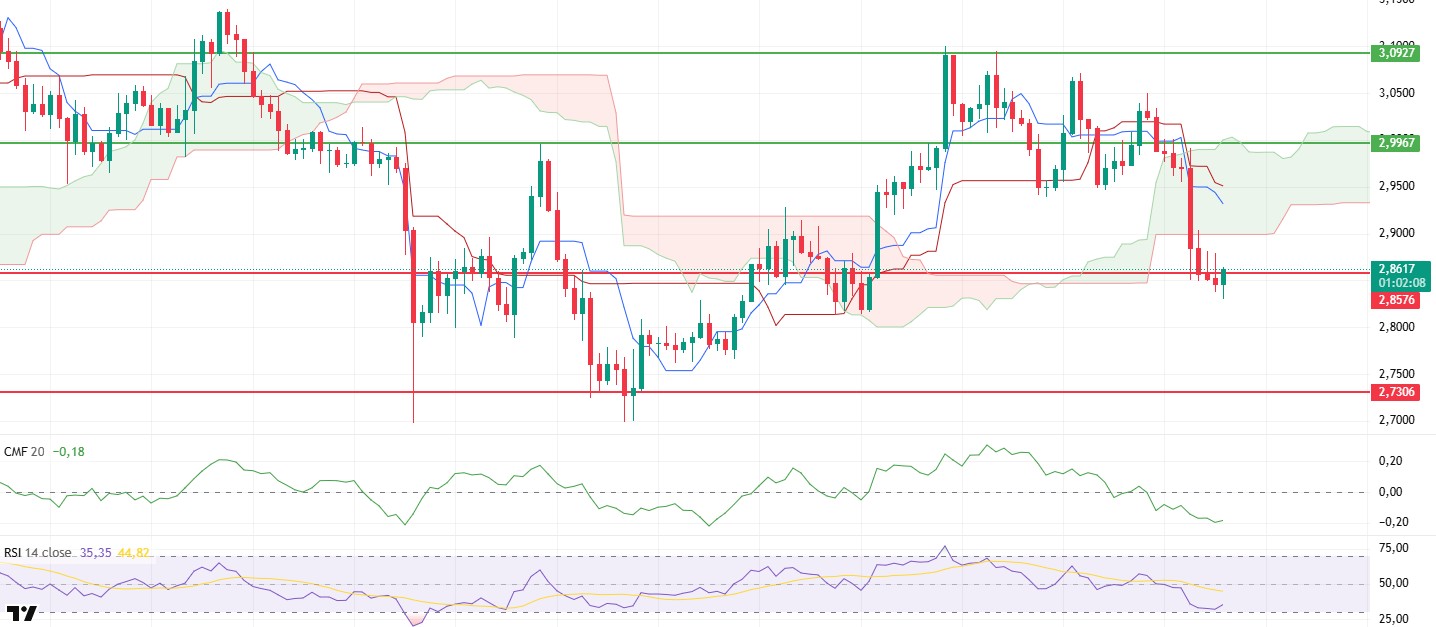
The XRP price failed to hold at the $2.99 level yesterday evening and retreated to the critical support zone of $2.8576 amid strong selling pressure. Although the price is currently trying to hold above this zone, buyers appear weak and selling pressure continues.
The Chaikin Money Flow (CMF) indicator continues its decline in negative territory, confirming the ongoing liquidity outflows. This outlook indicates that capital inflows remain weak and that the selling side is in control of the market. The CMF’s persistence in negative territory makes it difficult for the price to show a sustained recovery.
The Relative Strength Index (RSI) indicator has also fallen sharply to the oversold zone boundary. This pullback indicates that momentum has completely weakened and buyers are reluctant to re-enter the market. The RSI hovering near these levels suggests that potential rebound buying in the short term may be limited.
In the Ichimoku indicator, the price falling below the kumo cloud clearly shows that the overall trend has turned negative. The failure to stay above the Tenkan and Kijun levels indicates that the market has turned downward and sellers are in a dominant position.
Overall, closes below the $2.8576 level could deepen the decline and increase the risk of the price retreating to the $2.80 region. On the other hand, if the price breaks above the $2.99 level again and manages to stay above this region, it could pave the way for a renewed positive trend in the short term.
Supports: 2.8576 – 2.7306 – 2.6513
Resistances: 2.9967 – 3.0927 – 3.1879
SOL/USDT
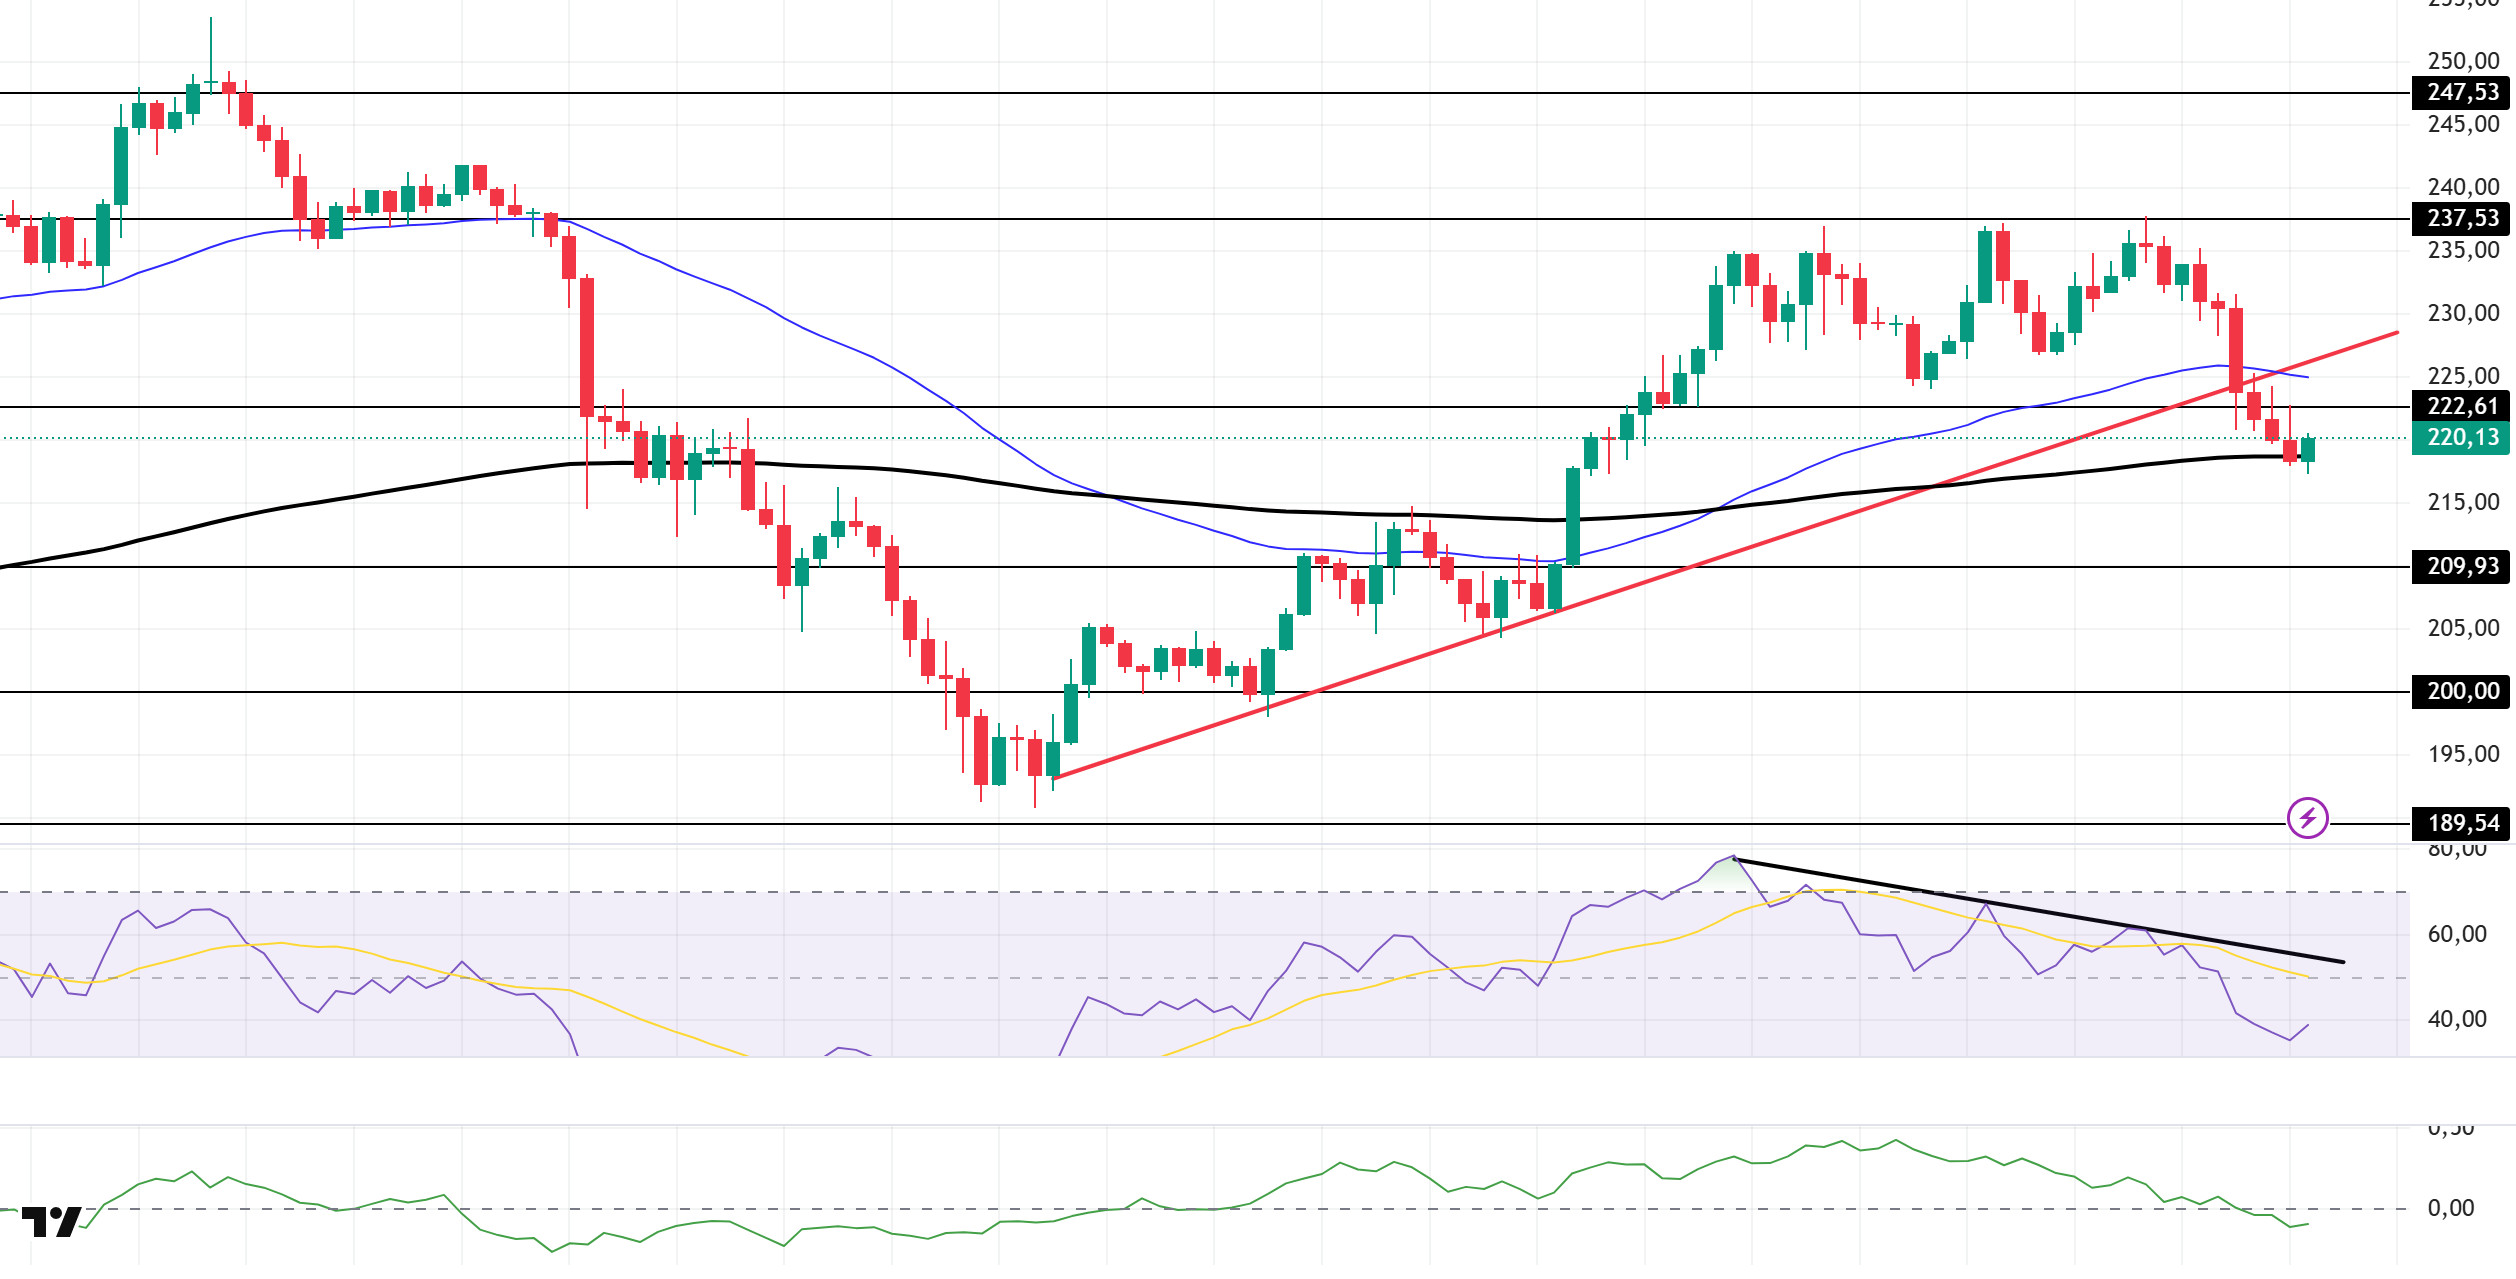
The SOL price continued to decline. The asset moved into the lower region of the upward trend that began on September 26. This could increase selling pressure. The price, which has also begun to move below the 50 EMA (Blue Line) moving average, is currently testing the 200 EMA (Black Line) moving average as support. If the uptrend resumes, it could retest the $237.53 level. If the pullback continues, the $209.93 level or the ascending trend line could be followed.
On the 4-hour chart, it remained above the 50 EMA (Exponential Moving Average – Blue Line) and 200 EMA (Black Line). This indicates that it may be in an uptrend in the medium term. At the same time, the price being between the two moving averages shows us that the asset is in a decision-making phase in the short term. The Chaikin Money Flow (CMF-20) has moved into negative territory. However, a decrease in money inflows could push the CMF deeper into negative territory. The Relative Strength Index (RSI-14) has fallen to the middle of the negative zone. At the same time, it continues to remain below the downward trend that began on October 2. This indicates that the downward pressure is continuing. In the event of an uptrend driven by macroeconomic data or positive news related to the Solana ecosystem, the $237.53 level emerges as a strong resistance point. If this level is broken upward, the uptrend is expected to continue. In the event of pullbacks due to developments in the opposite direction or profit-taking, the $209.93 level could be tested. A decline to these support levels could increase buying momentum, presenting a potential opportunity for an upward move.
Supports: 209.93 – 200.00 – 189.54
Resistances: 222.61 – 237.53 – 247.53
DOGE/USDT
Dogecoin launched the Cardinals Index Node, thinking that speculation about Tesla running a node could accelerate DOGE adoption. CleanCore Solutions’ dogecoin treasury exceeded 710 million DOGE.
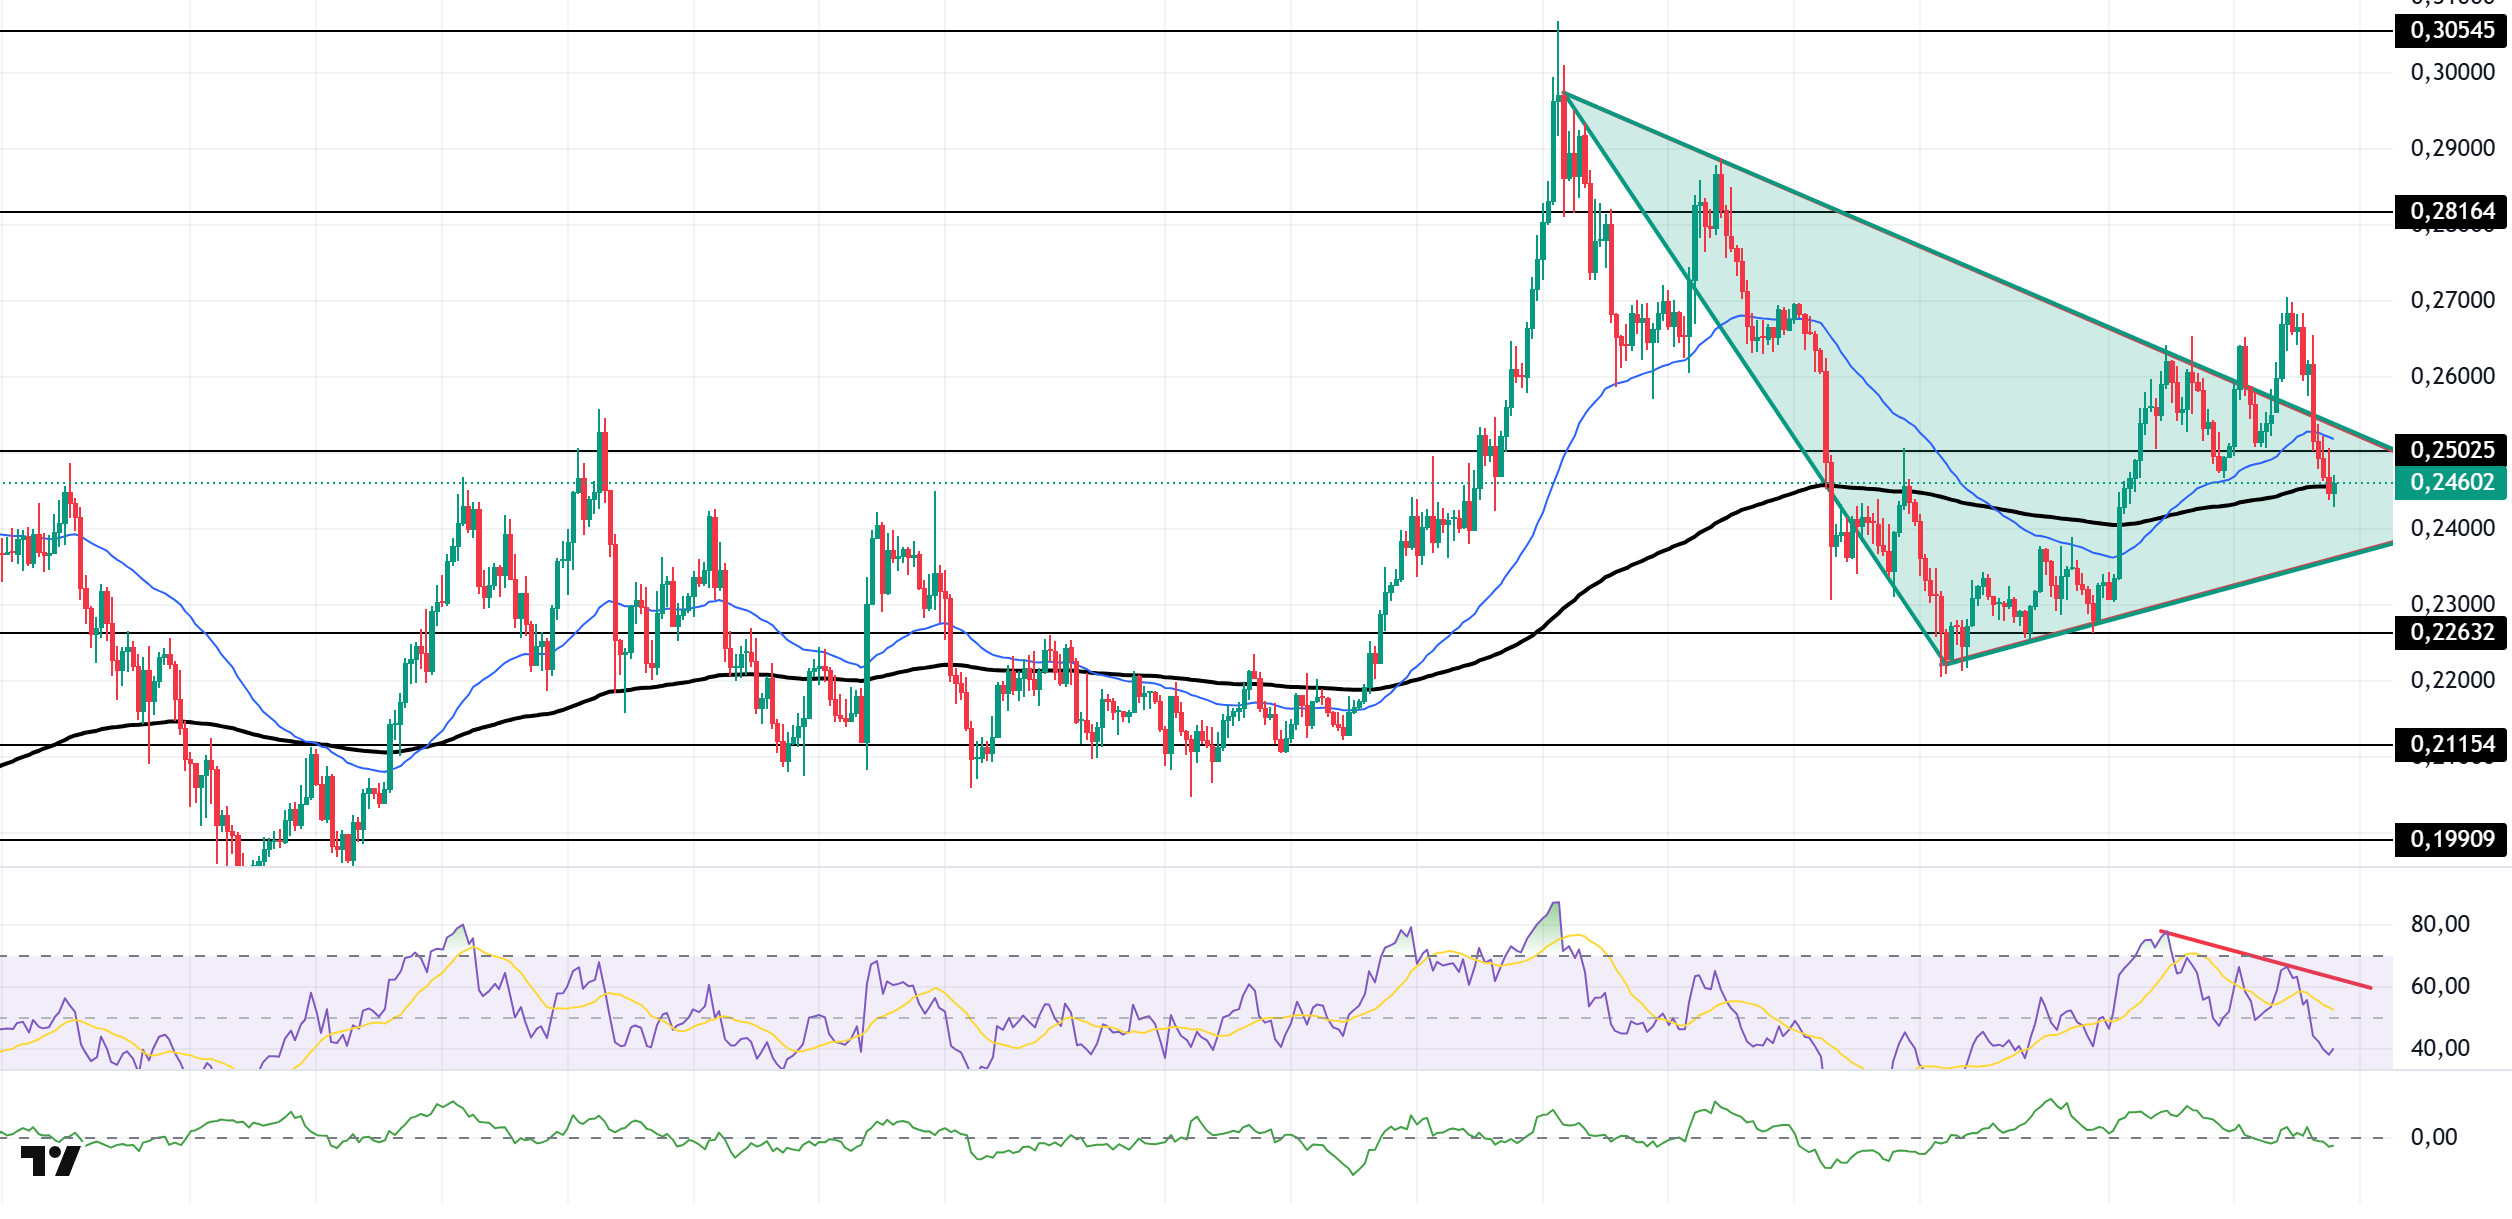
The DOGE price experienced a decline. The asset began to appreciate again within the symmetrical triangle formation that began on September 14. The price, which broke below the 50 EMA (Blue Line) moving average, is currently testing the 200 EMA (Black Line) moving average as support. If the pullback continues and the candle closes below the moving average, it may test the $0.22632 level as support. If it experiences an uptrend, the $0.25025 level and the ceiling level of the symmetrical triangle formation should be monitored as resistance.
On the 4-hour chart, the 50 EMA (Exponential Moving Average – Blue Line) remained above the 200 EMA (Black Line). This indicates that an uptrend may begin in the medium term. The price being between the two moving averages indicates that the price is in a decision-making phase in the short term. The Chaikin Money Flow (CMF-20) experienced a slight decline towards the negative zone. Additionally, a decrease in money inflows could push the CMF deeper into the negative zone. The Relative Strength Index (RSI-14) continued to remain in the lower region of the downward trend that began on October 2, retreating into negative territory. This signaled increased selling pressure. In the event of potential upward movements driven by political developments, macroeconomic data, or positive news flow within the DOGE ecosystem, the $0.28164 level stands out as a strong resistance zone. Conversely, in the event of negative news flow, the $0.22632 level could be triggered. A decline to these levels could increase momentum and potentially initiate a new upward wave.
Supports: $0.22632 – $0.21154 – $0.19909
Resistances: 0.25025 – 0.28164 – 0.30545
LTC/USDT
Price movements observed in the Litecoin (LTC) / USDT pair closed the previous day with a 1.2% loss in value. However, LTC’s 1.47% increase relative to Bitcoin during the same period indicates that Litecoin has gained relative strength against Bitcoin. This situation shows that LTC is weak in dollar terms but strong in BTC terms. Therefore, from an investor perspective, the pair is experiencing an uncertain market structure, and it is a period that requires caution in buying and selling transactions. On the futures side, the long/short position ratio opened in the last 24 hours being at 0.8772 indicates that derivative market participants have downward expectations. This ratio indicates that the majority of investors are placing more weight on sell positions and that the general market trend is shaping up in favor of bears. On the other hand, funding rates continue to maintain their positive course.
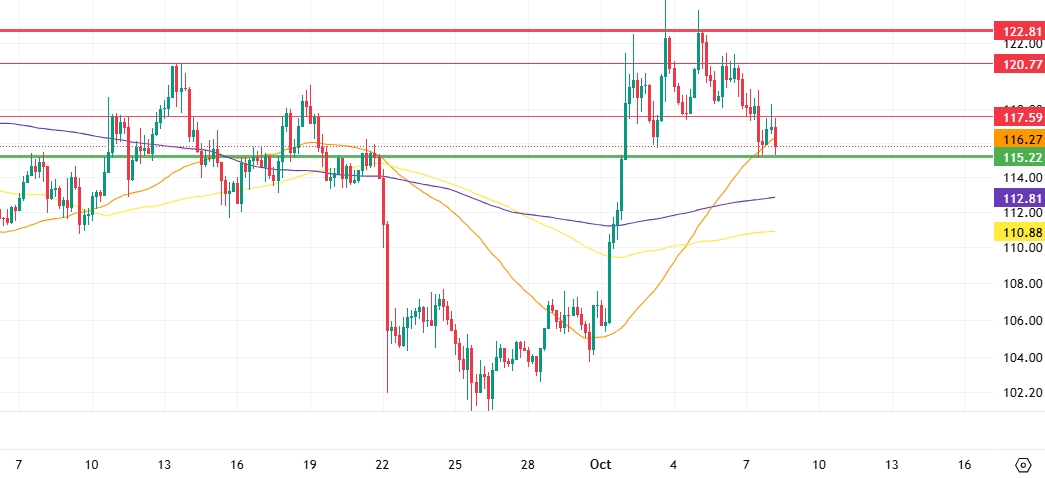
From a technical perspective, significant resistance levels stand out in LTC’s short-term price movements. First, the horizontal resistance at 117.59 is the first strong barrier above the current price. Breaking above this level could accelerate the upward momentum in LTC’s price and pave the way for the movement to continue to the second horizontal resistance at 120.77. Above 120.77, the final pressure zone at 122.81 stands out as the most critical resistance area. A daily close above this level could pave the way for a new wave of gains.
In potential pullbacks, the most important level where the price could find support in the first stage would be 115.22. Falling below this level could bring a scenario to the fore where declines could accelerate and moving averages could be tested by the price. First, the 112.81 level, where the 200-period moving average (purple line) will be tested, should be closely monitored. If the reaction from this area is insufficient, the price may pull back to the 110.88 level, where the 100-period moving average (yellow line) is located. If the price falls below all moving averages, a deepening decline and a shift to a weaker technical outlook for the market could be considered a reasonable scenario.
Supports: 115.22 – 112.81 – 110.88
Resistances: 117.59 – 120.77 – 122.81
SUI/USDT
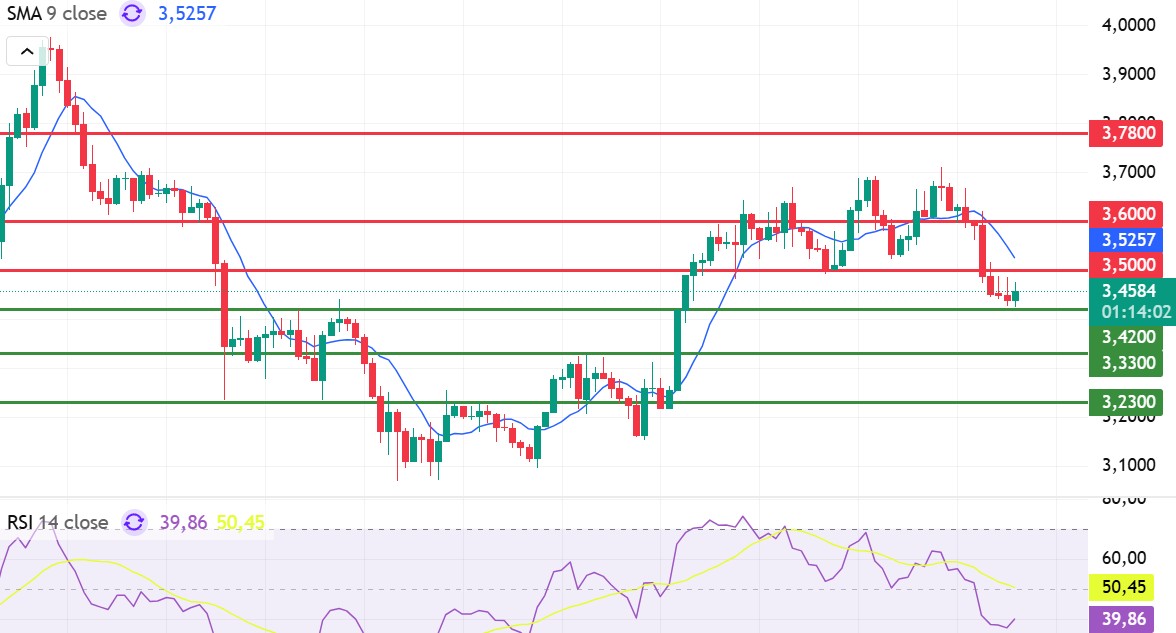
Looking at Sui’s technical outlook, we see that the price has fallen to around $3.46 on the 4-hour chart, influenced by fundamental developments. The Relative Strength Index (RSI) is currently in the 39.86 – 50.45 range. This range indicates that the market is trading close to the buy zone; if the RSI falls to the 35.00 – 45.00 range, it could signal a potential buying opportunity. If the price moves upward, the $3.50 – $3.60 – $3.78 levels can be monitored as resistance points. However, if the price falls to new lows, it may indicate that selling pressure could deepen. In this case, the $3.42 and $3.33 levels stand out as strong support zones. In particular, in the event of a sharp sell-off, a pullback to $3.23 appears technically possible.
According to Simple Moving Averages (SMA) data, Sui’s average price is currently at the $3.52 level. The price remaining below this level indicates that the current downtrend could technically continue.
Supports: 3.23 – 3.33 – 3.42
Resistances: 3.50 – 3.60 – 3.78
Legal Notice
The investment information, comments, and recommendations contained herein do not constitute investment advice. Investment advisory services are provided individually by authorized institutions taking into account the risk and return preferences of individuals. The comments and recommendations contained herein are of a general nature. These recommendations may not be suitable for your financial situation and risk and return preferences. Therefore, making an investment decision based solely on the information contained herein may not produce results in line with your expectations.

