
Technical Analysis
BTC/USDT
Fed members indicated they were awaiting the latest data flow, with opinions divided between those calling for “gradual cuts” and those “acting cautiously due to inflation concerns.” Revelio and Challenger reports pointed to layoffs reaching a 20-year high, indicating a contraction in employment. As the government shutdown in Washington entered its sixth week, the FAA announced it would reduce flight capacity ahead of a new funding vote. Trump said he had no plans for new tariffs ahead of the Supreme Court customs tariff case but revealed they were preparing an “alternative plan” in case of a negative ruling.
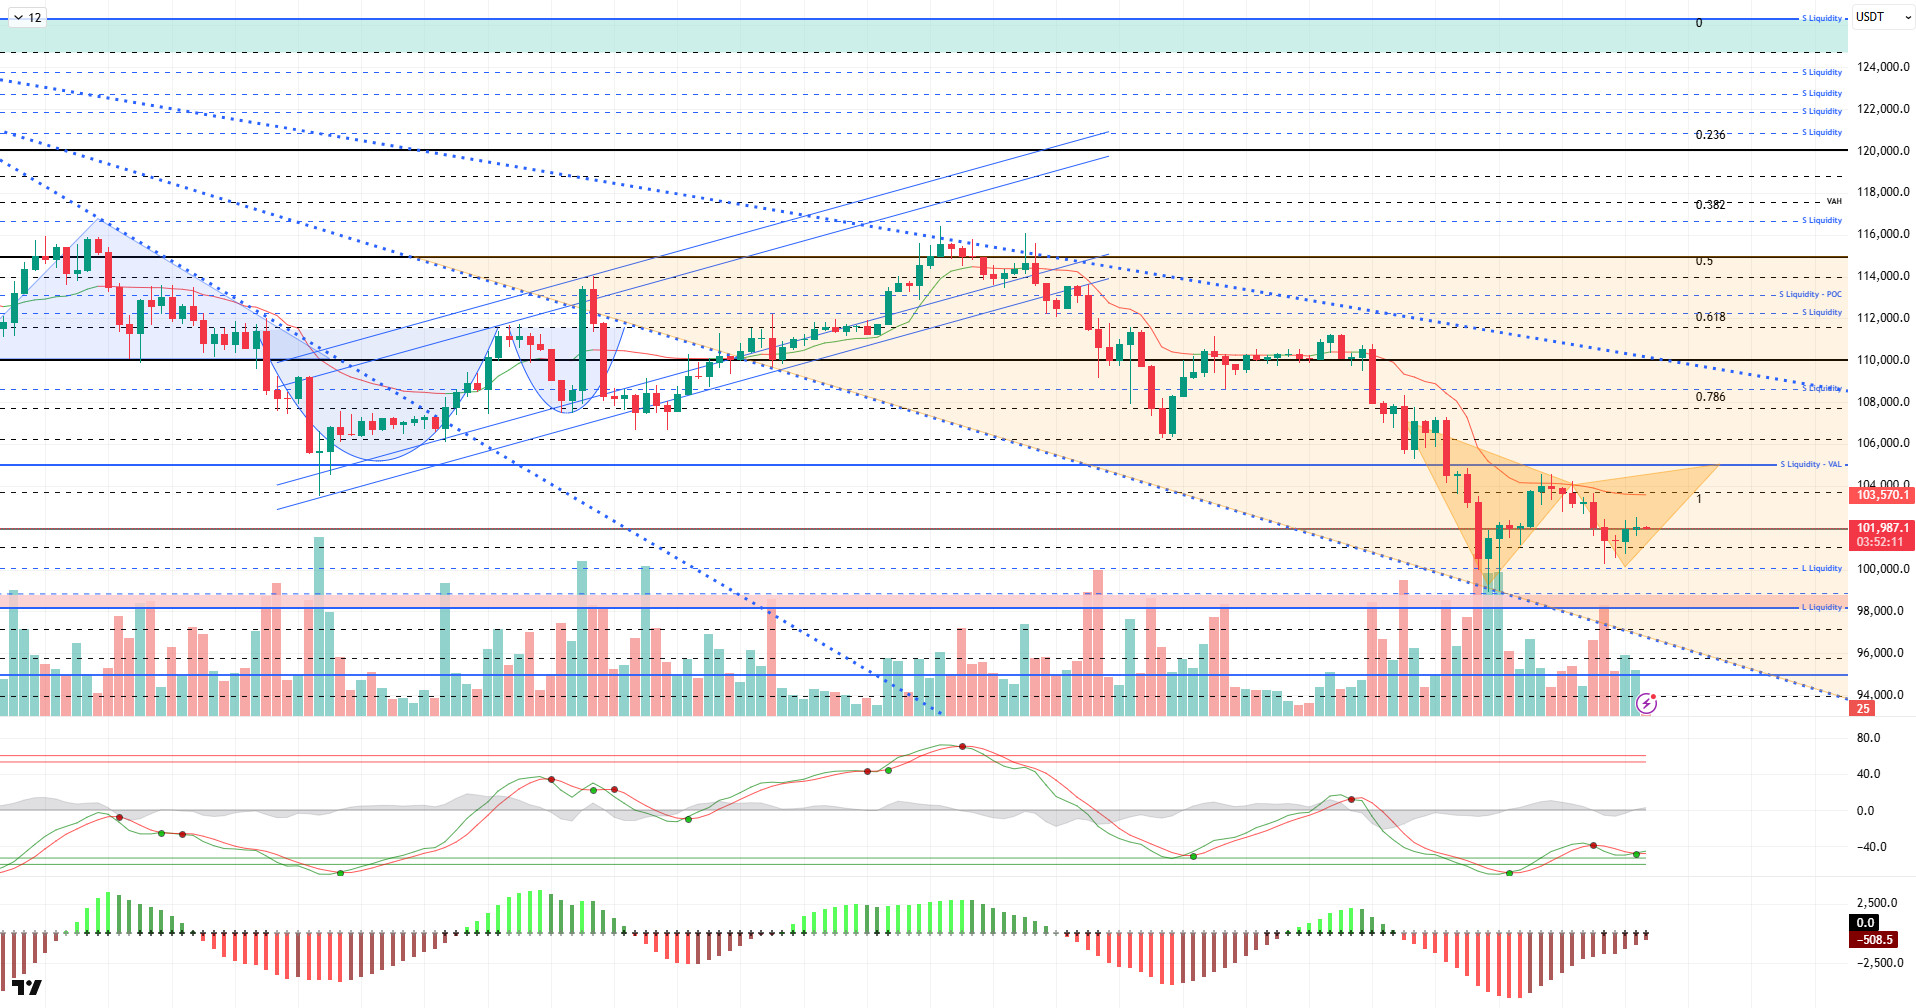
From a technical perspective, BTC continues to move parallel to the falling trend channel within the orange band. After touching the lower trend line, the price recovered somewhat with a dead cat bounce but failed to gain the 105,000 level and fell back to the 100,400 level amid renewed selling pressure. The price then rebounded again, forming a W pattern and reaching the 102,000 level. We will monitor whether the price breaks above the 105,000 level to confirm the completion of the formation.
Technical indicators show an indecisive picture, with the Wave Trend (WT) Oscillator giving a buy signal in the oversold zone, while the Squeeze Momentum (SM) indicator continues to struggle to gain strength after reaching maximum weakness in the negative zone.The Kaufman Moving Average (KAMA) is currently at $103,580, positioned above the price.
According to liquidation data, investors taking advantage of the decline have recorded a concentration at the 98,000 level, while another concentration at the 100,000 level has undergone some liquidation with the latest decline. Conversely, the selling level is gaining intensity at $102,500–$103,500, while the $105,600 level emerges as another area where accumulation is increasing.
In summary, while the tariff dispute between the US and China is losing its significance in the equation, the prolonged government shutdown in the US and the Fed’s hawkish stance for its next meeting are emerging as factors putting pressure on the markets. On the technical side, although BTC occasionally records short-term gains, the market’s “fear” sentiment, low risk appetite, and short-term investor profile are leading to renewed selling pressure. In liquidity data, the dominance of the selling tier continues, but buyers are starting to reappear. In the coming period, 103,300 will be monitored as a resistance point, and if this level is gained, the 105,000 reference area and then the 105,600 liquidity zone can be monitored. In the event of a potential new selling pressure, 101,800 is the first support point, and if it breaks, we will follow the 100,000 reference area.
Supports: 101,800 – 100,000 – 99,000
Resistances: 103,300 – 105,000 – 106,600
ETH/USDT
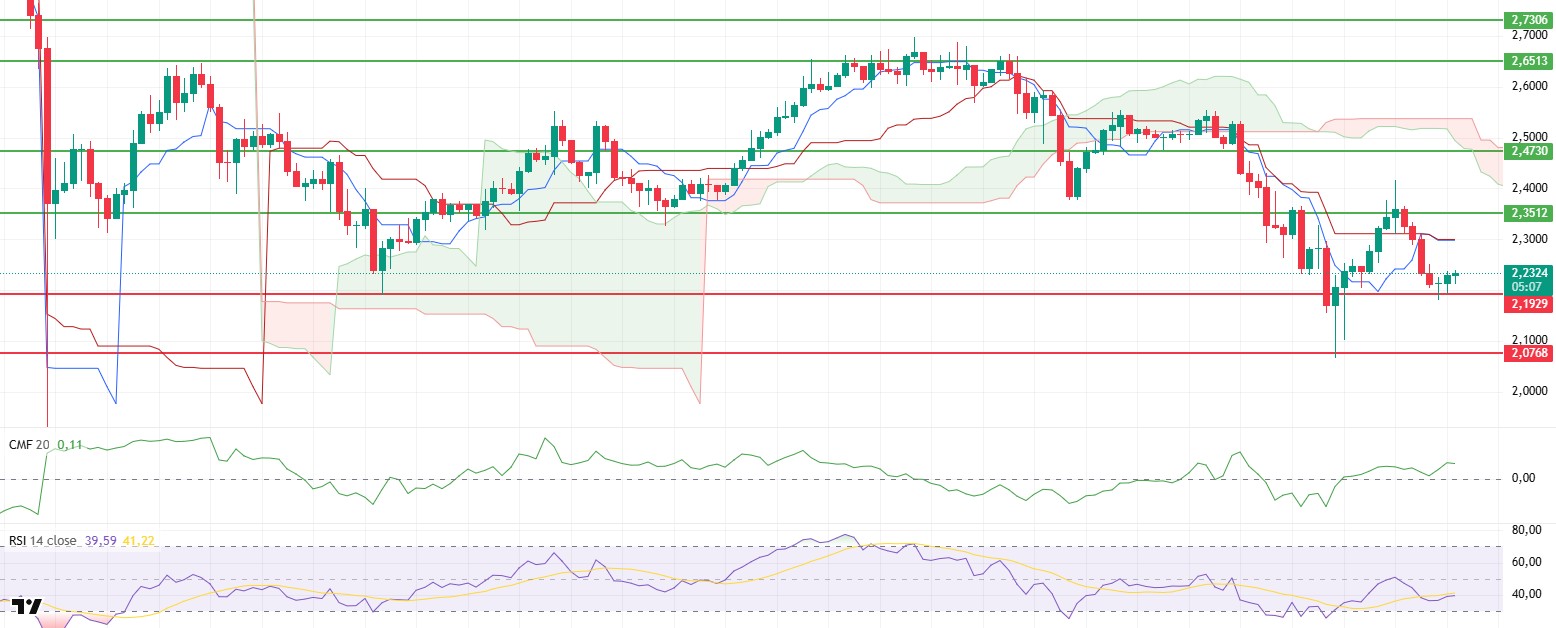
The ETH price fell to $3,245 yesterday evening but regained upward momentum as buyers stepped in with the opening of Asian markets. The price climbed to the $3,365 band, where the tenkan level is located, and then experienced a slight pullback from this area. However, the overall technical outlook indicates that the short-term recovery is continuing and that the market is still supported by buyers.
The Chaikin Money Flow (CMF) indicator continues its movement in positive territory, revealing that liquidity entering the market remains strong. This trajectory of the CMF shows that fund flows continue to be on the buying side despite selling pressure, indicating that the market retains its short-term upside potential.
The Relative Strength Index (RSI) indicator continues its upward movement after a previous negative divergence. This recovery trend in the RSI signals that momentum is strengthening, indicating that buyers are regaining their influence in the market. This scenario supports the possibility of prices moving towards resistance levels again in the short term.
According to the Ichimoku indicator, the price is still trading below the Tenkan, Kijun, and kumo cloud levels. This view reflects that the main trend remains in negative territory, but short-term recovery efforts continue. The price maintaining its position below the cloud indicates that any upward movements may encounter strong resistance levels for now.
Overall, ETH is likely to maintain its upward trend during the day and move towards the $3,436 resistance level. If this level is broken, we may see an acceleration towards the $3,672 range. However, in the event of a potential weakening scenario, the $3,227 level should be closely monitored as a critical support point.
Below the Form
Supports: $3,227 – $3,020 – $2,872
Resistances: 3,436 – 3,672 – 3,816

XRP/USDT
The XRP price fell to the $2.19 support level yesterday amid heavy selling pressure. Although the rebound from this level was weak, the price rose back to the $2.23 range, showing a slight attempt at recovery. This movement, which indicates that buyers have not completely withdrawn in the short term, suggests that the decline has been limited for now.
The Chaikin Money Flow (CMF) indicator maintaining its strong position in the positive zone indicates that sales are primarily coming from leveraged positions and that there is no significant liquidity outflow on the spot side. This outlook, coupled with the strengthening view that the market has reached a favorable buying zone, supports the possibility of a strong recovery in the short term.
The Relative Strength Index (RSI) indicator is also experiencing a slight recovery after falling alongside the price. A weak upward reversal signal in momentum indicates that the price is continuing to seek equilibrium, at least in the short term.
In the Ichimoku indicator, the price remaining below both the Tenkan and Kijun levels and continuing to stay below the kumo cloud indicates that the negative outlook for the main trend is maintained. This structure signals that upward attempts will continue to face strong resistance.
XRP may continue its gradual recovery as long as it does not lose its $2.19 support level during the day. However, if this support level is broken downward, selling pressure may accelerate and the price may retreat towards the $2.10 level. If it manages to stay above $2.23, the $2.28 level may become the target again in the first stage.
Supports: 2.1929 – 2.0768 – 1.9092
Resistances: 2.3512 – 2.4730 – 2.6513
SOL/USDT
Solmate launched Solana’s first UAE validator, combining staking, RPC, and colocation for stronger blockchain performance.
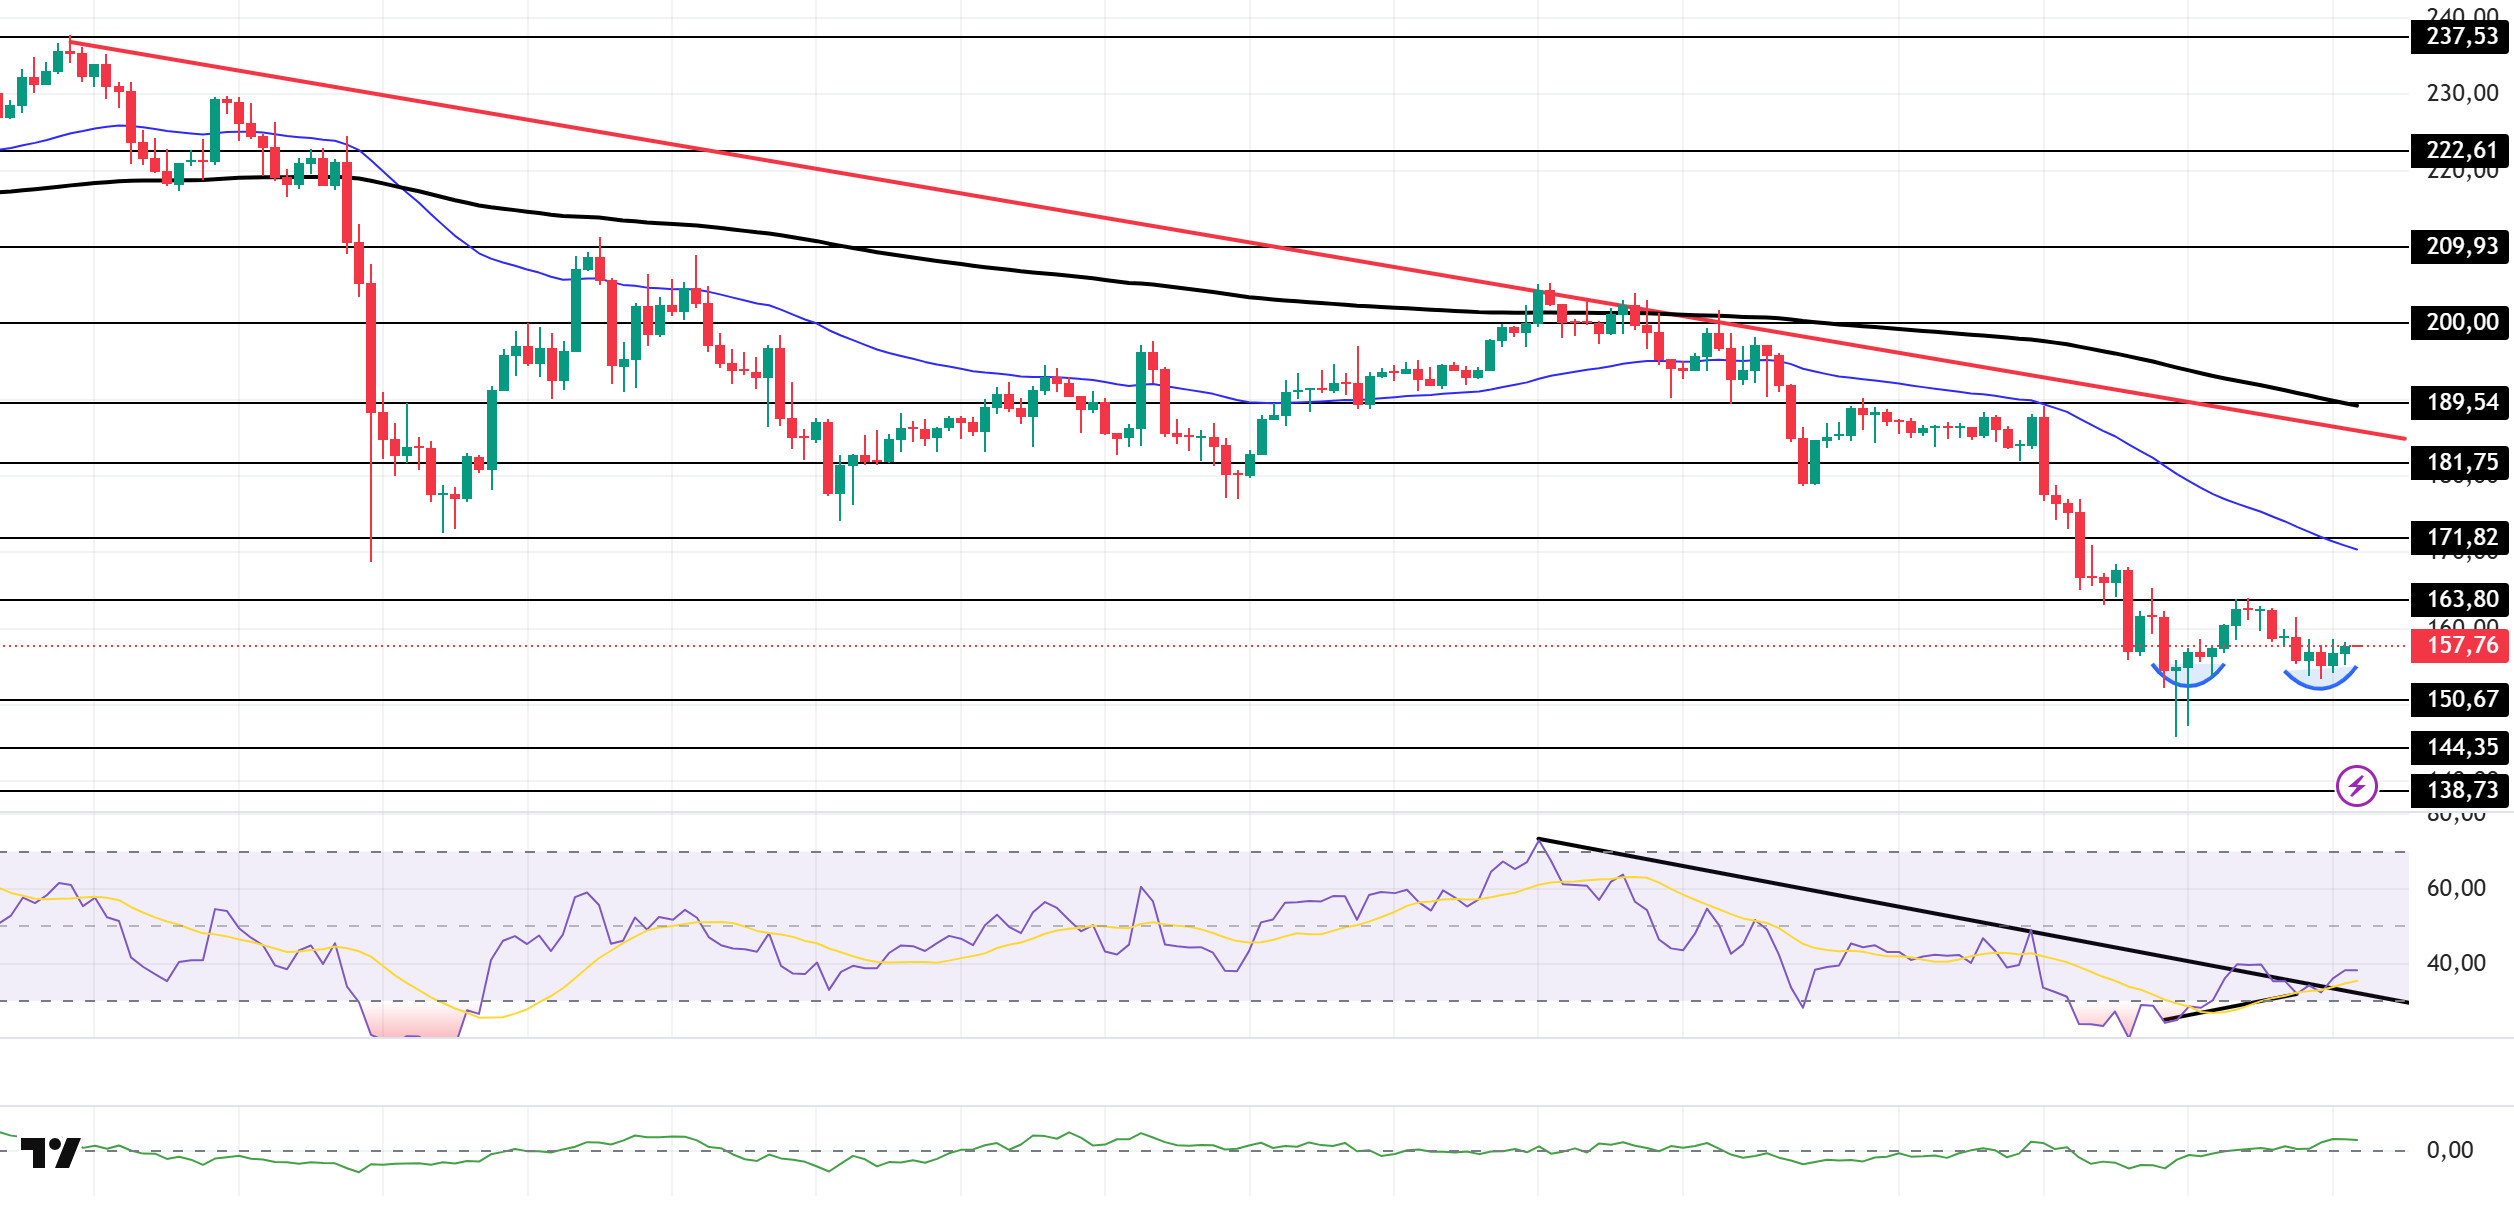
The SOL price remained flat. The asset tested the strong resistance level of $163.80 and experienced a pullback. However, it continued to remain in the lower region of the downward trend that began on October 6. The price being far from the 50 EMA (Blue Line) and 200 EMA (Black Line) moving averages could strengthen the asset’s sideways or upward movement. However, a double bottom formation has taken shape. This could enable the price to move upward. Currently trading sideways, the price may test the $144.35 level in a pullback scenario. If the uptrend continues, it may test the 50 EMA (Blue Line) moving average.
On the 4-hour chart, it continues to remain below the 50 EMA (Exponential Moving Average – Blue Line) and 200 EMA (Black Line). This indicates that it may be in a downtrend in the medium term. At the same time, the price being below both moving averages shows us that the asset is in a downward trend in the short term. The Chaikin Money Flow (CMF-20) is at a positive level. However, a decrease in money inflows could push the CMF into negative territory. The Relative Strength Index (RSI-14) has risen to the middle of the negative zone. At the same time, it broke above the downward trend that began on October 27. Additionally, there is a positive divergence. These could bring upward movement. If there is an increase due to macroeconomic data or positive news related to the Solana ecosystem, the $171.82 level stands out as a strong resistance point. If this level is broken upward, the increase is expected to continue. In case of pullbacks due to developments in the opposite direction or profit-taking, the $144.35 level may be tested. If the price falls back to these support levels, an increase in buying momentum may present a potential opportunity for an upward movement.
Supports: 150.67 – 144.35 – 138.73
Resistances: 163.80 – 171.82 – 181.75
DOGE/USDT
Bitwise initiated the automatic approval process by submitting Form 8(a) for its Spot Dogecoin ETF.
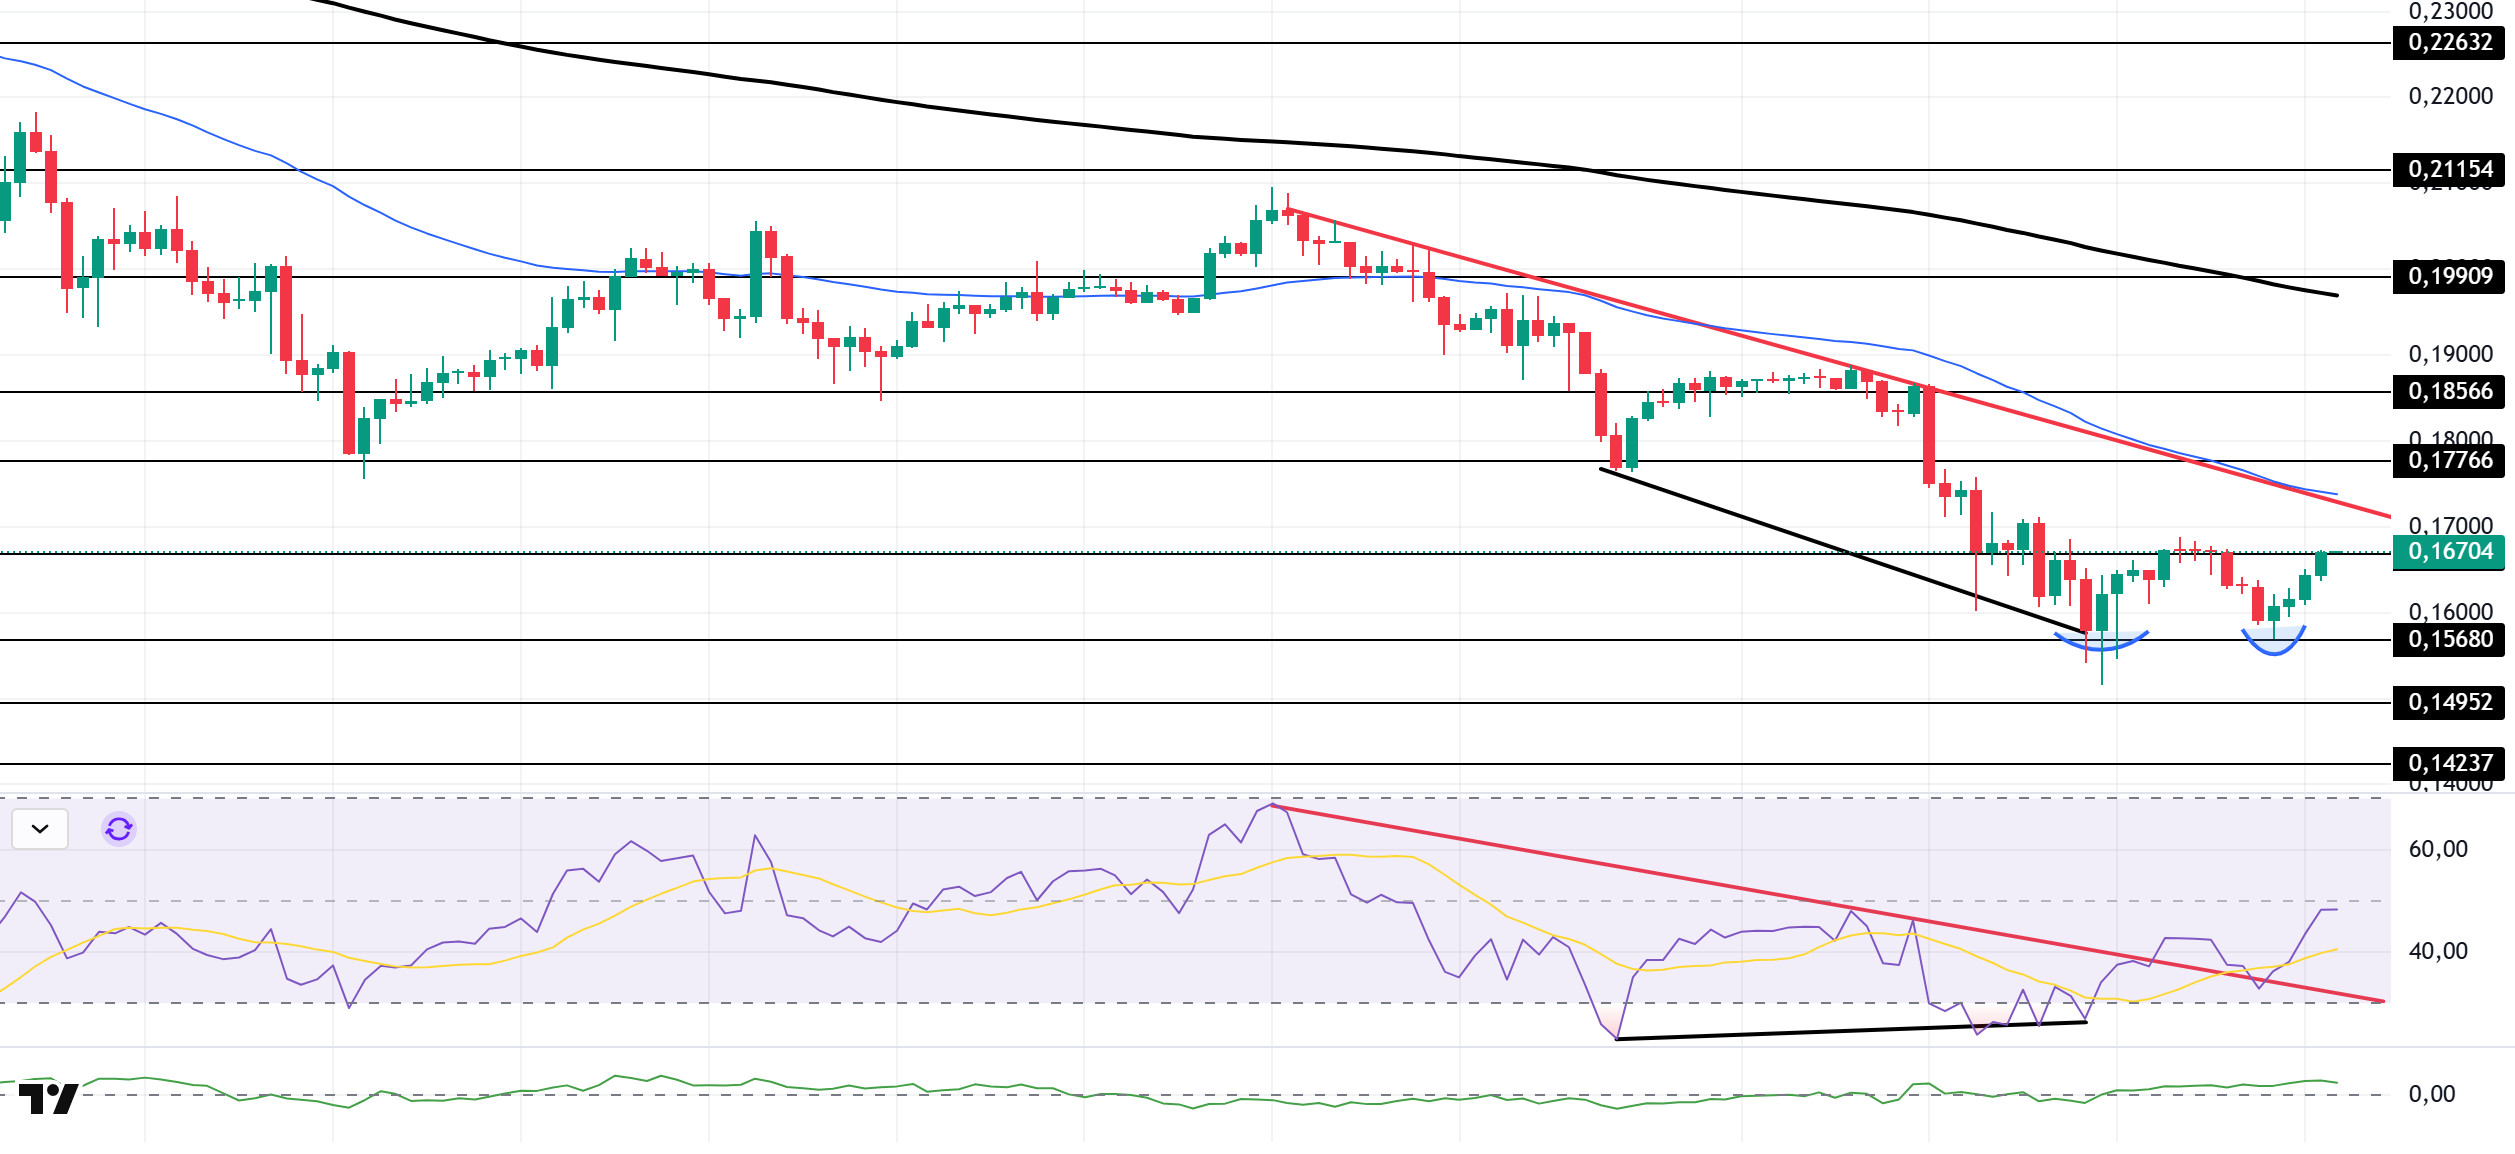
The DOGE price showed a slight increase. The asset remained below the downward trend that began on October 27. The price is currently testing the $0.16686 level as resistance. On the other hand, the double bottom formation could bring a price increase. If the uptrend continues, it could test the downtrend line and the 50 EMA (Blue Line) moving average as resistance. If a pullback begins, it could test the $0.15680 level as support.
On the 4-hour chart, the 50 EMA (Exponential Moving Average – Blue Line) remained below the 200 EMA (Black Line). This indicates that a downtrend may begin in the medium term. The price being below both moving averages indicates a downward trend in the short term. The Chaikin Money Flow (CMF-20) has started to move into the positive zone, close to the neutral zone. Additionally, balanced cash inflows may keep the CMF in positive territory. The Relative Strength Index (RSI-14) accelerated towards the neutral level. It also broke above the downward trend that began on October 27. On the other hand, there is a positive divergence. This could increase buying pressure. In the event of potential increases driven by political developments, macroeconomic data, or positive news flow within the DOGE ecosystem, the $0.17766 level stands out as a strong resistance zone. Conversely, in the event of negative news flow, the $0.15680 level could be triggered. A decline to these levels could increase momentum and initiate a new wave of growth.
Supports: $0.15680 – $0.14952 – $0.14237
Resistances: 0.16686 – 0.17766 – 0.18566
ADA/USDT
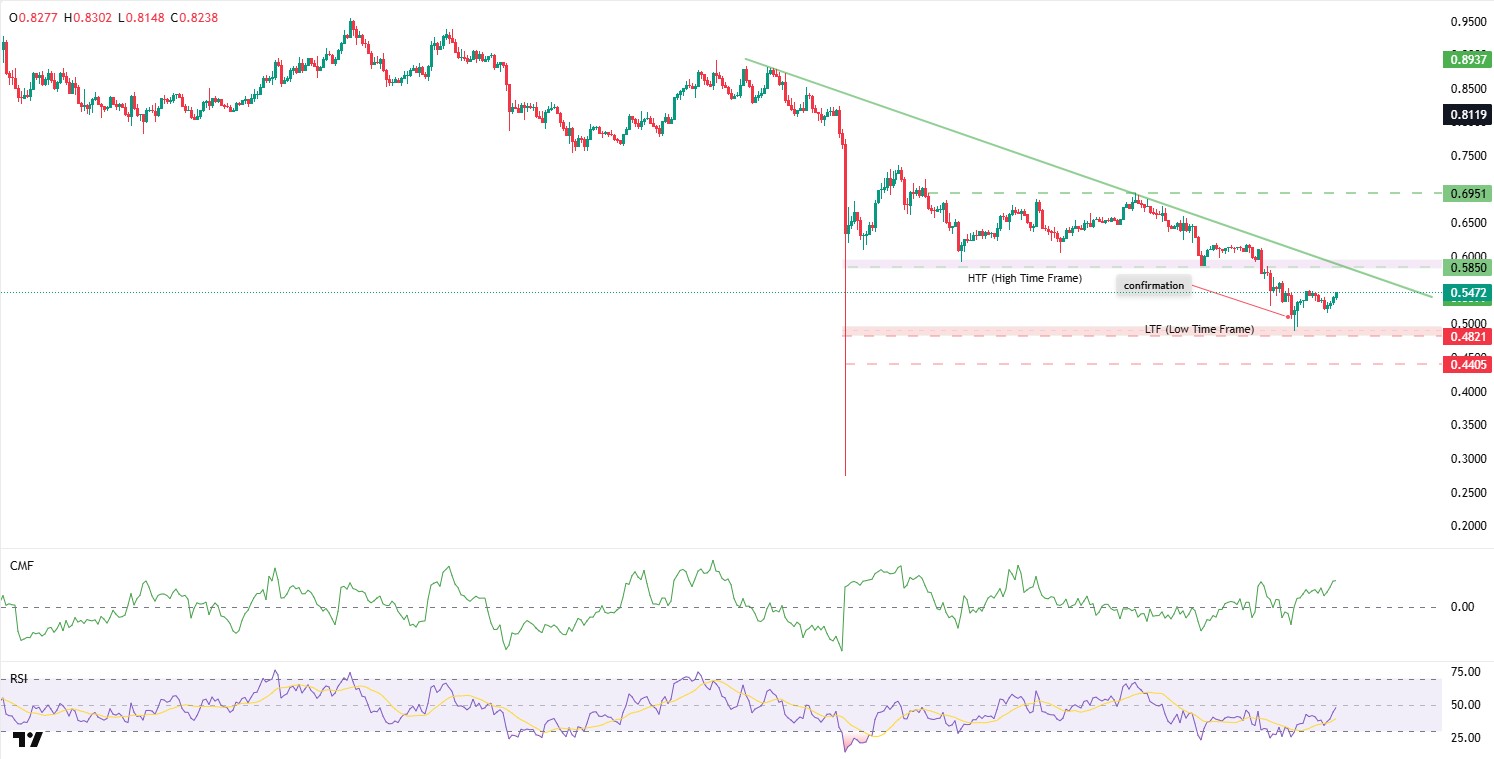
ADA started the first half of the day with a decline but rebounded from the confirmation zone, rising 1.83% within 24 hours. With a minor double bottom formation, it is holding above the $0.5300 level and is waiting for liquidation at $0.5481 levels for 402,000 ADA.
The Relative Strength Index (RSI-14) rose to 40 levels, signaling a trend reversal along with the Chaikin Money Flow (CMF-20). A limited increase in money inflows may keep the CMF in positive territory. If the price rises during the day and re-enters the Fibonacci level of $0.5850, the resistance point of $0.6951 could emerge as an important level to watch. In this case, it could signal that the upward trend may continue in the medium term.
If there is an increase due to macroeconomic data or positive news related to the Cardano ecosystem, the $0.7437 level stands out as a strong resistance point. If this level is broken upwards, the increase is expected to continue.
If Trump’s statements today and macroeconomic data result in a decline in market volatility, increased selling pressure could push the ADA price back to the lowest time frame (LTF) level of $0.4900. In this scenario, the price intersects with the confirmation zone, which is the entry zone of the low time frame (LTF), at the $0.4821 level. This technically increases the importance of the zone. In a more severe correction scenario, the $0.4407 level can be monitored as the main support level. However, confirmation of this movement should be monitored in terms of volume and market structure.
Supports: 0.3896 – 0.4455 – 0.4883
Resistances: 0.6951 – 0.7437 – 0.7985
Legal Notice
The investment information, comments, and recommendations contained herein do not constitute investment advice. Investment advisory services are provided individually by authorized institutions taking into account the risk and return preferences of individuals. The comments and recommendations contained herein are of a general nature. These recommendations may not be suitable for your financial situation and risk and return preferences. Therefore, making an investment decision based solely on the information contained herein may not produce results in line with your expectations.

