
Technical Analysis
BTC/USDT
In the final stretch of the week, with low Thanksgiving liquidity, the dollar retreated from its six-month peak, heading for its sharpest weekly decline since July, as market focus shifted to the December Fed meeting and the 2026 interest rate path; The UK, meanwhile, kept rates steady in its autumn budget without introducing a new tax hike on crypto, but moved towards a stricter line on reporting and auditing with the CARF regime coming into effect next year, which will increase compliance costs. Meanwhile, the Bhutan Royal Government’s transfer of ETH to Figment for staking purposes was a noteworthy development, indicating that crypto assets continue to be used at the state level for passive income.
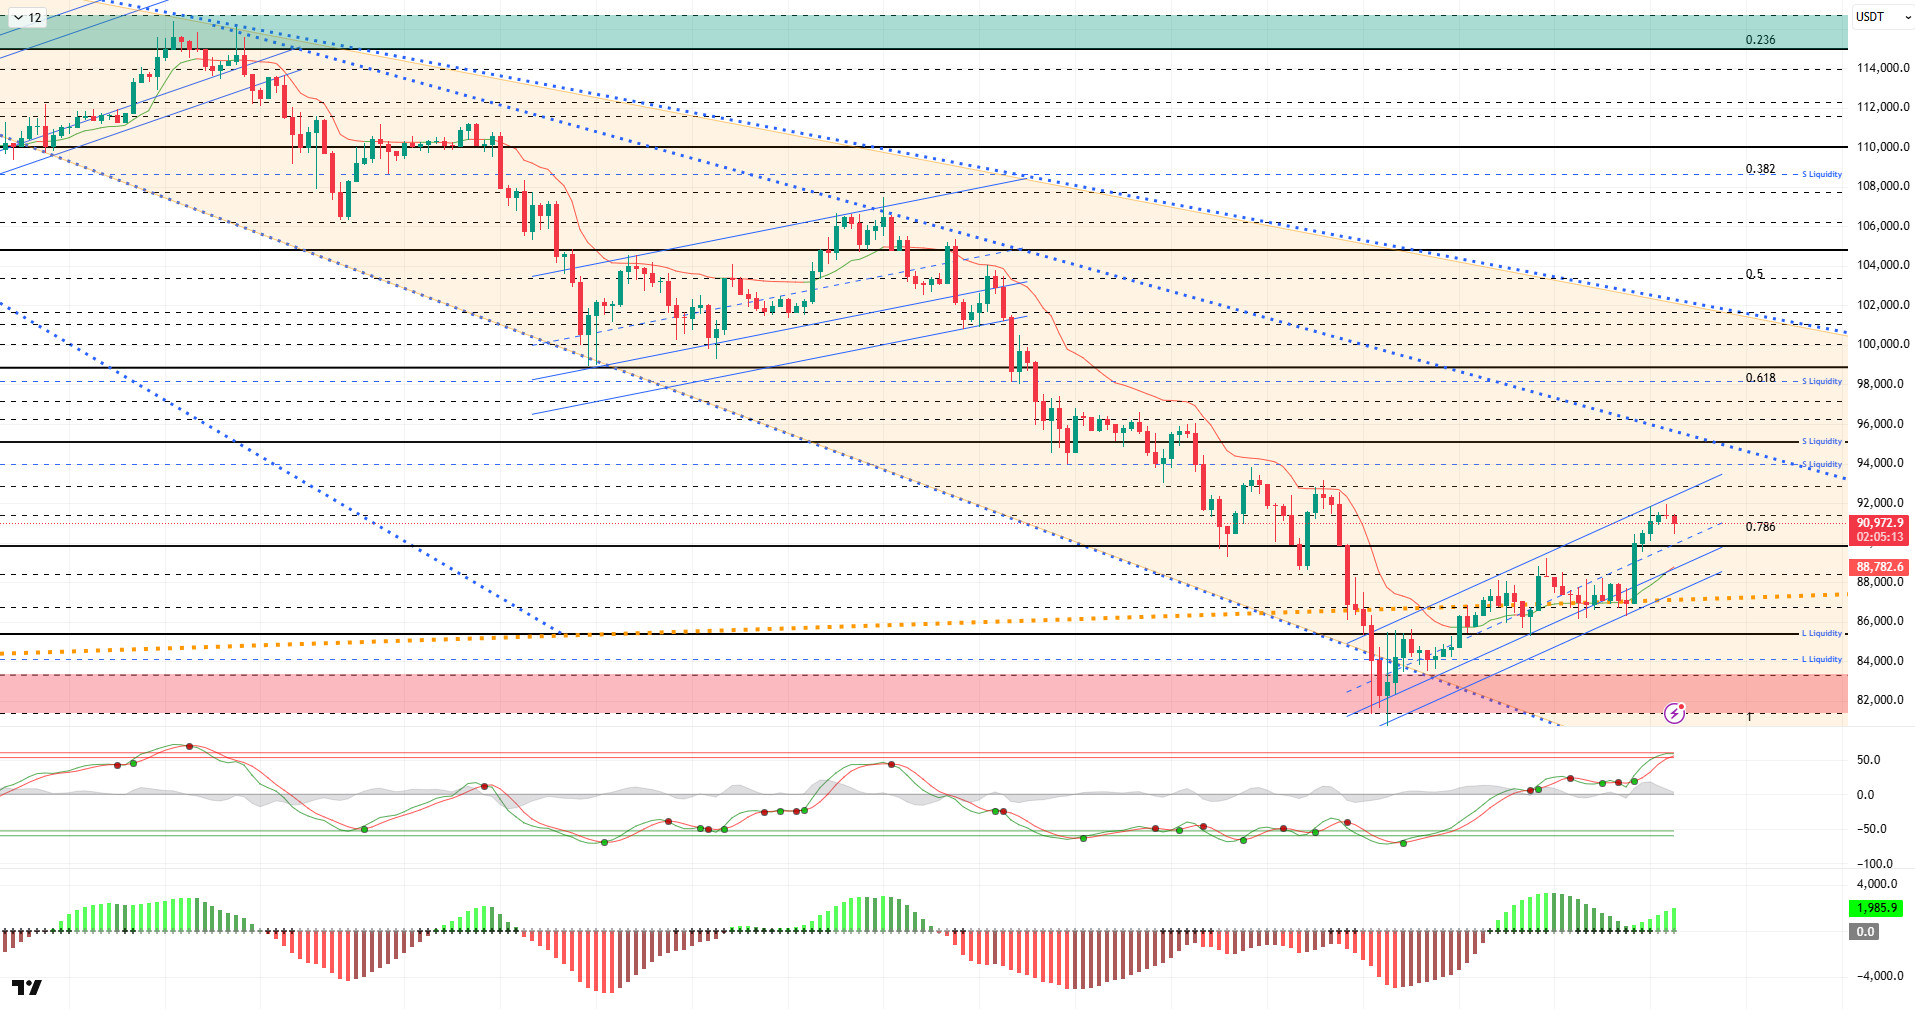
From a technical perspective, BTC tested the 91,400 resistance level in the previous analysis, but the price failed to break through this level in the first phase and is trading slightly bearish. The price, which formed an upward channel within the declining major trend, continues to trade parallel to this channel. After testing the upper trend line, BTC retreated and was trading at the 90,800 level at the time of writing.
Technical indicators show that the Wave Trend (WT) oscillator, which was above the channel’s middle band, gave indecisive buy/sell signals and finally reached the overbought zone with its last buy signal. The histogram on the Squeeze Momentum (SM) indicator regained momentum within the positive area.The Kaufman Moving Average (KAMA) is currently at the $88,700 level, positioned below the price.
According to liquidation data, investors are repositioning themselves in the buy zone with the latest rise, with 85,000 emerging as the short-term congestion level. The partial short-term sell zone is being liquidated at the 89,000 level, while the next sell zone maintains its accumulation at the 94,100 level.
In summary, following the rise driven by expectations of an interest rate cut in BTC, positive developments on the Russia-Ukraine front eased selling pressure, bringing the price into a consolidation phase and supporting it at current levels. Finally, the Beige Book’s background supporting interest rate cuts was a significant driving force in the price regaining momentum. Technically, the price successfully continued its attempt to form an upward channel with upward momentum, recovering from the 80,500 bottom and settling back above the 90,000 band. Liquidity data confirmed that target zones have regained importance and that a partial equilibrium has formed in the market. For the uptrend to become sustainable in the coming period, closes above the 90,000 level, which is being monitored as a reference point, are critical. Should demand regain strength and potential catalysts such as ETFs come into play, the 94,000 level emerges as an important liquidity zone, with 95,000 as the next reference zone. Conversely, if selling pressure increases, 90,000 is a critical support level, and in the event of a breakout, the price holding at the 89,000 level will be monitored.
Supports: 90,000 – 89,000 – 87,000
Resistances: 91,400 – 92,600 – 94,000
ETH/USDT
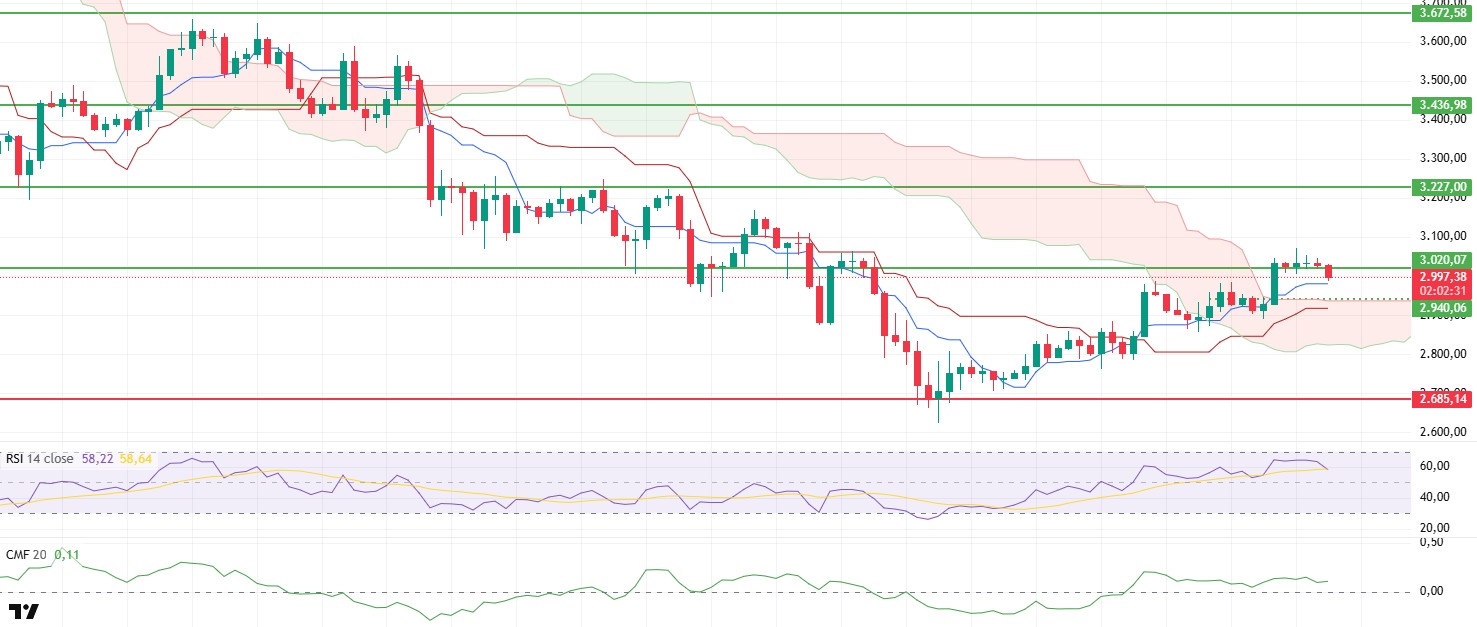
The Ethereum price lost its $3,020 support during the day and retreated to the $2,990 level. This decline indicates that profit-taking has been effective in the short term and that buyers have lost some strength. However, the price hovering near the $3,000 level again signals that the balancing effort is continuing.
The Chaikin Money Flow (CMF) indicator continues to move sideways in positive territory. While the fact that liquidity inflows have not completely dried up is seen as positive, a strong capital inflow has not yet been observed. This structure suggests that buyers need to return to the market with greater conviction for the uptrend to continue.
The Relative Strength Index (RSI) indicator shows a slight downward trend. This slowdown in momentum suggests that the price may struggle to break through resistance levels. If the RSI regains strength, the uptrend could gain momentum.
The current outlook in the Ichimoku indicator remains unchanged. The price remaining above the kumo cloud indicates that the medium-term trend reversal remains valid. However, the failure to gain strength above Tenkan and Kijun signals that weakness will continue in the short term.
The $3,020 level is being monitored as the most critical threshold for the day. If the price regains this level, upward movements towards the $3,070 and $3,085 resistance levels can be expected to continue. However, if it fails to break above $3,020, selling pressure may intensify again, and another pullback towards the $2,980 level could be seen. In summary, the cautious outlook prevails in the market. For the uptrend to continue, the price needs to maintain stability above the cloud and, in particular, liquidity flow on the spot side needs to strengthen significantly.
Supports: 2,880 – 2,685 – 2,550
Resistances: 3,020 – 3,227 – 3,436
XRP/USDT
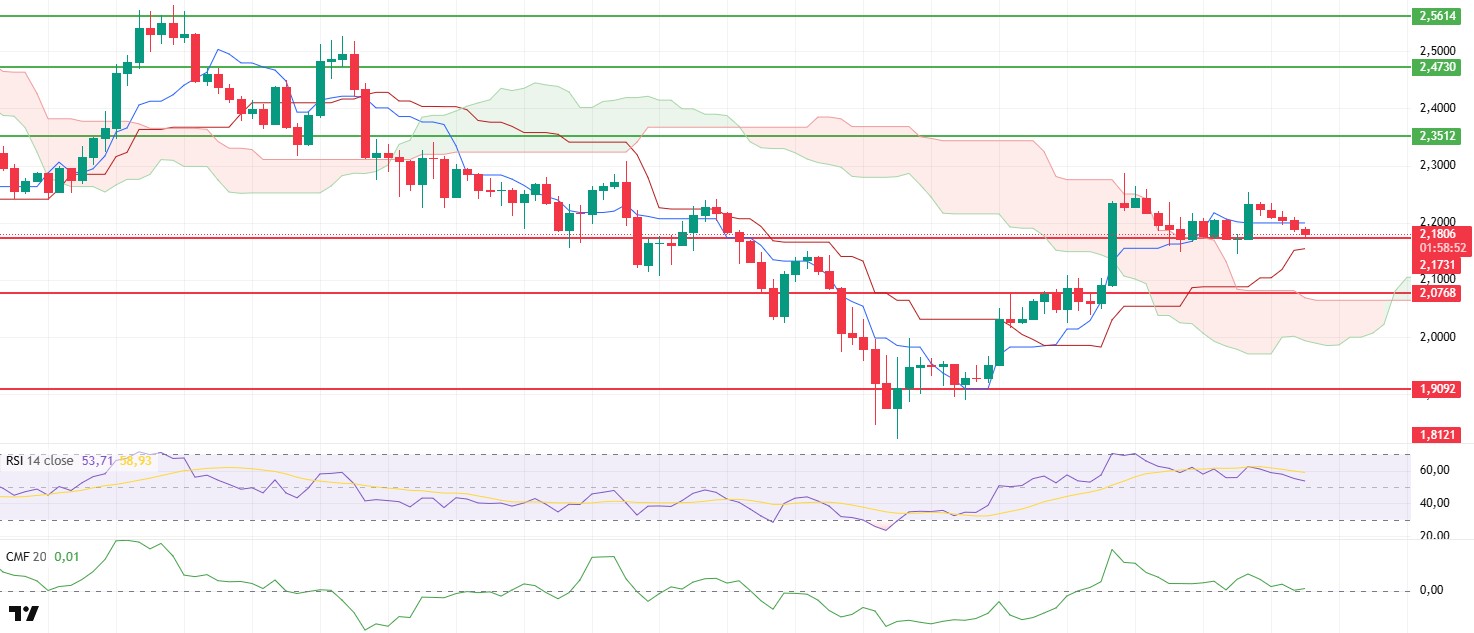
The XRP price retreated to the $2.17 support level during the day and received only a weak response from this region. This outlook reveals that buyers have lost strength in the short term and that the market continues to search for direction.
The Chaikin Money Flow (CMF) indicator is maintaining its horizontal course above the zero line. The lack of a significant increase in liquidity inflows indicates continued reluctance on the buying side. The CMF’s failure to move into strong positive territory suggests that the price may struggle to break through resistance levels.
The Relative Strength Index (RSI) indicator continues its downward trend, falling to 54. This weakness in momentum confirms that the price has lost its upward momentum. If the RSI fails to rise strongly, we may see volatile and pressured market movement.
Remaining below the Tenkan level on the Ichimoku indicator suggests that short-term downward pressure persists. On the other hand, the price still trading above the kumo cloud indicates that the medium-term positive technical structure has not completely broken down. Although cloud support remains intact, the short-term outlook appears weak.
These weaknesses in technical indicators suggest that if the $2.17 support level is lost, selling pressure could accelerate, pushing the price down to the $2.10 level. However, if the price manages to hold above the $2.17 level, it could rebound and move towards the $2.21 and $2.25 resistance levels.
Supports: 2.1731 – 2.0768 – 1.9092
Resistances: 2.3512 – 2.4730 – 2.5614
SOL/USDT
Franklin Templeton submitted its spot ETF prospectus to the SEC. The prospectus states that the fee will be 0.19%, the lowest among Solana spot ETFs, and that no fees will be charged for the first $5 billion in assets under management. The ETF is expected to launch today.
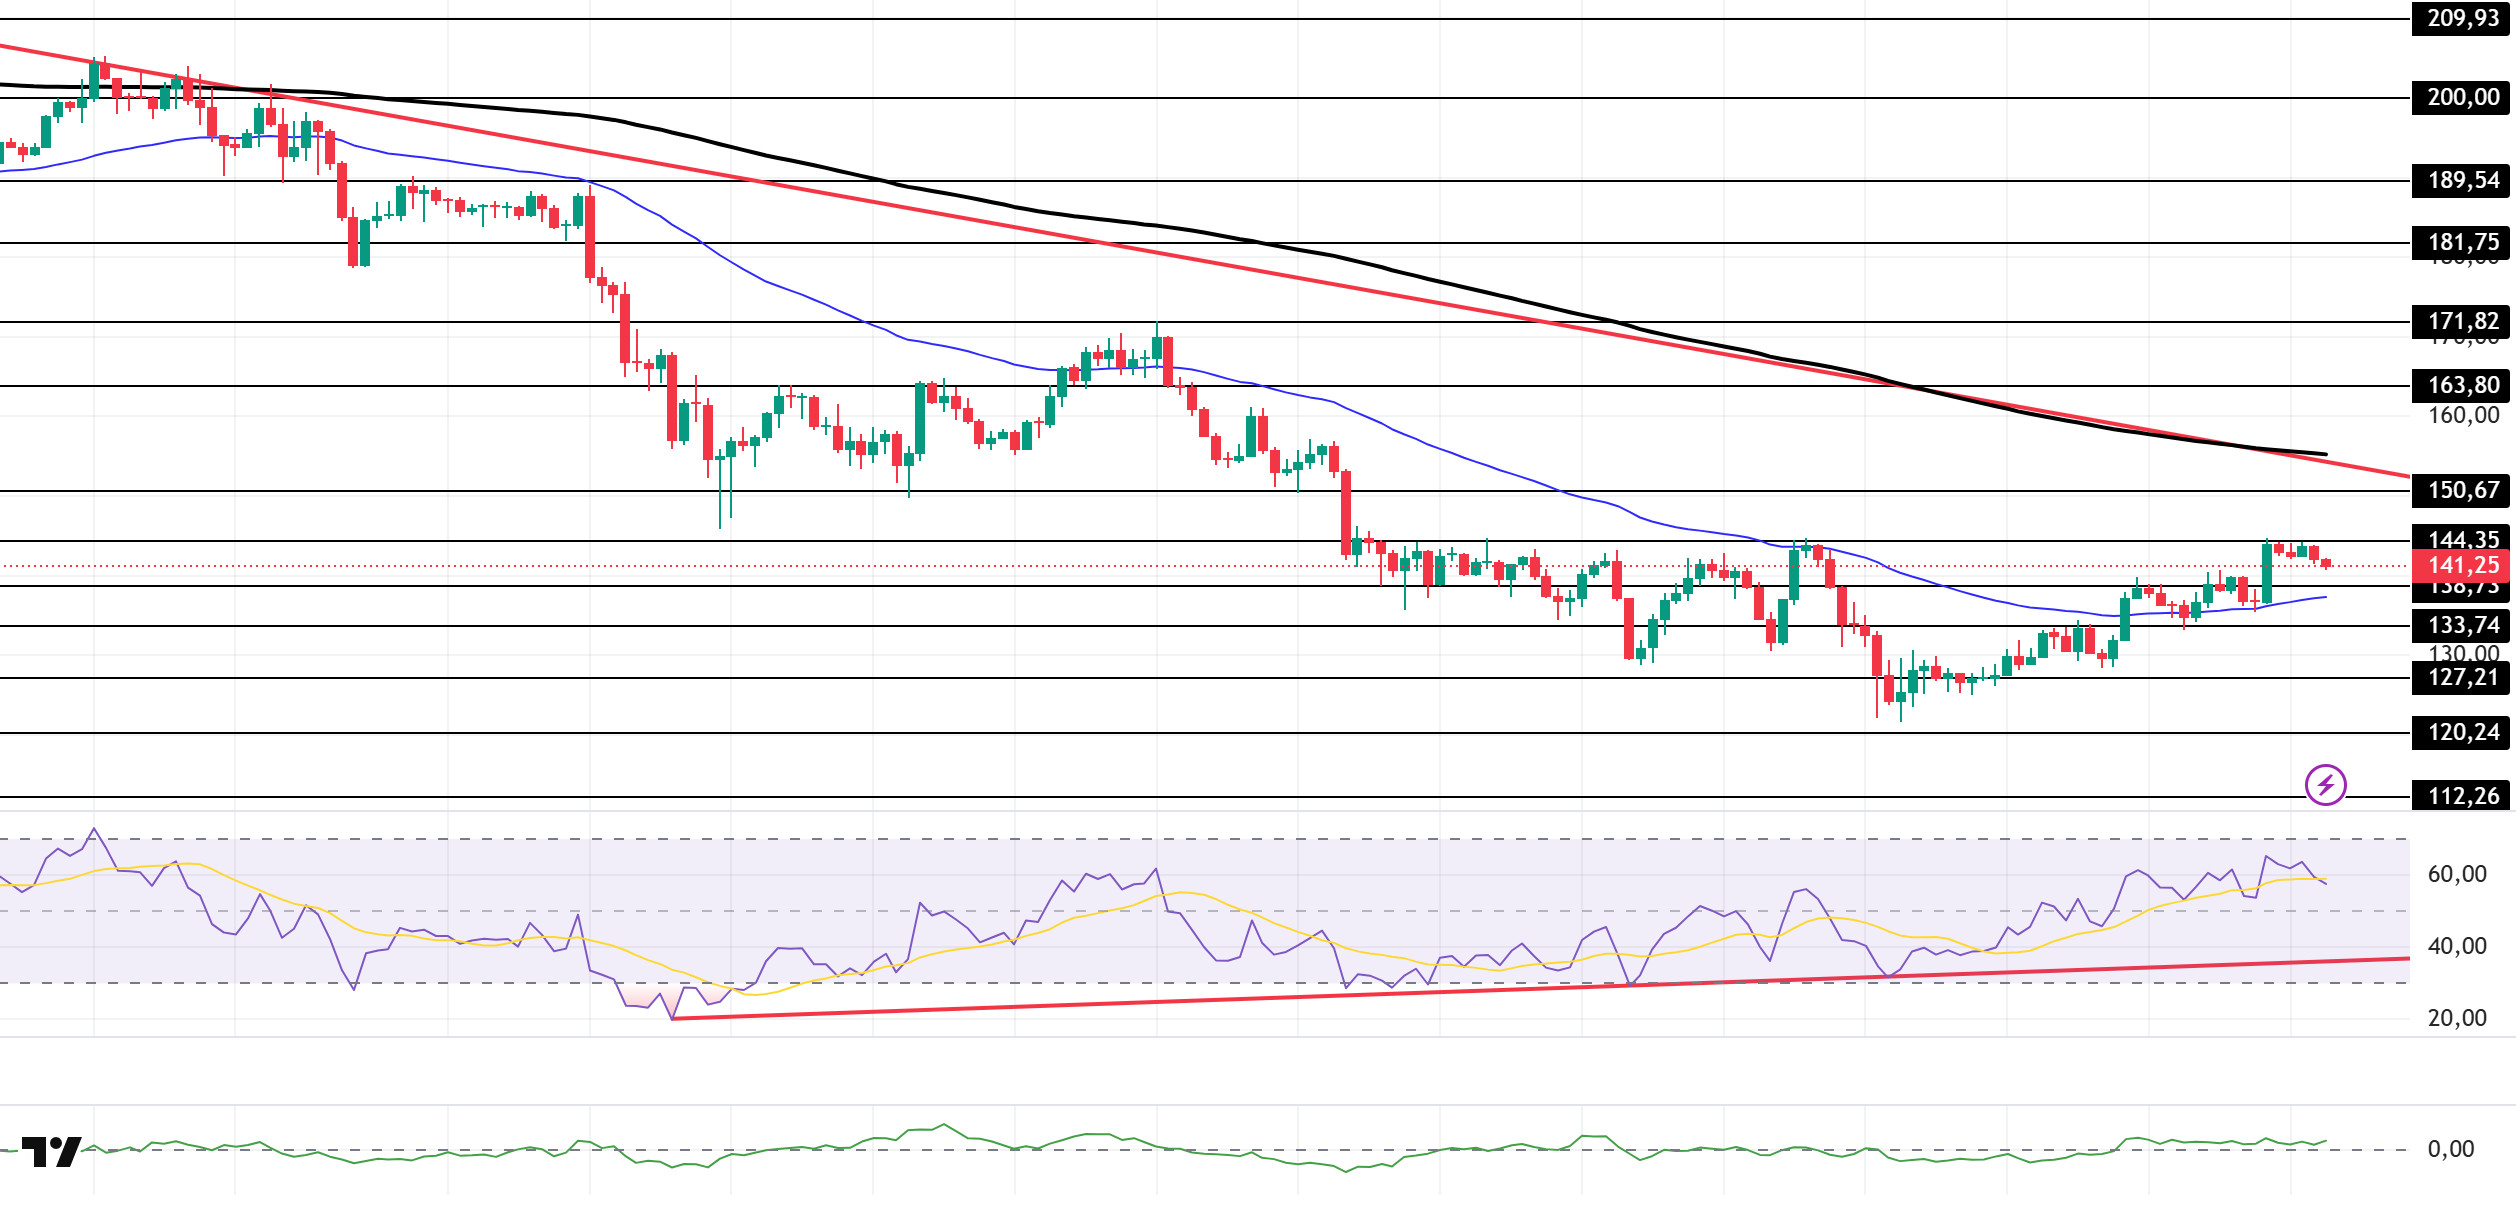
The SOL price experienced a slight pullback during the day. The asset remained in the lower region of the downtrend that began on October 6. Testing the strong resistance level of $144.35, the price failed to break through and experienced a slight pullback. If the pullback continues, it may test the 50 EMA (Blue Line) moving average as support. If the upward trend continues, it may test the $150.67 level and the downward trend as resistance.
The price remained below the 50 EMA (Exponential Moving Average – Blue Line) and 200 EMA (Black Line) on the 4-hour chart. This indicates a possible downtrend in the medium term. At the same time, the price being between the two moving averages shows us that the asset is in a decision phase in the short term. The Chaikin Money Flow (CMF-20) remained in positive territory. However, balanced cash inflows and outflows may keep the CMF in positive territory. The Relative Strength Index (RSI-14) retreated to the mid-level of positive territory. At the same time, it remained above the upward trend that began on November 4. In the event of an uptrend driven by macroeconomic data or positive news related to the Solana ecosystem, the $150.67 level stands out as a strong resistance point. If this level is broken upwards, the uptrend is expected to continue. In the event of pullbacks due to developments in the opposite direction or profit-taking, the $127.21 level could be tested. A decline to these support levels could increase buying momentum, presenting a potential opportunity for an upward move.
Supports: 138.73 – 133.74 – 127.21
Resistances: 144.35 – 150.67 – 163.80
DOGE/USDT
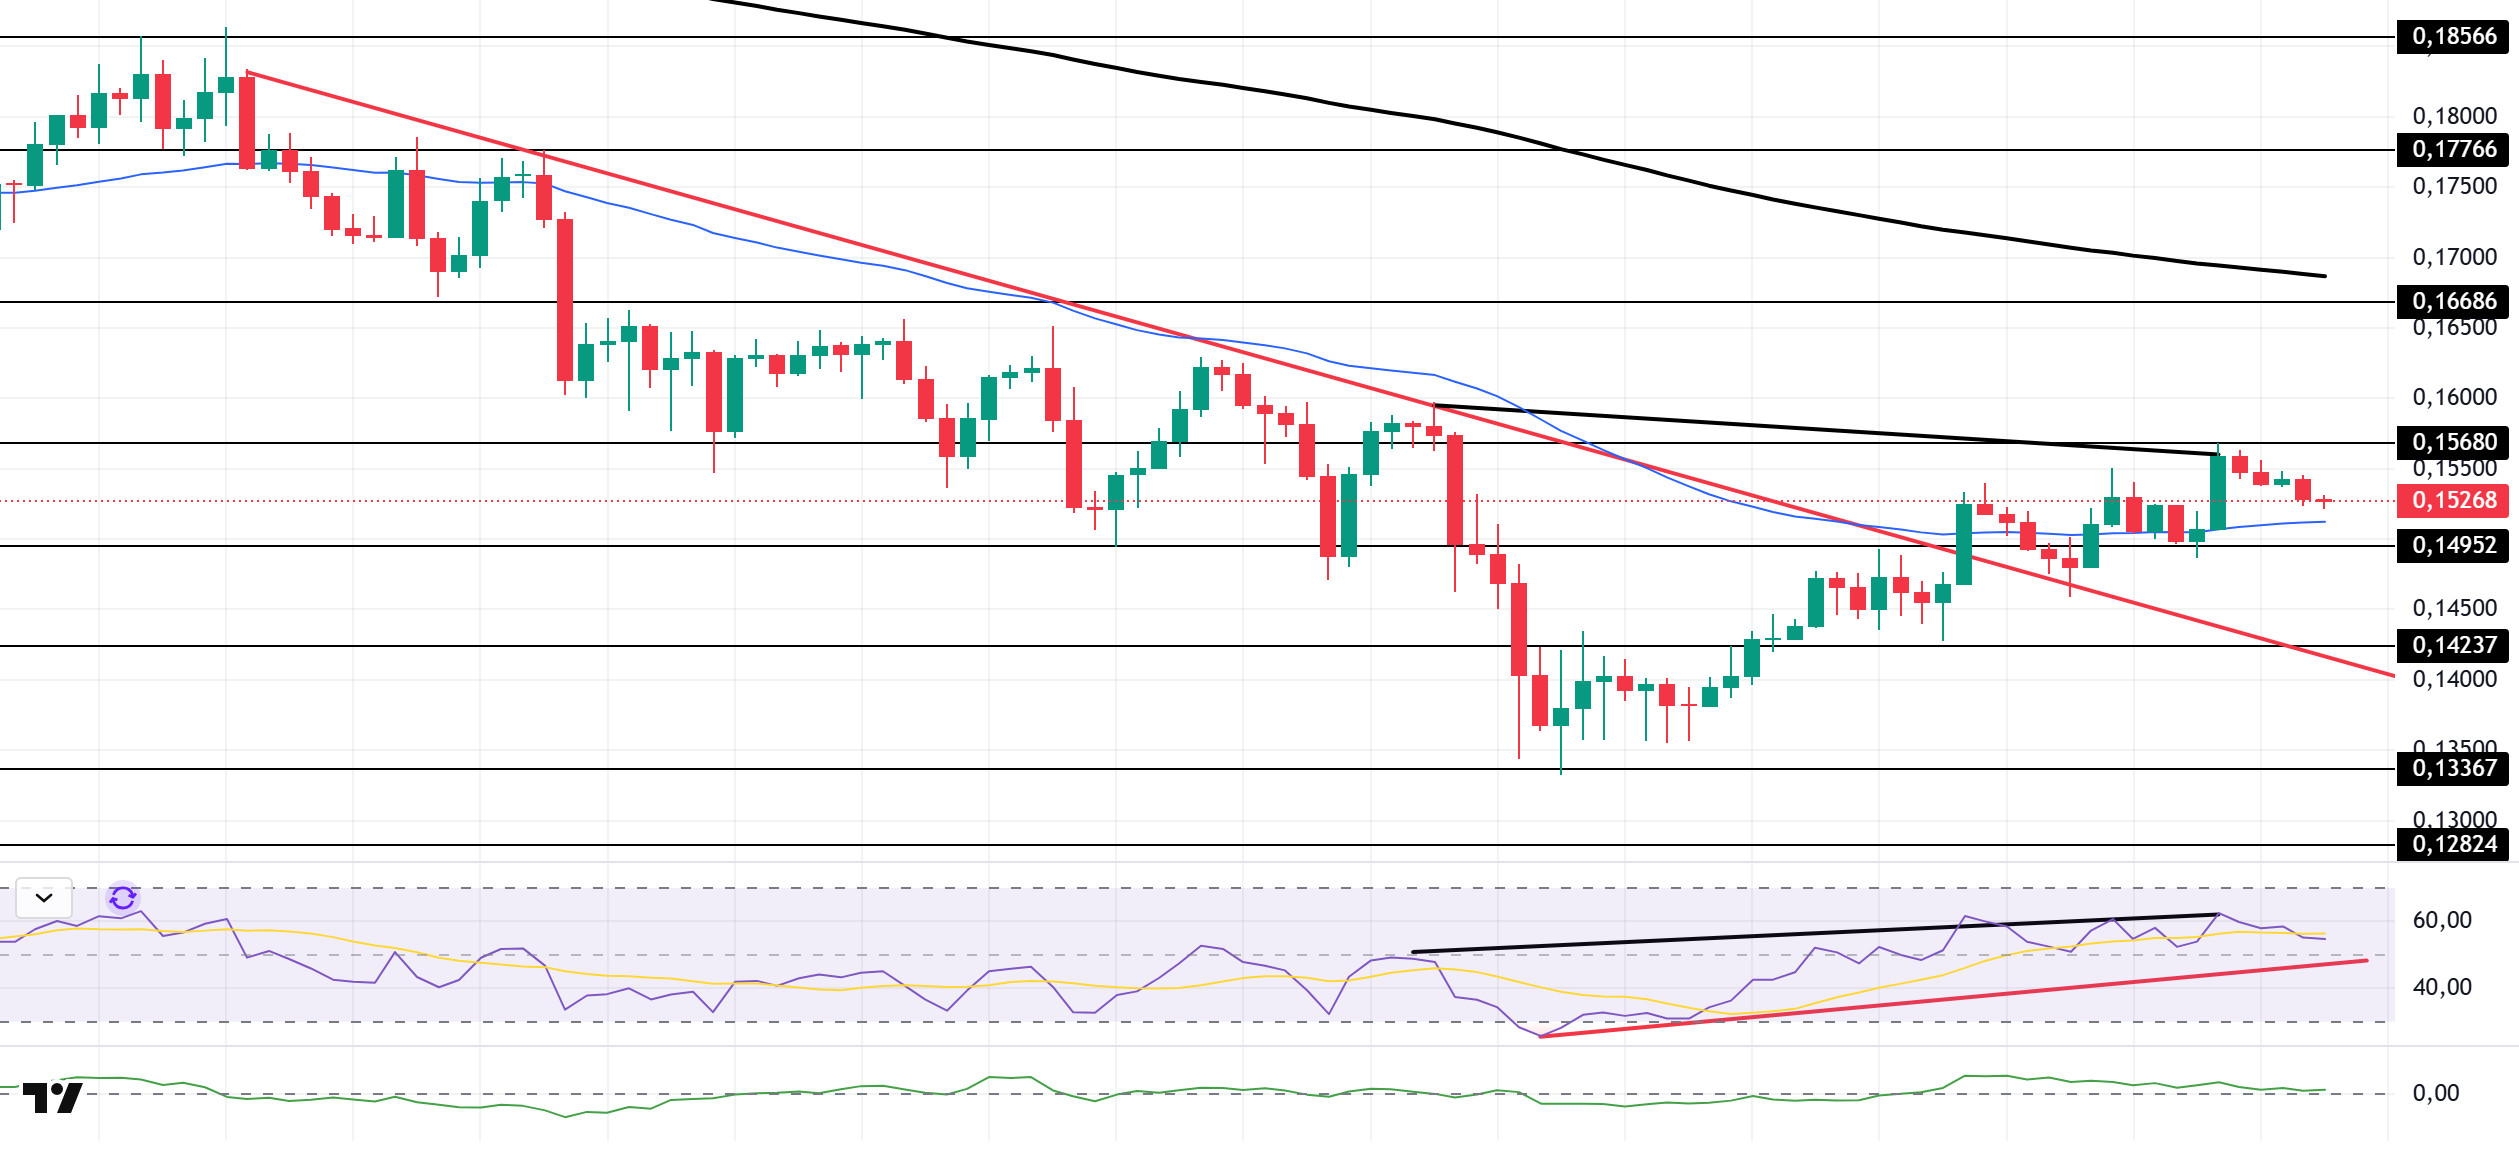
The DOGE price traded sideways during the day. The asset remained in the upper region of the downtrend that began on November 11. The price, which remained above the $0.14952 level, tested the strong resistance level of $0.15680 and experienced a slight pullback. If it closes above this level, it could test the 200 EMA (Black Line) moving average. If it experiences a pullback, it could test the 50 EMA (Blue Line) moving average as support.
On the 4-hour chart, the 50 EMA (Exponential Moving Average – Blue Line) remained below the 200 EMA (Black Line). This indicates that a downtrend may begin in the medium term. The price being between both moving averages indicates that the price is in a decision phase in the short term. The Chaikin Money Flow (CMF-20) remained in the positive zone. Additionally, balanced cash inflows and outflows may keep the CMF in positive territory. The Relative Strength Index (RSI-14) also remained in positive territory. At the same time, it continued to be in the upper region of the upward trend that began on November 21. This increased buying pressure. However, negative divergence should be monitored. In the event of potential increases driven by political developments, macroeconomic data, or positive news flow within the DOGE ecosystem, the $0.16686 level stands out as a strong resistance zone. Conversely, in the event of negative news flow, the $0.14237 level could be triggered. A decline to these levels could increase momentum and initiate a new wave of growth.
Supports: 0.14952 – 0.14237 – 0.13367
Resistances: 0.15680 – 0.16686 – 0.17766
SHIB/USDT
The latest noteworthy development on the Shiba Inu front is the transfer of approximately 200 billion SHIB back to centralized exchanges. Following a period of steady outflows, this reversal has brought the total SHIB reserves on exchanges to 81.65 trillion. According to on-chain data providers, inflows of this scale typically signal the repositioning of liquidity and the consideration of hedging or profit-taking options by major players. In this scenario, the additional supply directed towards exchanges could strengthen the selling side in the short term, but it could also open the door to a more neutral scenario in terms of market maker positioning.
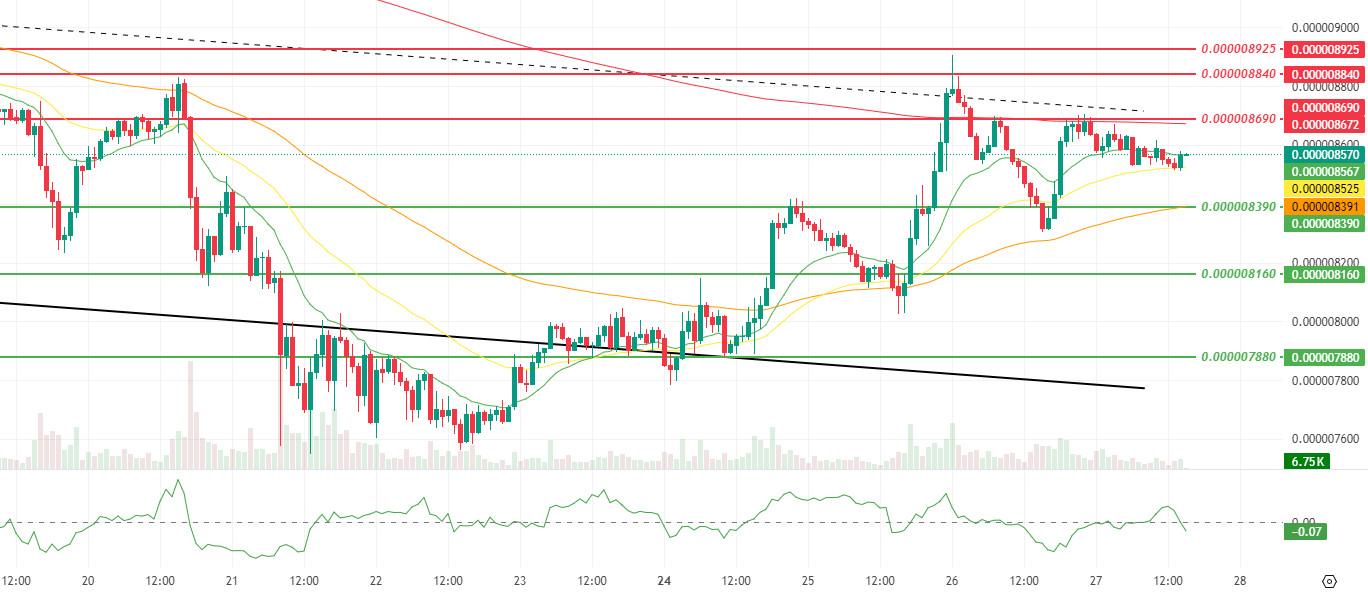
The technical chart shows that, following the dynamic reaction process highlighted in the previous report, price action is currently progressing in a more balanced but pressured manner near the middle band of the descending channel. While the recent outlook shows continued calm on the volatility side, the relatively limited pullbacks observed in volume and momentum indicate that buyers are continuing to take selective positions, particularly in support areas, rather than retreating entirely. This structure highlights a consolidation phase that points to a controlled digestion and repositioning process accompanied by narrowing volatility rather than an aggressive trend reversal. The Chaikin Money Flow (CMF) indicator’s retreat back into negative territory indicates that capital inflows have weakened compared to the previous period and that the current reaction structure has not yet fully settled on a strong liquidity base.
The positioning of the 9-period and 21-period Smoothed Moving Averages (SMMA) above the 50-period SMMA indicates that the positive structure in favor of the short-term trend is currently maintained. The price’s failure to break through the SMMA 200 period and the resistance zone at the $0.000008690 level in its latest attempt confirms that the rebound process continues to struggle at this critical technical barrier. Nevertheless, the fact that the support band passing through $0.000008390 and $0.000008160 is still functioning is an important factor suggesting that the bullish defense has not completely collapsed and that the rebound attempt remains valid. If the price breaks the $0.000008690 resistance level with volume-supported movement in the coming period, the $0.000008840 and $0.000008925 levels will be the next technical targets to watch in the short term. Conversely, a sustained close below the $0.000008160 support level and a deepening pullback towards the $0.000007880 zone would reposition the recent upward attempt around the SMMA 200 as a limited correction within the medium-term primary downtrend. However, if the price settles above the SMMA 200 period in the coming period and the Chaikin Money Flow (CMF) indicator shows a structure expanding from the negative zone to the neutral and positive zone, the possibility of a more structured and gradual recovery within the falling channel will regain strength. (SMMA9: Green Line, SMMA21: Yellow Line, SMMA50: Orange Line, SMMA 200: Red Line)
Supports: 0.000008390 – 0.000008160 – 0.000007880
Resistances: 0.000008690 – 0.000008840 – 0.000008925
Legal Notice
The investment information, comments, and recommendations contained herein do not constitute investment advice. Investment advisory services are provided individually by authorized institutions taking into account the risk and return preferences of individuals. The comments and recommendations contained herein are of a general nature. These recommendations may not be suitable for your financial situation and risk and return preferences. Therefore, making an investment decision based solely on the information contained herein may not produce results in line with your expectations.

