
Technical Analysis
BTC/USDT
Strategy’s massive purchase of 8,178 BTC indicates that institutional demand remains strong, while CoinShares data shows the opposite, revealing the largest outflow from digital asset products since February last week. The $2 billion outflow from the US confirms that uncertainty in monetary policy and large investor sales are increasing pressure. Adding BlackRock’s transfer of hundreds of millions of dollars worth of BTC and ETH to a central exchange to this picture, it appears that the repositioning process on the institutional side is accelerating. These mixed signals indicate that the risk of high volatility in the crypto market continues in the short term.
From a technical perspective, BTC moved above the 95,000 level during the day but then fell back to the 93,700 level due to renewed selling pressure. As market uncertainty and high volatility continue, the price’s continued decline without an upward reaction indicates that it is still searching for a bottom.
Technical indicators reflect indecision, with the Wave Trend (WT) oscillator generating a buy signal in the oversold zone, while the Momentum (SM) indicator’s histogram attempts to gain strength after reaching maximum weakness in the negative zone. The Kaufman Moving Average (KAMA) is currently positioned above the price at the $96,800 level.
According to liquidation data, the recent decline has largely cleared out the buying tiers, while the weight of the selling tiers continues. Selling intensity is accumulating within the 97,000–98,000 band, while weakness persists in the buying tier.
In summary, with the reopening of the US government, most federal agencies have recalled their staff and begun to gradually resume operations. However, hawkish statements from Fed members continue to suppress expectations of interest rate cuts. On the technical side, the price is currently unable to hold above the 95,000 reference zone. While new lows are being explored with closes below this level, the spike-like nature of the move could signal a potential reversal to the upside. If the 95,000 level is regained after this decline, the 97,200 resistance zone will be targeted. If selling pressure persists, the 92,600 support level will be monitored in the event of a break below 93,700.
Supports: 95,000 – 93,700 – 91,400
Resistances: 97,200 – 98,000 – 99,100

ETH/USDT
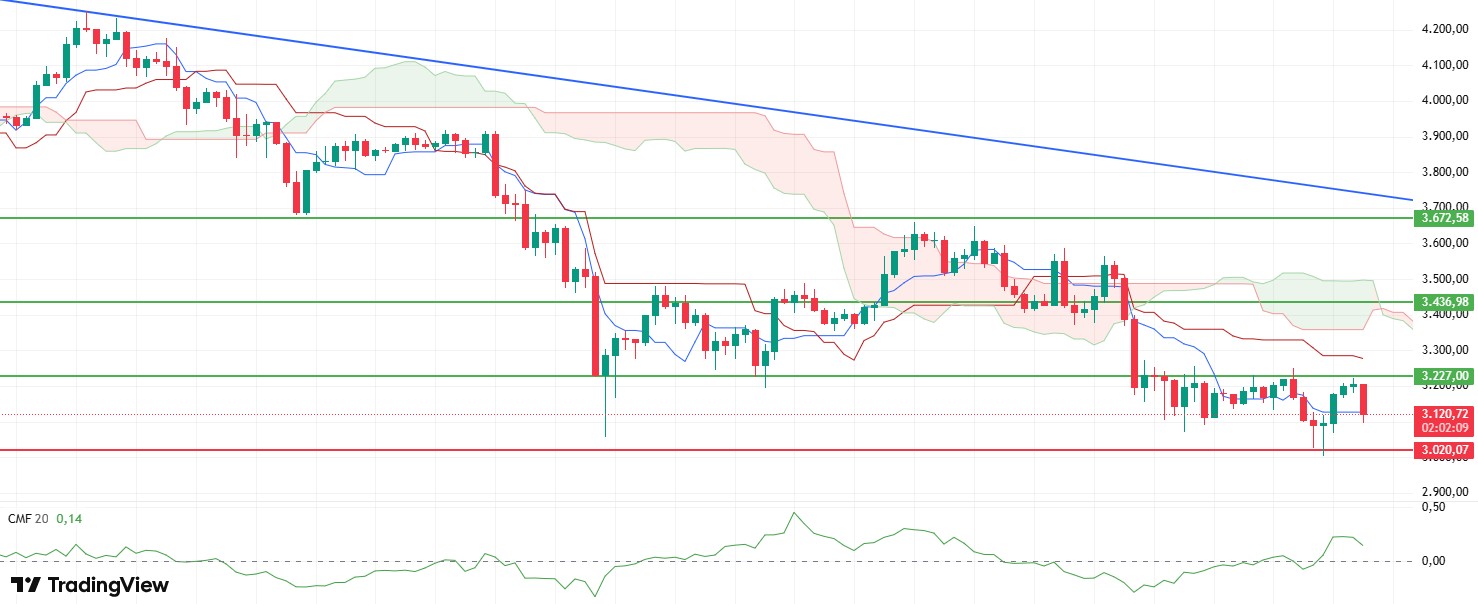
After reaching the resistance level of $3,227 during the day, the ETH price quickly retreated due to selling pressure from this region and fell to the $3,090 level. Although this sharp reversal indicates that sellers have regained dominance in the short term, the price approaching the main support zone is bringing reactionary buying back into focus.
Indicators on the liquidity side suggest that, despite the decline, the picture is not entirely negative. Although the Chaikin Money Flow (CMF) indicator retreated slightly, it managed to stay in positive territory compared to the severity of the decline, and there was no significant liquidity outflow. This suggests that price pressure is limited and buyers have not completely exited the market.
The Relative Strength Index (RSI) presents a weaker picture. The indicator has pulled back sharply, signaling increased momentum loss. In the short term, buyers losing strength stands out as a factor that could slow down the price recovery process.
Cumulative Volume Delta (CVD) data reveals that the decline came mainly from the futures markets. When evaluated together with CMF data, the more limited sales on the spot side indicate that rebound buying could regain strength. This structure shows that the decline did not turn into panic and that the market maintained its overall liquidity balance.
In the Ichimoku indicator, the price losing the Tenkan level again weakens the short-term positive outlook. Remaining below the Kijun and kumo cloud reminds us that the trend structure has not yet turned positive. Despite upward attempts, medium-term risks remain valid.
The overall outlook highlights that it is critical for the price to maintain support at the $3,020 level. A break below this support could accelerate the decline and bring lower support levels into play. However, thanks to the positive picture maintained by CMF and CVD data, if the $3,020 s hold, the price could initiate another upward reaction wave. In the short term, the main scenario is shaped by whether this level will be maintained or not.
Supports: 3,020 – 2,760 – 2,550
Resistances: 3,227 – 3,436 – 3,672
XRP/USDT
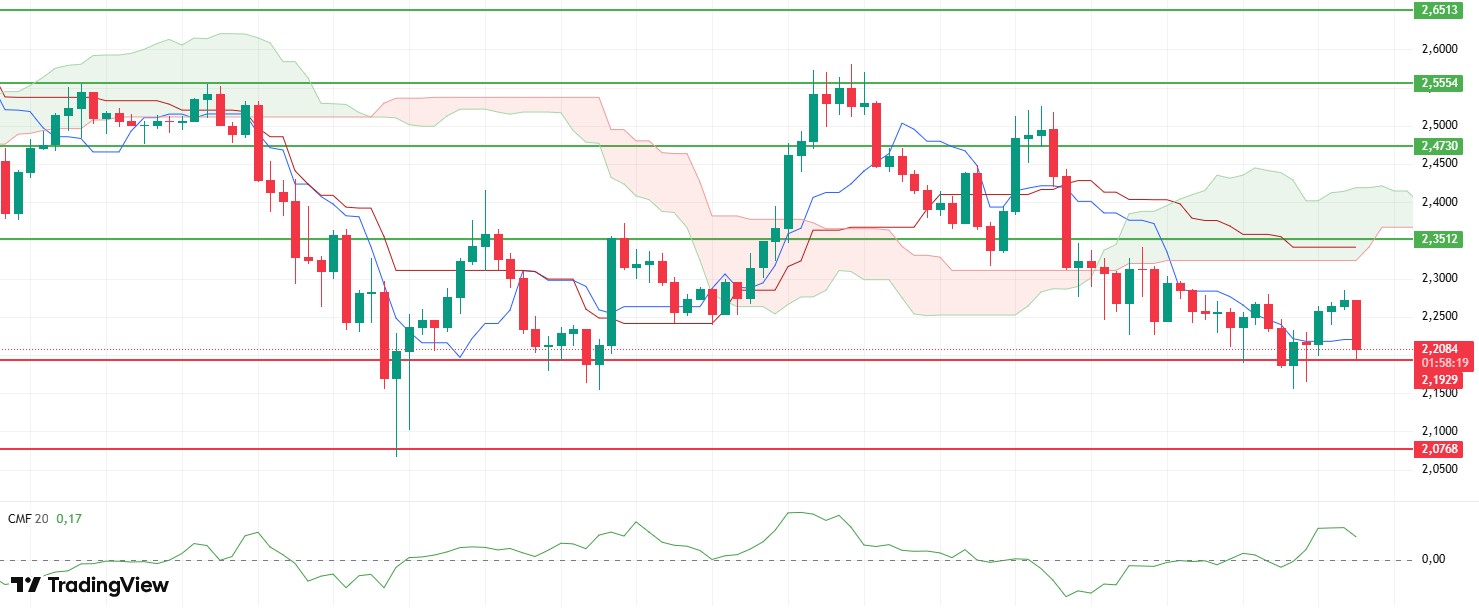
After rising to $2.29 during the day, the XRP price retreated with selling pressure from this region and fell to the $2.19 support level. The weak reaction buying from this region indicates that the price is trying to hold in the short term.
The slight pullback in the Chaikin Money Flow (CMF) indicator did not occur at the same rate as the decline, revealing that liquidity flow remained strong. Despite seller pressure, the lack of intense liquidity outflow from the market indicates that buyers have not completely disappeared in the short term, providing support on the positive side.
The pullback in the Relative Strength Index (RSI) indicates increasing momentum loss. Weakening upward movement attempts may limit short-term recovery.
The loss of the Tenkan level in the Ichimoku indicator weakens the short-term technical outlook. The price remaining below the Kijun and kumo cloud indicates that the trend structure has not yet turned positive. While medium-term pressure persists, the possibility of upward attempts remaining limited continues.
The $2.19 support level is key for intraday movements. If this level holds, buying pressure could continue, potentially triggering another upward move in the price. However, if the $2.19 level is lost, selling pressure could increase, leading to a deeper pullback towards the $2.07 support level.
Supports: 2.1929 – 2.0768 – 1.9092
Resistances: 2.3512 – 2.4730 – 2.5554
SOL/USDT
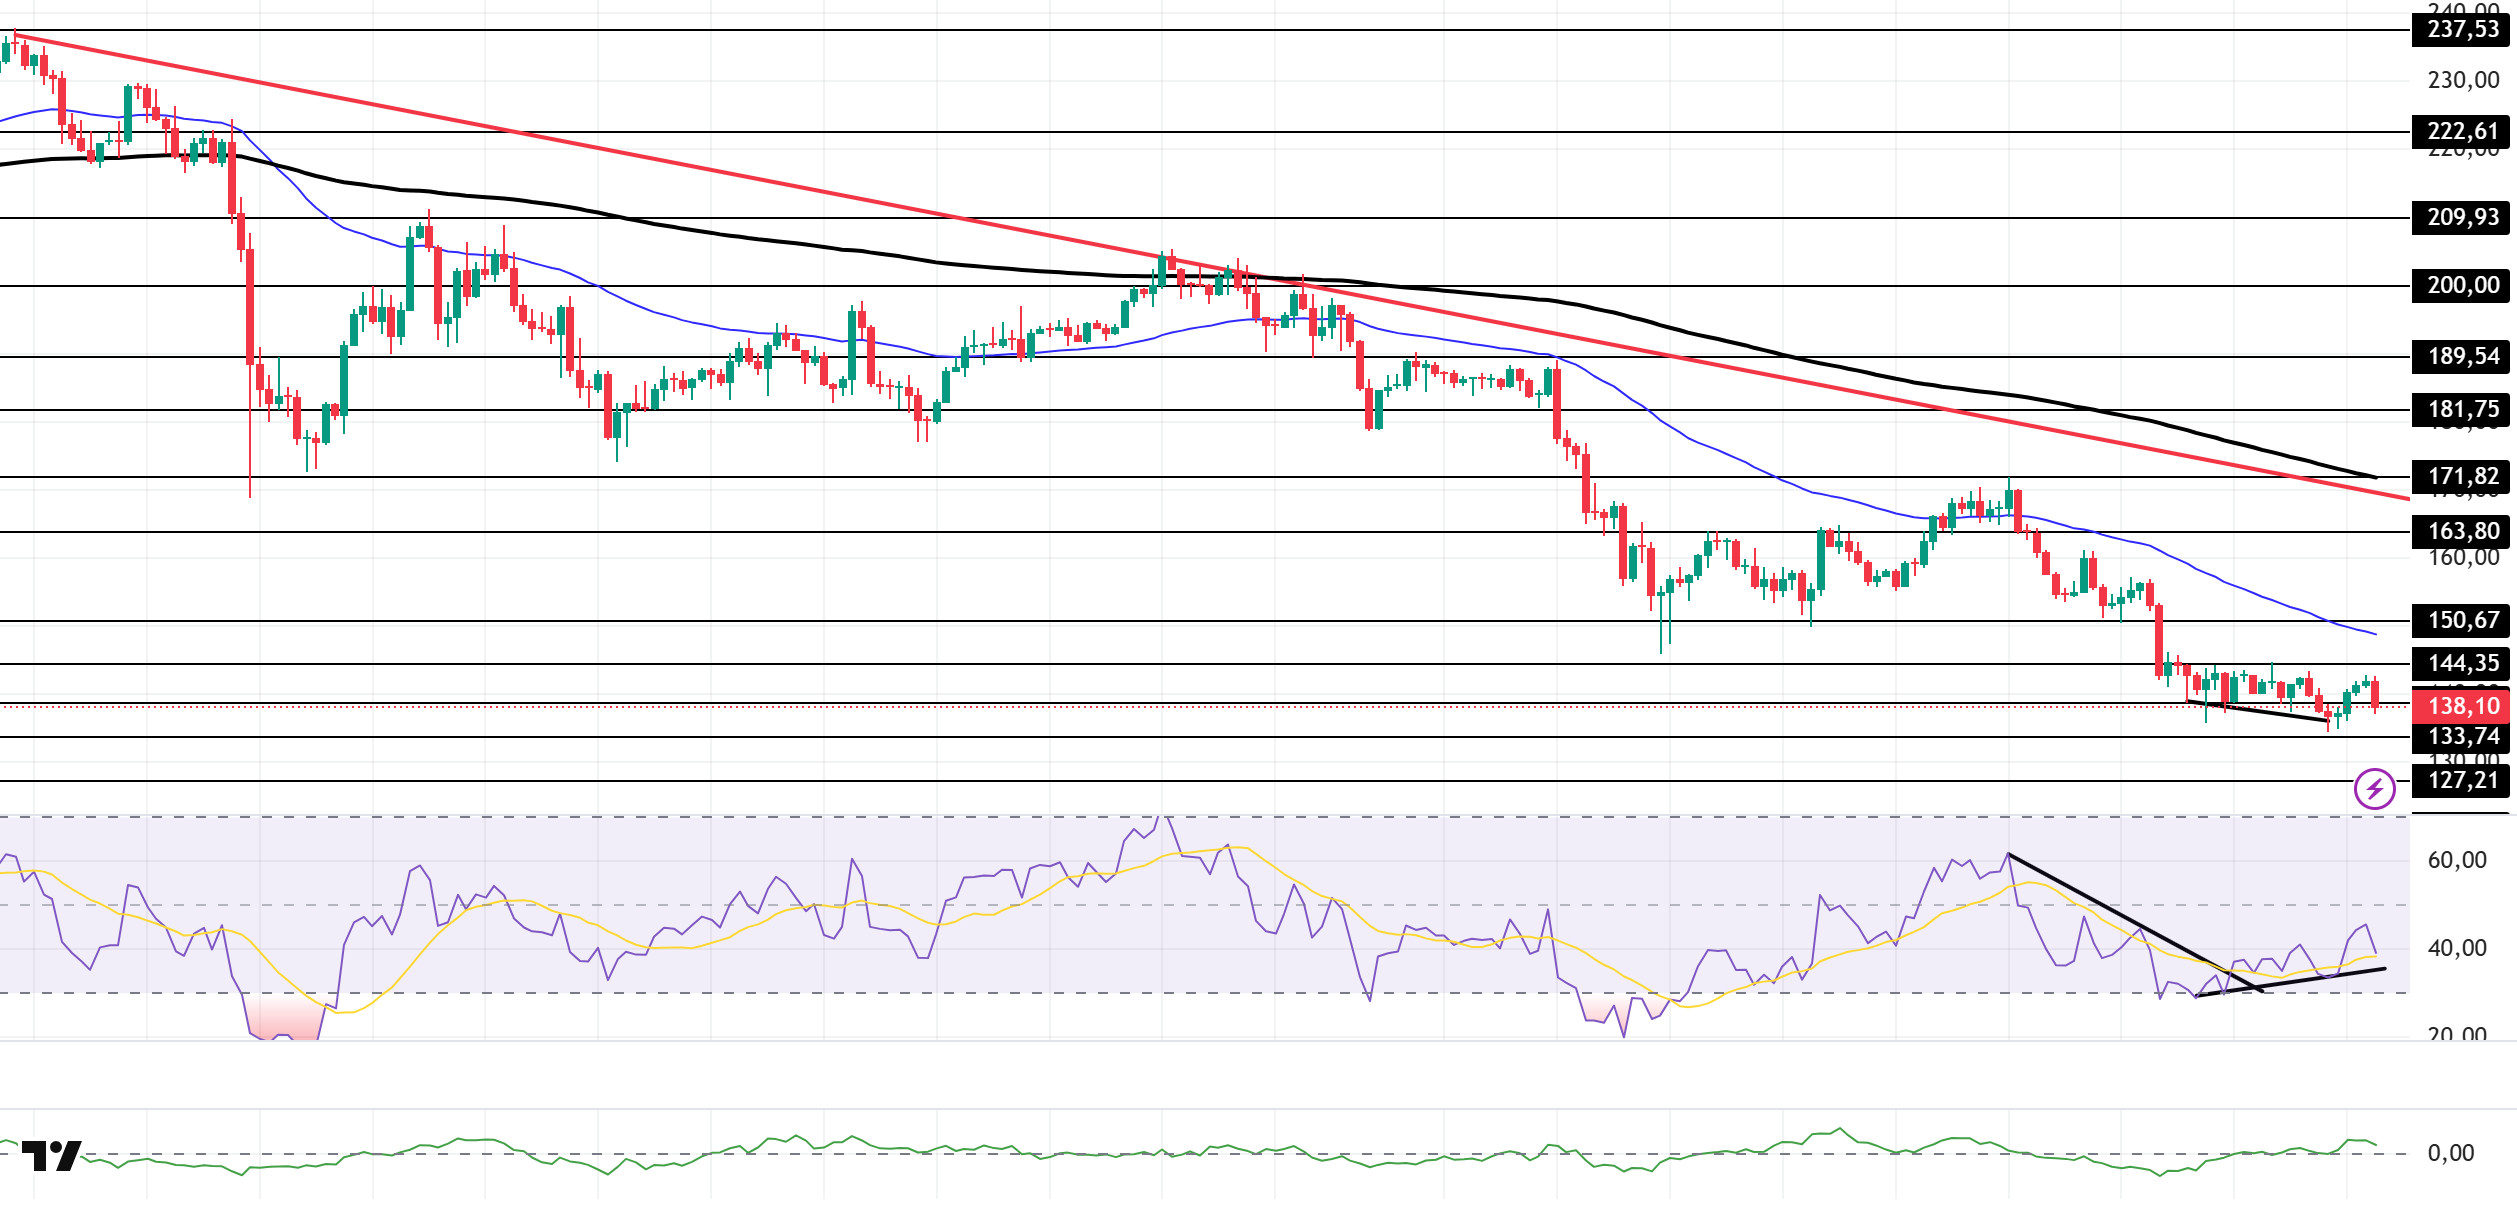
The SOL price experienced a slight decline during the day. The asset continued to trade in the lower region of the downtrend that began on October 6. It also continued its decline, facing resistance at the strong resistance level of $144.35. Currently testing the strong support level of $138.73, the price could test the 50 EMA (Blue Line) moving average if it experiences an uptrend. If the pullback continues, the $127.21 level could act as support.
On the 4-hour chart, it remained below the 50 EMA (Exponential Moving Average – Blue Line) and 200 EMA (Black Line). This indicates a possible downtrend in the medium term. At the same time, the price being below both moving averages shows us that the asset is in a downward trend in the short term. The Chaikin Money Flow (CMF-20) remained in positive territory. However, a decrease in money inflows could push the CMF into negative territory. The Relative Strength Index (RSI-14) remained in the middle of the negative zone. It is also above the downward trend that began on November 11. These indicate increased buying pressure. There is also a bullish divergence. If there is an uptrend due to macroeconomic data or positive news related to the Solana ecosystem, the $150.67 level stands out as a strong resistance point. If this level is broken upwards, the uptrend is expected to continue. If pullbacks occur due to developments in the opposite direction or profit-taking, the $127.21 level could be tested. A decline to these support levels could increase buying momentum, presenting a potential upside opportunity.
Supports: 138.73 – 133.74 – 127.21
Resistances: 144.35 – 150.67 – 163.80
DOGE/USDT
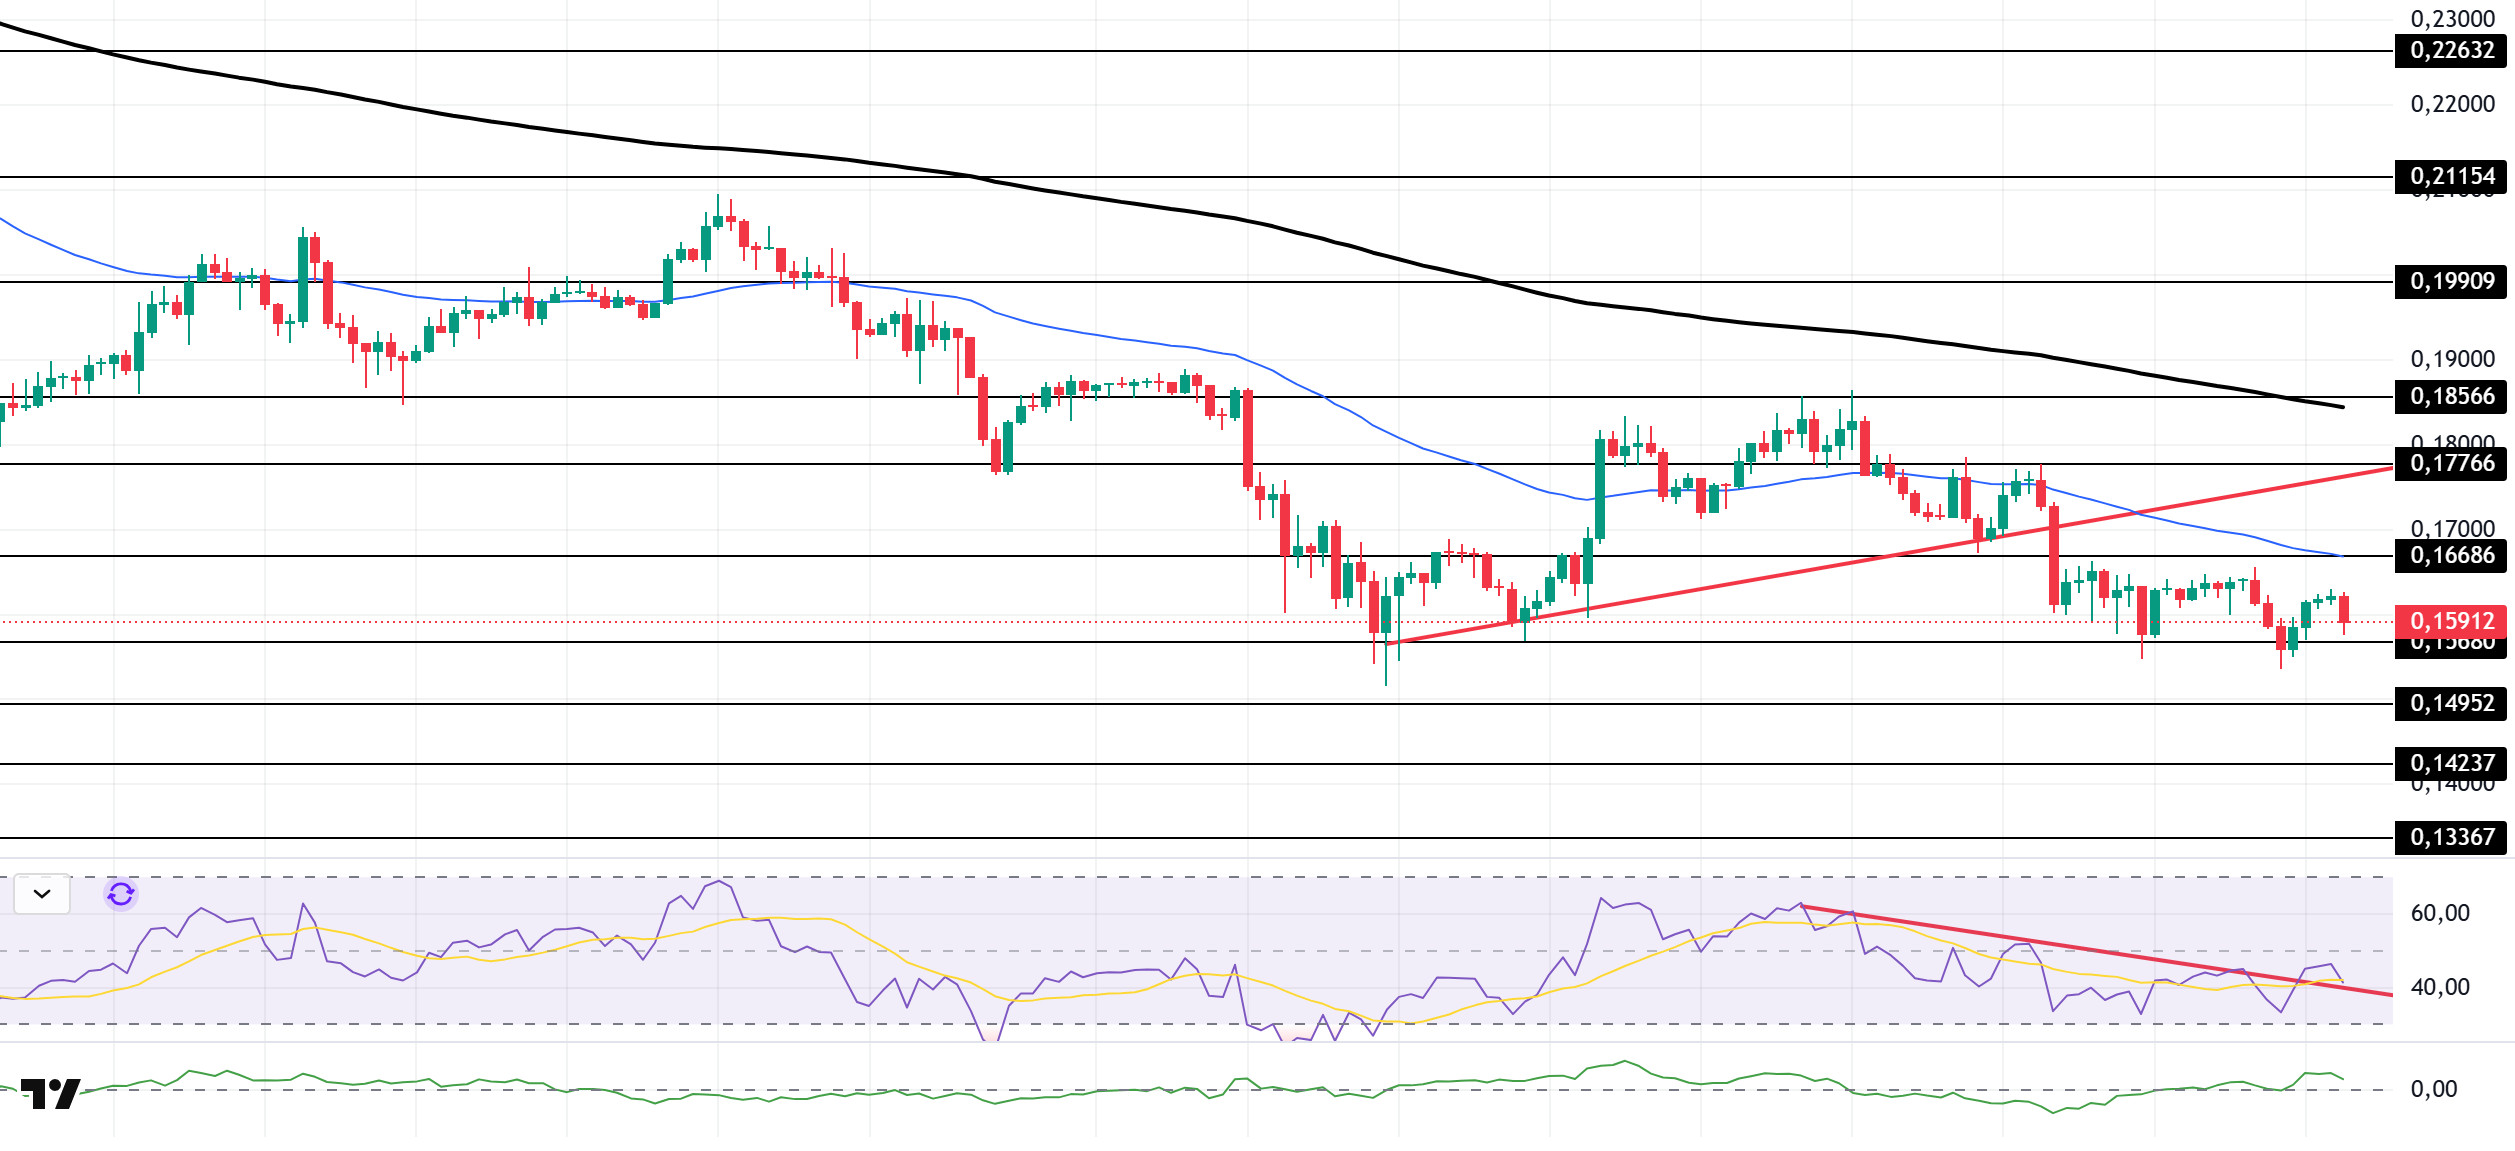
The DOGE price experienced a pullback during the day. The asset continued to trade in the lower region of the upward trend that began on November 4. Currently testing the $0.15680 level as support for the third time, the price could test the 50 EMA (Blue Line) moving average as resistance if it regains momentum from here. If the price closes below the $0.15680 level, it could test the $0.14237 level.
On the 4-hour chart, the 50 EMA (Exponential Moving Average – Blue Line) remained below the 200 EMA (Black Line). This indicates that a downtrend may begin in the medium term. The price being between the two moving averages indicates that the price is in a decision phase in the short term. The Chaikin Money Flow (CMF-20) continued to be in the positive zone, close to the neutral zone. Additionally, a decrease in money inflows could push the CMF back into negative territory. The Relative Strength Index (RSI-14) rose to the middle of the negative zone. At the same time, it broke above the downward trend that began on November 10, signaling buying pressure. In the event of an uptrend driven by political developments, macroeconomic data, or positive news flow in the DOGE ecosystem, the $0.17766 level stands out as a strong resistance zone. Conversely, in the event of negative news flow, the $0.14237 level could be triggered. A decline to these levels could increase momentum and initiate a new wave of growth.
Supports: $0.15680 – $0.14952 – $0.14237
Resistances: 0.16686 – 0.17766 – 0.18566
SHIB/USDT
The Shiba Inu team sent an urgent “migrate” warning to the entire ecosystem, announcing that the old public RPC endpoints used on the Shibarium network will be completely shut down very soon. Developer johndoeshib emphasized that those running Shibarium nodes, wallet providers, DEXs, dApps, and users who have manually added Shibarium to their wallets must migrate their settings to the new official RPC address to avoid losing network access. It was stated that this transition is not routine maintenance, but a strategic step aimed at reducing the risk of single points of failure caused by excessive reliance on a small number of public RPCs, and at increasing Shibarium’s decentralization, stability, and long-term resilience. The team also hinted at a new project that is “wallet-friendly and fully in line with the SHIB spirit.” However, while these announcements were met with mixed reactions in the community due to the monthly decline in the SHIB price, a roughly 23% increase in daily trading volume alongside positive developments in the ecosystem was noteworthy.
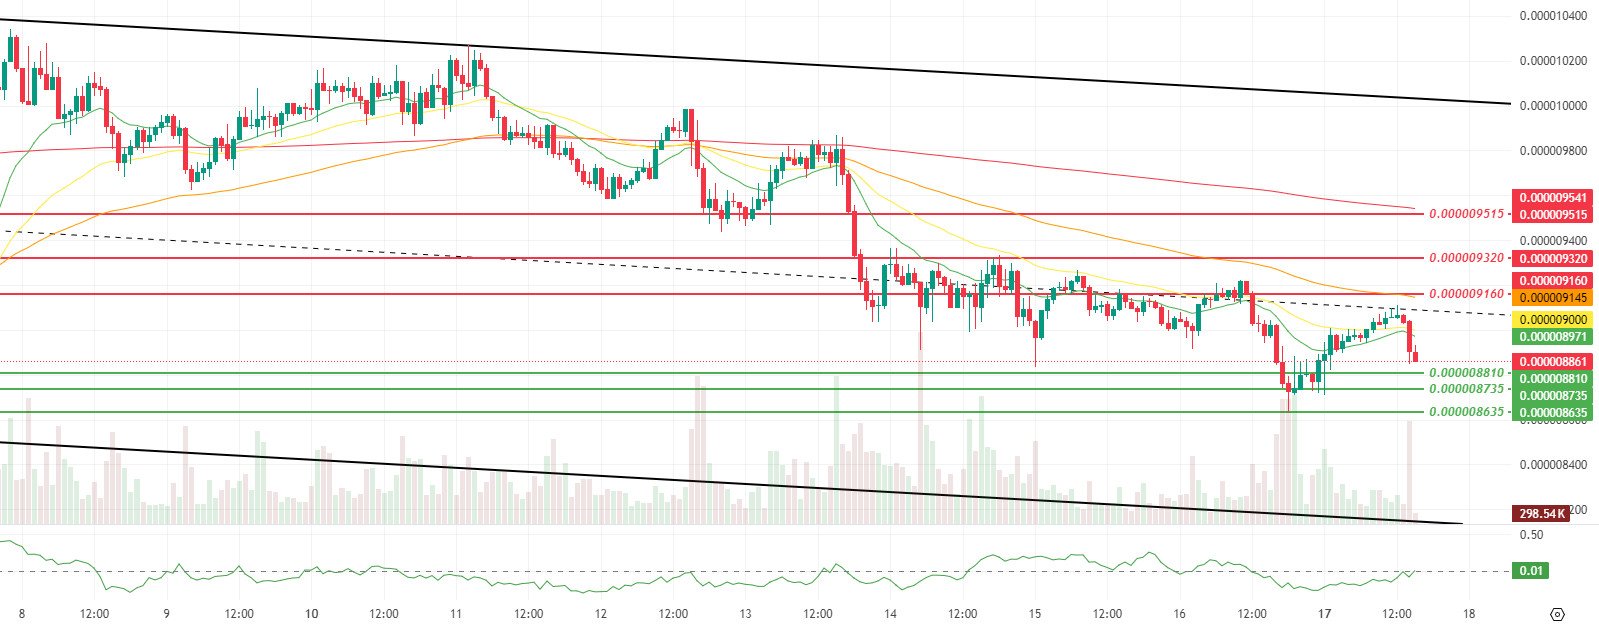
The technical chart shows that the reaction formed after the positive divergence mentioned in this morning’s analysis began to weaken, limited by the middle band of the falling channel. The price’s retreat below the 9-period and 21-period Smoothed Moving Averages (SMMA) after being rejected from this middle band indicates that the defense line established by buyers in the short term has collapsed and control has shifted back to sellers. The Chaikin Money Flow (CMF) indicator remaining in negative territory suggests that new entries are still weak and that the movement is limited to position reduction and a renewed risk-averse trend. Although the decline in momentum and volatility indicates that aggressive selling pressure has been tempered for now, the relatively smaller pullback in volume paints a picture consistent with a wait-and-see mode rather than a strong demand rebound.
For upward attempts, the middle band of the falling channel and closes above $0.000009160 will be monitored in the first stage; if sustainability is achieved above this level and the intermediate resistances around $0.000009320 and $0.000009515 are taken back with increasing volume and CMFre-entering positive territory, it could gain momentum for a more meaningful recovery scenario, featuring both a controlled rebound in volatility and opening up space towards the upper band of the descending channel. Below, the loss of the $0.000008810 support could accelerate the decline again, paving the way for testing the $0.000008735 and then the $0.000008635 bands. As long as the price remains below SMMA 50 and SMMA 200 and the descending channel structure is not clearly broken upwards, this movement appears to be a reaction. For a permanent change in direction, a stronger trend breakout accompanied by a recovery in both volume and volatility is needed. (SMMA9: Green Line, SMMA21: Yellow Line, SMMA50: Orange Line, SMMA 200: Red Line)
Supports 0.000008810 – 0.000008735 – 0.000008635
Resistances: 0.000009160 – 0.000009320 – 0.000009515
SUI/USDT
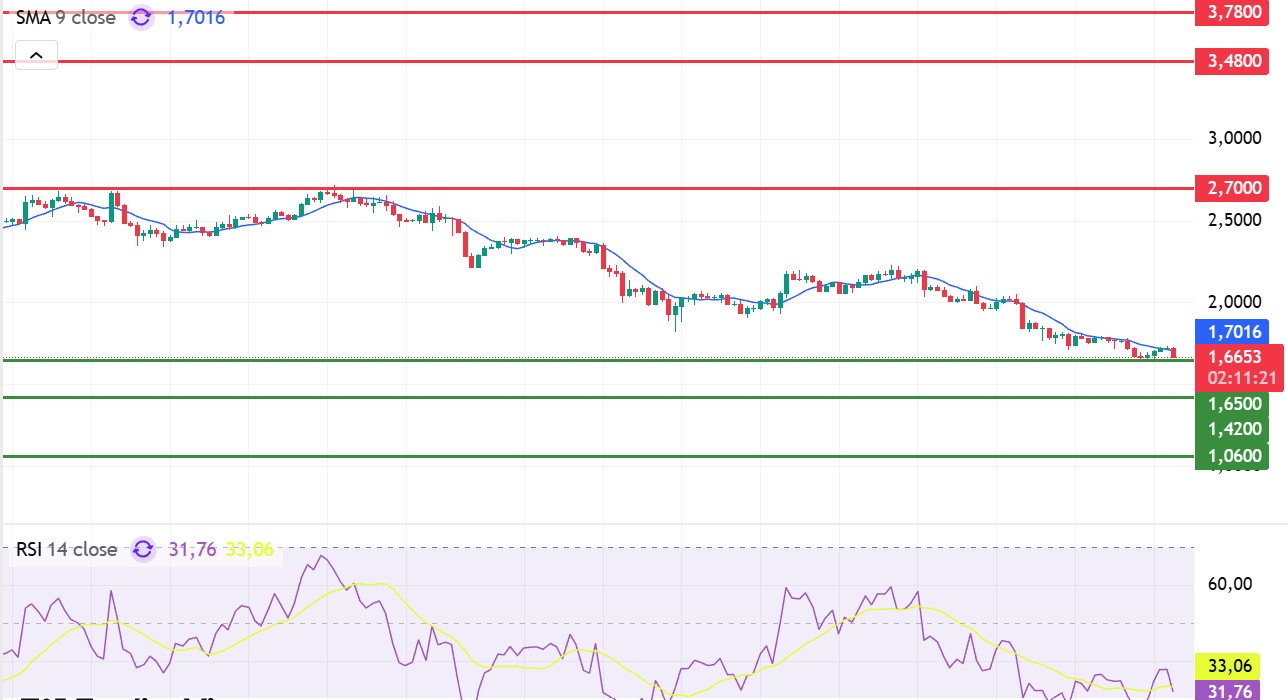
Looking at Sui’s technical outlook, we see that the price has been moving sideways at around $1.66 on a weekly basis, influenced by fundamental developments. The Relative Strength Index (RSI) is currently in the range of 33.06 – 31.76. This range indicates that the market is trading close to the buy zone; a drop in the RSI to the 35.00 – 30.00 range could signal a potential buying point. If the price moves upward, the resistance levels of $2.70, $3.48, and $3.78 can be monitored. However, if the price falls to new lows, it could indicate that selling pressure is intensifying. In this case, the support levels of $1.65, $1.42, and $1.06 come to the fore. Based on the trend line, a pullback to $1.71 appears technically possible. According to Simple Moving Averages (SMA) data, Sui’s average price is currently at $1.70. If the price remains below this level, it could signal that the current uptrend may not continue technically.
Supports: 1.06 – 1.42 – 1.65
Resistances: 2.70 – 3.48 – 3.78
Legal Notice
The investment information, comments, and recommendations contained herein do not constitute investment advice. Investment advisory services are provided individually by authorized institutions taking into account the risk and return preferences of individuals. The comments and recommendations contained herein are of a general nature. These recommendations may not be suitable for your financial situation and risk and return preferences. Therefore, making an investment decision based solely on the information contained herein may not produce results in line with your expectations.

