
Technical Analysis
BTC/USDT
While the Supreme Court debated the legal limits of Trump’s tariff authority, most judges appeared cautious about this power. Meanwhile, China’s suspension of additional tariffs and its expansion of rare earth cooperation with the EU bolstered hopes for stability in the global supply chain. Democratic election victories in Virginia, New Jersey, and New York increased pressure to end the government shutdown. On the economic front, strong employment and services data pushed expectations for a Fed rate cut in December down to 62%, while long-term bond yields rose.
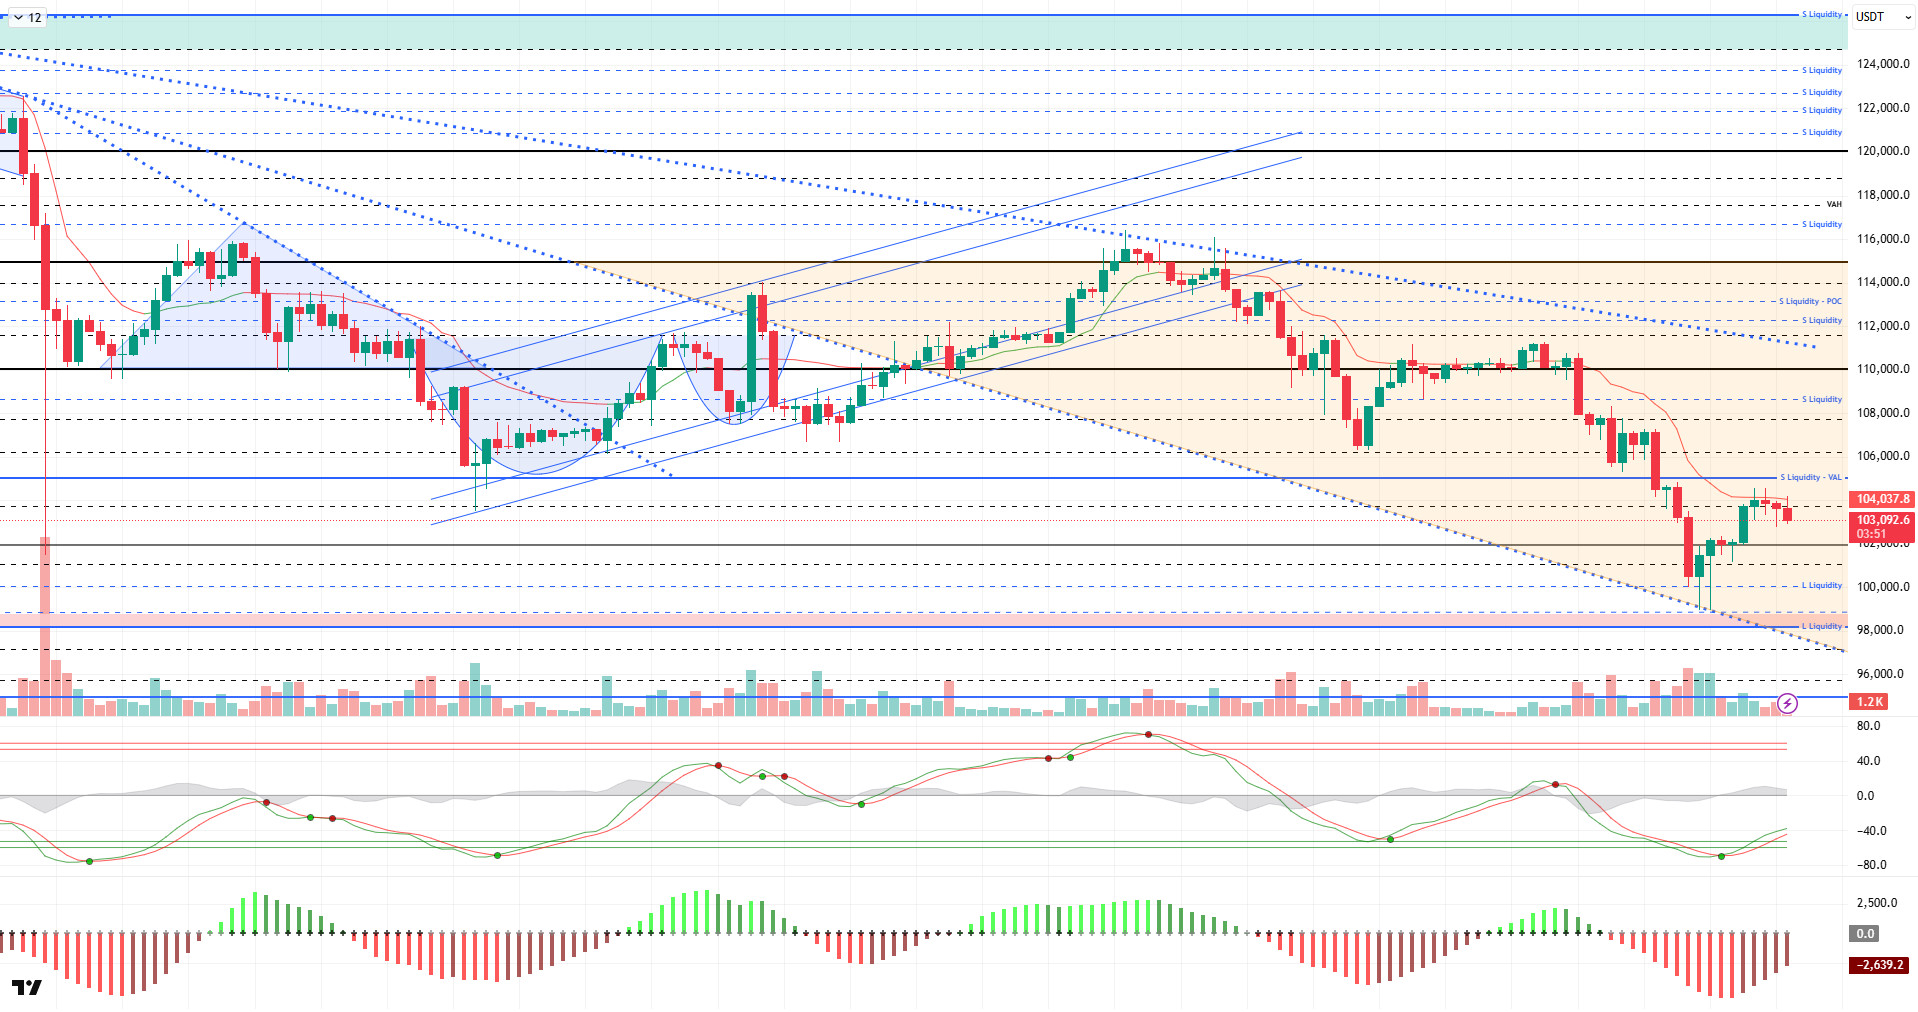
From a technical perspective, BTC continued its upward reaction after touching the lower line of the falling trend band, but it is noteworthy that the rise remained a “dead cat bounce.” In the previous analysis, the price reached the 104,500 level but could not stay there and fell back to the 103,000 level. BTC, which is struggling to maintain momentum in its price, does not appear to be experiencing a sustained upward trend from a technical perspective at this time.
Technical indicators show that the Wave Trend (WT) Oscillator is weakening just above the oversold zone, parallel to the buy signal it gave, while the Squeeze Momentum (SM) indicator continues to try to gain strength after reaching maximum weakness in the negative zone. The Kaufman Moving Average (KAMA) is currently at $104,030, positioned above the price.
According to liquidation data, investors who seized the opportunity during the recent decline recorded a concentration at the 98,000 level, with another concentration at the 100,000 level. In contrast, the first sell-off level at 102,500 resulted in liquidation, while the 105,600 level is another area where accumulation is increasing. Looking at the last 24 hours’ liquidation data, $319 million worth of transactions resulted in liquidation.
In summary, while the effects of the US-China tariff crisis being suspended for a year and resulting in a compromise continue, optimistic developments continue to emerge from both sides. However, the Fed’s hawkish tone on interest rate cuts continues to put pressure on the market, while the uncertainty caused by the US government shutdown persists. On the technical side, although BTC recorded short-term increases from time to time, it touched the lower trend line parallel to the descending trend channel it formed. In liquidity data, while the dominance of the selling tier continues, buyers are beginning to reappear. In the coming period, 103,300 will be monitored as a resistance point, and if this level is gained, the 105,000 reference area and then the 105,600 liquidity zone can be monitored.In the event of a potential new selling pressure, 101,800 is the first support point, and if broken, we will follow the 100,000 reference area.
Supports: 101,800 – 100,000 – 99,000
Resistances: 103,300 – 105,000 – 106,600
ETH/USDT
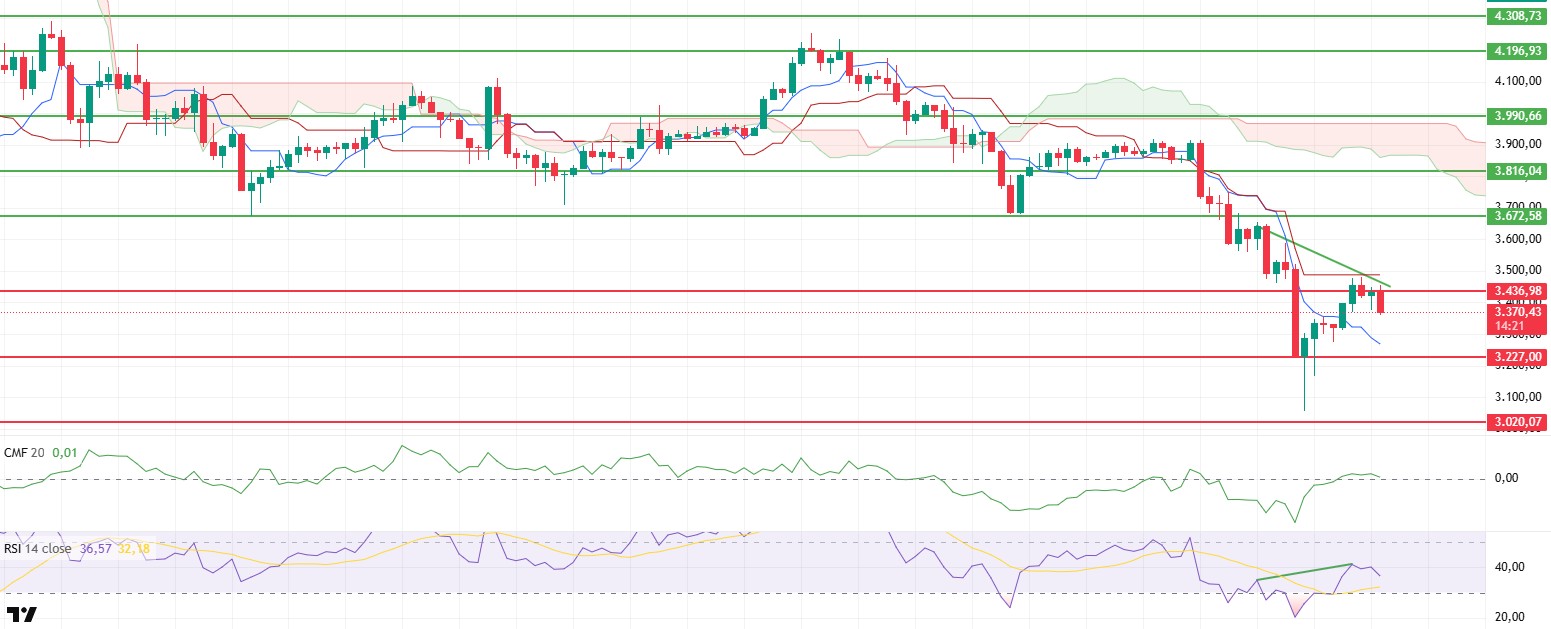
As expected, the ETH price rose to the resistance level of $3,436 yesterday evening, then retreated to the $3,370 level due to selling pressure in this region. This movement indicates that short-term buyers in the market have weakened and selling has regained strength.
Although the Chaikin Money Flow (CMF) indicator rose to positive territory, it began to lose momentum at these levels and weakened again. This decline in CMF reveals that liquidity outflows have accelerated again and buyers’ influence has diminished.
The Relative Strength Index (RSI) indicator also rebounded from the oversold zone, rising to the 41 level. However, the negative divergence formed at this level signals that momentum is starting to fade and pressure on the price is increasing. This pattern in the RSI confirms that downward pressure could persist in the short term.
In the Ichimoku indicator, the price is still moving below the kumo cloud and behind the Kijun level. This outlook indicates that the main trend is still downward and that attempts to rise may encounter strong resistance.
As a result, the downward trend is expected to continue as long as the price fails to break above the $3,436 level. However, regaining this level could weaken the current negative structure and pave the way for the start of a short-term uptrend.
Below the Form
Supports: 3,227 – 3,020 – 2,872
Resistances: 3,436 – 3,672 – 3,816
XRP/USDT
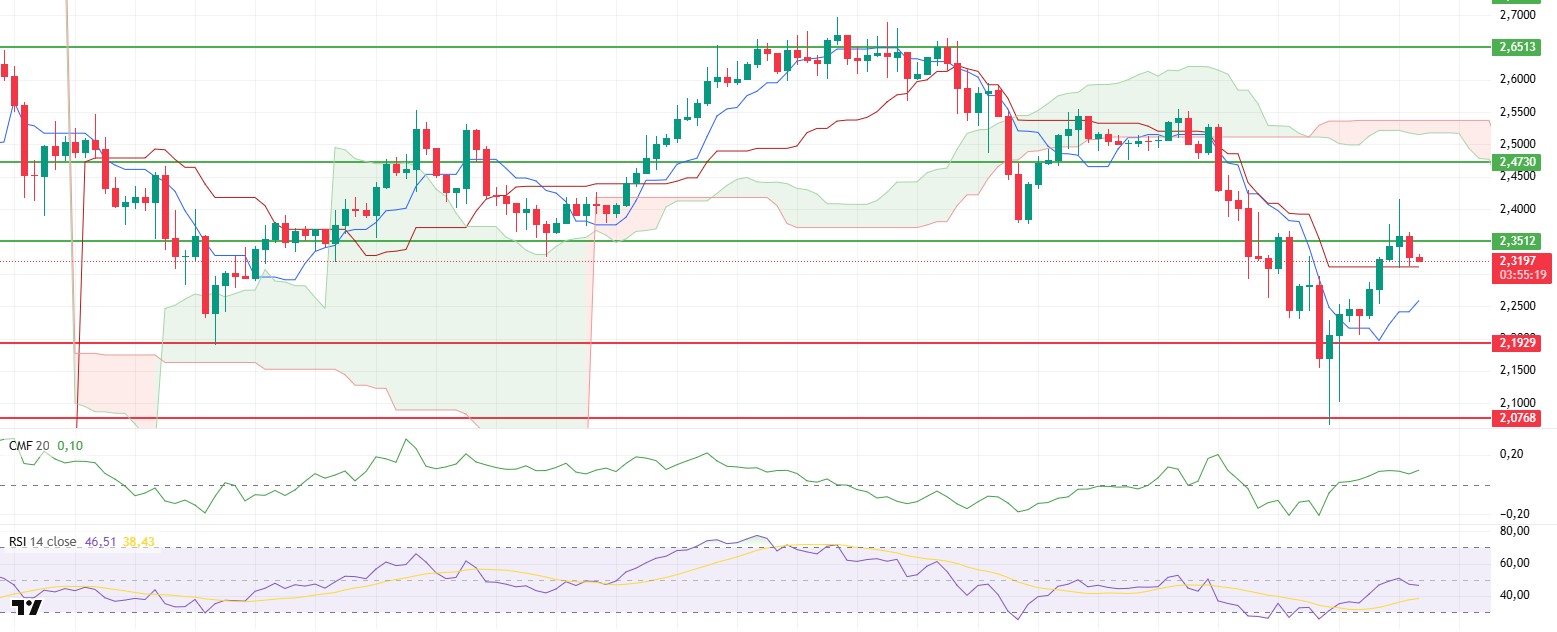
The XRP price rose to $2.41 yesterday evening, breaking through the $2.35 resistance level in line with expectations. However, unable to maintain its position in this region, the price retreated under selling pressure and is currently trading at $2.32. This movement indicates that the market is still open to profit-taking, but buyers remain active in the short term.
Despite the pullback, the Chaikin Money Flow (CMF) indicator maintains its strong position in positive territory. This outlook confirms that liquidity inflows into the market continue and that the buying side remains dominant.
The Relative Strength Index (RSI) indicator is balanced at the 50 level. This structure indicates that momentum is still strong and that the upward movement in the short term is maintained.
While the price rising above both the Tenkan and Kijun levels supports the short-term positive outlook, its continued movement below the kumo cloud indicates that the main trend has not yet turned upward. This technical structure suggests that upward attempts may face resistance at certain levels.
As a result, breaking above the $2.35 level again could fuel further gains. However, as long as the price remains below this level, short-term pullbacks may continue.
Supports: 2.1929 – 2.0768 – 1.9092
Resistances: 2.3512 – 2.4730 – 2.6513
SOL/USDT
Grayscale has waived fees for the Solana Trust ETF to increase investor participation.
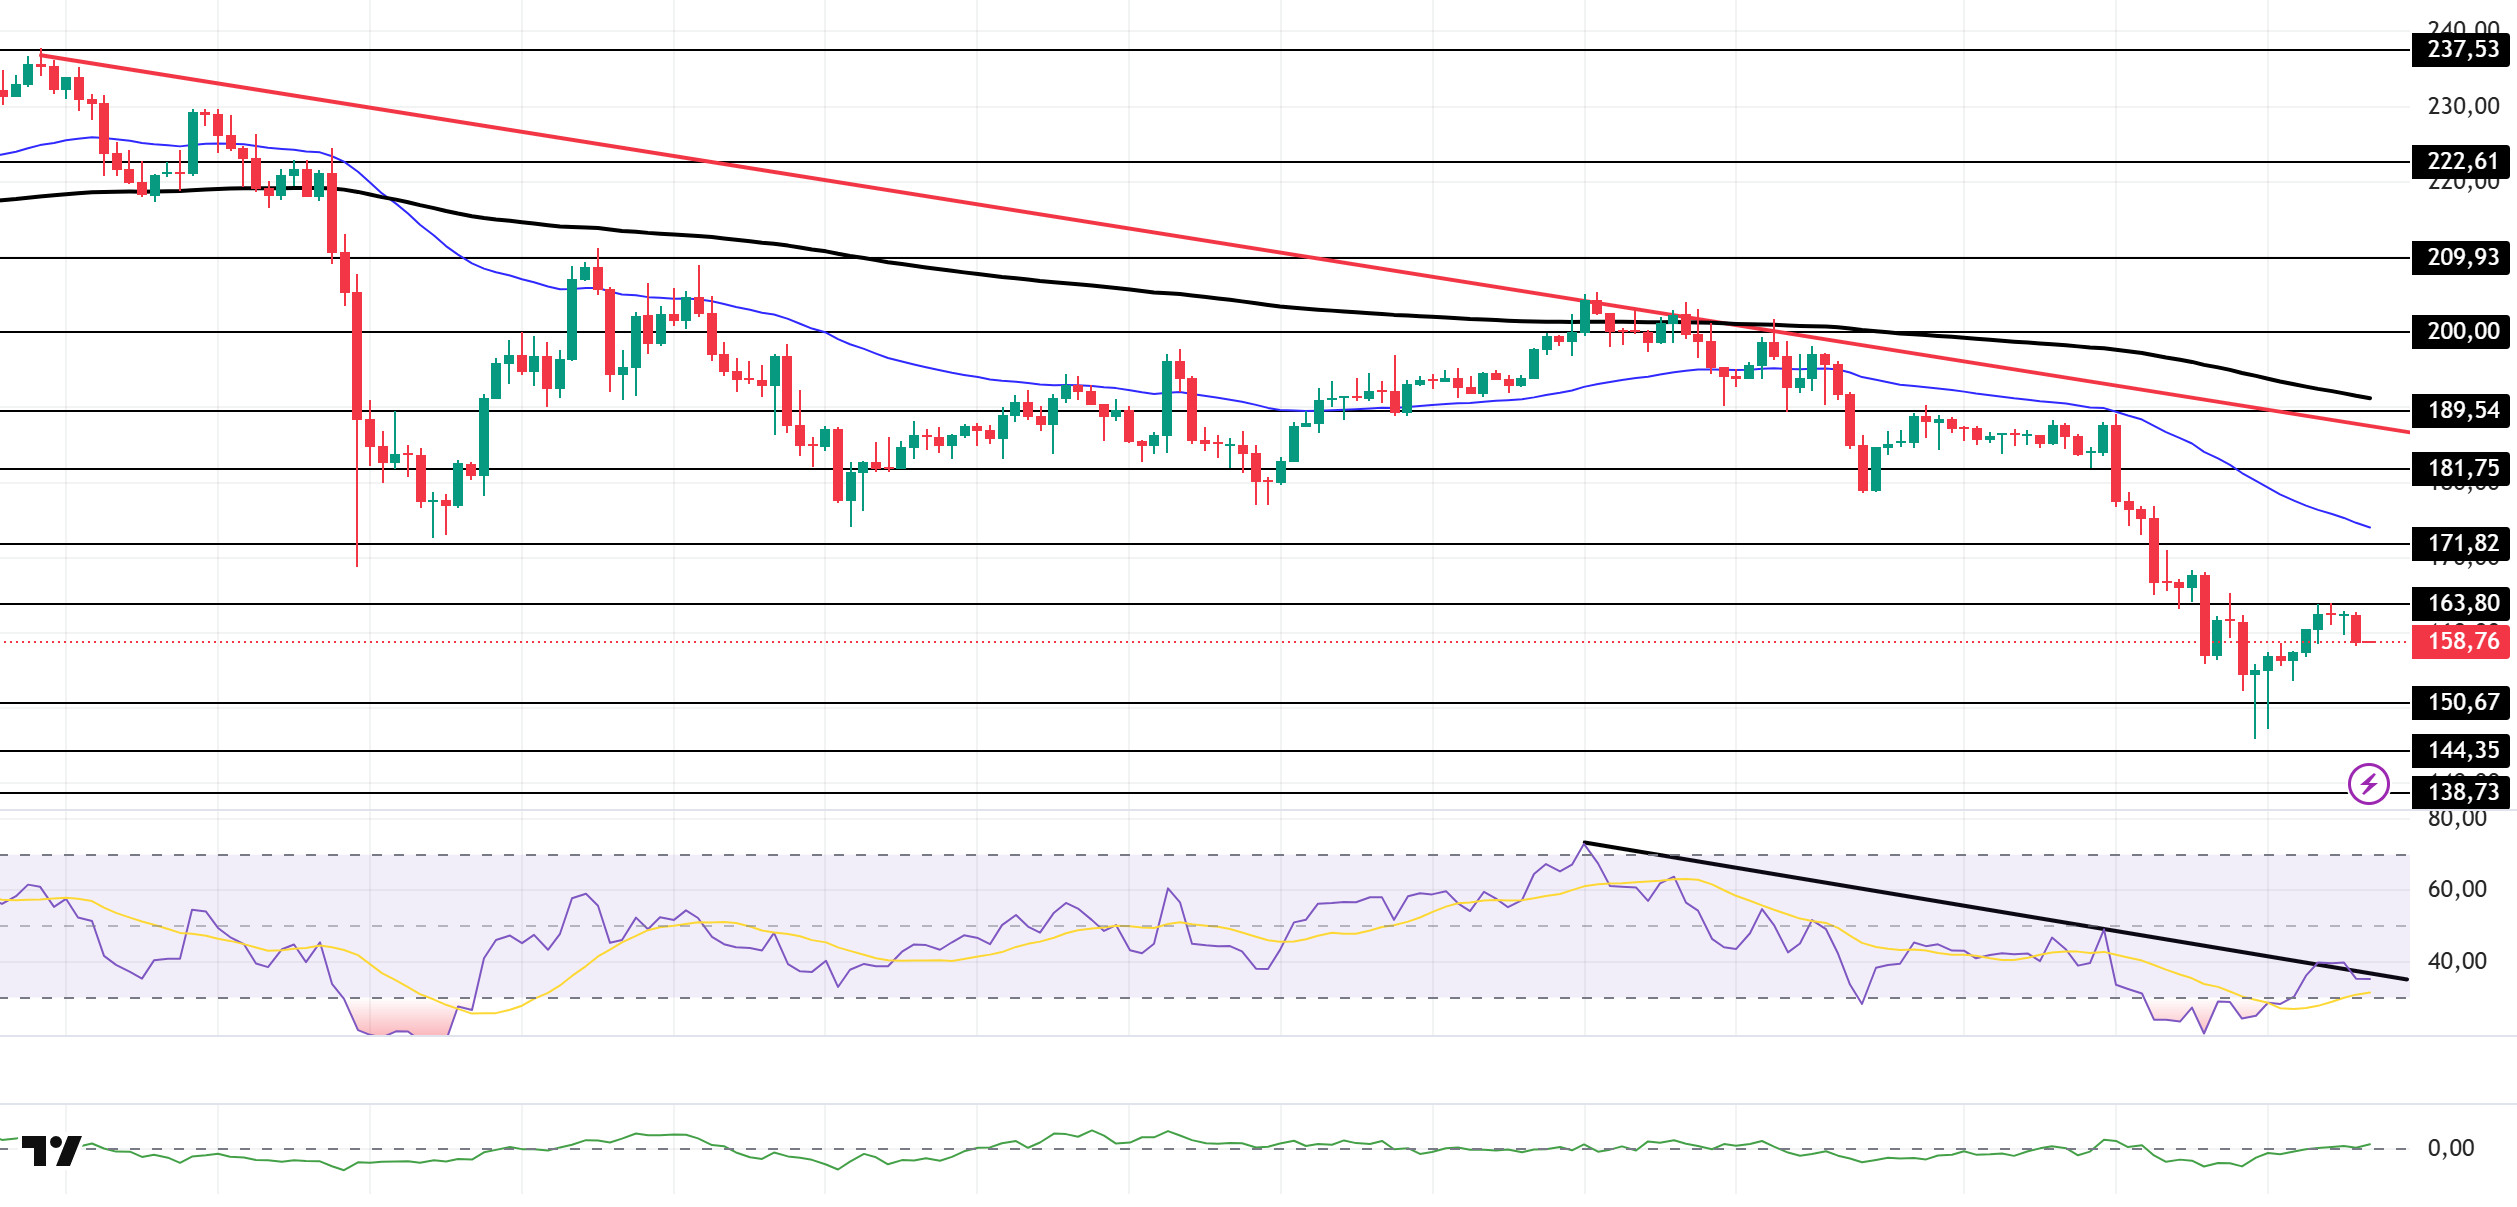
The SOL price remained flat. The asset tested the strong support level of $150.67 and experienced a slight increase, continuing to remain below the downward trend that began on October 6. However, the price being far from the 50 EMA (Blue Line) and 200 EMA (Black Line) moving averages could strengthen the asset’s sideways or upward movement. Currently, the price tested the strong resistance level of $163.80 and experienced a slight pullback. If the pullback continues, it may test the $144.35 level. If the upward movement continues, it may test the 50 EMA (Blue Line) moving average.
The price remained below the 50 EMA (Exponential Moving Average – Blue Line) and 200 EMA (Black Line) on the 4-hour chart. This indicates a potential downtrend in the medium term. Additionally, the price being below both moving averages suggests a downward trend in the short term. The Chaikin Money Flow (CMF-20) is at a neutral level. However, the decrease in money inflows could push the CMF into negative territory. The Relative Strength Index (RSI-14) rose to the middle of the negative zone. At the same time, although it broke through the upper level of the downward trend that began on October 27 with a false breakout, it fell back below this trend, indicating that selling pressure has increased again. In the event of an upturn due to macroeconomic data or positive news related to the Solana ecosystem, the $171.82 level stands out as a strong resistance point. If this level is broken upwards, the rise is expected to continue. If there are pullbacks due to developments in the opposite direction or profit-taking, the $144.35 level could be tested. If there is a decline to these support levels, an increase in buying momentum could present a potential upside opportunity.
Supports: 150.67 – 144.35 – 138.73
Resistances: 163.80 – 171.82 – 181.75
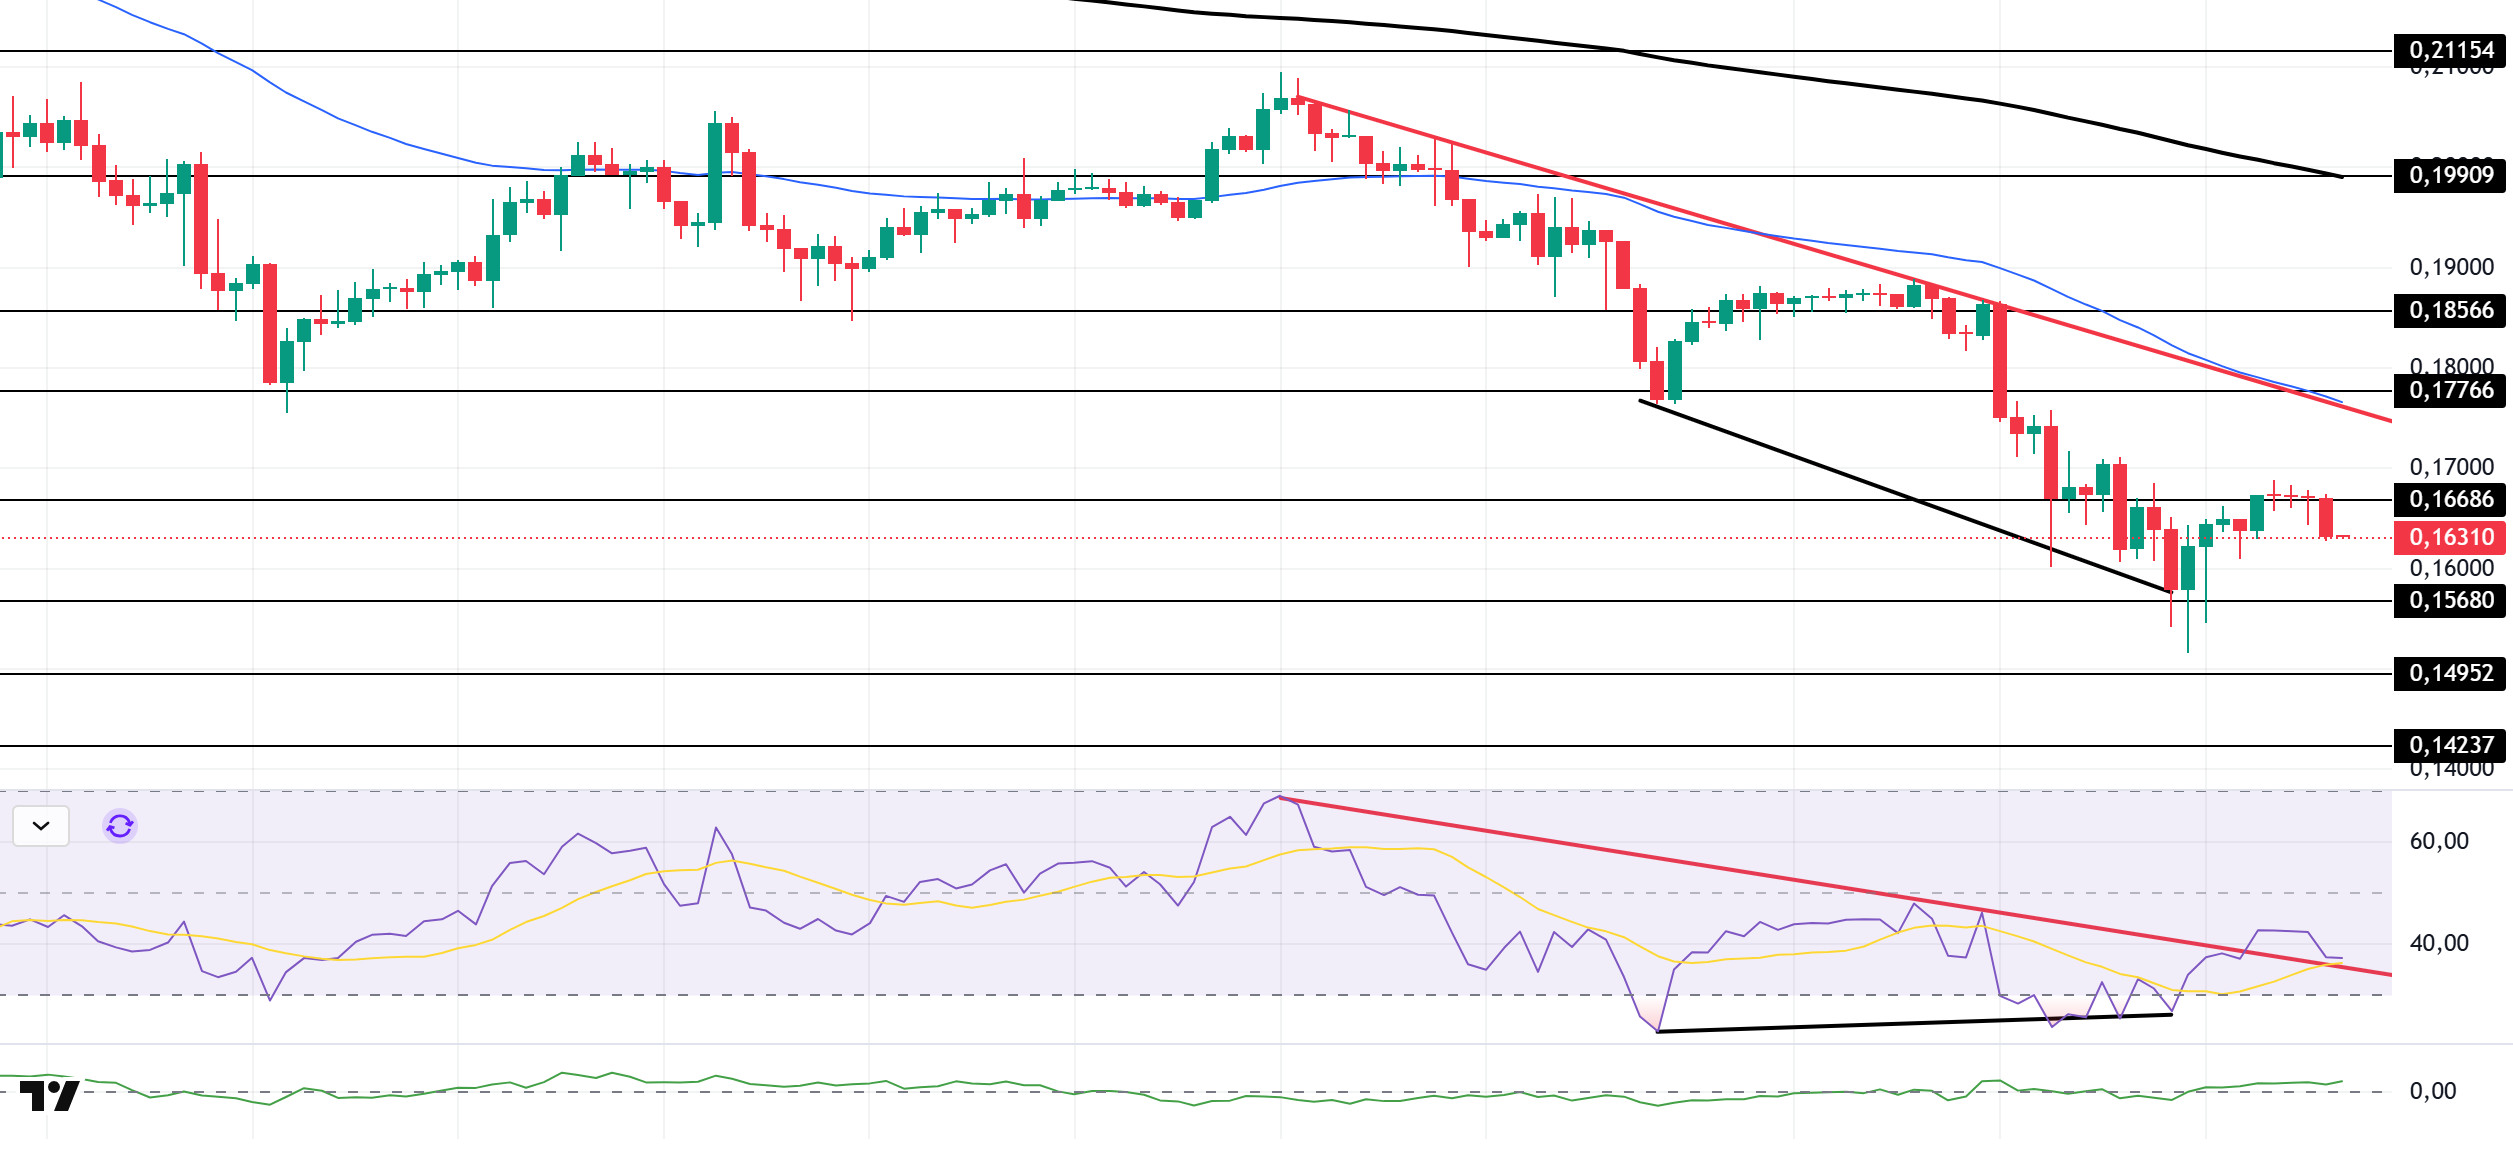
DOGE/USDT
The DOGE price traded sideways. The asset tested the resistance level of the downtrend that began on October 27 and the $0.18566 level and deepened its pullback. After testing the $0.15680 level as support and rising from there, the price tested the $0.16686 level and experienced a pullback. Momentum may increase with candle closes above this level. If the pullback continues, the $0.15680 level should be monitored again.
On the 4-hour chart, the 50 EMA (Exponential Moving Average – Blue Line) remained below the 200 EMA (Black Line). This indicates that a downtrend may begin in the medium term. The price being below both moving averages indicates a downward trend in the short term. The Chaikin Money Flow (CMF-20) has started to move into the positive zone, close to the neutral zone. Additionally, a decrease in cash inflows could push the CMF into negative territory. The Relative Strength Index (RSI-14) rose to the middle of the negative zone. At the same time, it broke above the downward trend that began on October 27. On the other hand, there is a positive divergence. These could increase buying pressure. In the event of an uptrend driven by political developments, macroeconomic data, or positive news flow in the DOGE ecosystem, the $0.17766 level stands out as a strong resistance zone. Conversely, in the event of negative news flow, the $0.15680 level could be triggered. A decline to these levels could increase momentum and initiate a new wave of growth.
Supports: $0.15680 – $0.14952 – $0.14237
Resistances: 0.16686 – 0.17766 – 0.18566
ADA/USDT
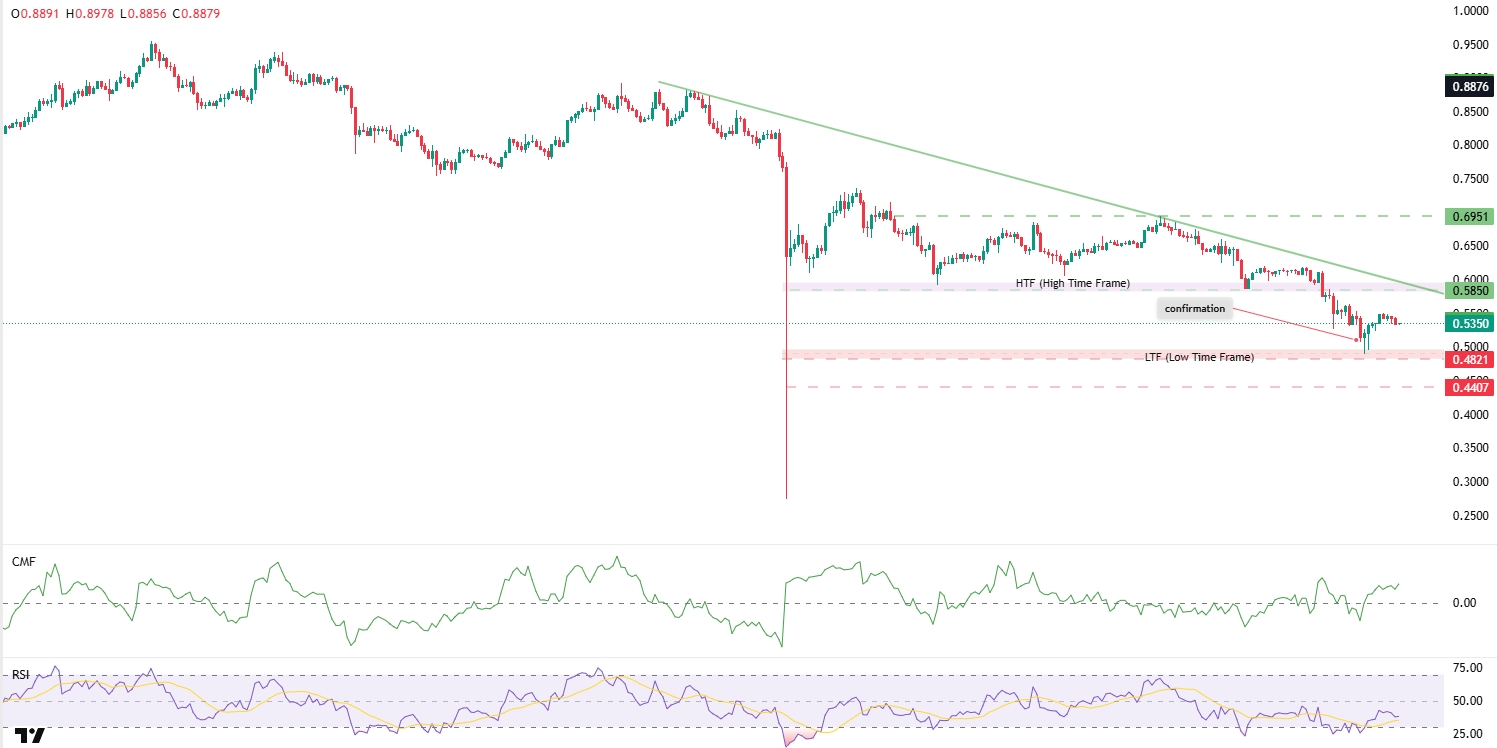
ADA started the day with a decline but rebounded from the confirmation zone, rising 0.58% within 24 hours. With yesterday’s US ADP Nonfarm Employment data, it maintained its position above the $0.5200 level and is waiting for liquidation at the $0.5354 level for 812,000 ADA.
The Relative Strength Index (RSI-14) rose to 40 levels, signaling a trend reversal along with the Chaikin Money Flow (CMF-20). A limited increase in cash inflows may keep the CMF in positive territory. If the price rises during the day and re-enters the Fibonacci level of $0.5848, the resistance point of $0.6994 could emerge as an important level to watch. In this case, it could signal that the upward trend may continue in the medium term.
If there is an increase due to macroeconomic data or positive news related to the Cardano ecosystem, the $0.7437 level stands out as a strong resistance point. If this level is broken upwards, the increase is expected to continue.
If Trump’s statements today and macroeconomic data result in reduced volatility in the market, increased selling pressure could push the ADA price back to the lowest time frame (LTF) level of $0.4900. In this scenario, the price intersects with the confirmation zone, which is the entry zone of the low time frame (LTF), at the $0.4821 level. This technically increases the importance of the zone. In a more severe correction scenario, the $0.4407 level can be monitored as the main support level. However, confirmation of this movement should be monitored in terms of volume and market structure.
Supports: 0.3896 – 0.4455 – 0.4883
Resistances: 0.6994 – 0.7437 – 0.7985
Legal Notice
The investment information, comments, and recommendations contained herein do not constitute investment advice. Investment advisory services are provided individually by authorized institutions taking into account the risk and return preferences of individuals. The comments and recommendations contained herein are of a general nature. These recommendations may not be suitable for your financial situation and risk and return preferences. Therefore, making an investment decision based solely on the information contained herein may not produce results in line with your expectations.

