
Technical Analysis
BTC/USDT
The Democratic Party’s victory in the Virginia and New Jersey elections led to comments that Trump’s influence over Congress had diminished. Treasury Secretary Scott Bessent confirmed that he would attend the Supreme Court hearing to defend the President’s tariff policy, while at the same time, the White House halved the fentanyl tariffs imposed on Chinese goods. On the crypto front, Senator Cynthia Lummis brought digital assets to the forefront by proposing the creation of a “Strategic Bitcoin Reserve” to combat the national debt crisis.
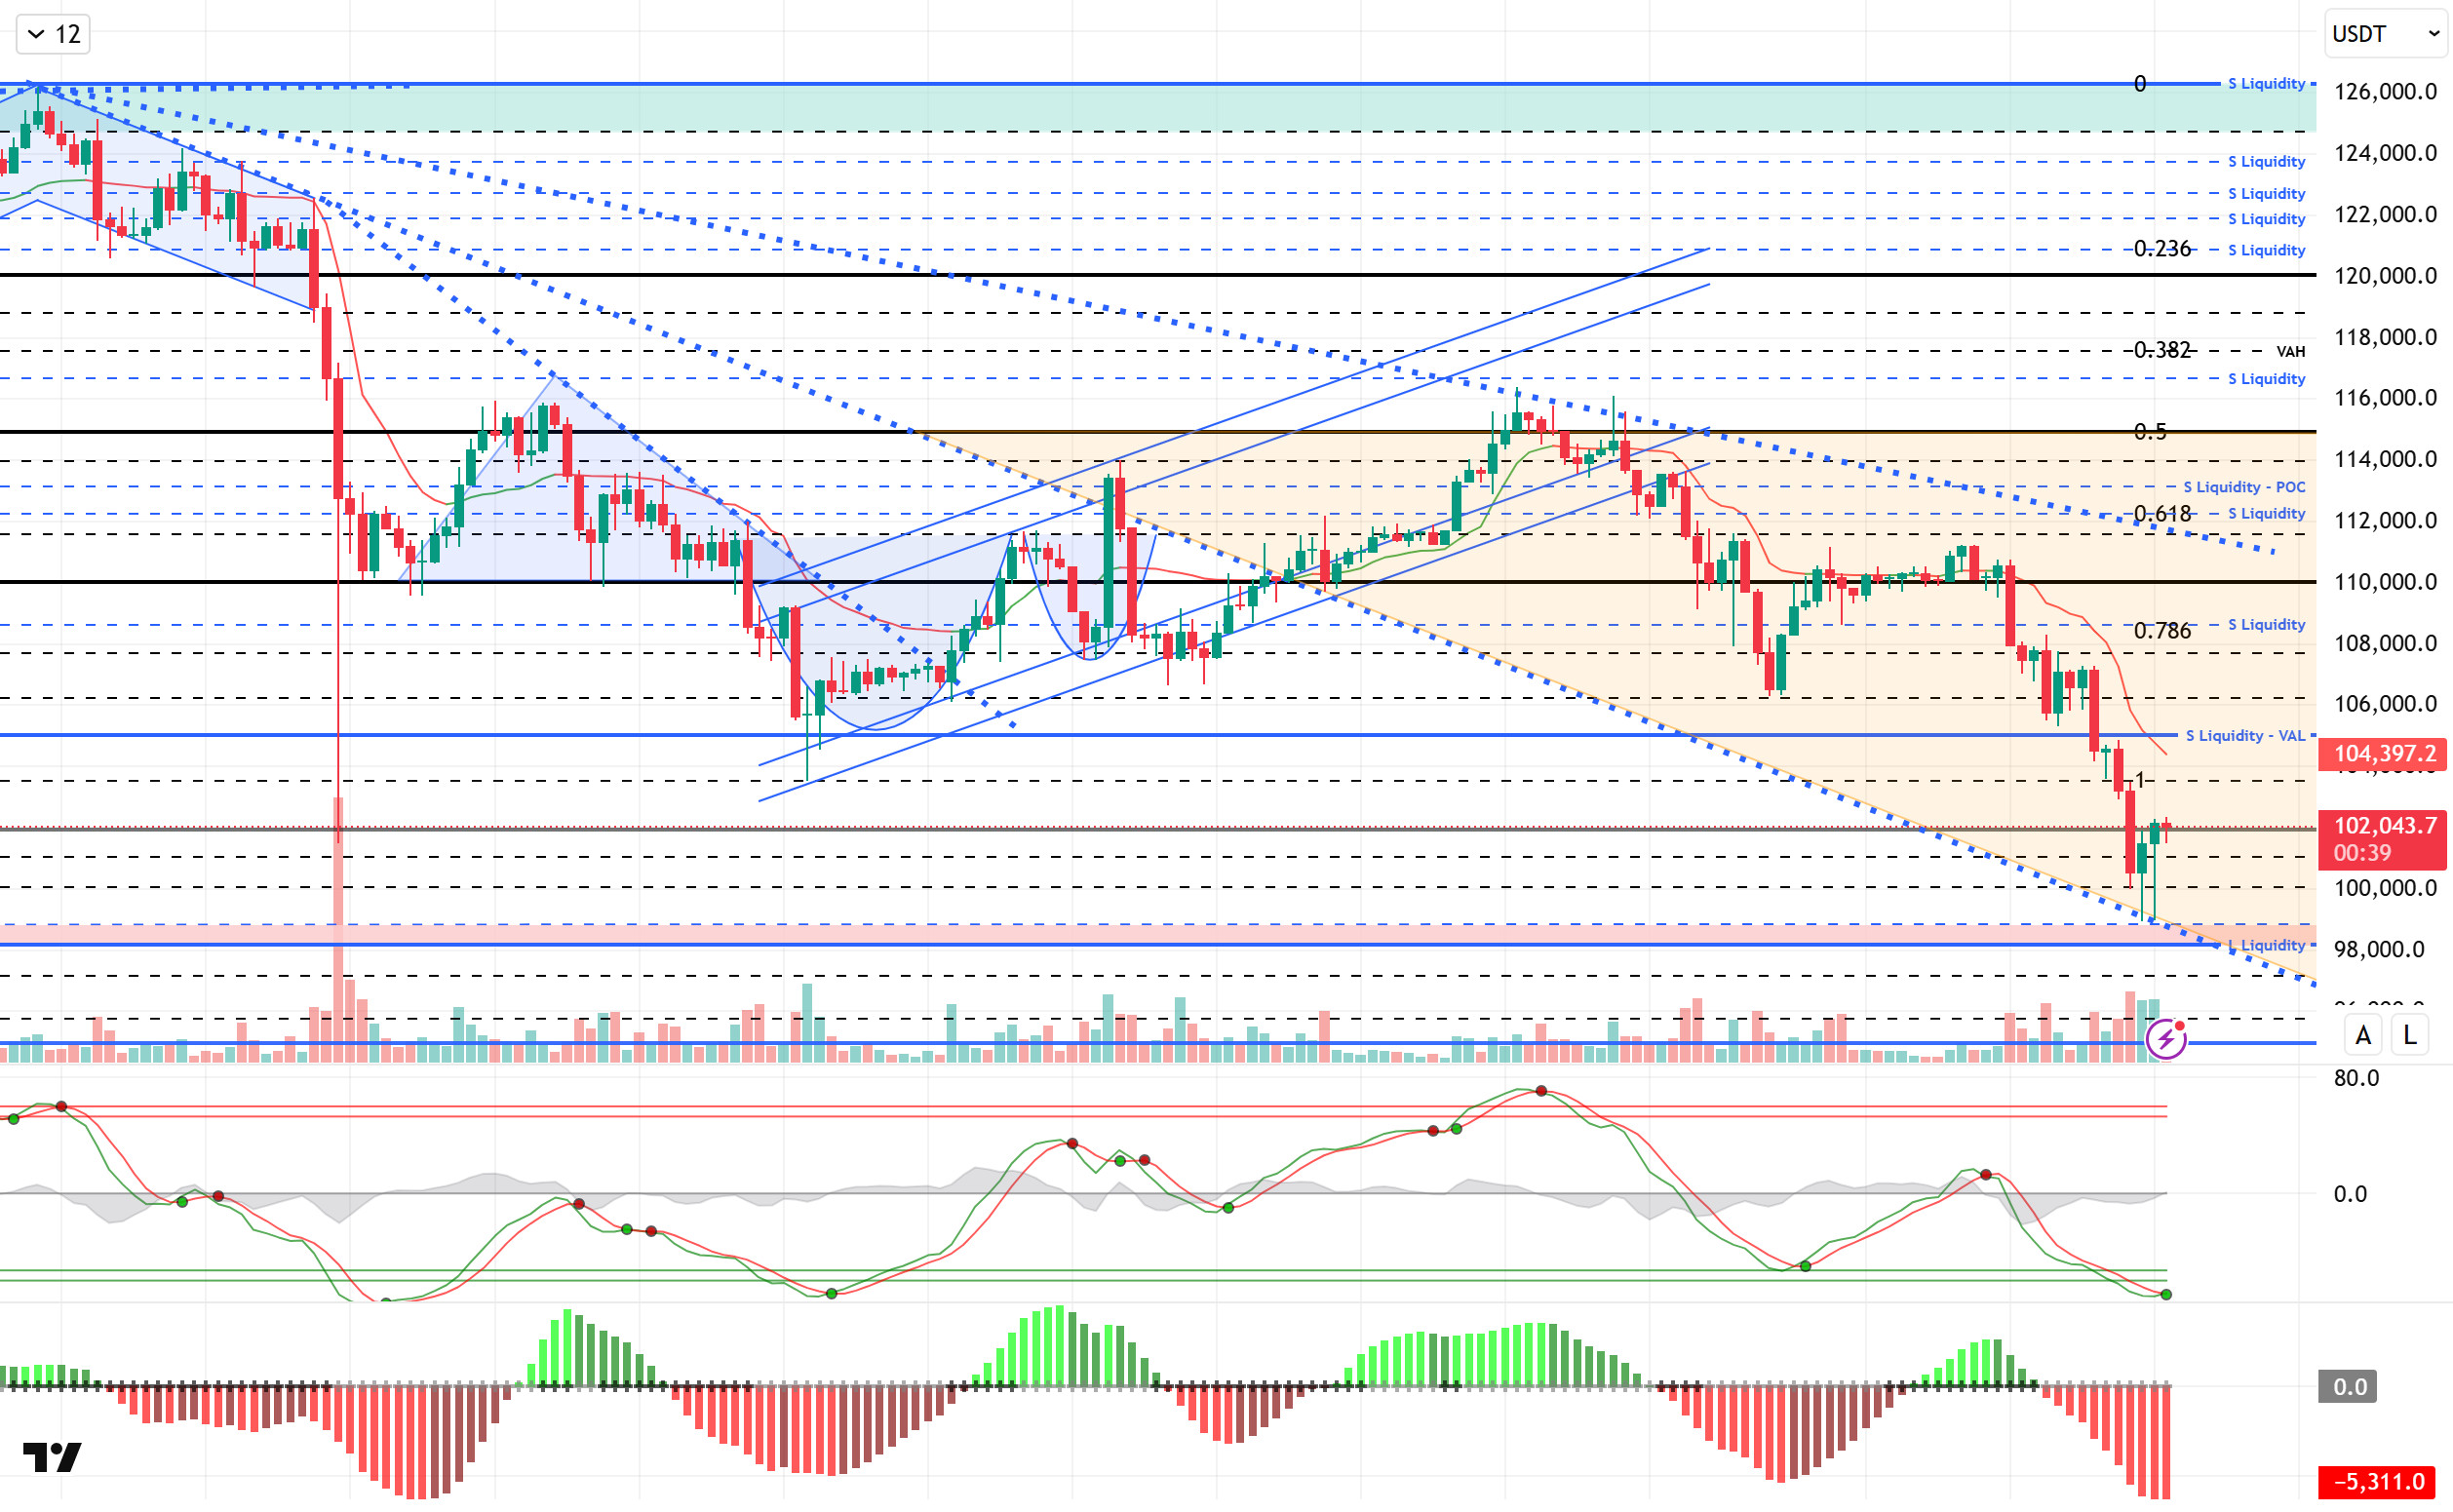
Technically speaking, BTC briefly lost six-figure levels yesterday amid heavy selling pressure. The price, which touched the falling trend line within the orange band, retreated to the 99,000 level. Although the price, which last tested six-figure levels in June, retreated to these levels again, it managed to recover somewhat and continues to trade at the 102,000 level.
Technical indicators show that Wave Trend (WT) fell below the oversold zone with the latest decline, signaling a buy. The Squeeze Momentum (SM) indicator’s histogram has reached maximum weakness in the negative zone. The Kaufman moving average (KAMA) is currently at $104,300, positioned above the price.
According to liquidation data, investors who seized the opportunity presented by the recent decline have recorded high activity at the 98,000 level. In contrast, 102,500 stands out as the first selling level, while 105,600 is another area where accumulation is increasing. Over the last 24 hours, the total liquidation amount in the market was recorded at $1.75B.
In summary, while the effects of the US-China tariff crisis being suspended for a year and resulting in a compromise continue, optimistic developments continue to emerge from both sides. However, the Fed’s hawkish tone on interest rate cuts continues to put pressure on the market, while the US government shutdown has reached an all-time high. On the technical side, although BTC recorded short-term increases from time to time, it touched the lower trend line parallel to the descending trend channel it formed. In liquidity data, while the dominance of the selling level continues, buyers are starting to reappear.Going forward, the 103,300 level will be monitored as resistance; if this level is breached, the 105,000 reference area could be targeted again. In the event of a potential new selling pressure, a break below the 100,000 level could push prices down and trigger a spike into the liquidity zone.
Supports: 101,800 – 100,000 – 99,000
Resistances: 103,300 – 105,000 – 106,600
ETH/USDT
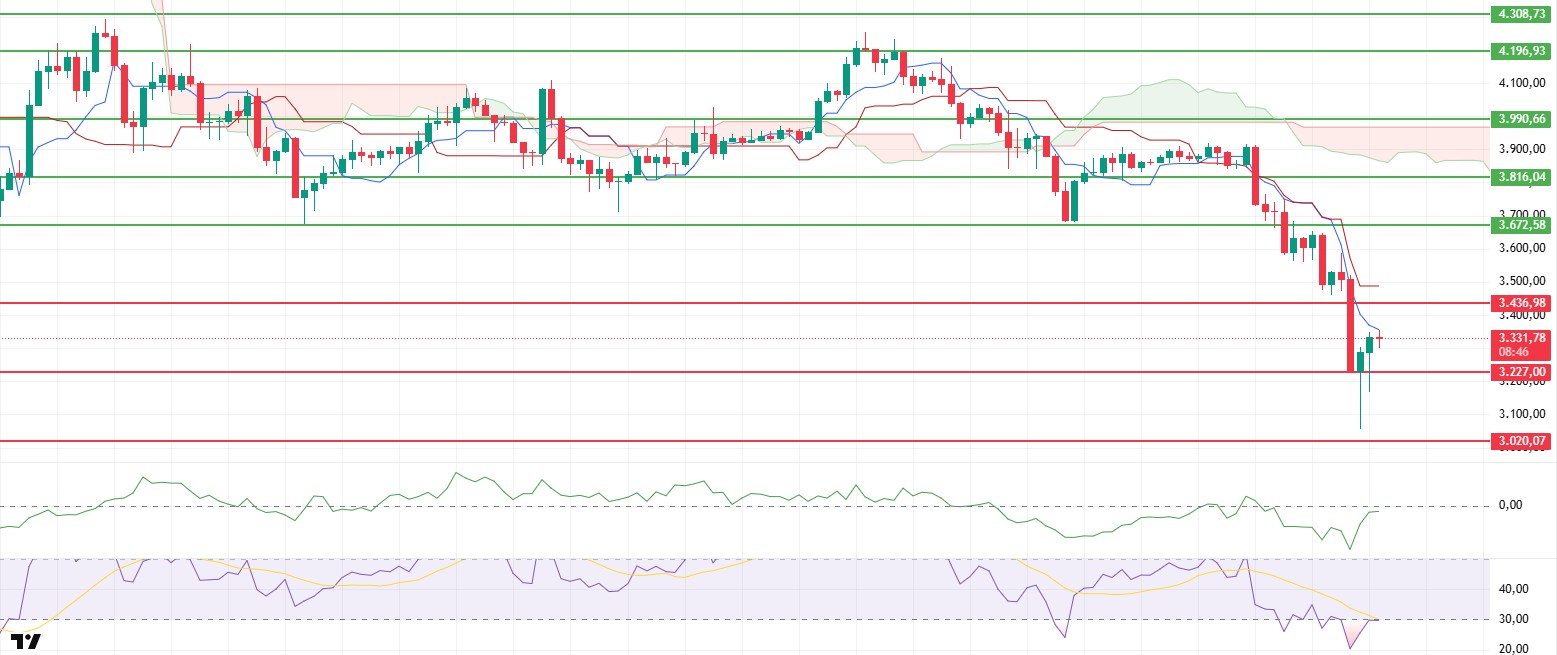
The ETH price fell sharply yesterday evening, losing its $3,436 support level and retreating to the main support zone at $3,020 under heavy selling pressure. This morning, the price rebounded from this zone and rose above the $3,300 level. This movement indicates that rebound buying has kicked in, but the overall trend remains weak.
The Chaikin Money Flow (CMF) indicator rose to the zero line during this recovery, revealing an increase in liquidity inflows. If the CMF maintains this level, it could pave the way for stronger buying pressure in the short term.
The Relative Strength Index (RSI) indicator also rebounded from the oversold zone and rose to the border zone. This movement signals that momentum is beginning to recover and that the potential for an uptrend in the short term is increasing. However, for the RSI to continue strengthening at these levels, the price needs to maintain its upward momentum with volume support.
In the Ichimoku indicator, the price is still moving below the kumo cloud and remains below the Tenkan and Kijun levels. This technical structure indicates that the downtrend has not yet ended and that upward attempts may encounter strong resistance.
In the short term, the $3,436 level stands out as a critical threshold. Breaking above this level could pave the way for a rise that could extend to the $3,672 region. However, a loss of the $3,227 level could reignite selling pressure and lead to a decline to the $3,020 support level. While the overall outlook remains weak, short-term rebound buying could support the price for a while.
Below the Form
Supports: 3,227 – 3,020 – 2,872
Resistances: 3,436 – 3,672 – 3,816
XRP/USDT
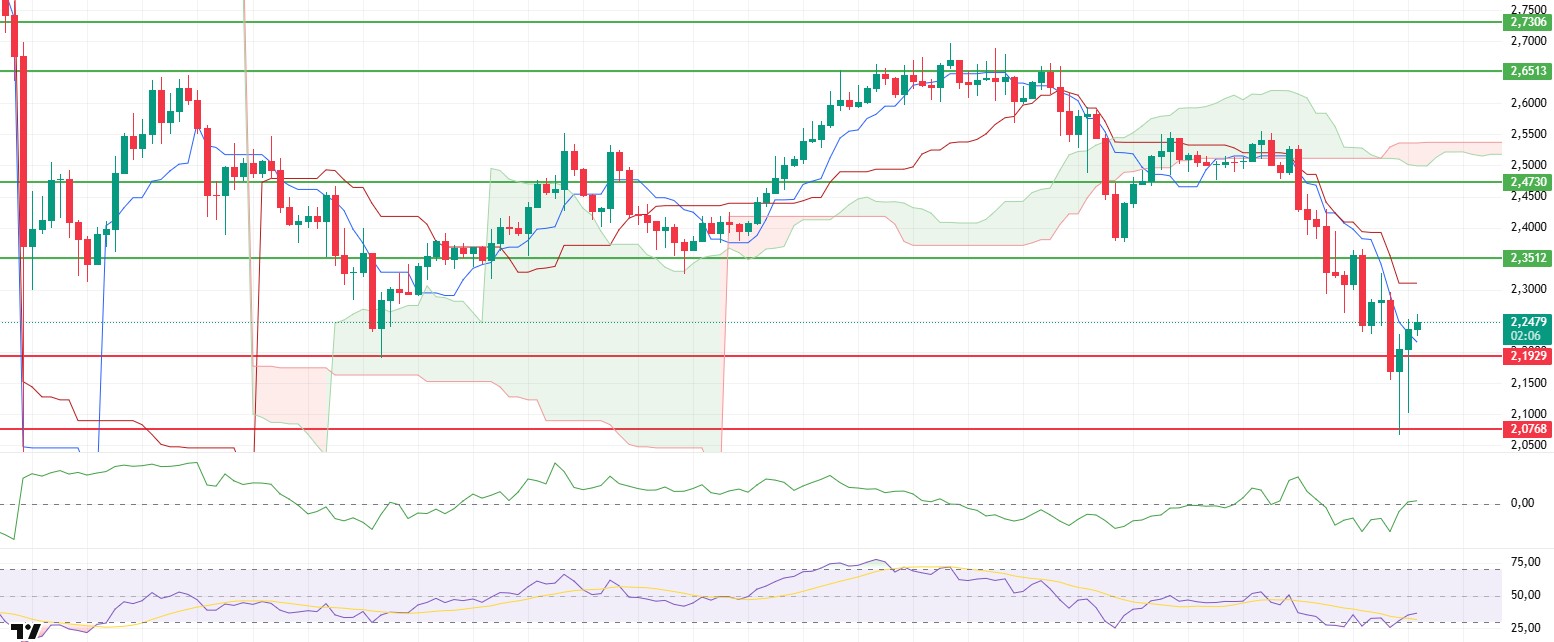
The XRP price fell to $2.07 after losing the $2.19 support level following yesterday’s sharp decline. The price rebounded with buying activity from this area and rose to $2.25. With this latest move, technical indicators are beginning to show signs of recovery.
The Chaikin Money Flow (CMF) indicator has moved sharply upward, indicating a return of strong liquidity inflows into the market. This structure reveals that buyers are regaining strength in the short term.
The Relative Strength Index (RSI) indicator has also moved out of the oversold zone, signaling that momentum is beginning to gain strength. The RSI maintaining this momentum is critical for the short-term recovery to continue.
The price breaking above the Tenkan level also supports short-term upward movement. However, the price is still below the kumo cloud. This technical outlook indicates that the overall trend has not yet turned positive and that the upside may remain limited for now.
In general, the $2.19 level is a critical support level in the short term. If the price remains above this level, the upward trend is expected to continue towards the $2.30 and $2.35 resistance levels. However, a loss of the $2.19 support could lead to renewed selling pressure and a pullback towards the $2.07 level.
Supports: 2.1929 – 2.0768 – 1.9092
Resistances: 2.3512 – 2.4730 – 2.6513
SOL/USDT
Forward Industries has initiated a $1 billion share buyback.
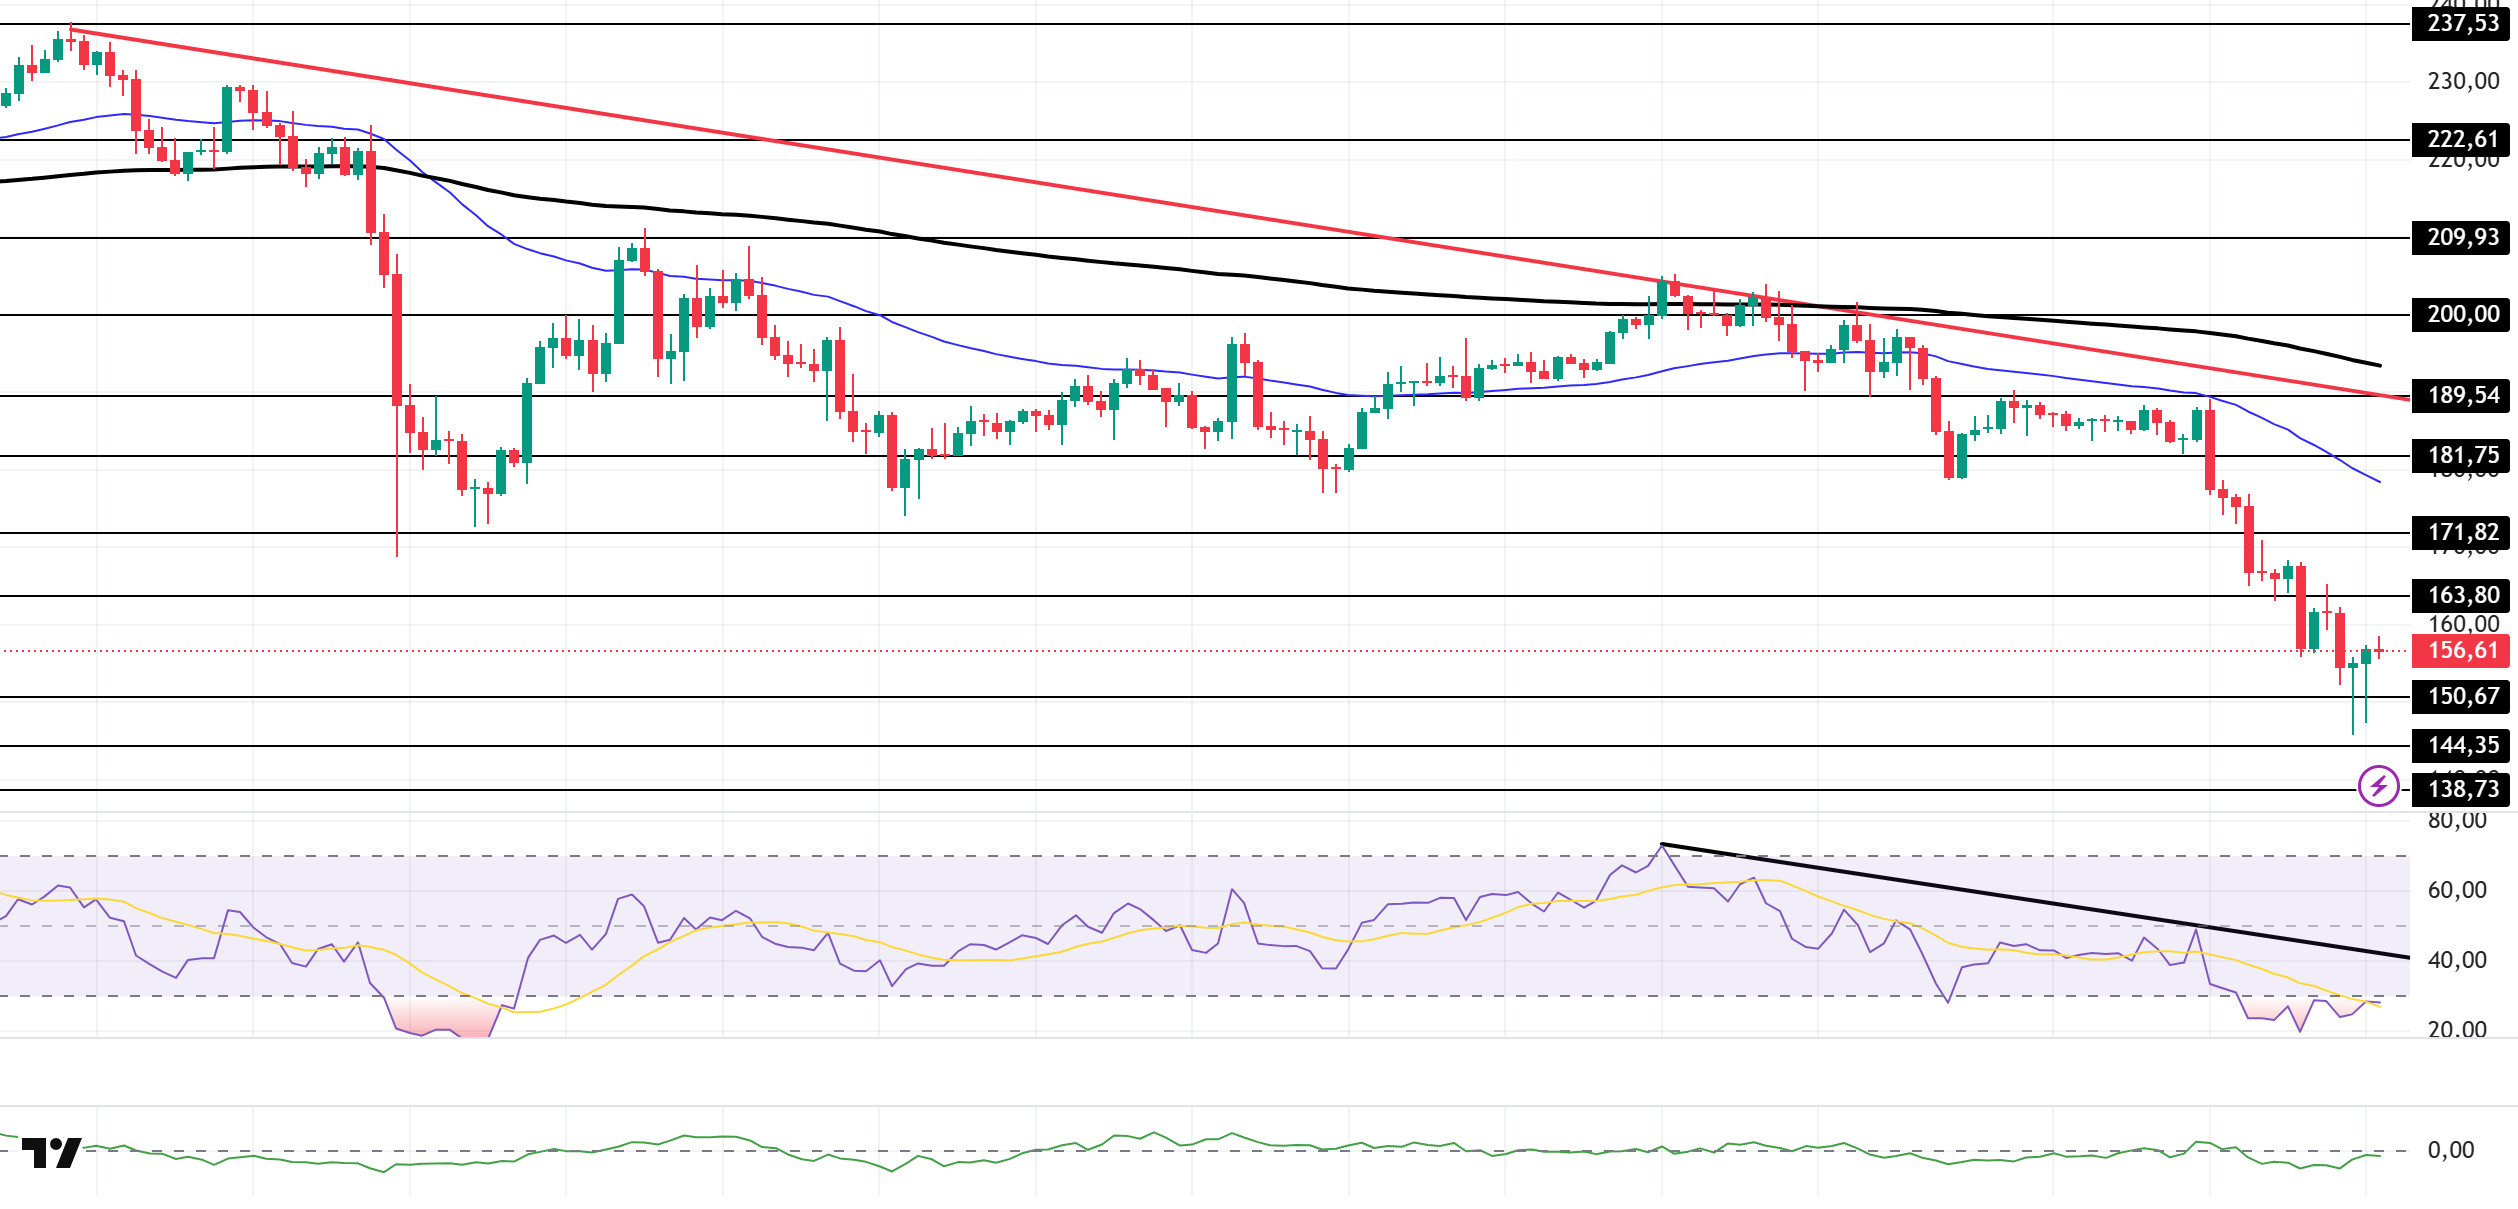
The SOL price continued its decline. The asset tested the strong support level of $150.67 and experienced a slight increase, continuing to remain in the lower region of the downward trend that began on October 6. However, the price being far from the 50 EMA (Blue Line) and 200 EMA (Black Line) moving averages could strengthen the asset’s horizontal or upward movement. If the rise begins, it could test the strong level of $163.80. If the pullback continues, it could test the $138.73 level.
The price remained below the 50 EMA (Exponential Moving Average – Blue Line) and 200 EMA (Black Line) on the 4-hour chart. This indicates a potential downtrend in the medium term. Additionally, the price being below both moving averages suggests a downward trend in the short term. The Chaikin Money Flow (CMF-20) is at a neutral level. However, an increase in money inflows could push the CMF into positive territory. The Relative Strength Index (RSI-14) continues to be in the oversold zone. It also remained below the downward trend that began on October 27. In the event of an uptrend driven by macroeconomic data or positive news related to the Solana ecosystem, the $171.82 level stands out as a strong resistance point. If this level is broken upwards, the uptrend is expected to continue. In the event of pullbacks due to developments in the opposite direction or profit-taking, the $144.35 level could be tested. A decline to these support levels could increase buying momentum, presenting a potential opportunity for an upward move.
Supports: 150.67 – 144.35 – 138.73
Resistances: 163.80 – 171.82 – 181.75
DOGE/USDT
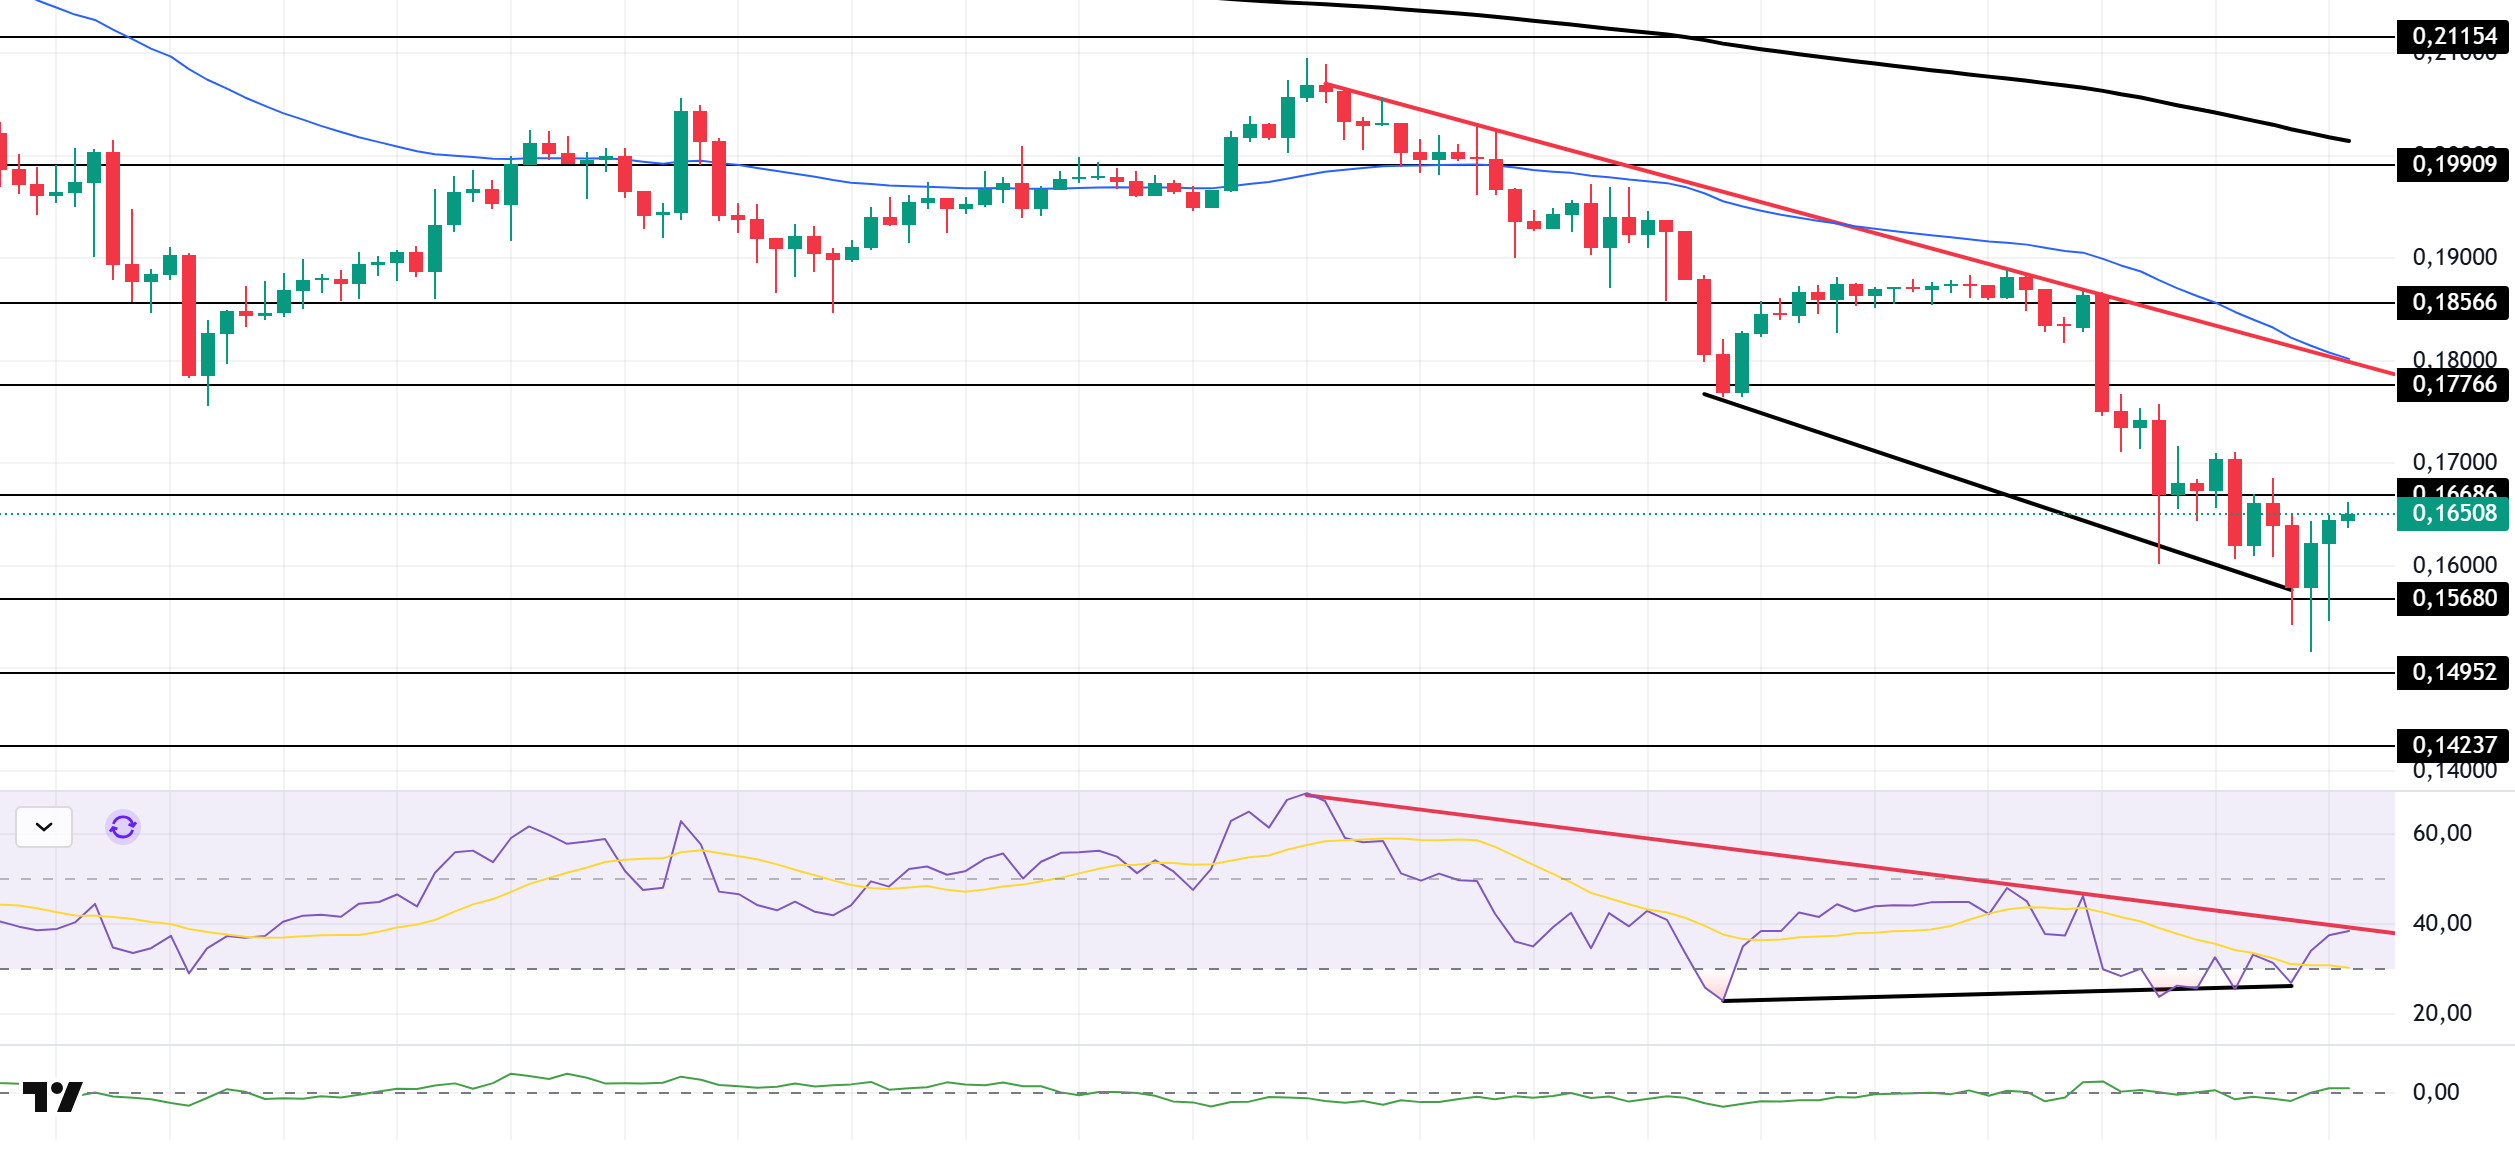
The DOGE price traded sideways. The asset tested the resistance level of the downtrend that began on October 27 and the $0.18566 level and deepened its pullback. After testing the $0.15680 level as support and rising from there, the price is currently preparing to test the $0.16686 level. Momentum may increase with candle closes above this level. If the pullback begins, the $0.15680 level should be monitored again.
On the 4-hour chart, the 50 EMA (Exponential Moving Average – Blue Line) remained below the 200 EMA (Black Line). This indicates that a downtrend may begin in the medium term. The price being below both moving averages indicates a downward trend in the short term. The Chaikin Money Flow (CMF-20) has started to move into the positive zone, close to the neutral zone. Additionally, a decrease in cash inflows could push the CMF into negative territory. The Relative Strength Index (RSI-14) has risen to the mid-level of the negative zone. It is currently testing the downward trend that began on October 27. If it breaks through this level, the upward movement could continue. On the other hand, there is a positive divergence, which could increase buying pressure. In the event of an uptrend driven by political developments, macroeconomic data, or positive news flow in the DOGE ecosystem, the $0.17766 level stands out as a strong resistance zone. Conversely, in the event of negative news flow, the $0.15680 level could be triggered. A decline to these levels could increase momentum and initiate a new wave of growth.
Supports: $0.15680 – $0.14952 – $0.14237
Resistances: 0.16686 – 0.17766 – 0.18566
BNB/USDT
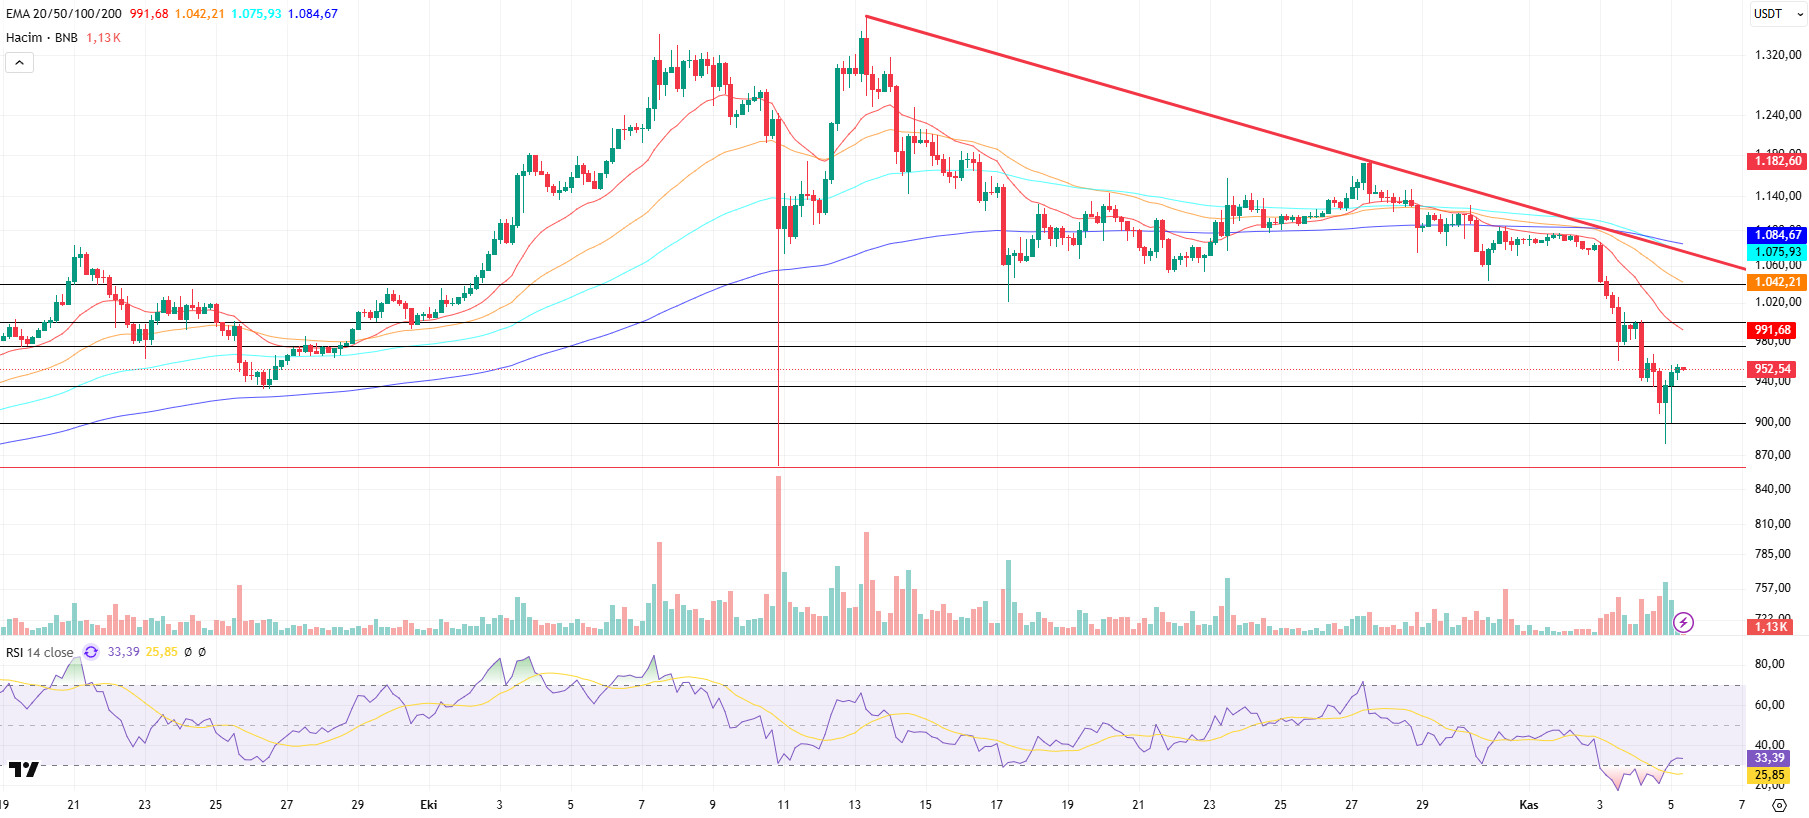
From a technical perspective, the correction that began after the all-time high (ATH) has regained momentum, resulting in a pullback to the $900 support zone identified in previous technical analyses. After testing this level for support, the asset ended its downward momentum with the formation of new candles and reversed its direction upward.
Currently, the BNB/USDT pair has gained a short-term positive outlook with the reaction it received from the second support level around $900.
Technical indicators for the pair, currently trading in the $935–975 range, suggest that the increased trading volume in recent rallies has supported the upward momentum. Additionally, the Relative Strength Index (RSI) indicator fell below the 30 level for a while due to the impact of increased selling pressure. However, this situation ended with the effect of positive momentum, and the RSI rose above the 30 level again.
Based on the current technical picture, if buying appetite is maintained and market momentum recovers, BNB is expected to retest the $975 resistance level in the first stage. If this level is broken, it is technically possible for the price to rise towards the $1,000 and $1,040 levels, respectively. On the other hand, if selling pressure increases again, the price is expected to test the $935 support level. If this level is broken downward, the price is likely to retreat to the $900 and $860 support zones, respectively.
Supports: 935 – 900 – 860
Resistances: 975– 1,000 – 1,040
ADA/USDT
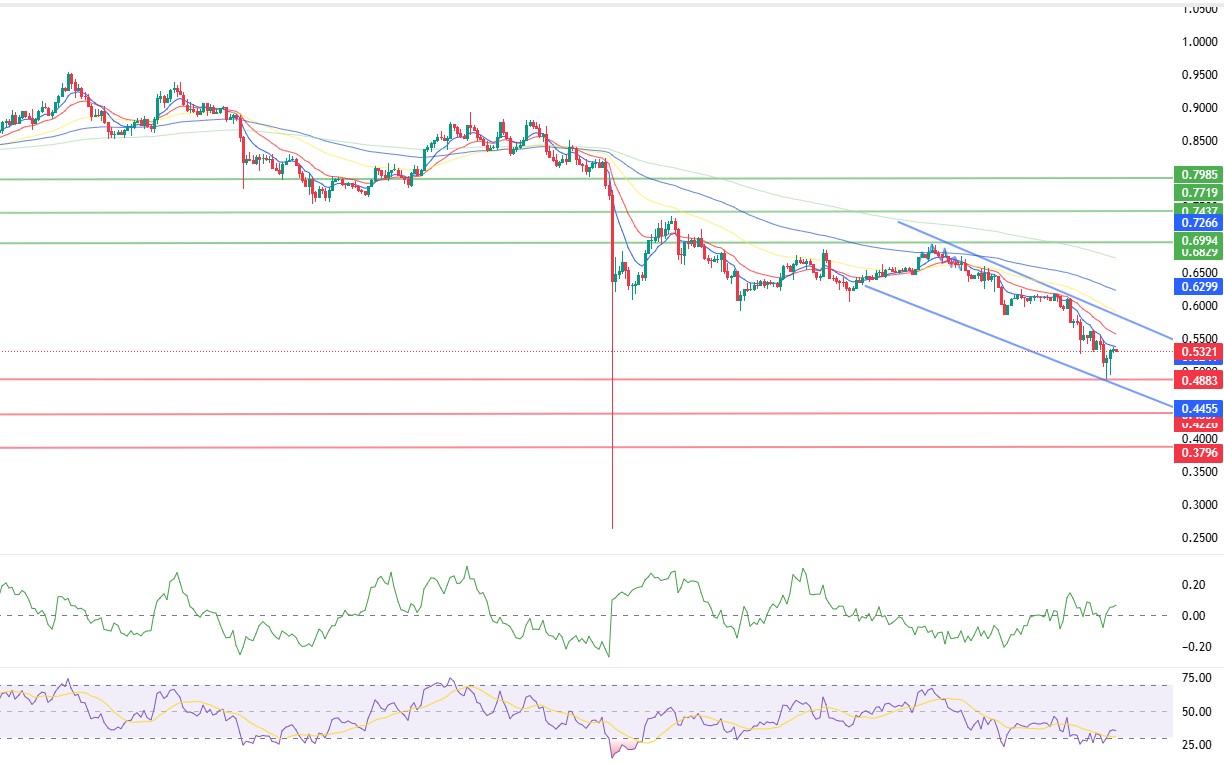
ADA started the first half of the day with a decline, falling 0.24% within 24 hours, while a total of 440,157 investors were liquidated and ADA’s total liquidation amount reached 151,940. Yesterday, Bitcoin falling below $100,000 caused the ADA price to fall below the $0.5000 level. It tested the support level of $0.4938 at the 4-hour close. While ADA’s market value hovers around $22 billion, the price has fallen below the 50 and 100-day Exponential Moving Average (EMA-Blue Line) and (EMA-Black Line) on the 4-hour chart, moving towards the support level of $0.4883 tested on October 10. The observed decline in volatility confirms that the market is in a short-term selling trend. If the price continues to remain below all moving averages during the day, it indicates that the downtrend may continue. The Relative Strength Index (RSI-14) has fallen to 31 levels, signaling a decline along with the Chaikin Money Flow (CMF-20). The decrease in money inflows may keep the CMF in negative territory and indicate that selling pressure will continue. If the price rises during the day and re-enters the Fibonacci level of 0.5848, the resistance level of 0.6994 could emerge as an important level to watch. In this case, it could signal that the upward trend may continue in the medium term.
If there is an increase due to macroeconomic data or positive news related to the Cardano ecosystem, the $0.7437 level stands out as a strong resistance point. If this level is broken upwards, the increase is expected to continue.
Supports: 0.3896 – 0.4455 – 0.4883
Resistances: 0.6994 – 0.7437 – 0.7985
Legal Notice
The investment information, comments, and recommendations contained herein do not constitute investment advice. Investment advisory services are provided individually by authorized institutions taking into account the risk and return preferences of individuals. The comments and recommendations contained herein are of a general nature. These recommendations may not be suitable for your financial situation and risk and return preferences. Therefore, making an investment decision based solely on the information contained herein may not produce results in line with your expectations.

