
Technical Analysis
BTC/USDT
The US announced that it has suspended planned sanctions against China and that new export controls will not be implemented. Treasury Secretary Bessent stated that alternative legal authorities regarding tariffs could be invoked if necessary, while the market focused on the decision expected to be announced at the end of December.As the Senate moves forward with the nominations of Mike Selig as CFTC Chair and Travis Hill as FDIC Chair, both are expected to play a decisive role in crypto regulation. While the Japanese government emphasized that it would maintain its current policy on Taiwan, Russia stated that crypto should be included in its foreign trade framework.
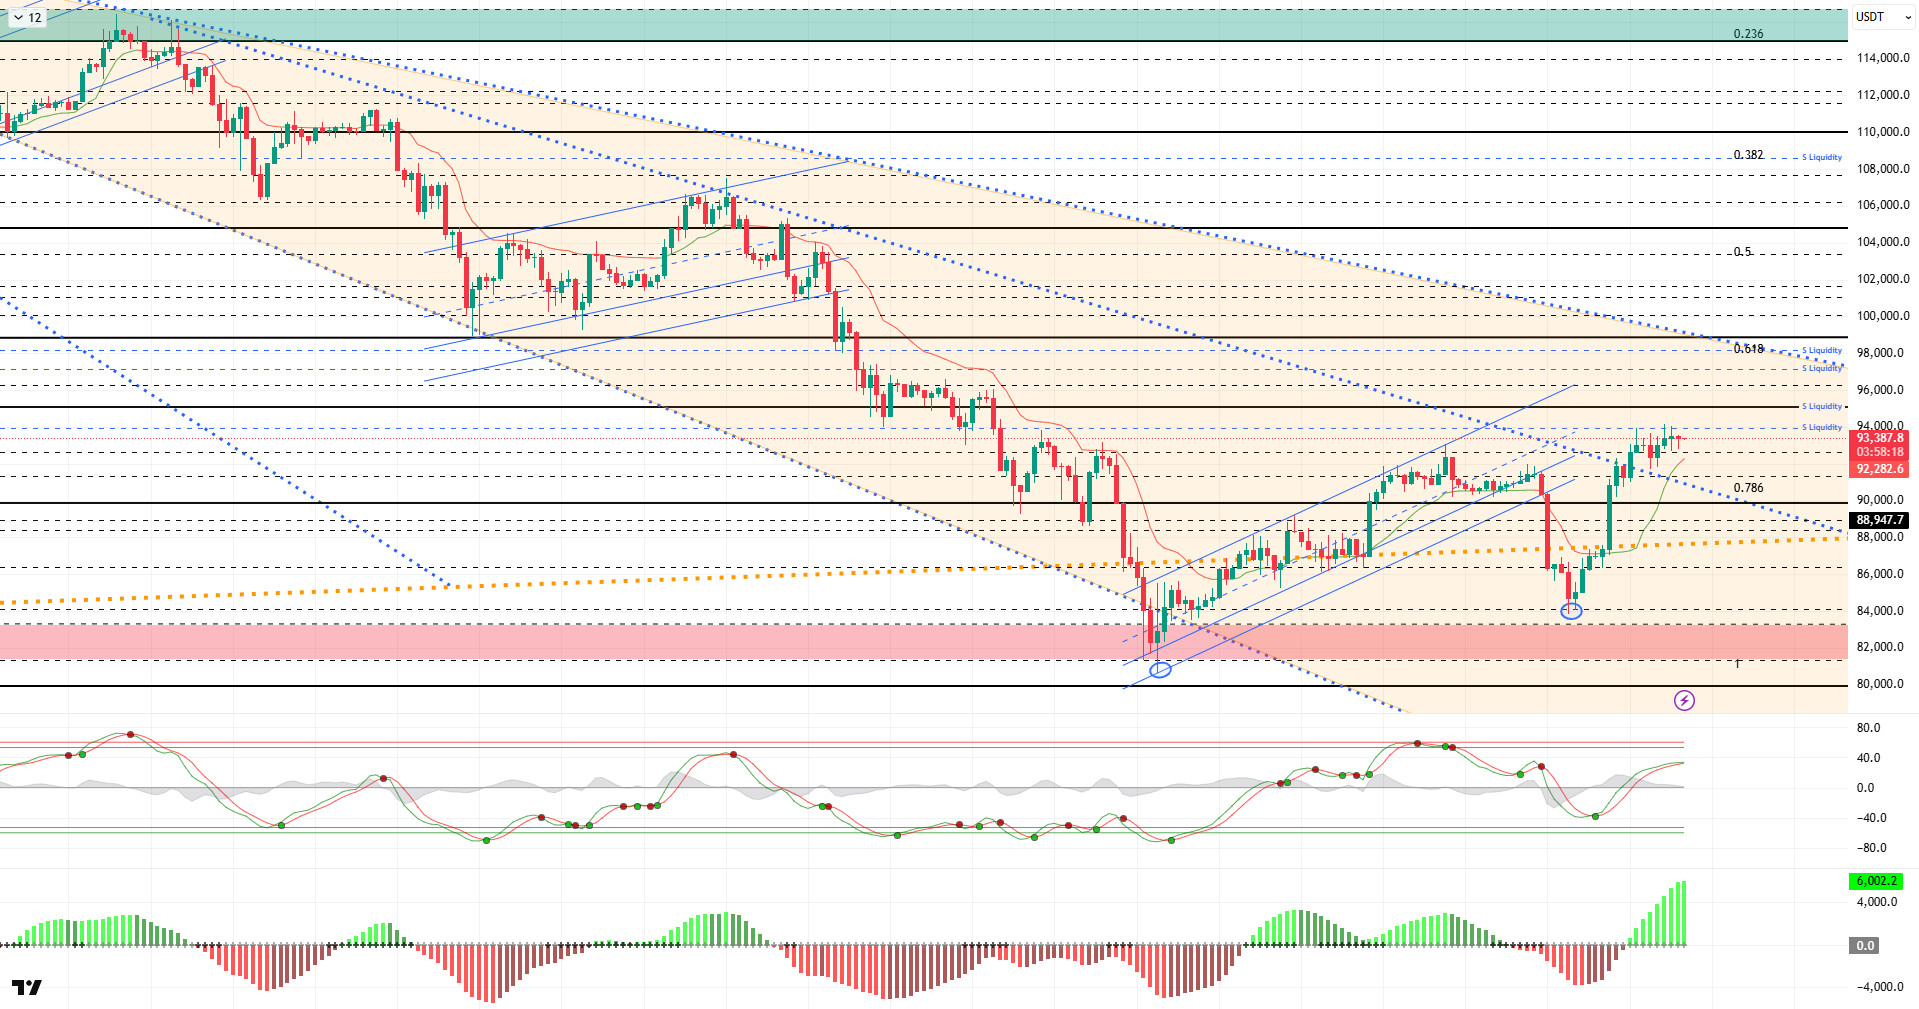
From a technical perspective, BTC occasionally dips below the 93,000 level due to pressure from news flow, but it manages to recover and hold above the falling trend line. Following a strong, high-volume candle above the key 90,000 level, the price formed six consecutive small-bodied candles, indicating a weakening of the upward momentum. At the time of writing, BTC continues to trade at the 93,300 level, maintaining a horizontal-range structure similar to a rising flag formation.
Technical indicators show the Wave Trend (WT) oscillator producing a buy signal just above the oversold zone but weakening as it crosses the channel’s middle band. The histogram on the Squeeze Momentum (SM) indicator continues to gain momentum in the positive zone. The Kaufman Moving Average (KAMA) is currently positioned below the price at the $91,900 level.
According to liquidation data, with the recent rise, sell-side transactions within the 92,000–94,000 band have been liquidated. On a monthly basis, the 97,000–98,000 band continues to be an area of intense accumulation. The buying level gained some intensity in this region with the break above the $90,000 level, while $83,000 continues to be a heavy buying zone.
In summary, Vanguard’s announcement that it will offer ETF services to its customers had a significant impact on BTC’s momentum, while ADP private sector employment coming in well below expectations pushed December interest rate cut expectations to 90% levels ahead of the FOMC. The US suspended its export restrictions sanctions against China. Technically, after losing the minor uptrend channel, the price recorded a “U”-shaped rise, surpassing the 90,000 reference level. Liquidity data indicates that target zones have regained importance and that the market continues to seek equilibrium. At this stage, 90,000 has become a critical point for the price to maintain its momentum. Closes and pricing above this level are an important indicator for regaining momentum. In this context, 95,000 stands out as the next target area, and if it is passed, liquidity areas will be monitored again, with 90,000 once again coming to the fore as both a reference and liquidity area in the event of possible selling pressure.
Supports: 92,600 – 91,400 – 90,000
Resistances: 94,000 – 95,000 – 96,200
ETH/USDT
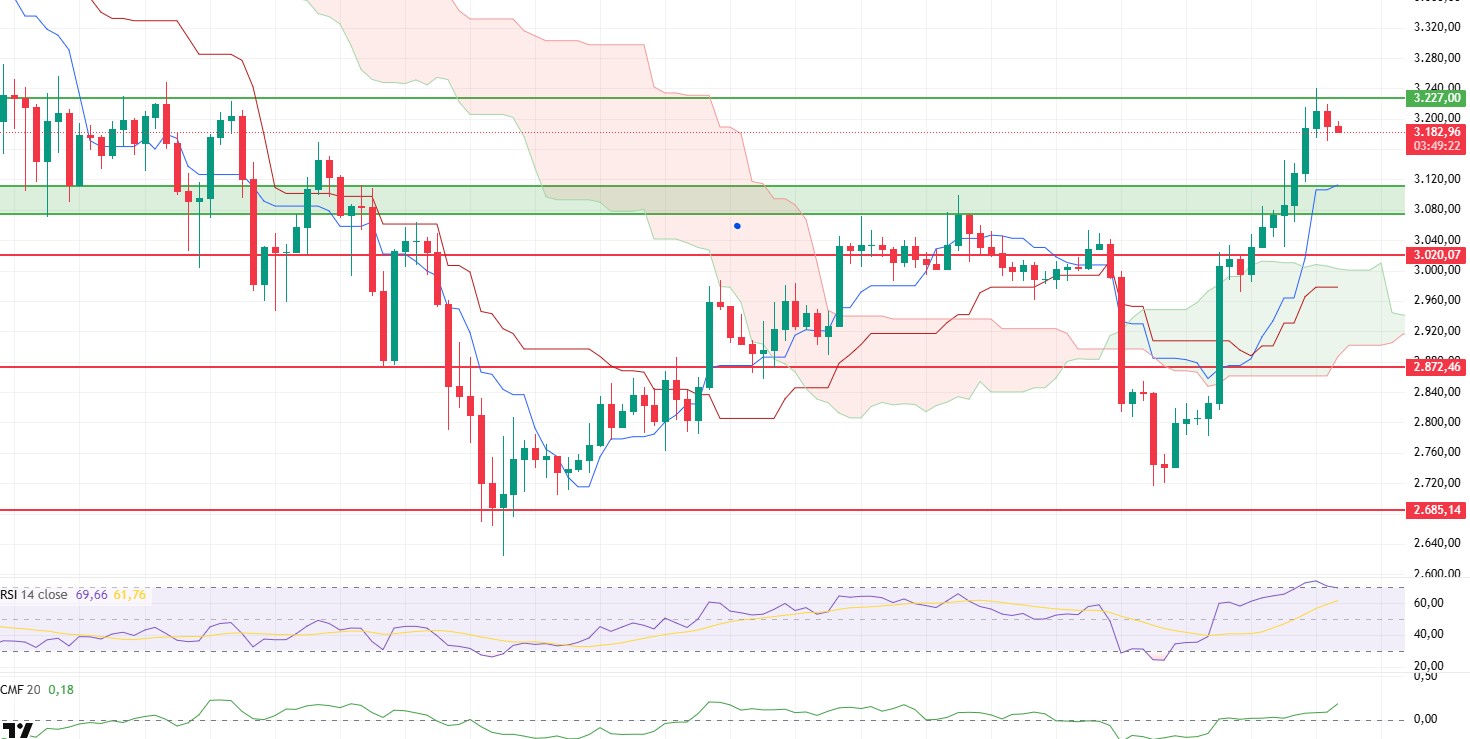
With continued strong buyer interest yesterday, the ETH price rose above the area marked with a green rectangle on the chart and managed to climb to the main resistance level of $3,227. With light selling from this area, the price is currently trying to stabilize at the $3,190 level. Although the upward movement is still strong, there is a short-term pause at the resistance zone.
The liquidity outlook is quite positive. The Chaikin Money Flow (CMF) indicator continues to rise in positive territory, signaling continued capital inflows and a healthy liquidity structure supporting the uptrend. This confirms that buyers continue to dominate the market.
On the momentum side, signs of overheating are becoming apparent. The Relative Strength Index (RSI) indicator followed the rise and reached the overbought zone. This level is an important warning point in terms of triggering profit-taking in the short term. Therefore, it is reasonable to expect the price to make intermediate corrections.
Looking at the Ichimoku indicator, the technical structure remains strong. The price continuing to stay above the kumo cloud and the Tenkan and Kijun lines being in a supportive position below the price confirms the uptrend.
The overall outlook remains positive. If the ETH price manages to break above the $3,227 level with strong volume, the uptrend is expected to accelerate towards the $3,285 and then the $3,350 region. However, if the price falls below the support line monitored as the green zone, the short-term correction process may deepen further, and the price may retreat towards the $3,070 – $3,020 range.
Below the Form
Supports: 3,070 – 3,020 – 2,872
Resistances: 3,227 – 3,436 – 3,672
XRP/USDT
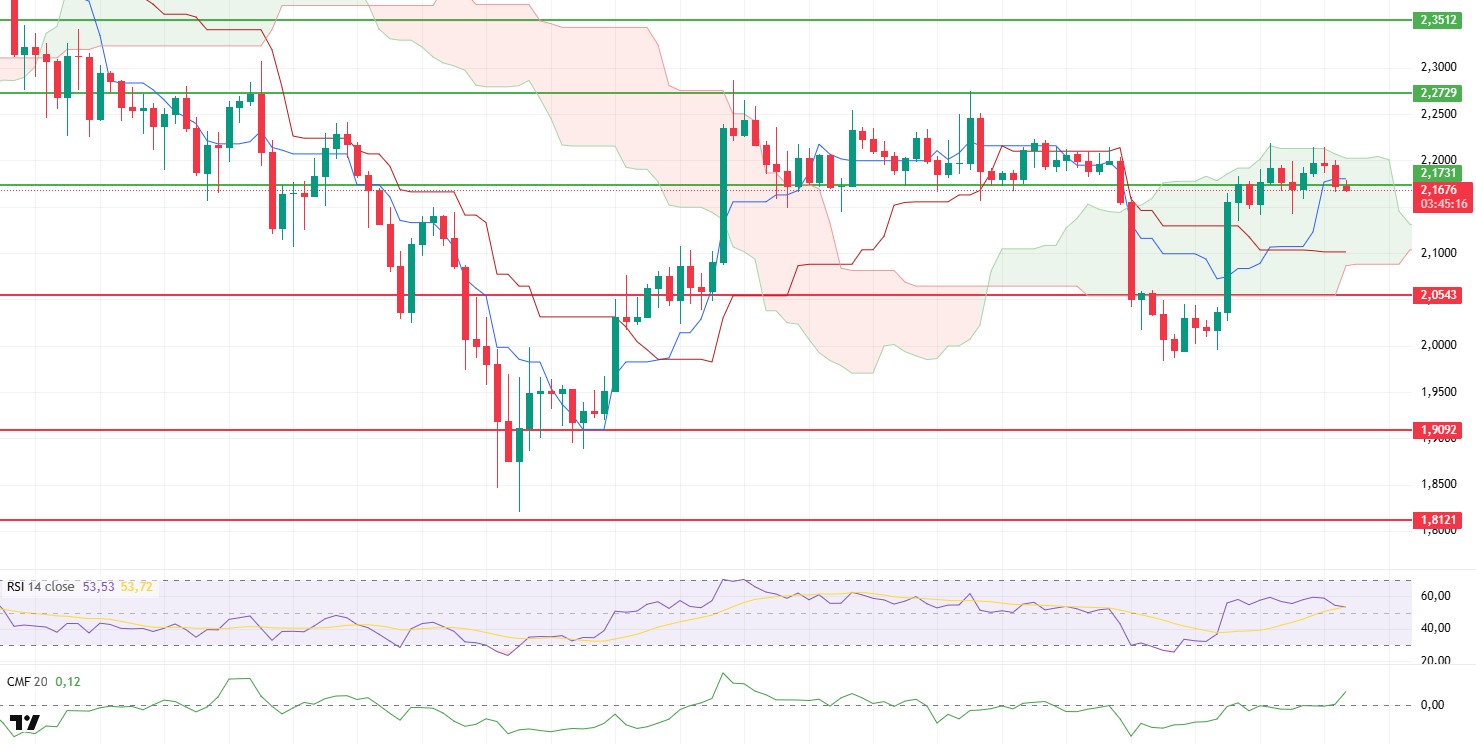
The XRP price tested the upper band of the cloud once again during the day but failed to hold at this level, facing selling pressure and falling back below the $2.17 level. This pullback shows that sellers in the resistance zone are still strong and buyers are struggling to maintain upward momentum.
The liquidity outlook remains positive. The Chaikin Money Flow (CMF) indicator continues to move in positive territory, signaling that capital inflows into the market are continuing and that declines are being met by buyers for now. This structure confirms that the uptrend is not completely over and that buyer demand is still in play.
On the momentum side, however, signs of weakening are noticeable. The slight downward shift in the Relative Strength Index (RSI) indicates a short-term loss of strength, making the price, which is in the decision-making zone, more sensitive.
The Ichimoku structure has not changed significantly overall. The price trading below the kumo cloud indicates that the short- and medium-term trend has not yet fully turned positive. A daily close above the cloud stands out as a critical threshold that would bring about a significant shift in the technical outlook.
When evaluating the overall picture, it appears that XRP is still experiencing a battle for equilibrium. The $2.17 level continues to be the threshold that determines the fate of the short-term trend. If this level is regained, the $2.21 and $2.27 resistance levels could become targets again. However, as long as the price remains below this level, selling pressure is likely to continue, and the price could retreat towards the support range of $2.12 and $2.05.
Supports: 2.0543 – 1.9092 – 1.8121
Resistances: 2.1731 – 2.2729 – 2.3512
SOL/USDT
Franklin Templeton launched the Solana Spot ETF, known as SOEZ. Revolut began supporting the Solana network. Solana Mobile will launch the SKR token in January with a supply of 10 billion units.
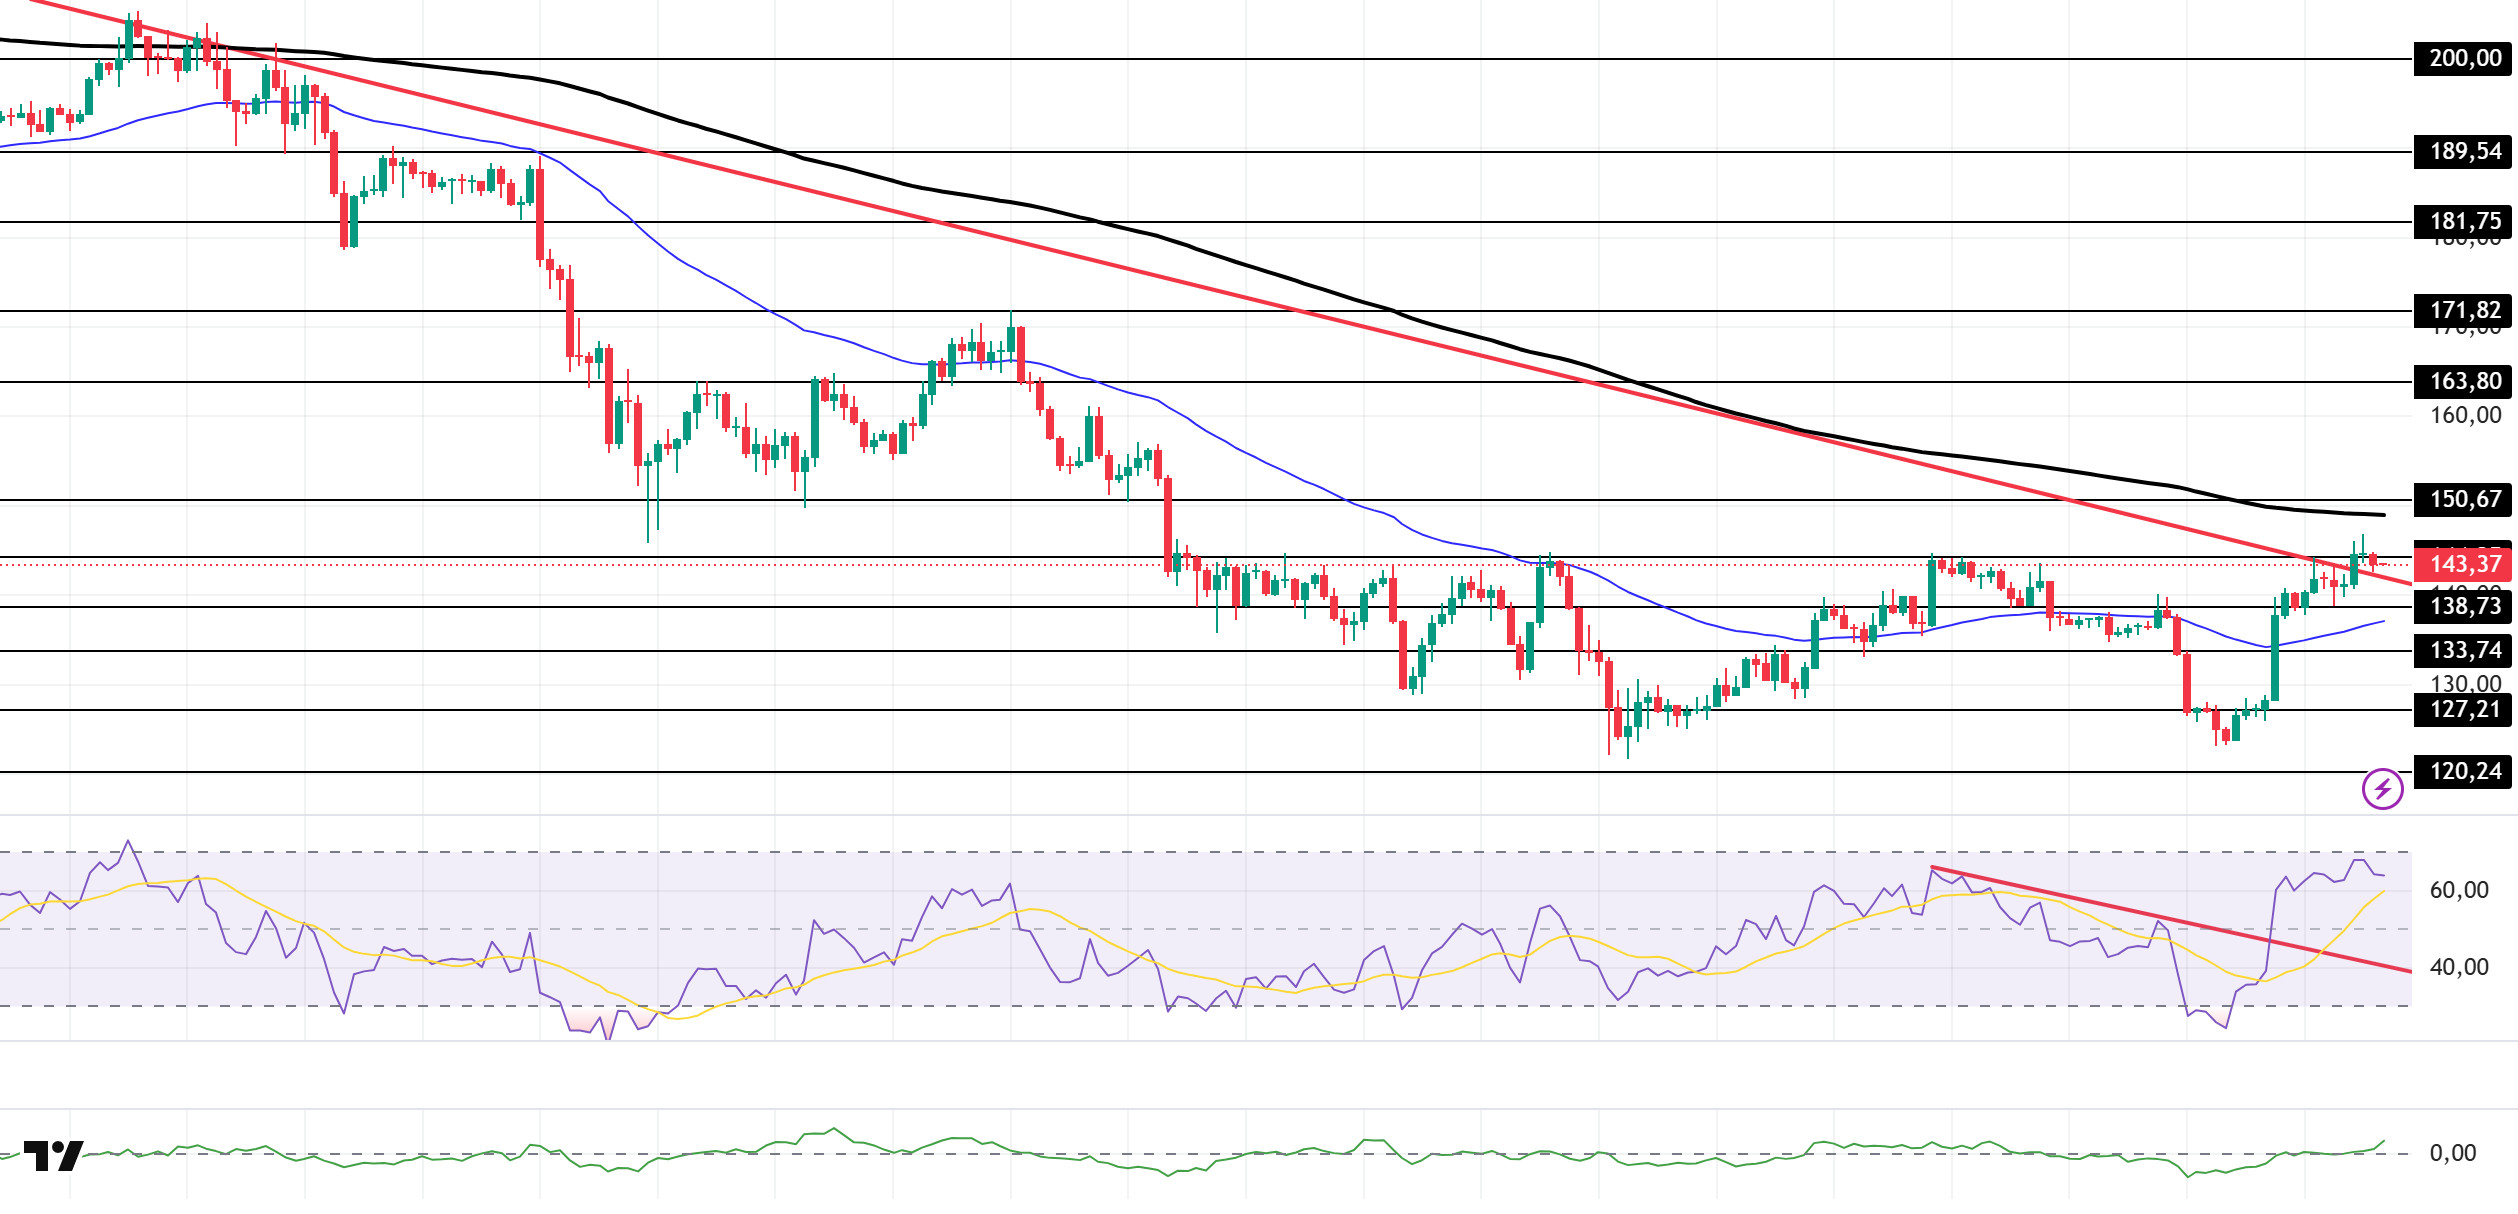
The SOL price maintained its momentum. The asset moved into the upper region of the downtrend that began on October 6. Breaking above the 50 EMA (Blue Line) moving average, which is a strong resistance level, the price also broke the downtrend and is currently preparing to test the 200 EMA (Black Line) moving average as resistance. Closes above the 200 EMA (Black Line) moving average could target the $163.80 level. In the event of a pullback, the 50 EMA (Blue Line) moving average should be monitored.
The price remained below the 50 EMA (Exponential Moving Average – Blue Line) and 200 EMA (Black Line) on the 4-hour chart. This indicates a potential downtrend in the medium term. At the same time, the price being between both moving averages shows us that the asset is in a decision phase in the short term. The Chaikin Money Flow (CMF-20) crossed into positive territory. However, the balance of money inflows and outflows may keep the CMF in positive territory. The Relative Strength Index (RSI-14) rose towards the overbought zone, signaling a sharp increase in buying appetite. At the same time, it continued to hold above the upper region of the downward trend that began on November 26. This signaled that buying pressure was continuing. If there is an increase due to macroeconomic data or positive news related to the Solana ecosystem, the $163.80 level stands out as a strong resistance point. If this level is broken upwards, the increase is expected to continue. In the event of pullbacks due to developments in the opposite direction or profit-taking, the $133.74 level could be tested. A decline to these support levels could increase buying momentum, presenting a potential upside opportunity.
Supports: 138.73 – 133.74 – 127.21
Resistances: 144.35 – 150.67 – 163.80
DOGE/USDT
21Shares updated its ETF application.
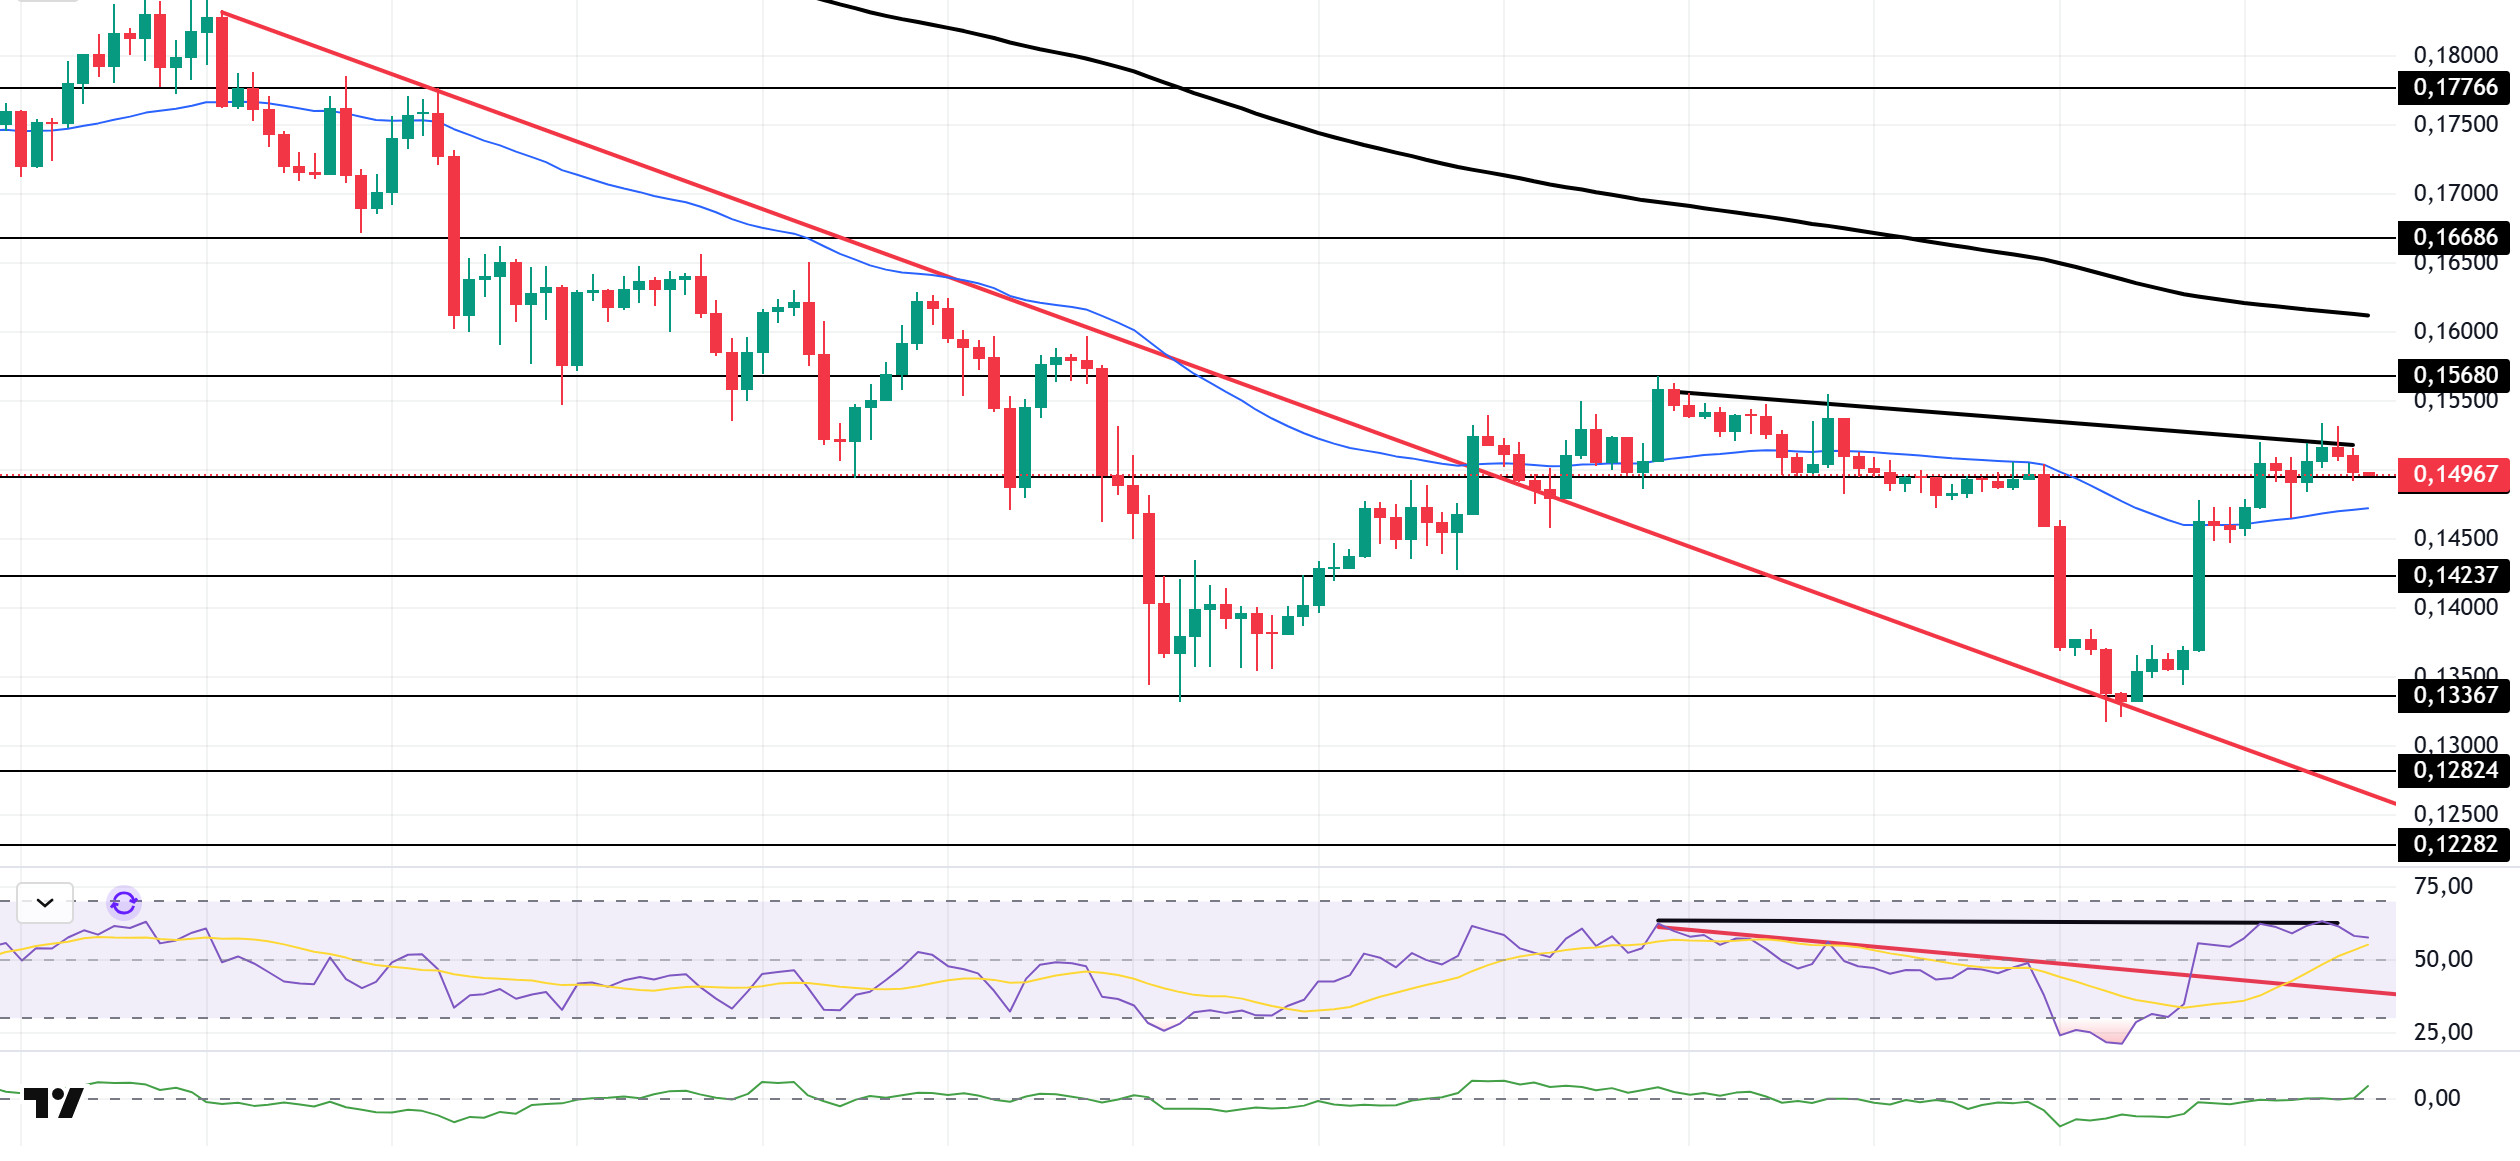
The DOGE price continued to move sideways. The asset gained value by gaining downward momentum starting on November 11 and broke above the 50 EMA (Blue Line) moving average. Currently testing the $0.14952 level as support, the price could test the 200 EMA (Black Line) moving average as resistance if the uptrend continues. In the event of a pullback, the 50 EMA (Blue Line) moving average could act as support again.
On the 4-hour chart, the 50 EMA (Exponential Moving Average – Blue Line) remained below the 200 EMA (Black Line). This indicates that the downtrend may continue in the medium term. The price being between the two moving averages indicates that the price is in a decision phase in the short term. The Chaikin Money Flow (CMF-20) remained at a neutral level. Additionally, the balance of money inflows and outflows may keep the CMF at a neutral level. The Relative Strength Index (RSI-14) accelerated from the oversold zone to the middle of the positive zone. At the same time, it crossed above the upper region of the downward trend that began on November 26. This signaled the formation of buying pressure. However, negative divergence could cause a pullback. In the event of an uptrend driven by political developments, macroeconomic data, or positive news flow in the DOGE ecosystem, the $0.16686 level stands out as a strong resistance zone. Conversely, in the event of negative news flow, the $0.13367 level could be triggered. A decline to these levels could increase momentum and initiate a new wave of growth.
Supports 0.14952 – 0.14237 – 0.13367
Resistances 0.15680 – 0.16686 – 0.17766
AVAX/USDT
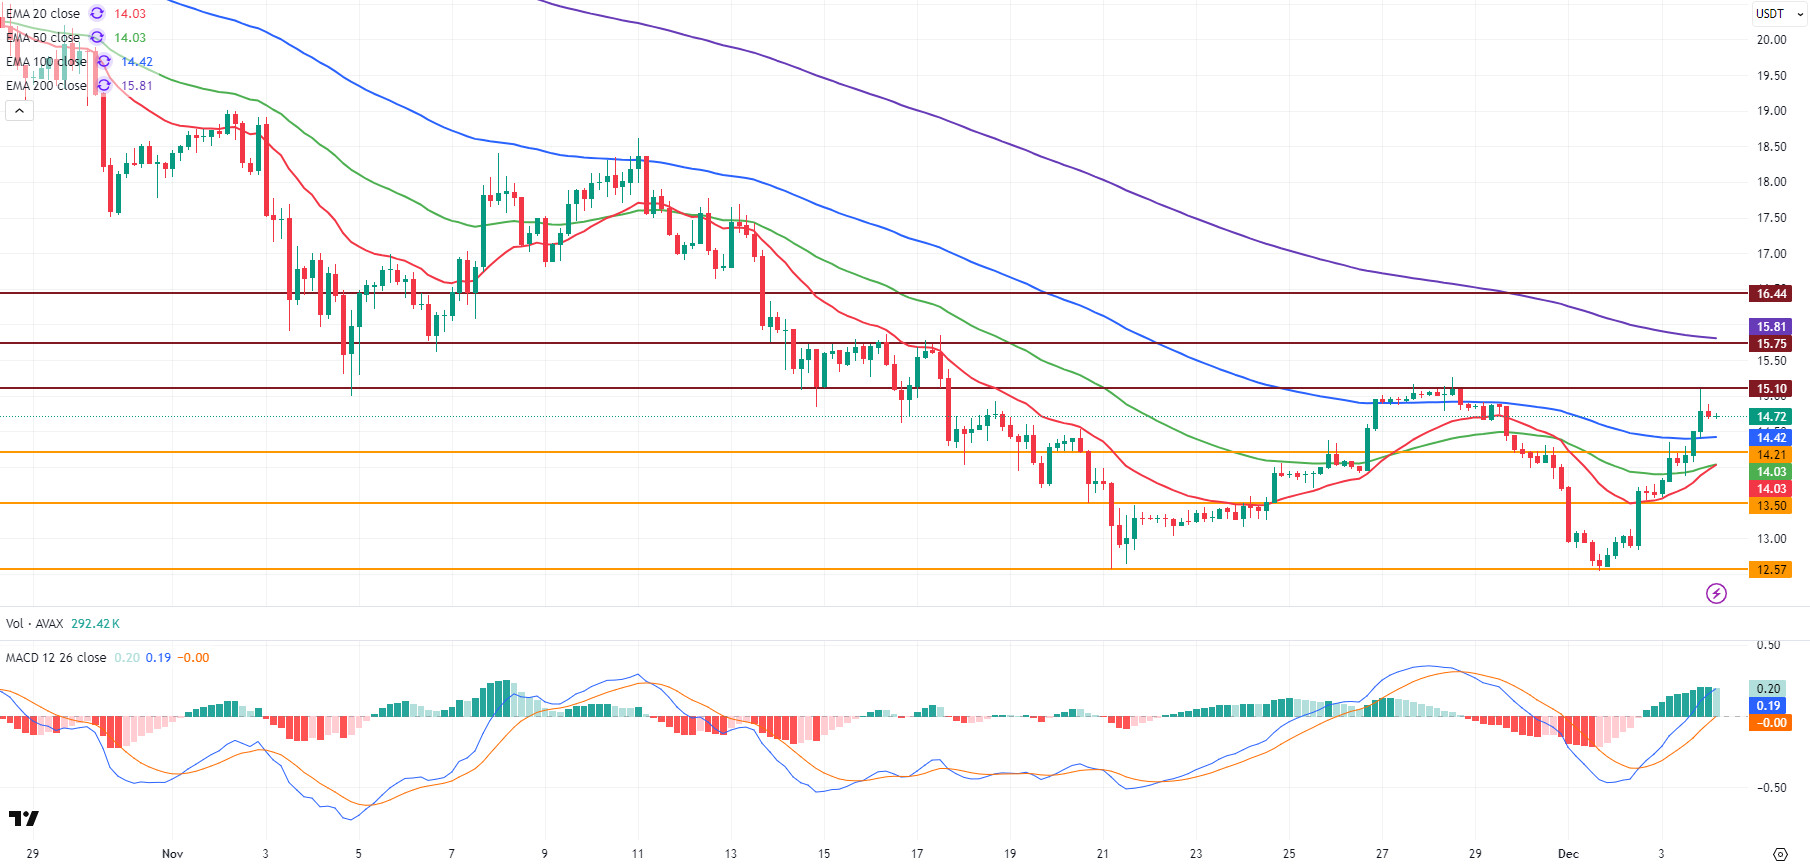
AVAX started yesterday at $13.62 and continued to rise throughout the day with strong buying pressure, closing at $14.78. Thus, it gained approximately 8.5% on a daily basis. With the sharp rise towards the close yesterday, the $14.21 resistance, the EMA100 level, and the upper band of the bearish channel were broken. AVAX rose to the $15.10 level after this breakout but retreated due to selling pressure in this region, settling back into the $14.75 band. Today, AVAX opened at $14.78 and is currently trading sideways. The strong recovery trend in the overall market and the positive news flow regarding the Avalanche ecosystem continue to be key factors supporting AVAX’s upward momentum.
On the 4-hour chart, the Moving Average Convergence/Divergence (MACD) line continues to trade above the signal line and is pointing upwards. With yesterday’s sharp rise, the MACD line moved into positive territory and the outlook turned completely positive. This indicates that short-term momentum has strengthened and the rise is technically supported. Furthermore, AVAX continues to trade above critical Exponential Moving Average (EMA) levels, namely EMA20, EMA50, and EMA100. These breakouts technically confirm that AVAX has entered a short-term uptrend. Only the EMA200 level stands in the way of AVAX’s rise. The breakout of the upper band of the bearish channel also stands out as an important technical signal supporting the trend reversal expectation.
From a technical perspective, the $15.10 level is the first important resistance level for AVAX’s rise. If this region is broken through with high volume, the next targets for AVAX will be $15.75, EMA200, and $16.44. The EMA200 level, in particular, is a critical barrier in terms of trend reversal. In downward movements, the first important support is the $14.21 level, and closes below this level could pull the price back towards the $13.50 region. If the $13.50 level is also lost, selling pressure could increase and AVAX could fall back towards the $12.57 support. Overall, the MACD’s positive outlook and the completion of EMA breakouts continue to support the short-term bullish scenario.
(EMA20: Red Line, EMA50: Green Line, EMA100: Blue Line, EMA200: Purple Line)
Supports: 14.21 – 13.50 – 12.57
Resistances: 15.10 – 15.75 – 16.44
Legal Notice
The investment information, comments, and recommendations contained herein do not constitute investment advice. Investment advisory services are provided individually by authorized institutions taking into account the risk and return preferences of individuals. The comments and recommendations contained herein are of a general nature. These recommendations may not be suitable for your financial situation and risk and return preferences. Therefore, making an investment decision based solely on the information contained herein may not produce results in line with your expectations.

