
Technical Analysis
BTC/USDT
Despite growing optimism on the Russia-Ukraine front following Trump’s message that “an agreement is very close,” the revised 28-point plan remains stuck in fragile “last mile” negotiations, particularly on territorial issues, and is shaped by Europe’s cautious stance. On the US side, Nick Timiraos’s coverage of the debate reinforced the pricing of a soft compromise towards a 25 bp cut in December, while the December 5 PCE data emerged as the decisive final inflation figure ahead of the meeting; at the same time, Bessent’s signal that the new Fed chair nominee would be announced before December 25 kept uncertainty about the policy path alive. On the Asian front, the Trump-Takaichi theme following the Xi-Trump meeting and China’s “positive-constructive” emphasis were other critical topics monitored in terms of the trajectory of China-Japan tensions on the Taiwan and Indo-Pacific security axis.
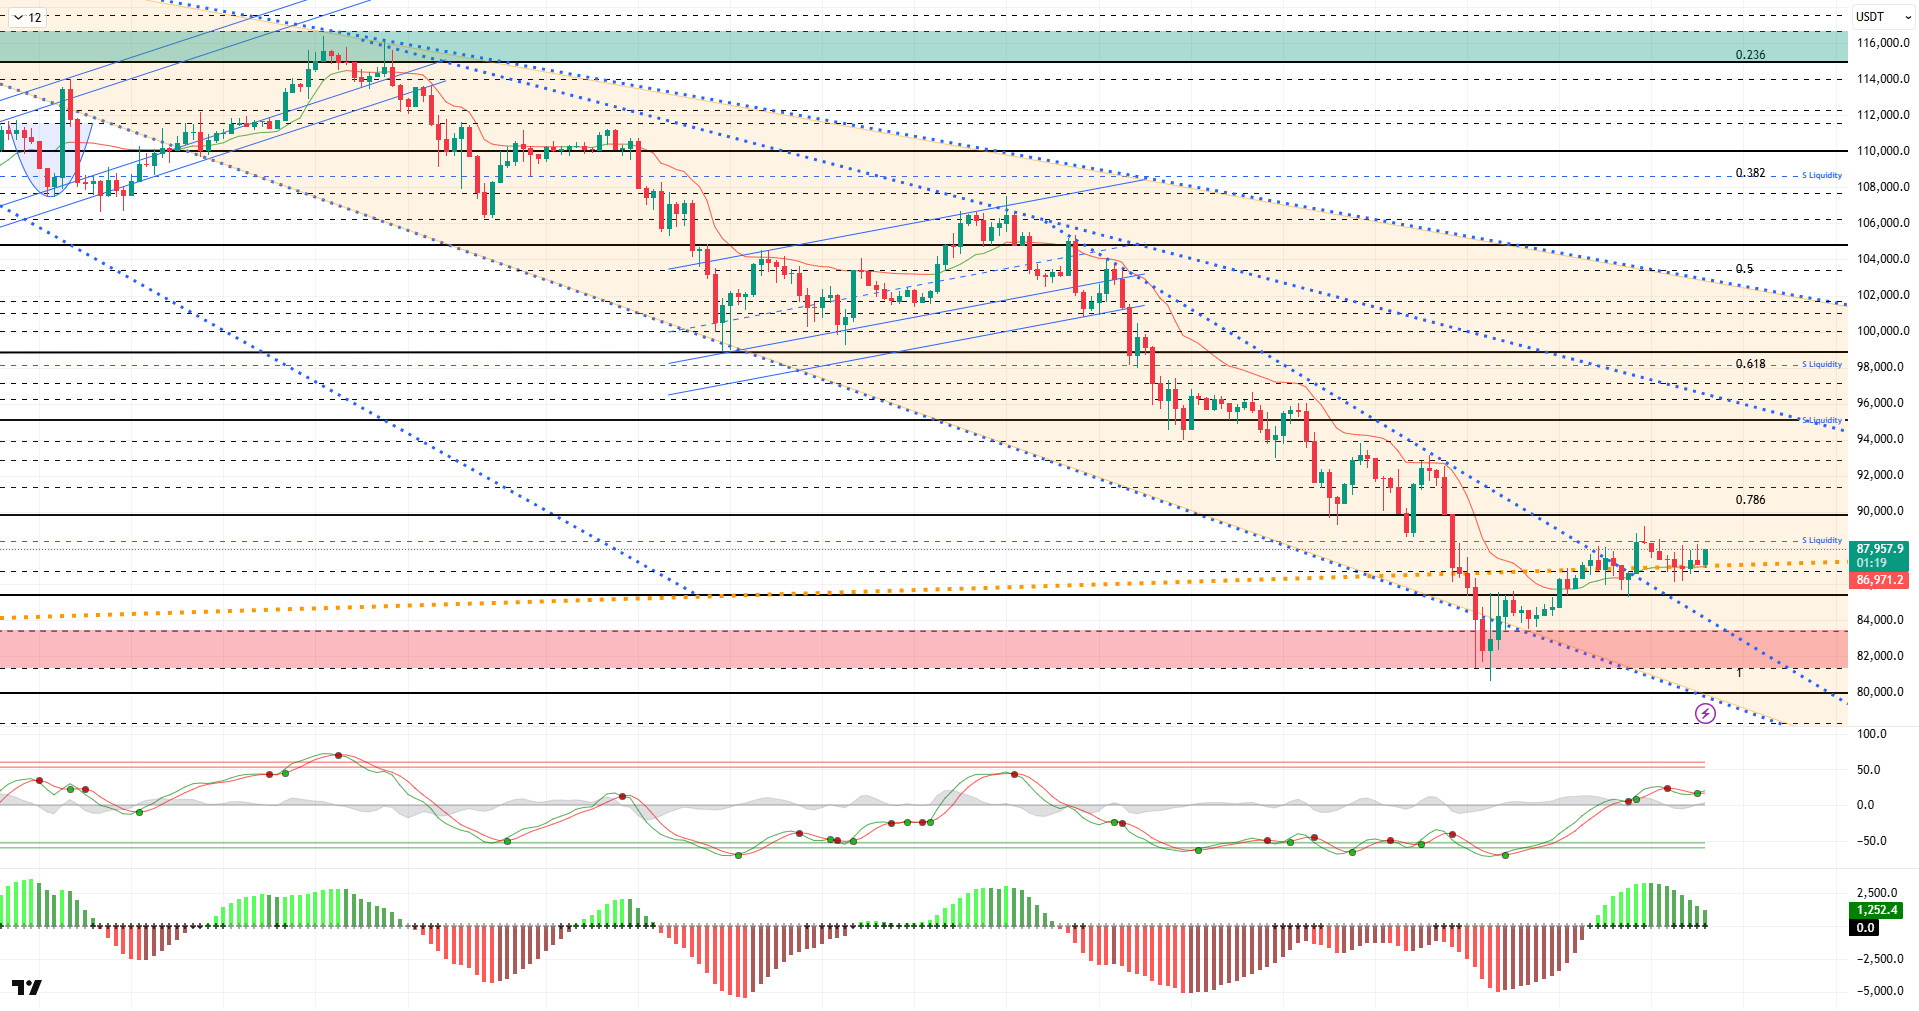
From a technical perspective, although the price occasionally dips below the major trend line, it generally manages to stay above this line. After the rebound, BTC, which has been trading sideways above the 87,000 level, is looking to regain momentum. Trading at around 87,800 at the time of writing, BTC could maintain its upward channel if the rebound continues, reducing the possibility of a double bottom forming at the 80,000 level for now.
Technical indicators show the Wave Trend (WT) oscillator giving an indecisive buy/sell signal above the channel midband this time, but it has recently started giving a buy signal once again. The histogram on the Squeeze Momentum (SM) indicator is weakening after gaining momentum in positive territory. The Kaufman moving average (KAMA) is currently at $86,900, positioned below the price.
According to liquidation data, investors are repositioning themselves on the buy side with the latest rise, with 85,000 emerging as the short-term congestion level, while the fragmented short-term sell side has accumulated again at this point following the liquidation at the 89,000 level.
In summary, following the rise in BTC driven by expectations of interest rate cuts, positive developments on the Russia-Ukraine front reduced selling pressure, supporting the price by pushing it into a consolidation phase. Technically, the price is attempting to form an upward channel with upward momentum, recovering from the 80,500 low. Liquidity data indicates that target zones are regaining importance and that the market is entering a partial stabilization process. For the rally to gain a solid footing in the coming period, closes above the 87,000 level, where the major uptrend line passes, will be critical. Should demand increase again and potential catalysts come into play, the 90,000 level could be monitored as the main reference zone. Conversely, if selling pressure intensifies, the 85,000 level will emerge as the new reference and liquidity zone.
Supports: 86,700 – 85,000 – 83,300
Resistances: 88,300 – 90,000 – 91,500
ETH/USDT
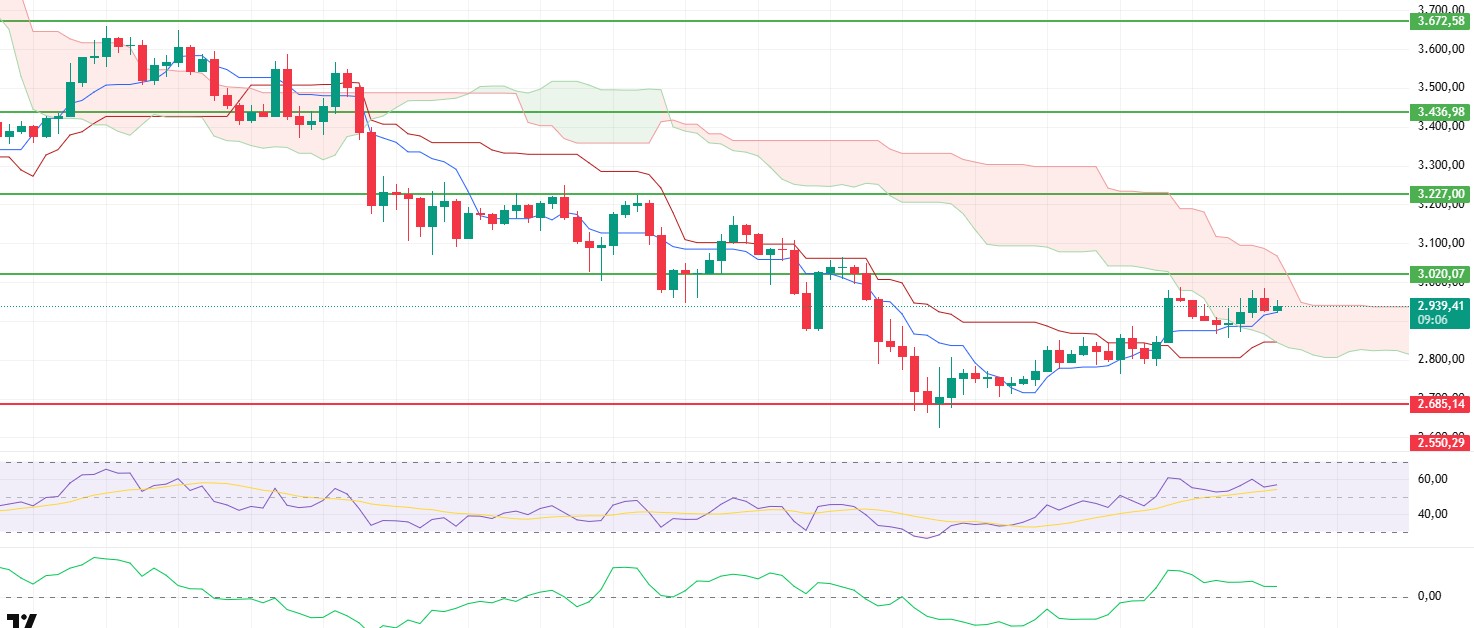
The ETH price rose to $2,983 yesterday evening, making a strong attack, but it retreated towards the Tenkan level due to selling pressure encountered in this region. The price is currently trying to stabilize around $2,935. In the short term, despite the reaction from the high resistance zone, the price appears to be trying to maintain its positive structure.
The Chaikin Money Flow (CMF) indicator failing to support the price increase is a notable sign of weakness. As the CMF continues its negative trend, it appears that liquidity inflows into the market are insufficient. The continued downward trend in the Cumulative Volume Delta (CVD) spot data also confirms that buyers remain weak, particularly on the spot side. This suggests that the upward momentum may be limited.
The Relative Strength Index (RSI) indicator continues its horizontal movement above the 50 level, revealing that momentum is still in positive territory and buyers have not completely withdrawn from the market. However, the lack of a strong signal of strengthening indicates that price volatility may continue.
The Ichimoku indicator shows that the price holding above the Tenkan level and continuing to remain within the kumo cloud indicates that the short-term positive outlook is maintained. The price moving within the cloud reminds us that the stages of the trend reversal are continuing, but that closes above the cloud are necessary for it to fully gain strength.
When assessing the overall outlook, despite the positive structure in technical indicators, the lack of sufficient support on the liquidity side suggests that upward movements may struggle at resistance levels. While the price could rise to around $3,020 during the day, a rejection from this level is likely to trigger a pullback. Should downward pressure intensify, a loss of the $2,870 support level could pave the way for steeper declines.
Below the Form
Supports: 2,870 – 2,685 – 2,550
Resistances: 3,020 – 3,227 – 3,436
XRP/USDT
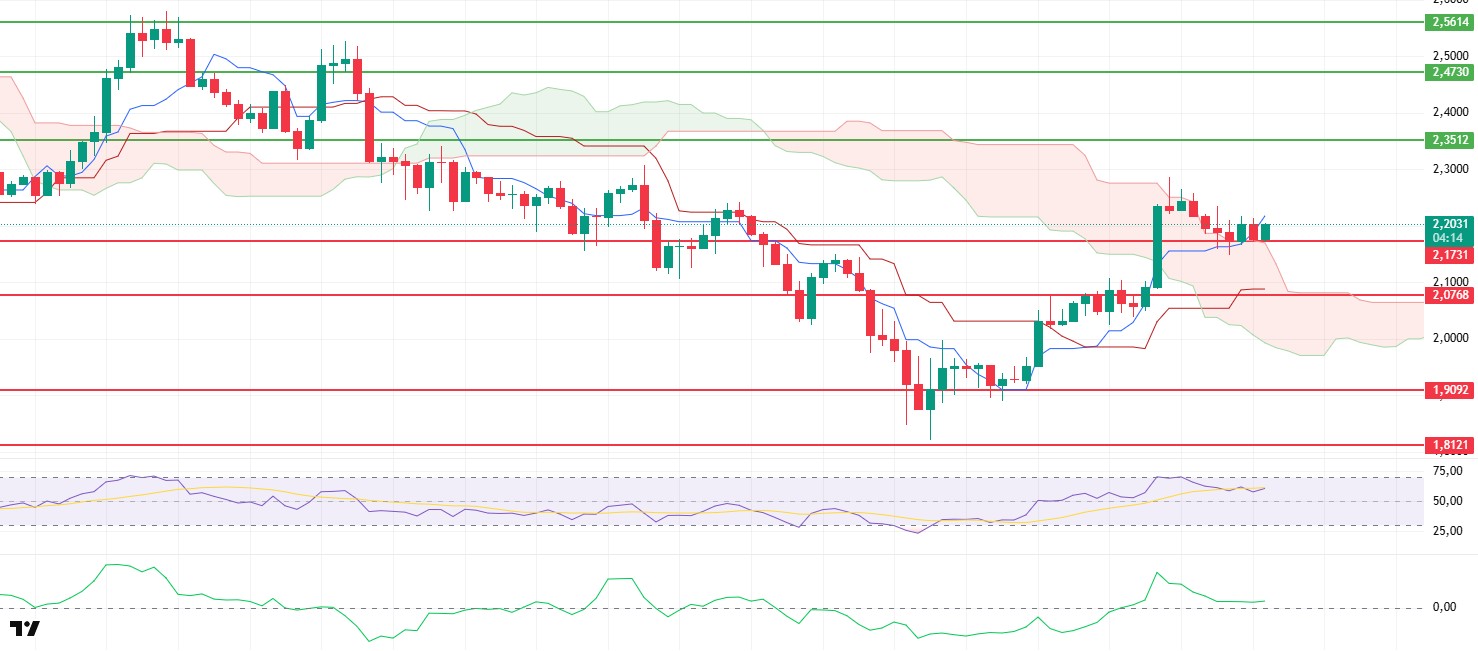
The XRP price continues to hold steady at $2.17, the upper band of the cloud, maintaining its gains throughout the day. The price’s effort to stay above this level indicates continued buyer support and a desire to maintain the short-term positive outlook.
The downward trend in the Chaikin Money Flow (CMF) indicator continues. The CMF’s continued decline signals that liquidity outflows from the market are still active and that buying power is struggling to fully engage. This structure stands out as a factor that could put pressure on prices in the short term.
The Relative Strength Index (RSI) indicator remains in positive territory. This strong momentum suggests that upside potential is still valid, but the indicator’s position also signals that volatile movements may continue.
In the Ichimoku indicator, the price settling above the cloud represents a technically significant breakout. This structure can be considered the beginning of a medium-term trend change.
Overall, it remains critical for XRP to hold the $2.17 level. If it manages to stay above this region, the price is expected to continue its upward attempts. However, if the support region is lost, the upward momentum may weaken, and the price may face the risk of retreating back towards the $2.07 level.
Supports: 2.1731 – 2.0768 – 1.9092
Resistances: 2.3512 – 2.4730 – 2.5614
SOL/USDT
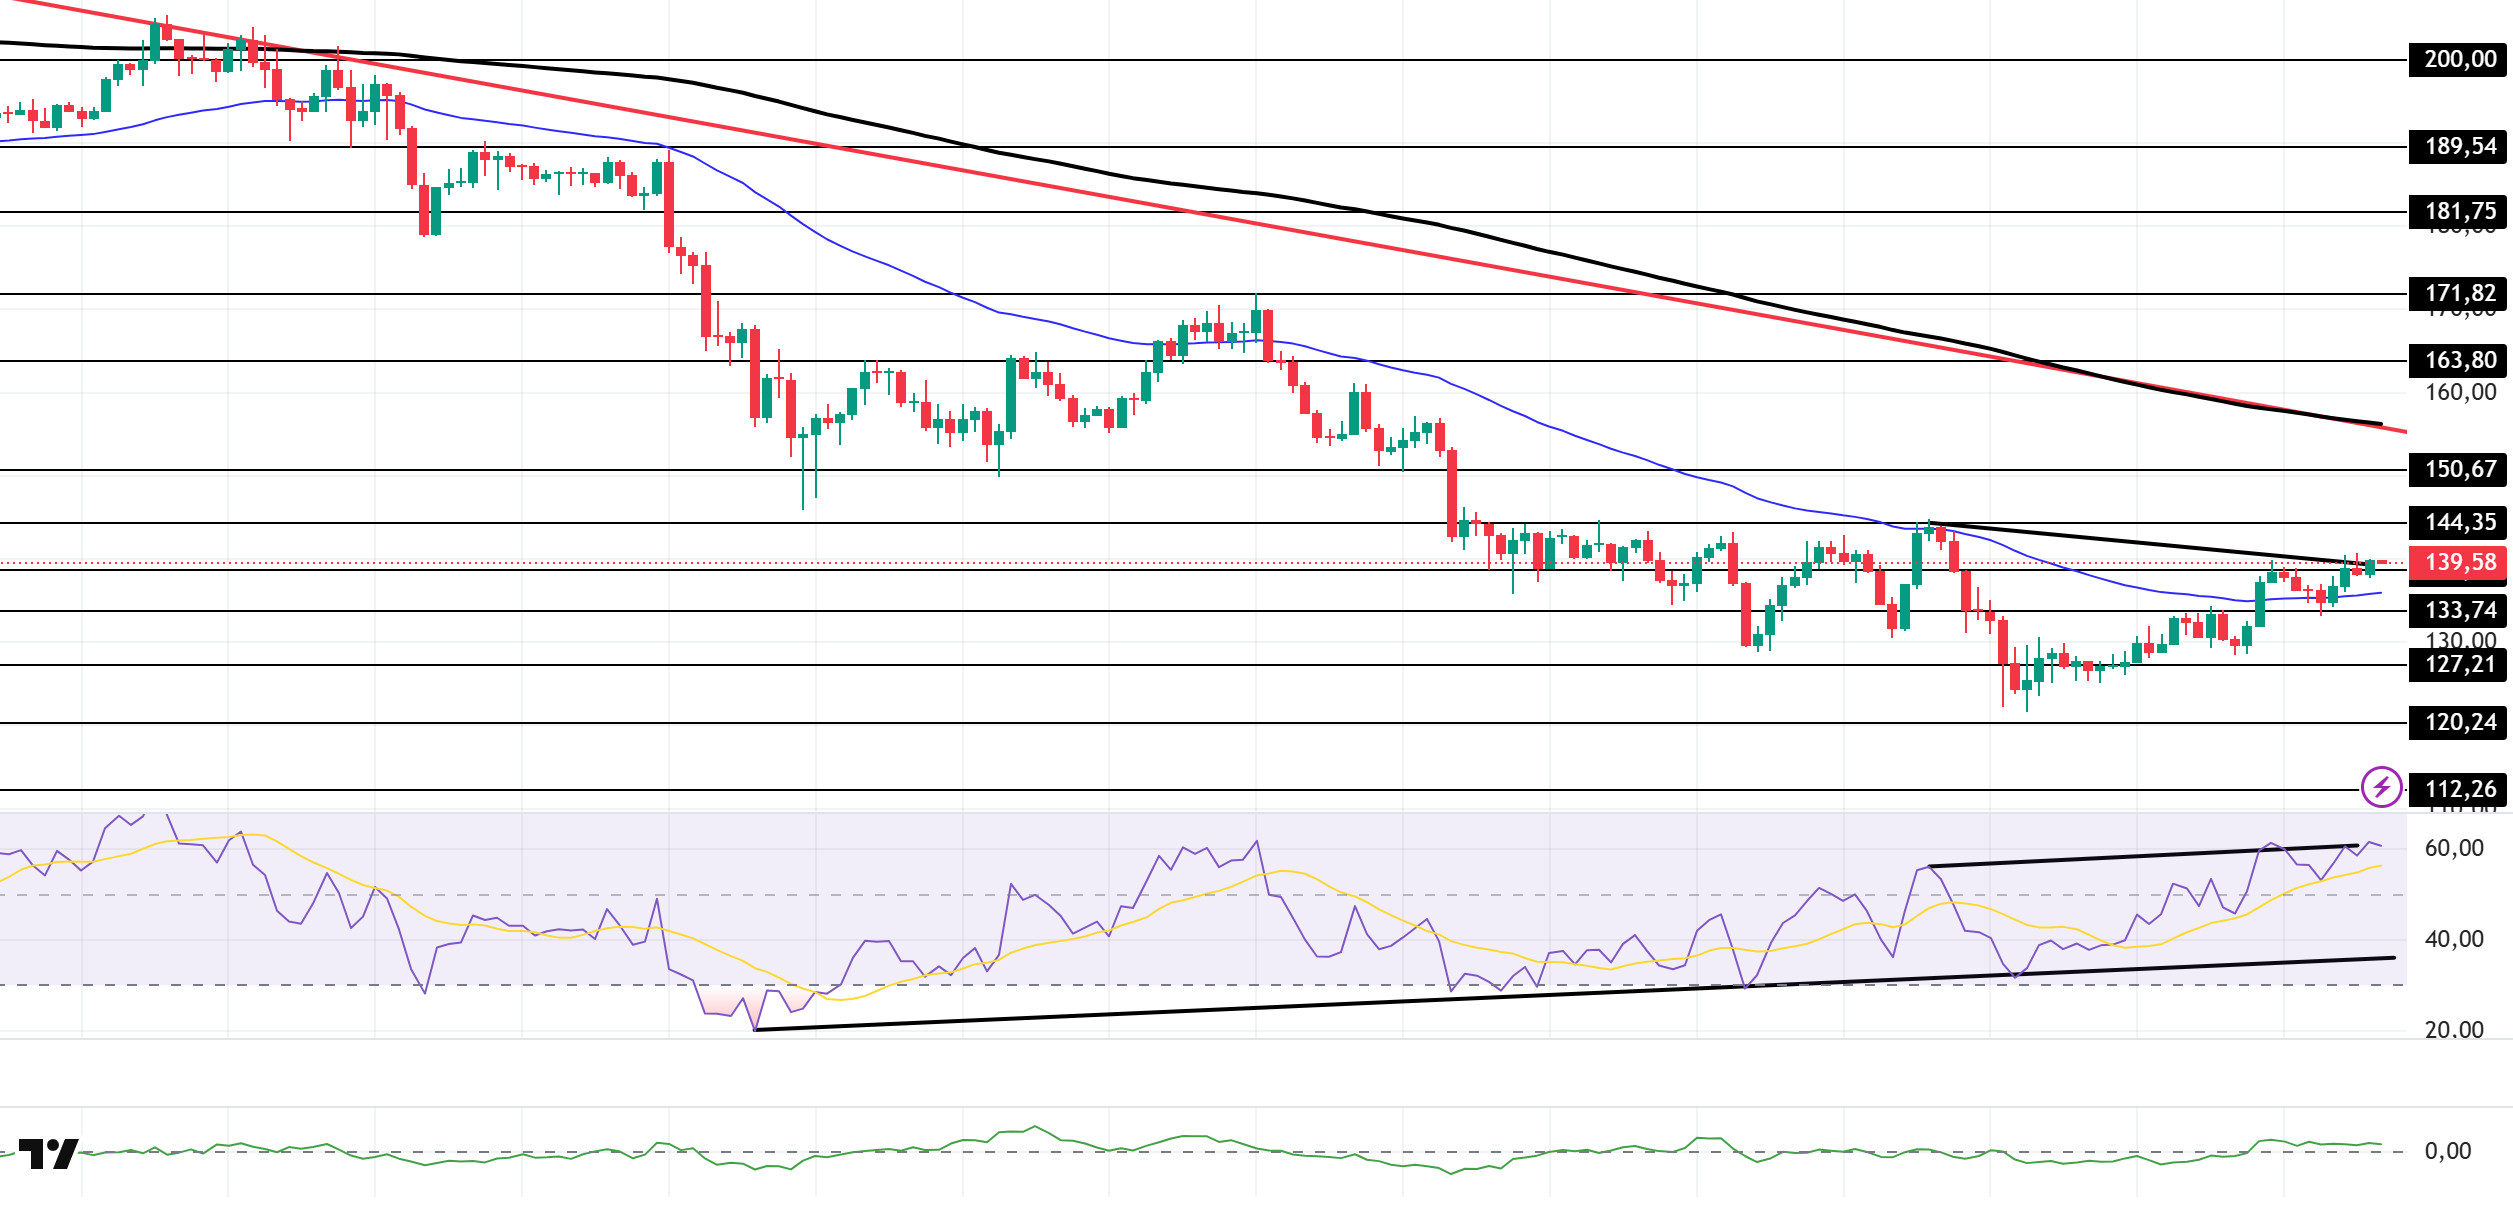
SOL price showed a slight increase. The asset continued to remain in the lower region of the downward trend that began on October 6. Breaking through the strong resistance level of $133.74 and the 50 EMA (Blue Line) moving average with a strong candle, the asset experienced a pullback, found support from the 50 EMA moving average, and is currently testing the $138.73 level as resistance. If the uptrend continues, it could test the $150.67 level. If a pullback begins, it could test the $127.21 level as support.
On the 4-hour chart, it remained below the 50 EMA (Exponential Moving Average – Blue Line) and 200 EMA (Black Line). This indicates that it may be in a downtrend in the medium term. At the same time, the price being between the two moving averages shows us that the asset is in a decision phase in the short term. The Chaikin Money Flow (CMF-20) remained in positive territory. However, an increase in money outflows could push the CMF into negative territory. The Relative Strength Index (RSI-14) remained at the upper level of positive territory. It also remained above the rising line that began on November 4. On the other hand, there is a negative divergence. This indicates that selling pressure may occur. If there is an uptrend due to macroeconomic data or positive news related to the Solana ecosystem, the $150.67 level stands out as a strong resistance point. If this level is broken upwards, the uptrend is expected to continue. If there are pullbacks due to developments in the opposite direction or profit-taking, the $120.24 level could be tested. A decline to these support levels could increase buying momentum, presenting a potential upside opportunity.
Supports: 133.74 – 127.21 – 120.24
Resistances: 138.73 – 144.35 – 150.67
DOGE/USDT
NYSE Arca announced that it has approved the Bitwise Dogecoin ETF, which will be launched soon.
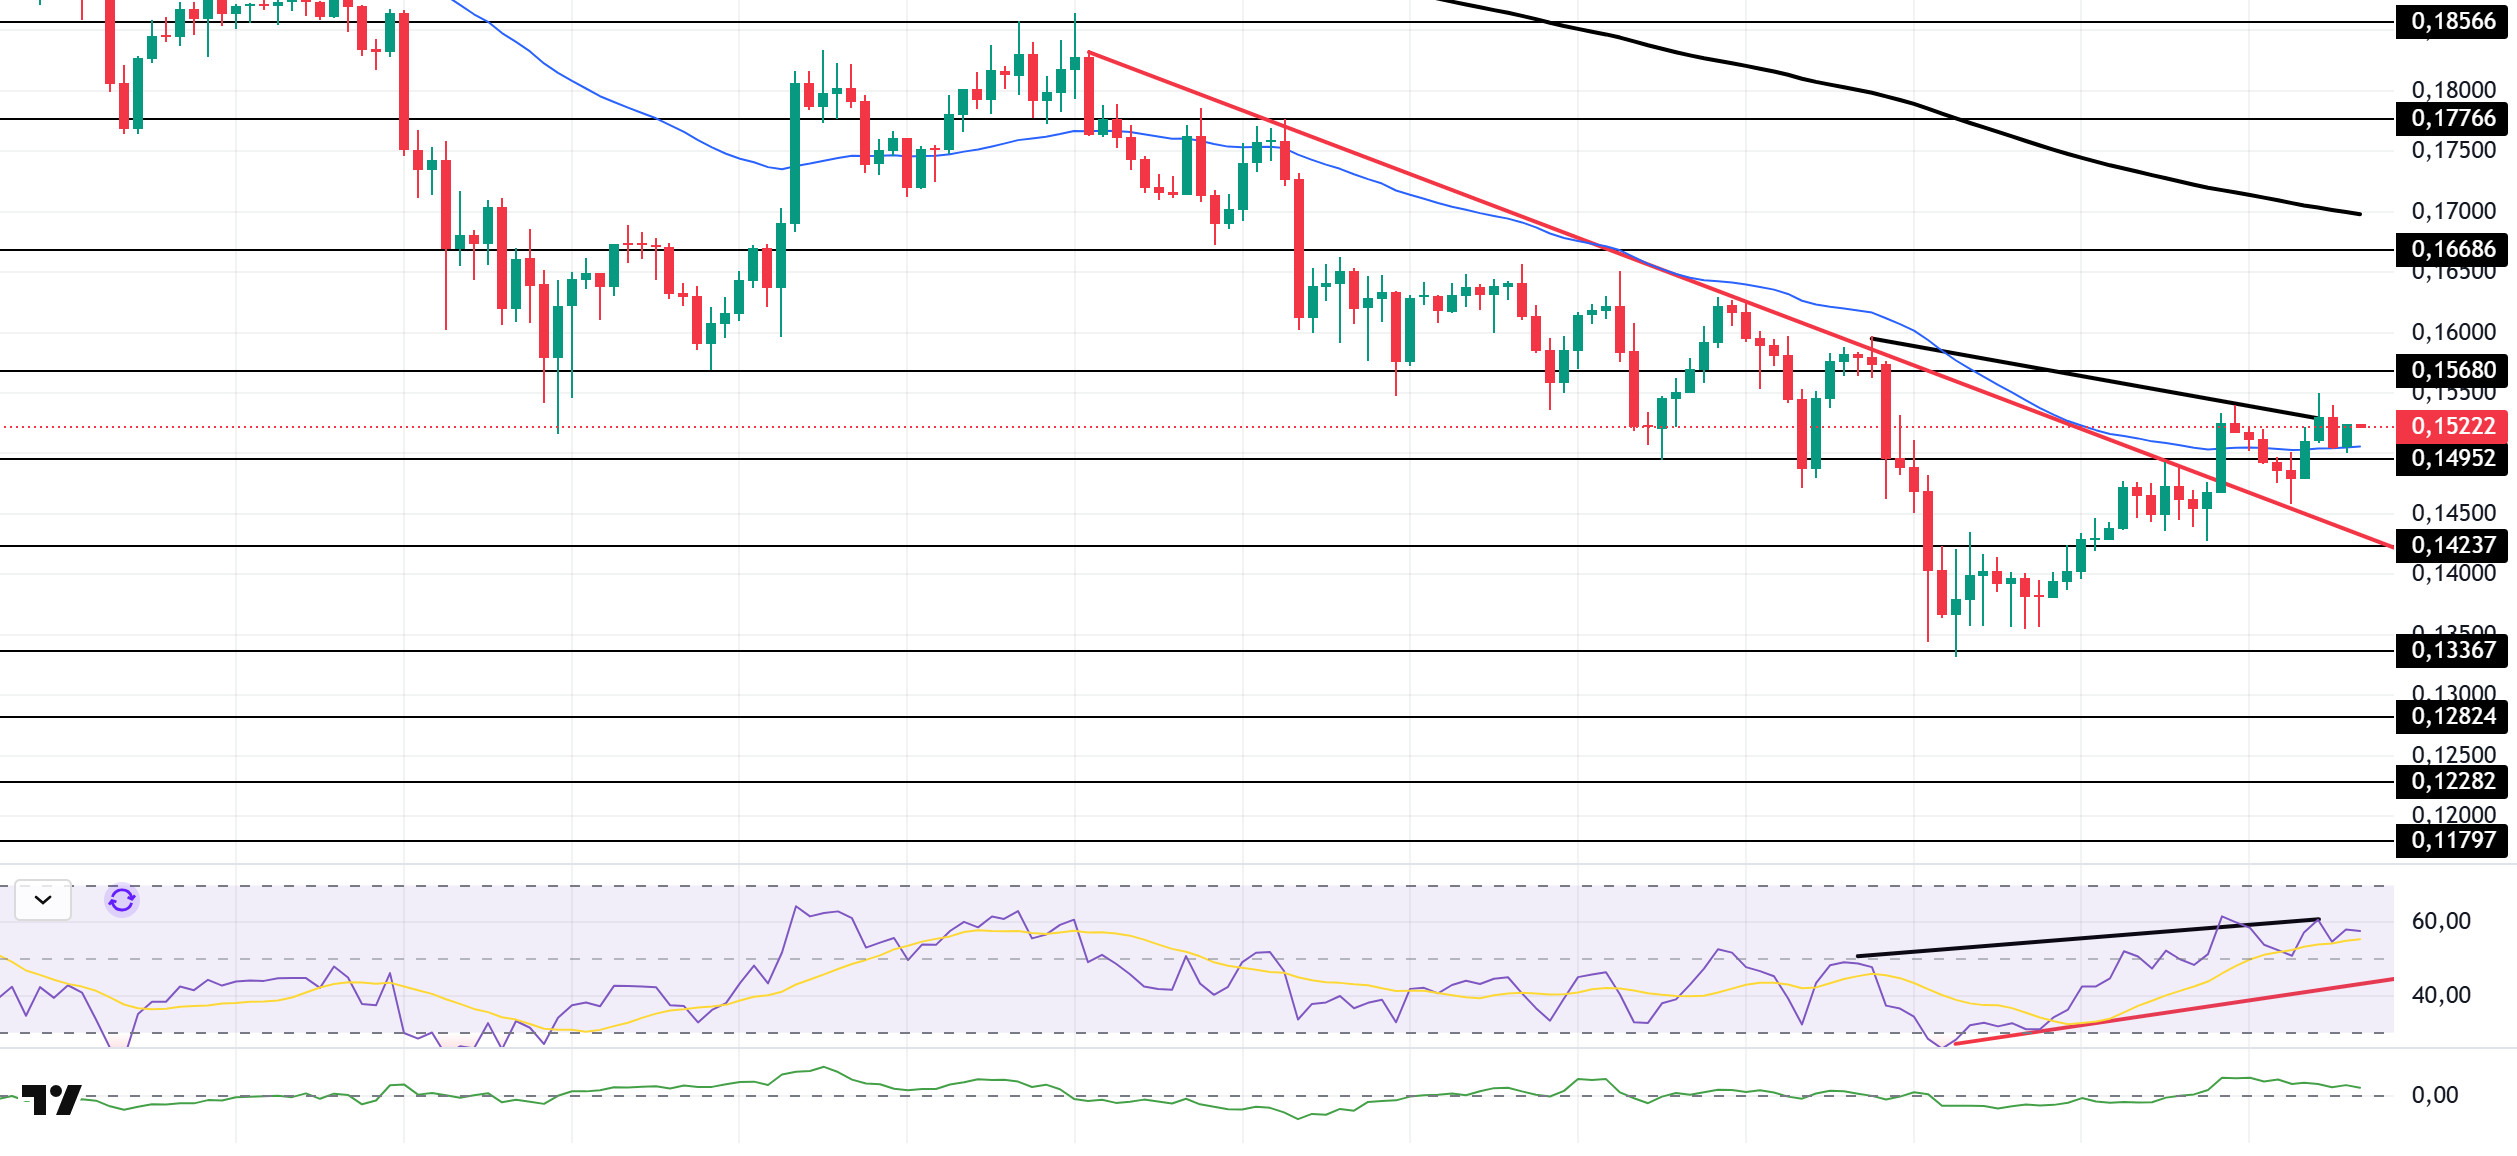
The DOGE price has been moving sideways. The asset broke above the downward trend that began on November 11 with a strong candle and has remained in the upper region of this trend. The price, which also broke above the 50 EMA (Blue Line) moving average, is currently testing this moving average as support. The asset, which continues to trade below the 50 EMA moving average, may test the 200 EMA (Black Line) moving average as resistance if it experiences an uptrend. In the event of a pullback, it may test the downward trend as support.
On the 4-hour chart, the 50 EMA (Exponential Moving Average – Blue Line) remained below the 200 EMA (Black Line). This indicates that a medium-term downtrend may begin. The price being between the two moving averages indicates that the price is in a decision phase in the short term. On the other hand, the large difference between the two moving averages increases the potential for the asset to move sideways or upward. Chaikin Money Flow (CMF-20) remained in positive territory. Additionally, a decrease in cash inflows could push the CMF into negative territory. The Relative Strength Index (RSI-14) remained in positive territory. It also continued to trade in the upper region of the upward trend that began on November 21. This increased buying pressure. However, negative divergence should be monitored. In the event of an uptrend driven by political developments, macroeconomic data, or positive news flow in the DOGE ecosystem, the $0.16686 level stands out as a strong resistance zone. Conversely, in the event of negative news flow, the $0.13367 level could be triggered. A decline to these levels could increase momentum and initiate a new wave of growth.
Supports: 0.14952 – 0.14237 – 0.13367
Resistances: 0.15680 – 0.16686 – 0.17766
SHIB/USDT
Security warnings are prominent in the Shiba Inu ecosystem. Mazrael, a well-known figure in the community, points out that scammers are taking advantage of the popularity of the Shiba Inu brand to increase their attempts to empty wallets. He emphasizes that fake platforms and products targeting structures such as ShibDAO and ShibIO, which he highlights as having been delivered to the community, are being circulated, thereby targeting both brand perception and users’ assets. Mazrael calls on the SHIB community to be extra cautious about unofficial links and projects, to defend the rights and delivered products belonging to the Shiba Inu ecosystem, and to fight against fraud attempts by clearly exposing any suspicious initiatives they encounter.
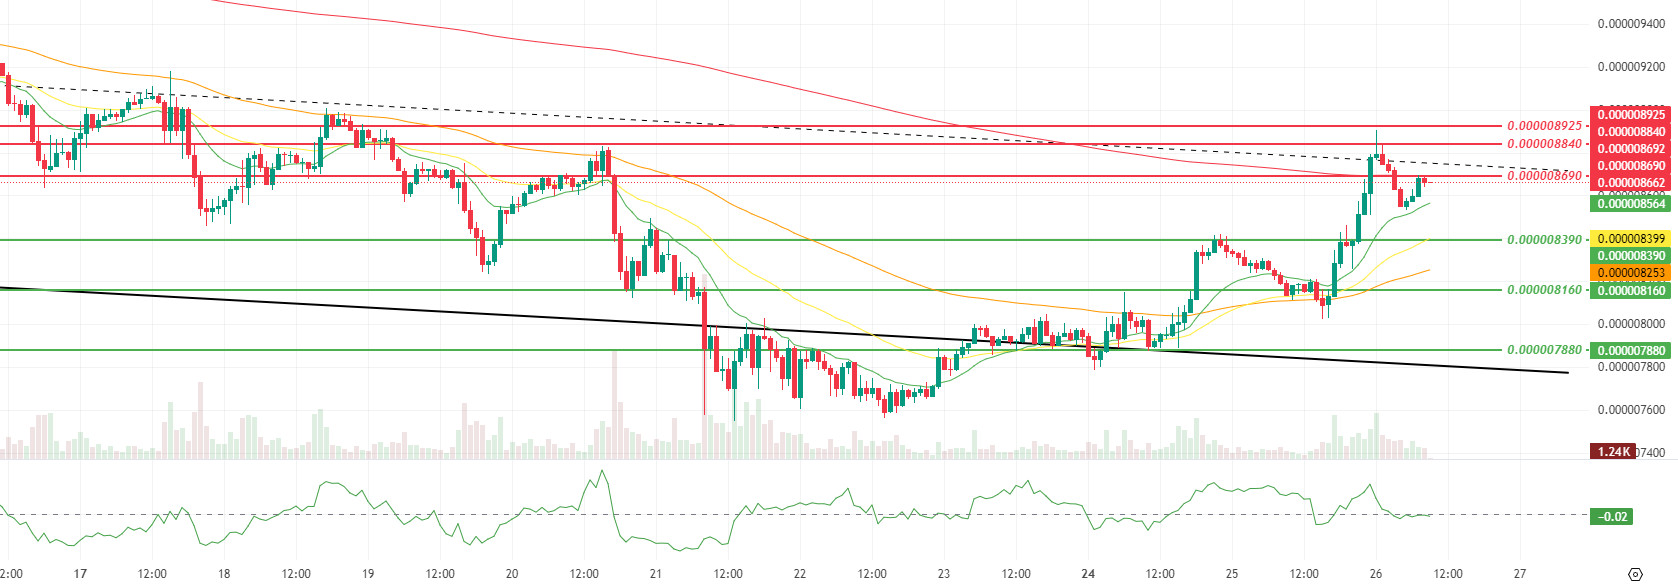
Looking at the technical chart, we see that the balanced digestion structure highlighted in the previous analysis is gradually evolving into a more dynamic reaction structure. The increase in momentum, volume, and volatility suggests that the reaction movement is gaining momentum again and that buyers are shifting to a less aggressive but more eager position. The Chaikin Money Flow (CMF) indicator’s return to neutral territory signals that the capital inflows accompanying the recent upward attempt are beginning to emerge from a weakening phase, while revealing that structural liquidity support is continuing to be maintained, at least for now.
After the 9-period Smoothed Moving Average (SMMA) and the 21-period SMMA crossed above the 50-period SMMA some time ago, creating a positive crossover in favor of the short-term trend, the price holding above all three averages and rising directly to the 200-period SMMA indicates that the reaction structure has reached a critical threshold. Under this outlook, the region passing through $0.000008095, which was monitored as an intermediate defense line in the previous analysis, has given way to a new support band passing through $0.000008390 and $0.000008160. If the price manages to stay above this band, the resistances at $0.000008690, $0.000008840, and $0.000008925 will emerge as the main target zone in the short term. Conversely, if the price falls below the support level at $0.000008160 and retreats towards the level at $0.000007880, this recent upward attempt around the SMMA 200 will be reinterpreted as a limited respite within the main medium-term downtrend. However, in a scenario where the price remains above the SMMA 200 period and the CMF indicator expands from the neutral zone towards the positive ( ) area, the possibility of a more structured and gradual recovery within the falling channel will gain strength. (SMMA9: Green Line, SMMA21: Yellow Line, SMMA50: Orange Line, SMMA 200: Red Line)
Supports: 0.000008390 – 0.000008160 – 0.000007880
Resistances: 0.000008690 – 0.000008840 – 0.000008925
Legal Notice
The investment information, comments, and recommendations contained herein do not constitute investment advice. Investment advisory services are provided individually by authorized institutions taking into account the risk and return preferences of individuals. The comments and recommendations contained herein are of a general nature. These recommendations may not be suitable for your financial situation and risk and return preferences. Therefore, making an investment decision based solely on the information contained herein may not produce results in line with your expectations.

