
Technical Analysis
BTC/USDT
As the possibility of an interest rate cut in December rose significantly, Daly and Waller’s dovish messages highlighted the argument of limiting risks to the fragile labor market and tariff-driven inflation. Although the phone call between US and Chinese leaders on the geopolitical and trade front showed that communication channels remained open, the divergence in the text regarding Taiwan kept regional risk premiums alive; Trump’s signal of a visit to Beijing in April and the planned Takaichi meeting between Japan and the US strengthened the closely watched diplomatic traffic. On the crypto front, Strategy’s six-week buying streak came to an end, which was noteworthy.
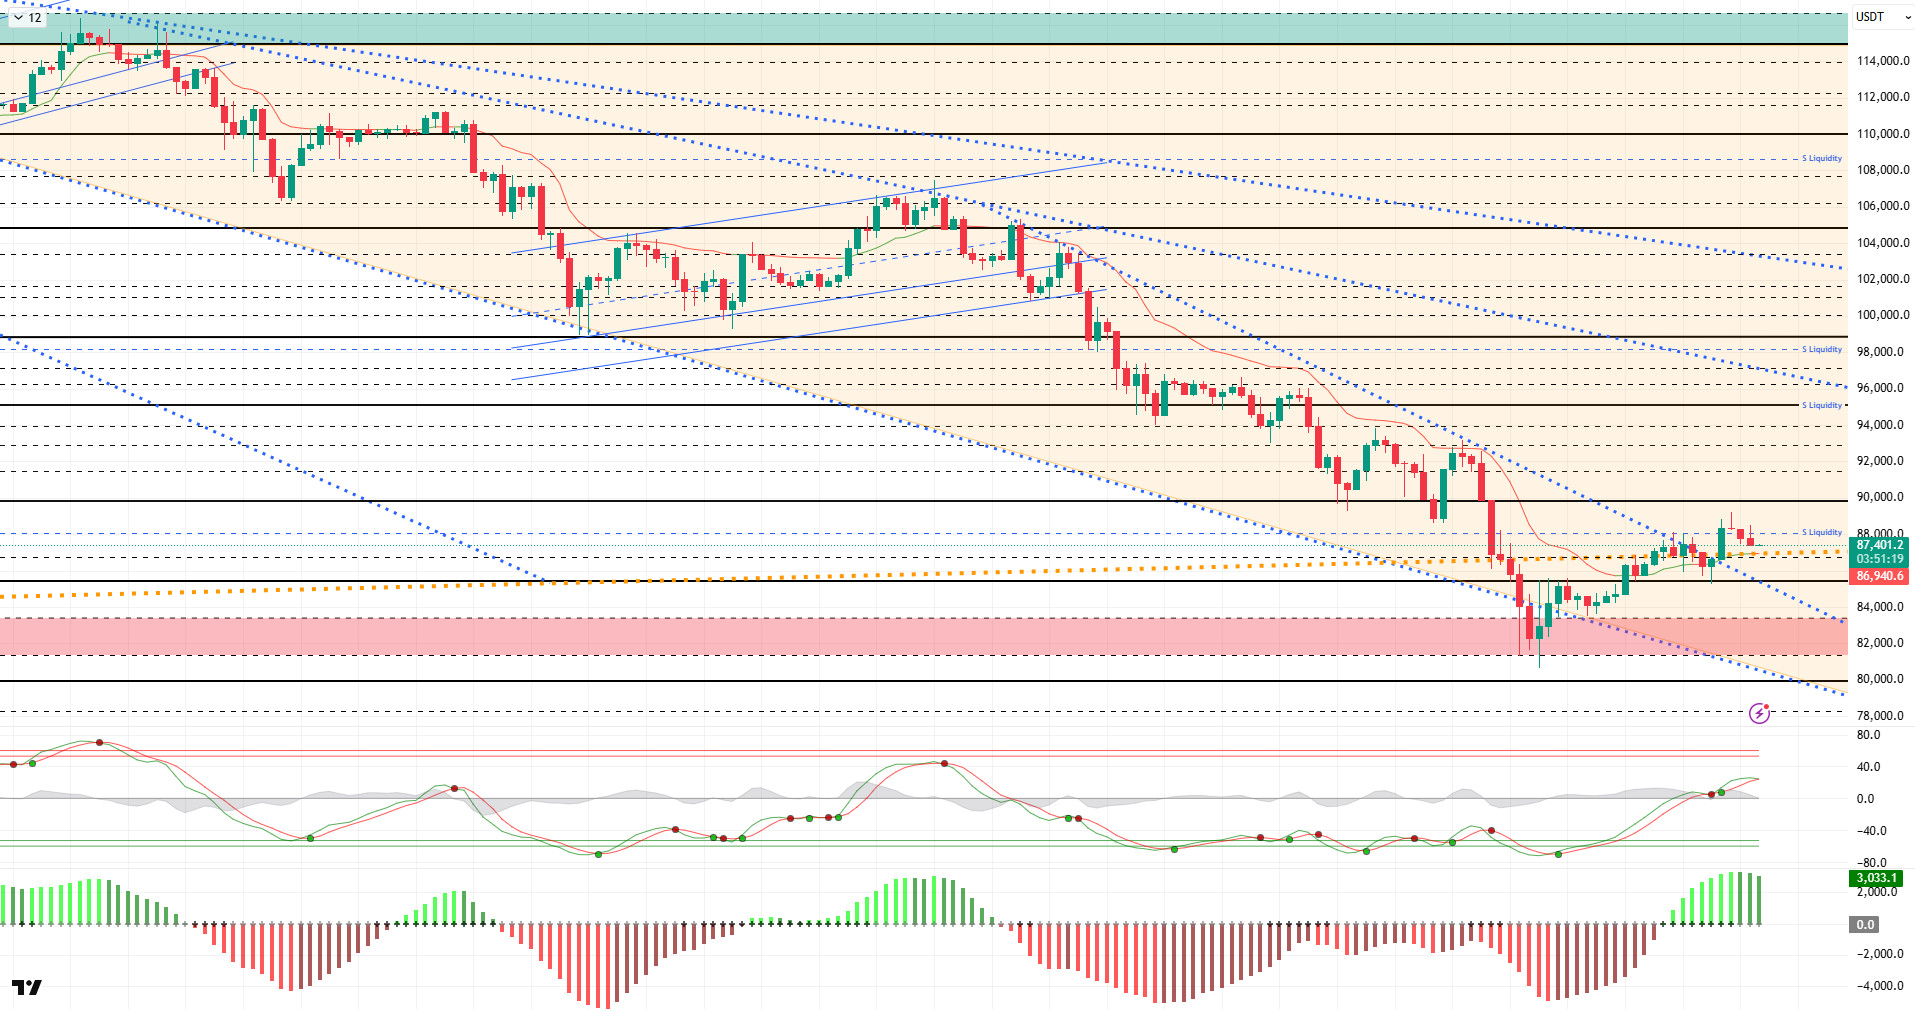
From a technical perspective, BTC broke back above the major uptrend line after carrying the rebound following the continuous decline to the 89,000 level. The price breaking above the first falling trend line marked by dotted lines on the chart and consolidating within this zone is critically important for the upward momentum to regain strength. Following this consolidation, the next downward trend line can be monitored as a target and tracking point, along with a potential upward channel. At the time of writing, the price remains above the 87,000 level. If it can use the major trend as support, the groundwork for the next jump can be laid.
Technical indicators show that the Wave Trend (WT) oscillator has reversed a short-term sell signal into a buy signal at the channel’s mid-band. The Squeeze Momentum (SM) indicator’s histogram is weakening after gaining momentum within the positive zone. The Kaufman Moving Average (KAMA) is currently at $86,900, positioned below the price.
According to liquidation data, investors are repositioning themselves on the buy side with the latest rise, with 87,000 emerging as the short-term congestion level and 85,000 seen as another level. The partial short-term sell level accumulated again at this point after the liquidation at the 89,000 level.
In summary, BTC is attempting to sustain its rebound, supported by expectations of interest rate cuts following its relentless decline. However, Strategy’s pause in BTC purchases and low-volume inflows into ETFs indicate that the “Fear” sentiment in the market has yet to dissipate. Technically, the price is attempting to build upward momentum after rebounding from the 80,500 support zone. Liquidity data indicates that target zones are regaining importance and that the market is entering a partial rebalancing process. For the rally to gain a solid footing in the coming period, closes above the 87,000 level, where the major uptrend line passes, will be critical. Should demand increase again and potential catalysts come into play, the 90,000 level could be monitored as the main reference zone. Conversely, if selling pressure intensifies, the 85,000 level will emerge as the new reference and liquidity zone.
Supports: 86,700 – 85,000 – 83,300
Resistances: 88,300 – 90,000 – 91,500
ETH/USDT
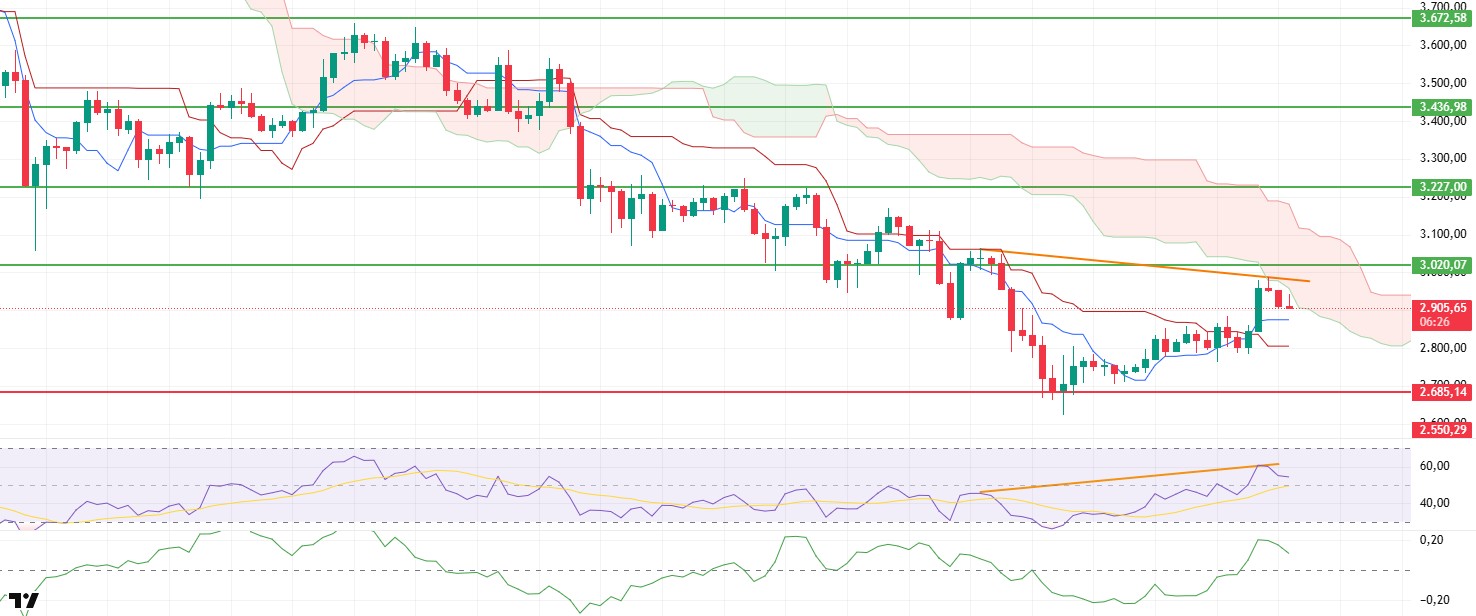
The ETH price maintained its upward momentum as expected yesterday, aided by increased liquidity inflows, climbing to $2,987 during the day. This area formed a strong technical resistance as it coincided with the upper band of the cloud, causing the price to react sharply from this point. With the sales that kicked in during the morning hours, the price retreated to the $2,905 level. While buyers still appear active upon examining the overall structure, it can be said that the upward momentum has begun to fade and the market is shifting towards a more balanced structure.
The Chaikin Money Flow (CMF) indicator’s strong jump into positive territory was one of the most important factors supporting the rise. However, following this sharp move, a slight pullback is observed in the indicator. This decline indicates that liquidity inflows have slowed but not completely disappeared. CVD data presents a more striking picture. The sharp decline on the spot side continues, and it is understood that the main factor keeping the market afloat is buying on the futures side. This structure reveals that despite the upward movement in price, the foundation is weak and spot demand is not sufficiently strong.
The Relative Strength Index (RSI) indicator remains above the 50 level, continuing to move in positive territory. While this suggests that momentum is being maintained, the negative divergence in the RSI immediately catches the eye. This pattern could serve as an early warning that selling pressure may increase again in the short term, as prices did not rise to the same extent when the indicator peaked. Therefore, even if there is a new attempt at an uptrend, the likelihood of seeing intermediate corrections remains high.
When examining the Ichimoku indicator, it is noteworthy that the price continues to remain above the Tenkan and Kijun levels. The Tenkan line cutting above the Kijun stands out as a signal that strengthens the short-term positive outlook. However, despite all these positive signals, the fact that the price is still below the kumo cloud indicates that the trend has not yet turned positive in the big picture. Technically, it is not possible to speak of a strong trend reversal until the price settles above the cloud.
Looking at the overall picture, it is quite likely that ETH will retreat to the Tenkan support level of $2,875 during the day. If this level is maintained, the price can be expected to regain strength and start an upward movement. However, if the $2,875 support is broken, selling pressure may accelerate and a deeper pullback may occur. In upward movements, the kumo cloud resistance at the $2,950 level is critical. If this level is exceeded, ETH’s rise towards the main resistance at the $3,020 level may accelerate.
Below the Form
Supports: 2,685 – 2,550 – 2,331
Resistances: 3,020 – 3,227 – 3,436
XRP/USDT
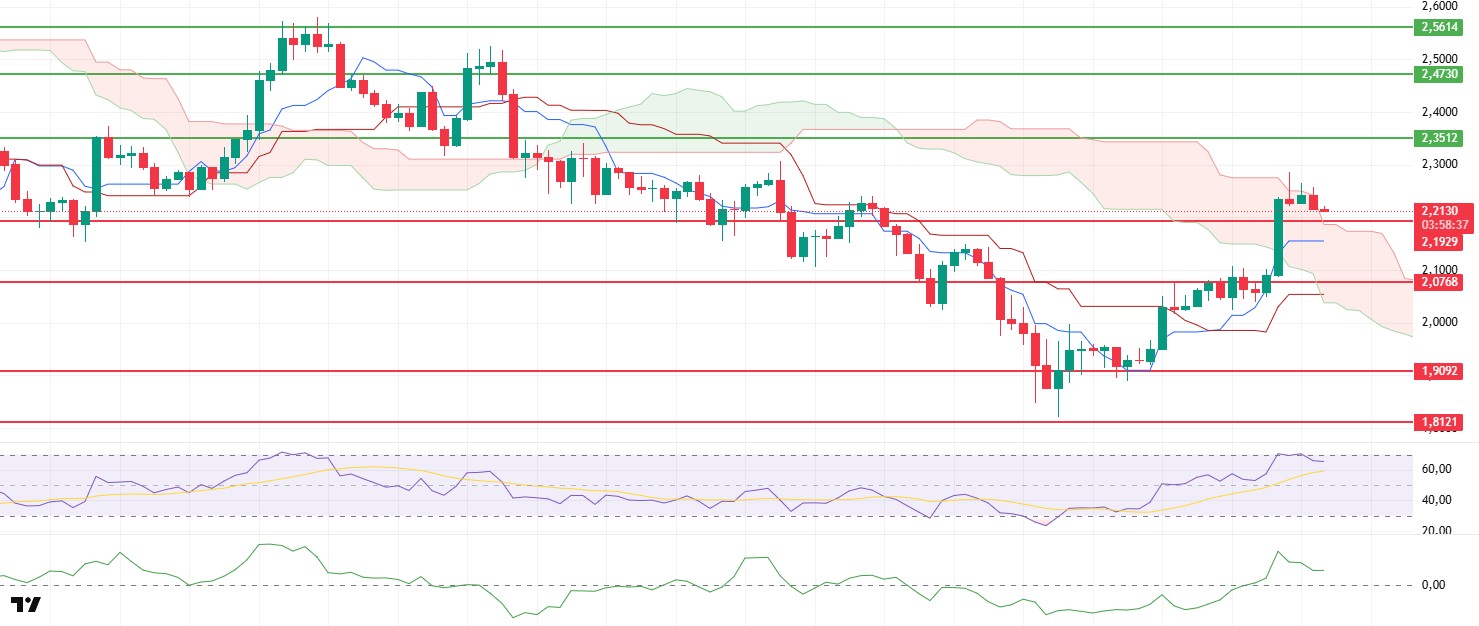
The XRP price gained strong momentum after surpassing the $2.07 level yesterday evening, leaving the $2.19 resistance behind and showing a sharp rise to the upper band of the cloud. At this point, the price has formed a horizontal pattern with the reaction that followed, and it is currently attempting to break through the upper band of the cloud. In the short term, buyers are aggressively entering the market, but the pace of the rise appears to be slowing.
The Chaikin Money Flow (CMF) indicator began to ease after experiencing a strong surge in positive territory. This pullback indicates that liquidity outflows have increased again and that the upward movement has begun to weaken somewhat. This unwinding in the CMF signals that buyers’ dominance in the market has weakened somewhat.
The Relative Strength Index (RSI) indicator showed a slight pullback after reaching the overbought zone. This pattern indicates that short-term selling pressure is beginning to build on the price and that the risk of an intraday correction is increasing. Although momentum remains strong, the pullback in the RSI signals that the price movement is beginning to tire.
The Ichimoku indicator generally presents a more positive picture. The price trading above the Tenkan and Kijun levels and reaching the upper band of the kumo cloud indicates that the short-term trend is strengthening. Although the current outlook suggests that the upward structure is continuing, it is too early to speak of a permanent trend change without the price fully breaking through the cloud.
In the overall assessment, with signs of weakness on the CMF and RSI, it seems likely that the price will ease somewhat during the day and test the support level at $2.19. If this support is lost, the possibility of a deeper pullback may increase. On the other hand, if the price manages to break through the upper band of the cloud at the $2.25 level, the current negative signals will weaken and upward attacks are more likely to continue.
Supports: 2.1929 – 2.0768 – 1.9092
Resistances: 2.3512 – 2.4730 – 2.5614
SOL/USDT
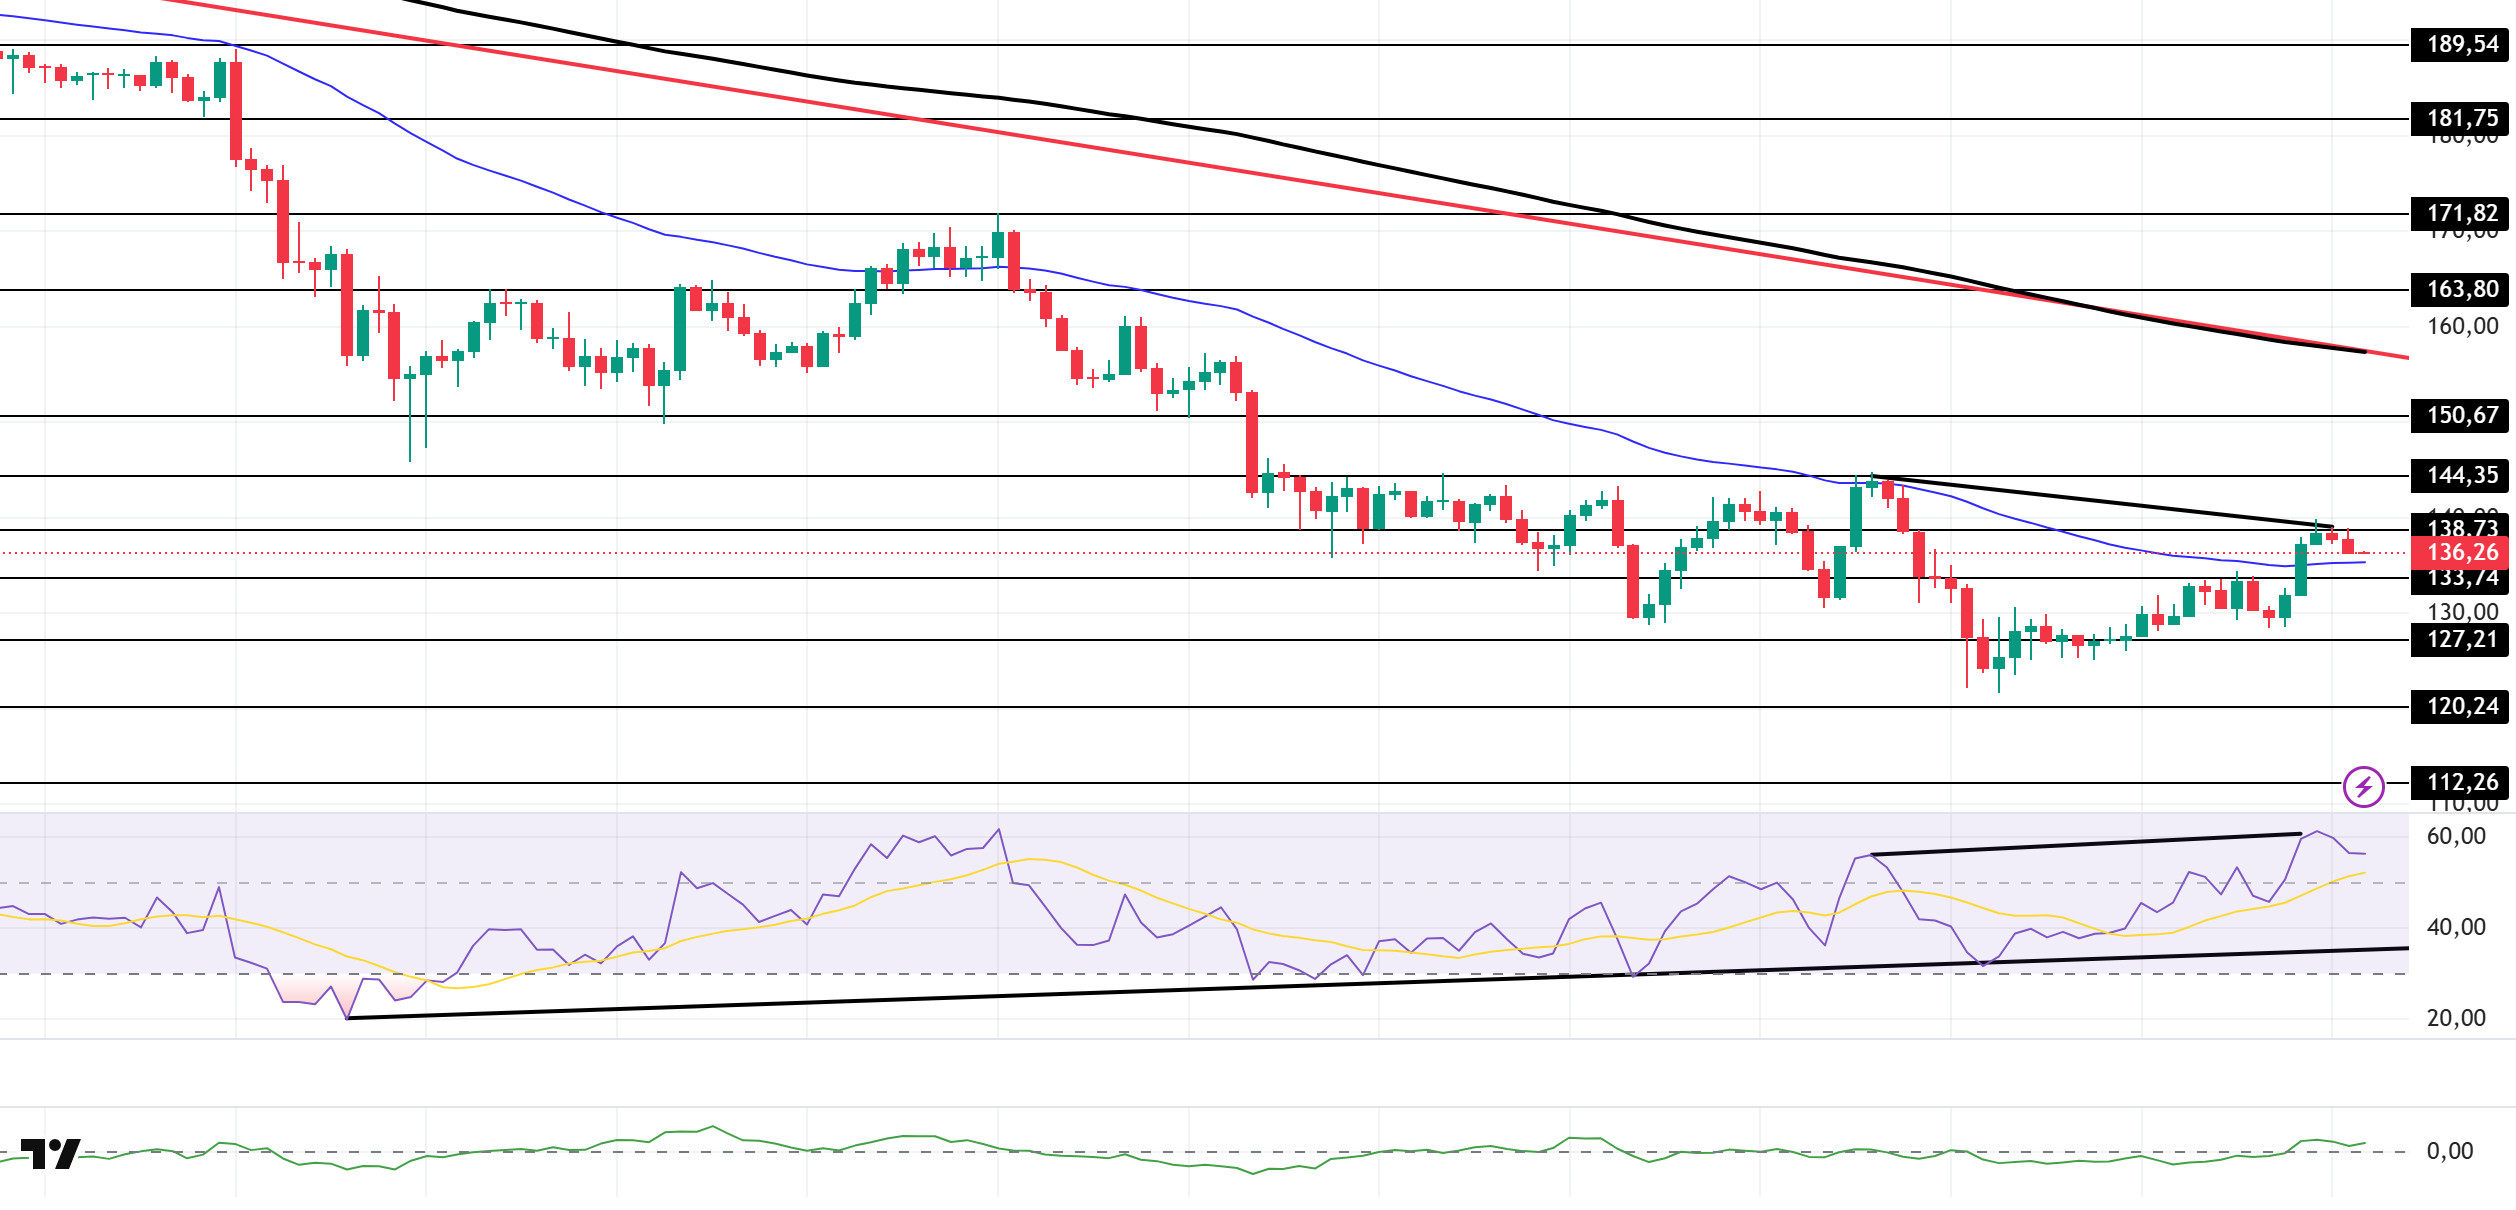
SOL experienced an upward movement. The asset remained in the lower region of the downward trend that began on October 6. It broke above the strong resistance level of $133.74 and the 50 EMA (Blue Line) moving average with a strong bullish candle. Currently testing the $138.73 level as resistance, the price could test the $150.67 level if the uptrend continues. If a pullback begins, the 50 EMA moving average could be triggered as support.
On the 4-hour chart, it remained below the 50 EMA (Exponential Moving Average – Blue Line) and 200 EMA (Black Line). This indicates that it may be in a downtrend in the medium term. At the same time, the price being between the two moving averages shows us that the asset is in a decision phase in the short term. The Chaikin Money Flow (CMF-20) rose to positive territory and remained there. However, the balance of money inflows and outflows may continue to keep the CMF in positive territory. The Relative Strength Index (RSI-14) moved to the upper level of positive territory. At the same time, it remained above the rising line that began on November 4. On the other hand, there is a negative divergence. This indicates that selling pressure may occur. If there is an increase due to macroeconomic data or positive news related to the Solana ecosystem, the $150.67 level stands out as a strong resistance point. If this level is broken upwards, the increase is expected to continue. If there are pullbacks due to developments in the opposite direction or profit-taking, the $120.24 level could be tested. A decline to these support levels could increase buying momentum, presenting a potential upside opportunity.
Supports: 133.74 – 127.21 – 120.24
Resistances: 138.73 – 144.35 – 150.67
DOGE/USDT
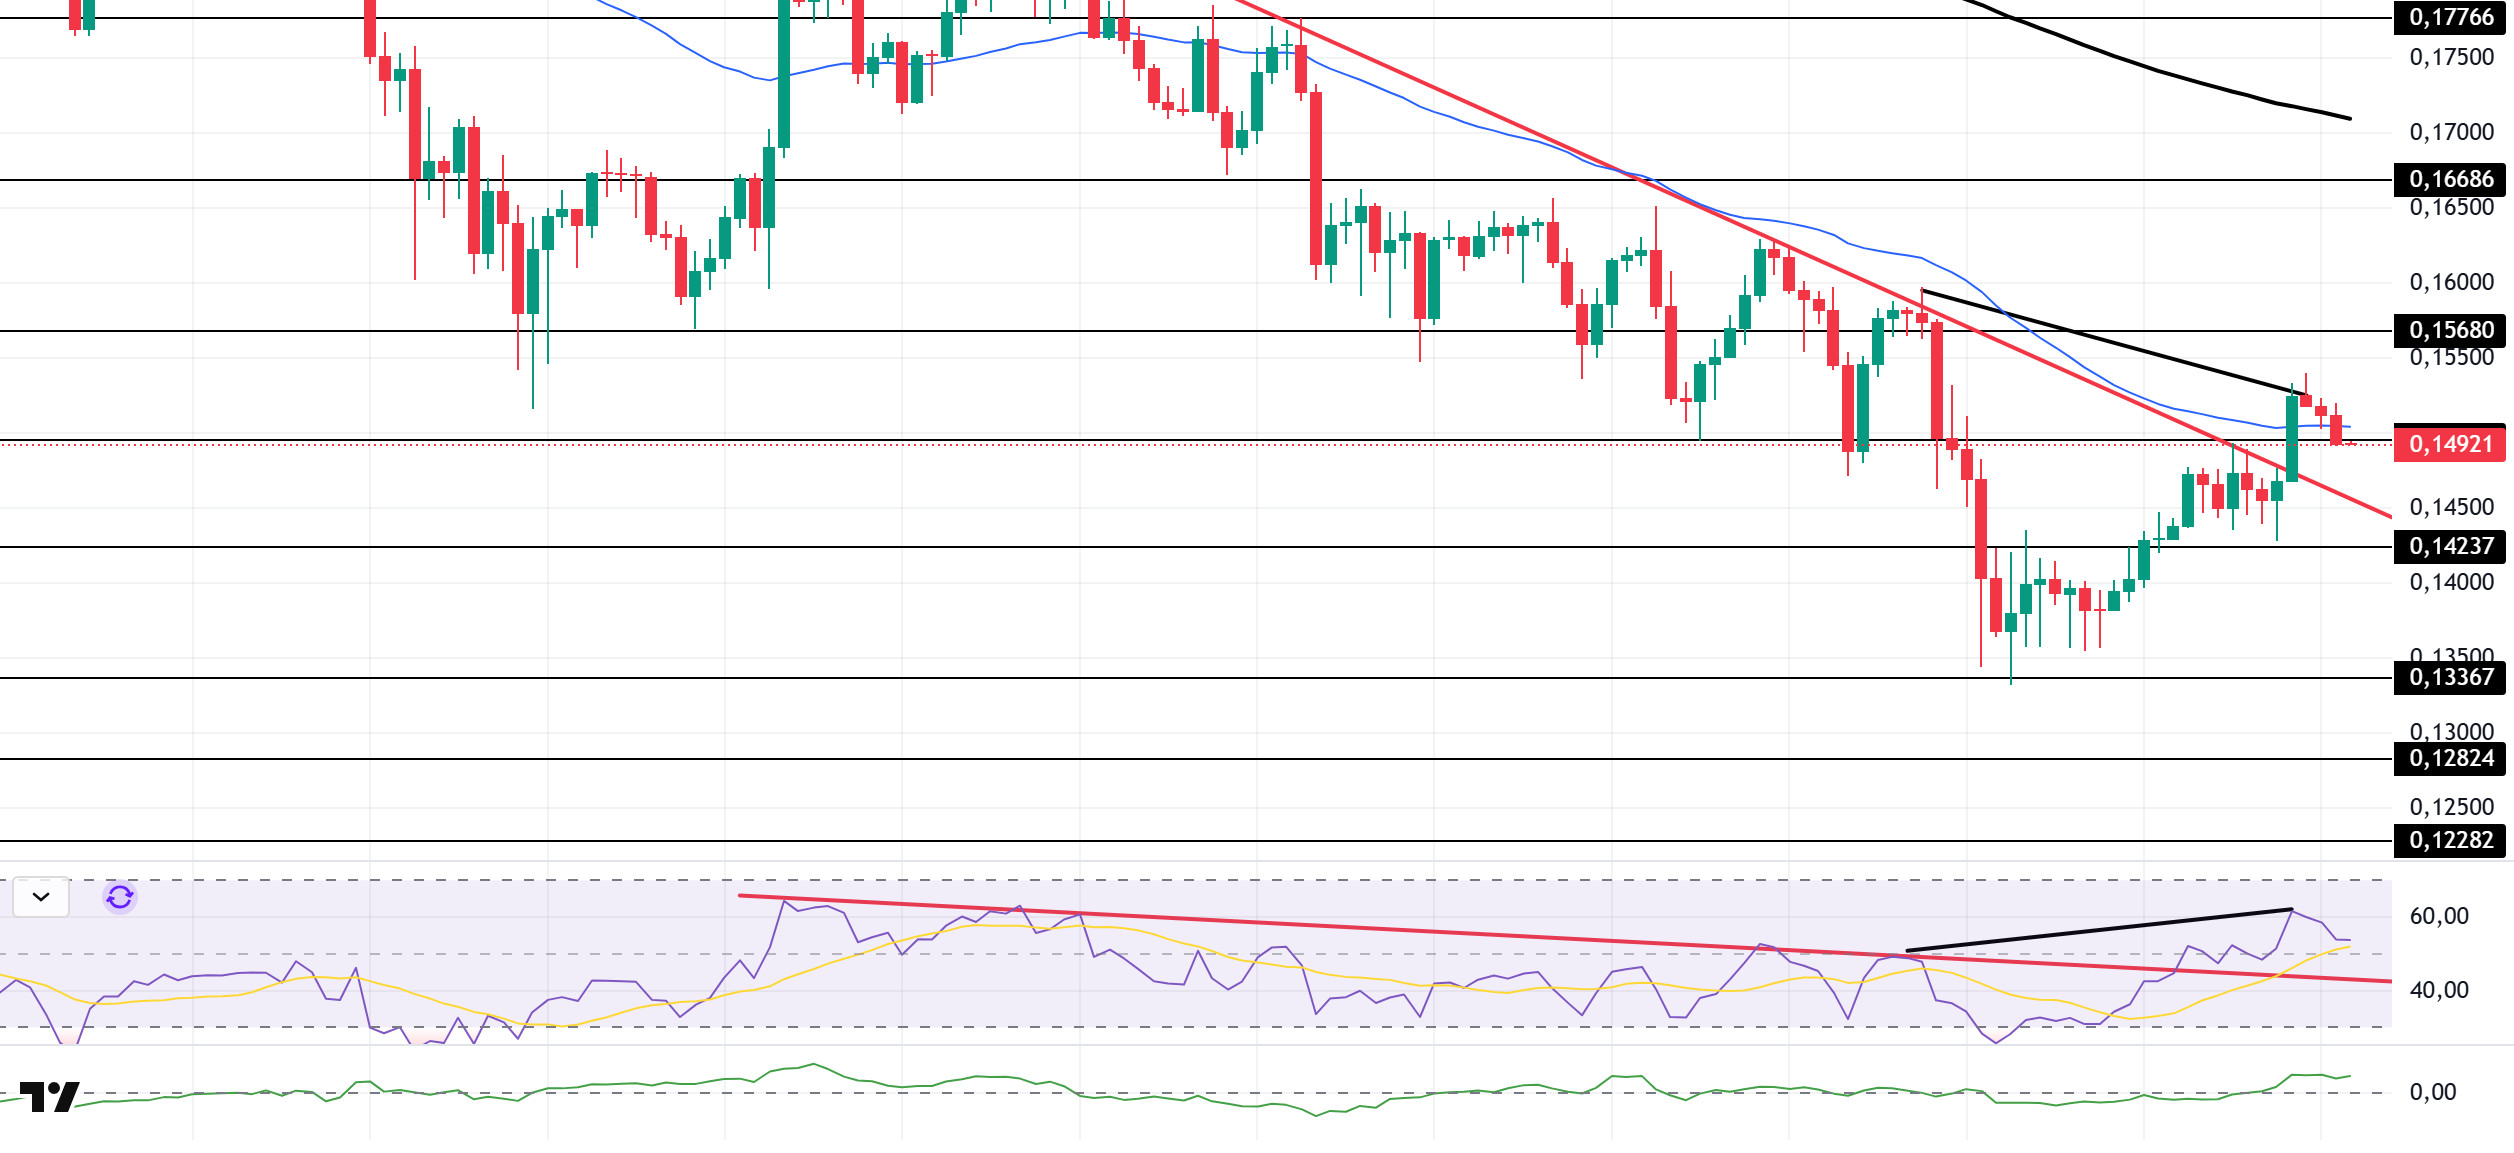
The DOGE price experienced an uptrend. The asset broke above the downtrend that began on November 11 with a strong candle and continued to trade above this trend. The price, which also broke above the 50 EMA (Blue Line) moving average, tested this moving average as support at the moment but experienced a pullback after failing to hold above the moving average. Priced below the 50 EMA moving average, the asset could test the 200 EMA (Black Line) moving average as resistance if the uptrend continues. If it experiences a pullback, it could test the downtrend as support.
On the 4-hour chart, the 50 EMA (Exponential Moving Average – Blue Line) remained below the 200 EMA (Black Line). This indicates that a downtrend may begin in the medium term. The price being between the two moving averages indicates that the price is in a decision-making phase in the short term. On the other hand, the large difference between the two moving averages increases the potential for the asset to experience a horizontal or upward movement. Chaikin Money Flow (CMF-20) has moved to a positive level. Additionally, balanced cash inflows may keep the CMF in positive territory. The Relative Strength Index (RSI-14) remained in positive territory. At the same time, it continued to be in the upper region of the downward trend that began on November 10. This increased buying pressure. However, negative divergence should be monitored. In the event of an uptrend driven by political developments, macroeconomic data, or positive news flow in the DOGE ecosystem, the $0.16686 level stands out as a strong resistance zone. Conversely, in the event of negative news flow, the $0.13367 level could be triggered. A decline to these levels could increase momentum and initiate a new wave of growth.
Supports: 0.14952 – 0.14237 – 0.13367
Resistances: 0.15680 – 0.16686 – 0.17766
SHIB/USDT
The Shiba Inu team made a critical announcement aimed at reassuring the community during a period of peak fear in the crypto markets. The message shared on the project’s official X account emphasizes that SHIB is not just a meme token limited to humor and community culture, and states that the ecosystem continues to grow with real use cases. During the same period, the Crypto Market Fear and Greed Index stood at 12 out of 100, indicating that investors were generally in a state of extreme fear, with liquidity weakening, particularly on the altcoin side. However, on-chain data does not paint an entirely negative picture for Shiba Inu. Over the past 24 hours, the SHIB burn rate increased by 1087%, and approximately 15.9 million tokens were permanently removed from circulation. There is also a noticeable revival in the project’s Layer 2 network, Shibarium. The daily transaction count, which was around 1,850 on November 18, rose to 3,960 as of November 23, recording a 114% increase in five days. This activity on the network coincides with a period where prices are gradually stabilizing after a sharp pullback, although the recovery remains fragile.
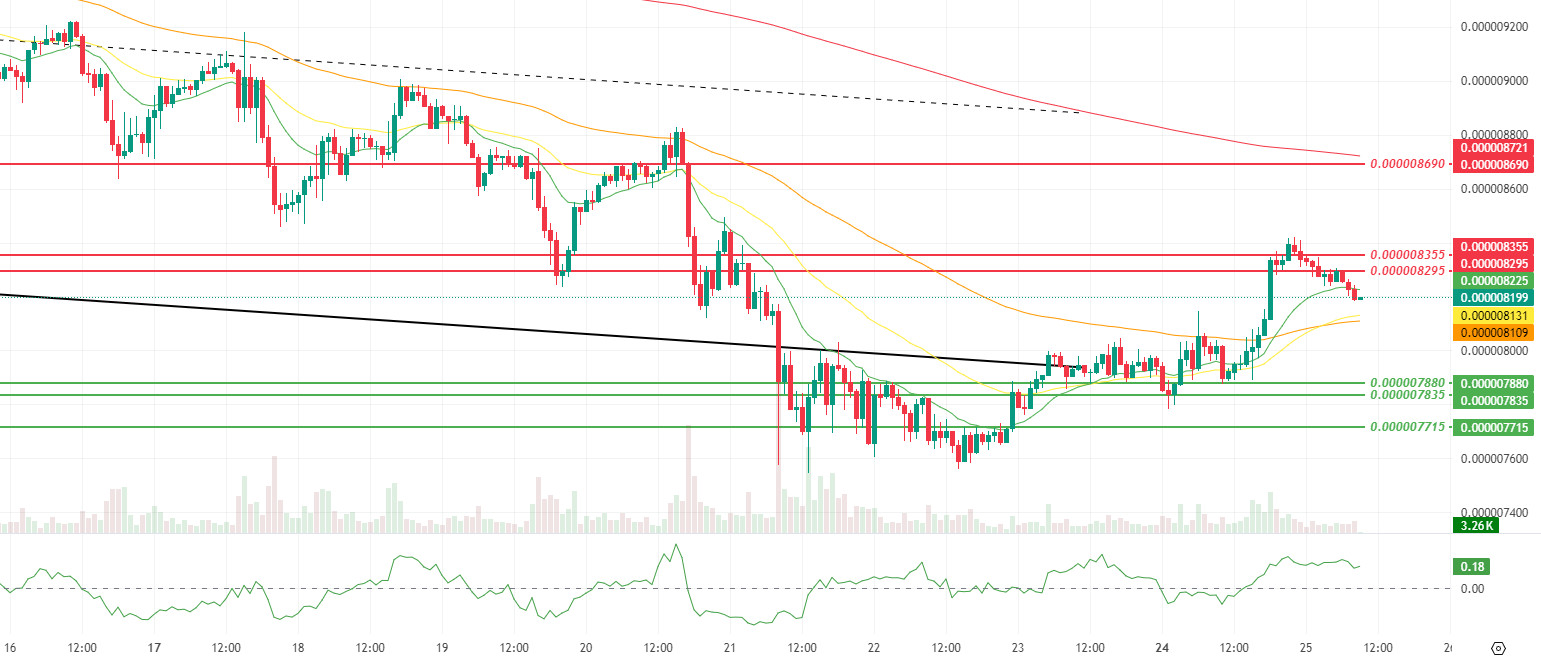
Looking at the technical chart, it appears that the consolidation process in the bottom region highlighted in the previous analysis has now evolved into a more balanced structure. Although there has been a slight pullback in momentum and volatility, the increase in volume indicates that the movement has continued with a more selective but supported demand structure rather than fading away completely. The price managing to rise above the 9, 21, and 50-period Smoothed Moving Averages (SMMA) indicates that short-term buyers have returned to the field with greater determination and that the reaction attempt within the falling channel has gained a more meaningful technical footing. The Chaikin Money Flow (CMF) indicator moving into positive territory indicates that capital inflows have strengthened compared to the previous period and that the current upward attempt is not just a short-term short squeeze, but also finds support on the spot and on-chain sides. However, the continued selling pressure at the intermediate resistance levels of $0.000008295 and $0.000008355 reminds us that the rebound is still being tested by a strong supply zone and that the descending channel structure has not yet been clearly broken.
Under this outlook, the levels at $0.000007880, $0.000007835, and $0.000007715 continue to serve as the main defense line within the channel, while the level at $0.000008095 to $ , on the upside, now stands out as the first short-term intermediate support threshold. If the price manages to hold above this region and the 50-period SMMA, continued increase in volume, and the Chaikin Money Flow (CMF) indicator remaining in positive territory, a gradual expansion towards the resistance levels at $0.000008295 and $0.000008355 can be expected. A break above these intermediate resistances, accompanied by increasing volume and recovering momentum, would strengthen the scenario of a more structured recovery within the descending channel and a short-term relief rally within the trend. Conversely, a renewed weakening of the CMF structure and a break below the intermediate support at $0.000008095 initially, followed by the key support at $0.000007880, the movement would slide towards the levels passing through $0.000007835 and $0.000007715. This would indicate that the current rebound attempt remains a limited respite within the medium-term main downtrend and that selling pressure is regaining momentum. (SMMA9: Green Line, SMMA21: Yellow Line, SMMA50: Orange Line, SMMA 200: Red Line)
Supports: 0.000007880 – 0.000007835 – 0.000007715
Resistances: 0.000008295 – 0.000008355 – 0.000008690
Legal Notice
The investment information, comments, and recommendations contained herein do not constitute investment advice. Investment advisory services are provided individually by authorized institutions taking into account the risk and return preferences of individuals. The comments and recommendations contained herein are of a general nature. These recommendations may not be suitable for your financial situation and risk and return preferences. Therefore, making an investment decision based solely on the information contained herein may not produce results in line with your expectations.

