
Technical Analysis
BTC/USDT
The US ending its trade investigation into Chinese-made chips and postponing new tariffs for at least 18 months signals a short-term easing of tensions between Washington and Beijing, while also signaling a shift toward more predictable ground in trade relations. In Asia, the Bank of Japan leaving the door open for interest rate hikes has brought the divergence in global monetary policy back to the forefront, while the high probability of the Fed keeping rates steady in January indicates that markets are maintaining a cautious stance.
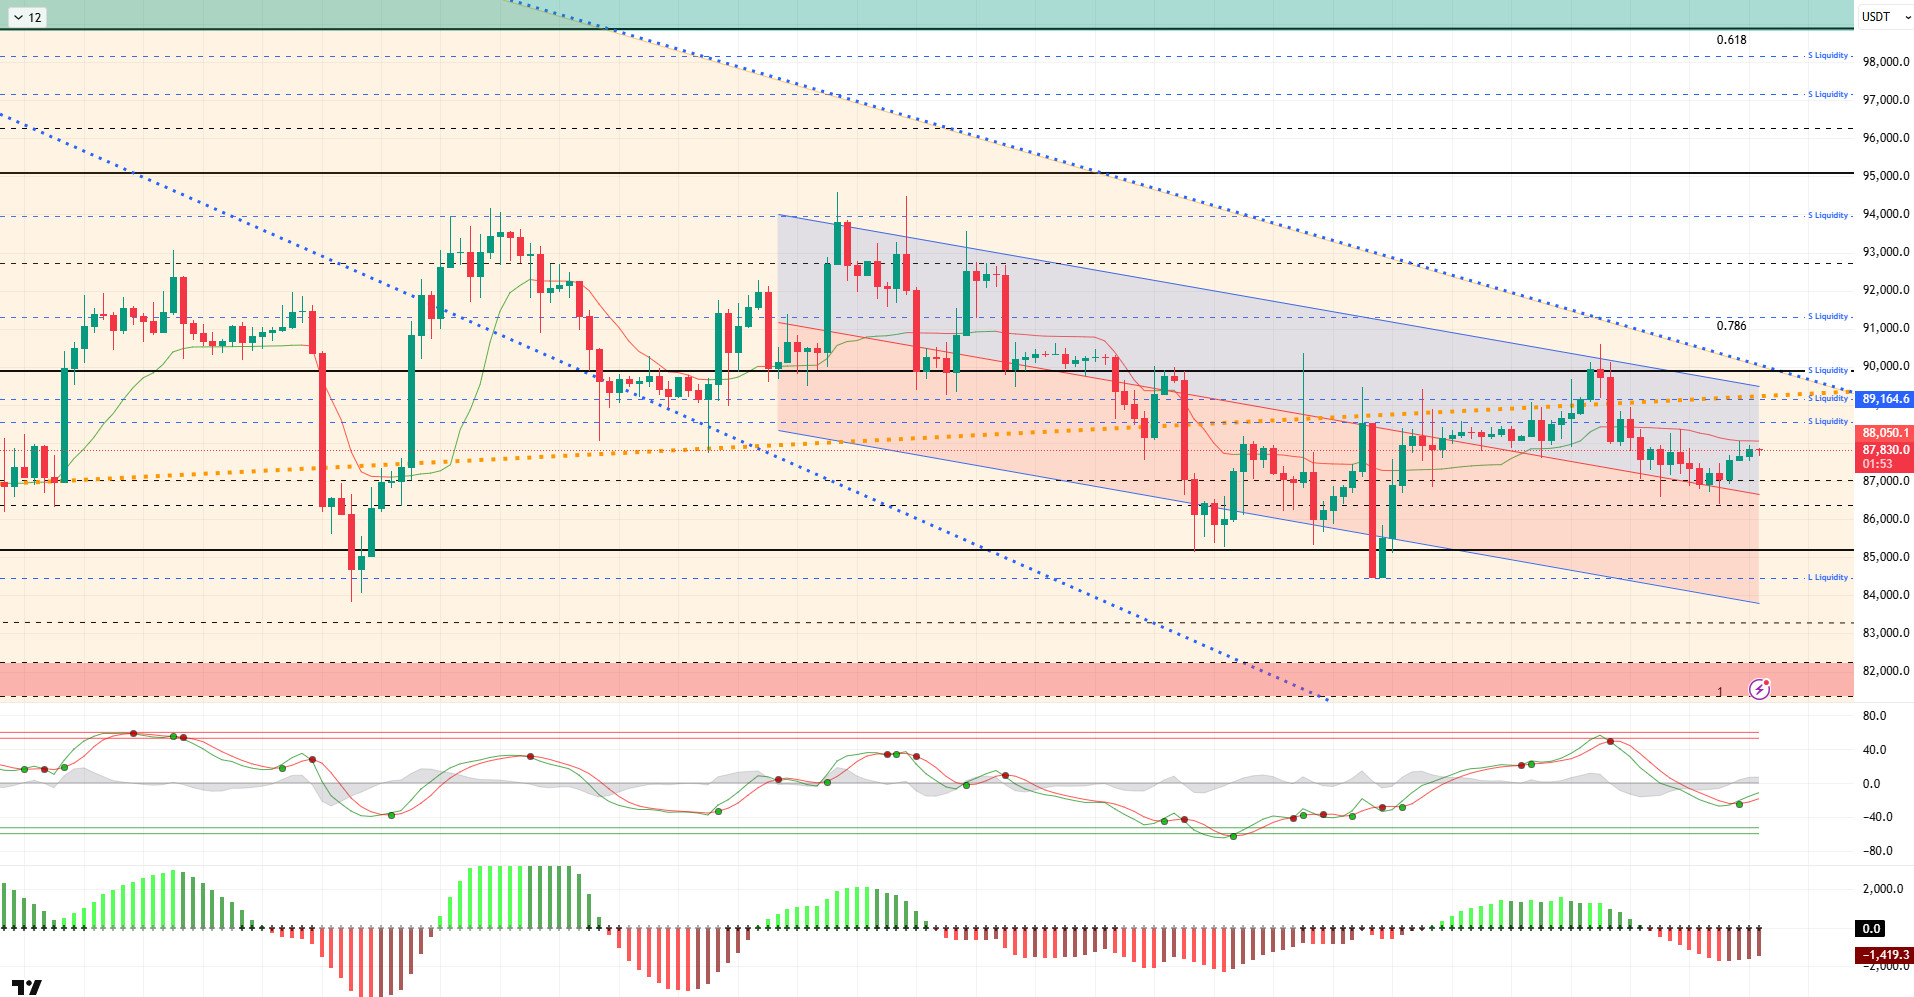
From a technical perspective, while BTC continues to follow the downward trend channel, it occasionally breaks below the channel’s midline, but the movements remain fake. In the previous analysis, the price retreated to the 86,400 level, where it formed a wick and executed a liquidity buy. BTC then reversed its direction upward again and tested the Kaufman moving average. As we mentioned earlier, as we approach the end of the year, BTC is attempting to close the year in negative territory, and a clear breakout is only possible with closes above the 90,000 reference level.
Technical indicators show that the Wave Trend (WT) oscillator ended its sell signal in the overbought zone at the channel’s middle band and has now switched to a buy signal. The histogram on the Squeeze Momentum (SM) indicator is attempting to regain momentum in negative territory. The Kaufman Moving Average (KAMA) is currently trading just above the price level at $88.049.
When examining liquidation data, an increase in volume was observed in the buy-sell tiers for BTC. Although fragmented buy tiers formed at the 84,000 and then 86,000 levels, the 86,000 tier was liquidated with the recent decline. In contrast, the sell levels recorded accumulation in the short term at 88,000–89,000, while intense accumulation continues above the 91,000 level in the broader time frame.
In summary, concrete steps taken between the US and China indicate that tariff tensions have eased in the short term. BoJ Governor Ueda, meanwhile, has raised the possibility of another interest rate hike. As we approach the end of the year, the Christmas lull continues to be noticeable in the markets. Technically, BTC continues to trade within indecisive structures, with no clear upward movement yet emerging.An examination of liquidity data reveals that areas with concentrated short-term trading are being targeted, while long-term sell orders have not yet been tested. After this stage, the 89,000 level will be monitored as a critical point where the major uptrend passes through for the price to regain momentum. Closes and price action above this level are important indicators for regaining momentum. If selling pressure deepens, 86,000 emerges as a short-term liquidity area, while the 85,000 level is an important reference point.
Supports: 86,300 – 85,000 – 84,400
Resistances: 88,000 – 89,000 – 90,000
ETH/USDT
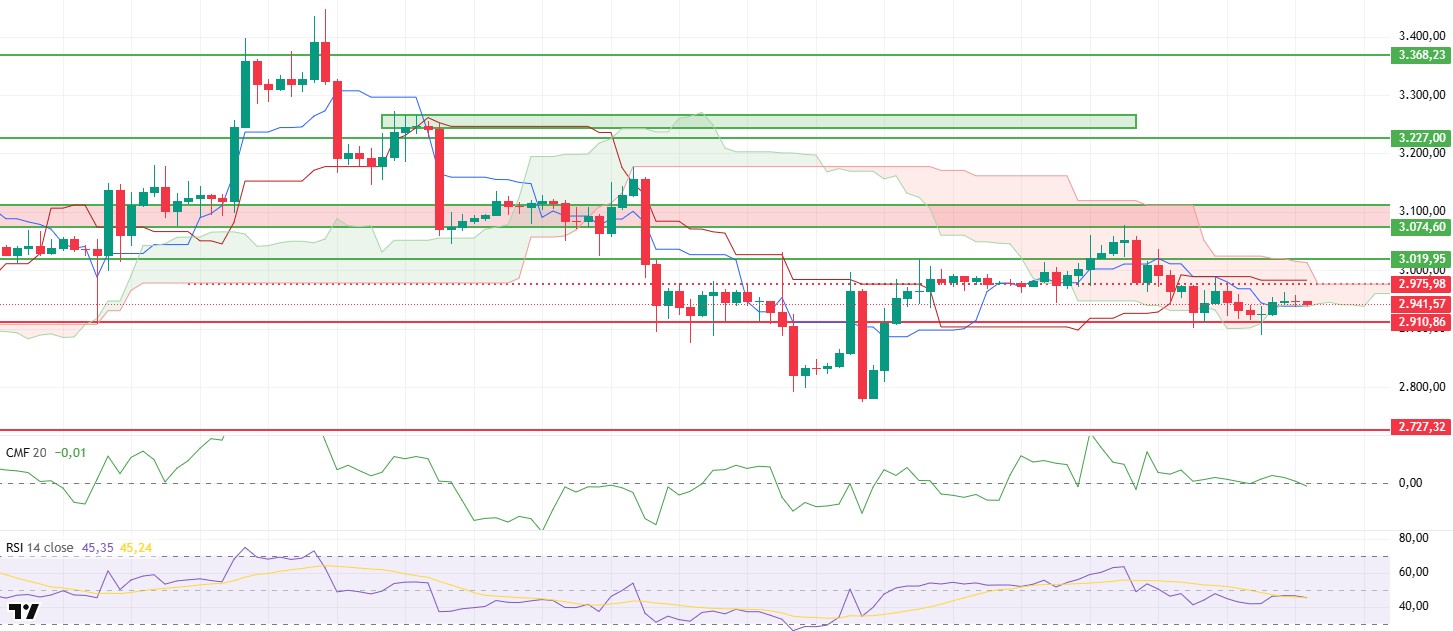
The ETH price retreated to the $2,880 level yesterday evening as selling pressure increased. Buying from this area prevented the price from falling further, and ETH returned to the kumo cloud, where it is currently trading. The fact that the downward test was not sustained indicates that sellers’ demand is limited, but buyers have not yet established a strong advantage.
There is no significant change on the liquidity front. The Chaikin Money Flow (CMF) continues to move horizontally around the zero line. This pattern indicates that there is no significant inflow of money into the market, while also showing that there has been no strong outflow. This stagnation on the liquidity side stands out as one of the main reasons for the price moving within a narrow band.
A similar picture emerges on the momentum front. The Relative Strength Index (RSI) is maintaining its horizontal trajectory, reflecting the absence of clear momentum in favor of either buyers or sellers. The RSI remaining below the 50 level supports the idea that upward movements remain weak. Unless momentum gains strength, it seems difficult for the price to make sustained moves towards resistance levels.
From a technical perspective, the Ichimoku indicator largely maintains its outlook. While the price remains within the Kumo cloud, it is in a weak position relative to the Tenkan and Kijun levels. The Tenkan line remaining below the Kijun indicates that downward pressure has not completely subsided in the short term. Although pricing within the cloud maintains equilibrium, it is difficult to say that downside risks have been completely eliminated.
The overall technical outlook remains similar to the previous analysis. The lower band of the cloud around $2,910 continues to be a critical threshold for downward movements. Falling below this level could increase selling pressure. On the upside, breaking above the $3,020 level could break the current tight structure and pave the way for a clearer upward movement. Under current conditions, a cautious outlook is maintained for ETH due to low volume, neutral liquidity, and indecisive momentum.
Below the Form
Supports: 2,910 – 2,727 – 2,625
Resistances: 3,019 – 3,074 – 3,227
XRP/USDT
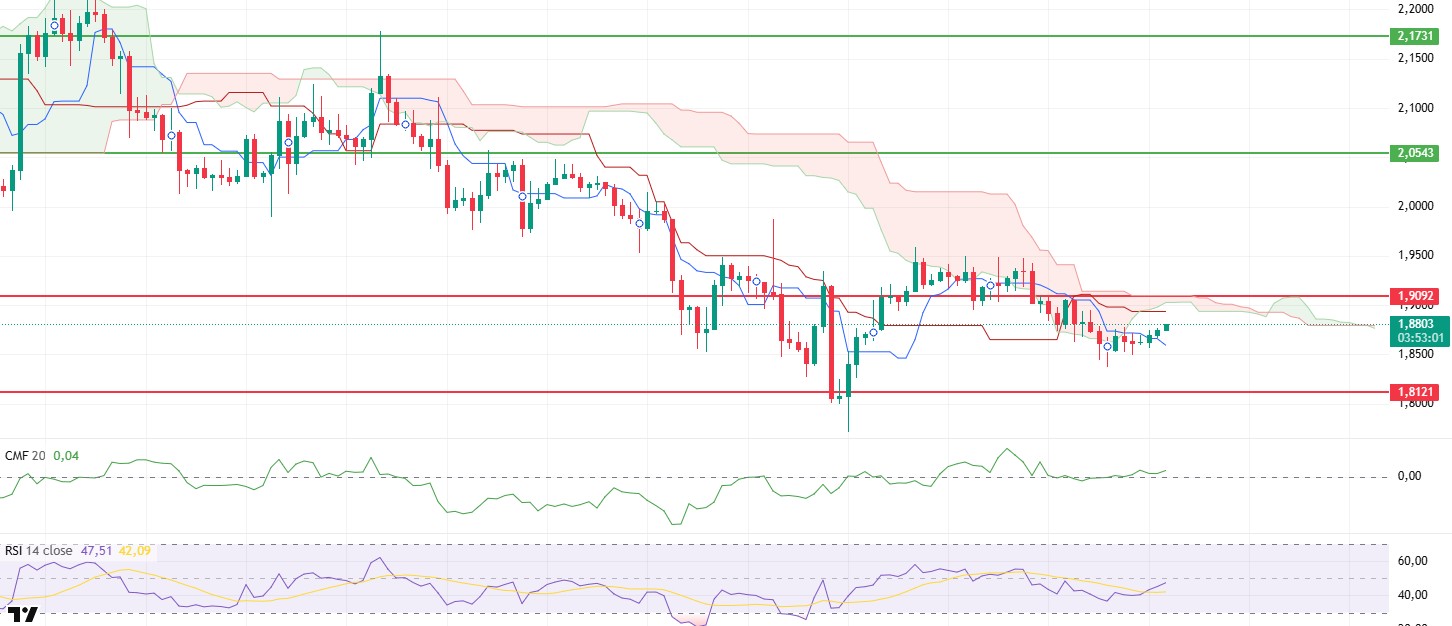
The XRP price has shown an upward recovery in recent hours, rising to the $1.87 level and managing to break above the Tenkan line. Following the previous decline, this movement indicates that selling pressure has weakened in the short term and buyers have re-entered the market. However, the price still remains below the main resistance levels, suggesting that the rally is progressing cautiously and it is too early to speak of a strong trend.
The liquidity outlook remains balanced. The Chaikin Money Flow (CMF) continues to stay in positive territory while exhibiting a flat structure. This picture reveals that the capital entering the market has not been completely withdrawn but has not yet gained momentum. While liquidity lingering at these levels supports upward price movement, it does not appear to have built sufficient strength for a sharp breakout.
A similar balance is also evident on the momentum front. The Relative Strength Index (RSI) is maintaining its horizontal trajectory, reflecting that neither buyers nor sellers have established a clear advantage. The RSI’s current position suggests that the price may progress with limited fluctuations in the short term rather than a sudden change in direction.
Technically, the Ichimoku indicator presents a more complex picture. While the price regaining the Tenkan level has turned the short-term outlook positive, the Kijun line and kumo cloud are still above. This structure indicates that upward demand is increasing but a clear trend reversal has not yet occurred. As long as prices remain below the kumo cloud, controlled upward movements can be expected.
In the broader picture, the short-term outlook has improved compared to the previous day, but a cautious stance is maintained. The $1.90 level remains a key threshold for the upward movement to gain strength. If this level is breached, buying activity could accelerate. On the downside, the $1.81 level maintains its position as the main support. The current structure indicates that positive signals for XRP are beginning to emerge in the short term, but additional confirmation is needed for a strong trend.
Supports: 1.8121 – 1.6224 – 1.5146
Resistances: 1.9092 – 2.0543 – 2.1731
SOL/USDT
Streamflow announced USD+, a Solana stablecoin backed by US Treasury bonds and providing returns.
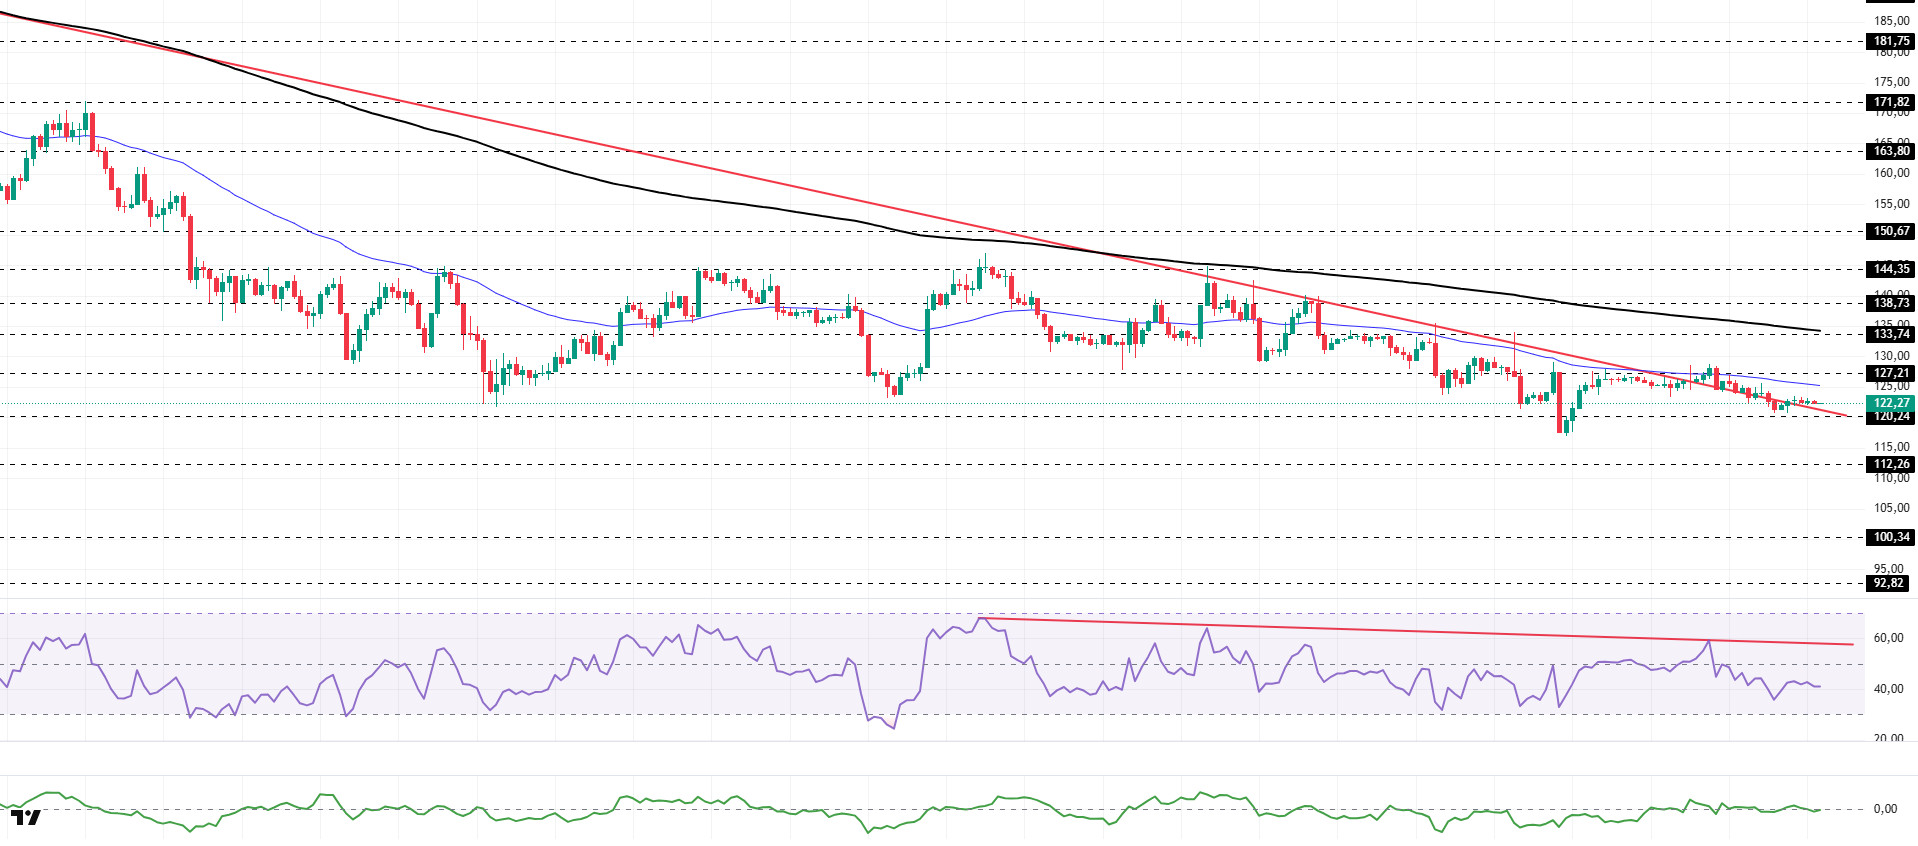
The SOL price has been moving sideways. The asset moved into the upper region of the downtrend that began on October 8. The price, which faced resistance from the 50 EMA (Blue Line) moving average, is currently testing the downtrend as support. If the upward movement begins, it may test the 50 EMA moving average as resistance. In case of a pullback, the $120.24 level may act as support.
On the 4-hour chart, it remained below the 50 EMA (Exponential Moving Average – Blue Line) and 200 EMA (Black Line). This indicates that the medium-term downtrend continues. At the same time, the price being below both moving averages indicates that the asset is trending downward in the short term. The Chaikin Money Flow (CMF-20) remained at a neutral level. However, the balance of money inflows and outflows may keep the CMF at a neutral level. The Relative Strength Index (RSI-14) remained in the middle of the negative zone. This signaled that selling pressure continues. If there is an upturn due to macroeconomic data or positive news related to the Solana ecosystem, the $133.74 level stands out as a strong resistance point. If this level is broken upwards, the uptrend is expected to continue. In the event of pullbacks due to developments in the opposite direction or profit-taking, the $112.26 level could be tested. A decline to these support levels could increase buying momentum, presenting a potential upside opportunity.
Supports: 120.24 – 112.26 – 100.34
Resistances: 127.21 – 133.74 – 138.73
DOGE/USDT
The DOGE price traded sideways. The asset remained below the 50 EMA (Blue Line) moving average, signaling continued downward pressure. Unable to break through the strong resistance level of $0.13367, the price retreated and is currently testing the $0.12824 level as support. If it rises, the 50 EMA moving average could act as resistance. If the pullback continues, the $0.12282 level should be monitored.
On the 4-hour chart, the 50 EMA (Exponential Moving Average – Blue Line) remained below the 200 EMA (Black Line). This indicates that the downtrend may continue in the medium term. The price being below both moving averages indicates a downward trend in the short term. The Chaikin Money Flow (CMF-20) remained in negative territory. Additionally, a decrease in money inflows could push the CMF deeper into negative territory. The Relative Strength Index (RSI-14) remained in negative territory. It also continued to stay below the downward trend line that began on December 9. This signaled that selling pressure persists. On the other hand, the positive divergence remains valid. In the event of a rise due to political developments, macroeconomic data, or positive news flow in the DOGE ecosystem, the $0.14237 level stands out as a strong resistance zone. Conversely, in the event of negative news flow, the $0.12282 level could be triggered. A decline to these levels could increase momentum and start a new wave of growth.
Supports: 0.12282 – 0.11797 – 0.10837
Resistances: 0.12824 – 0.13367 – 0.14237

LTC/USDT
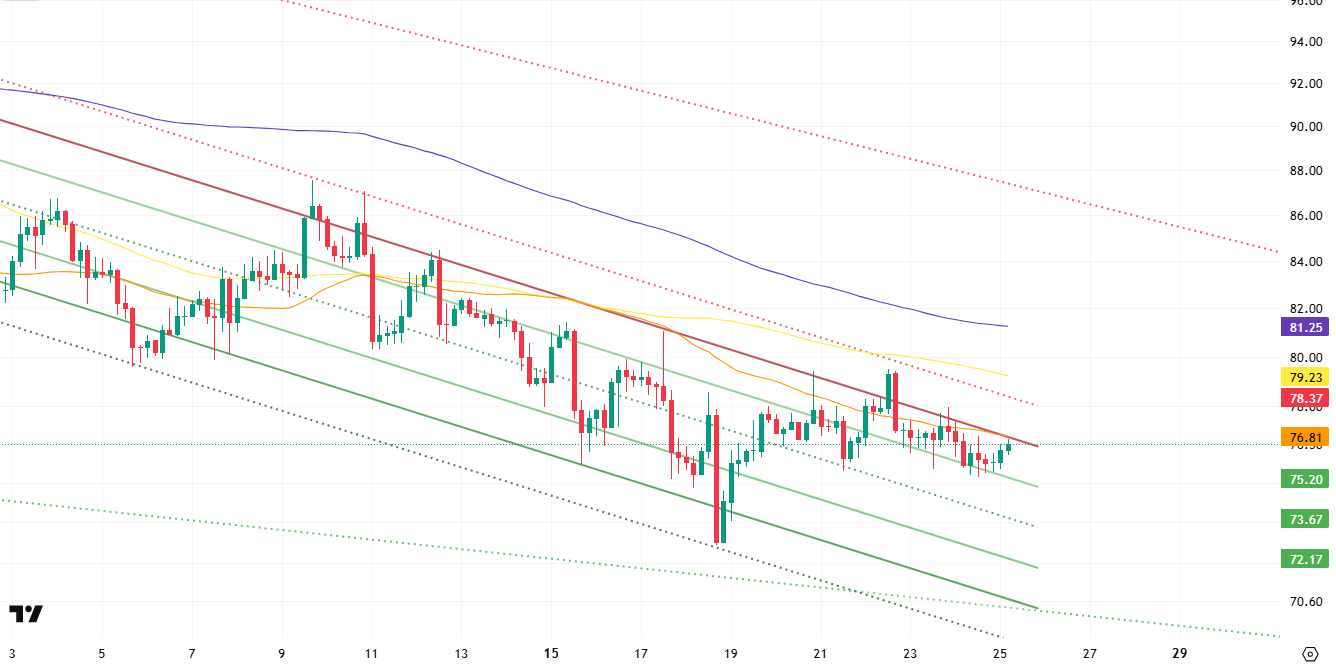
Price movements in the Litecoin (LTC) / USDT pair ended the previous day with a 1.58% loss in value. At the same time, LTC’s 1.7% decline compared to Bitcoin indicates that Litecoin performed poorly against Bitcoin within the general market movements. The long/short position ratio in the futures market over the last 24 hours, at 1.0056, shows that LTC’s downward expectations among derivatives market participants have shifted to neutral territory and are closer to positive.
A technical analysis of Litecoin’s 4-hour USDT pair shows that the price is trading below the 200, 100, and 50-period moving averages (purple, yellow, and orange lines, respectively). This outlook is consistent with the increase in short positions relative to long positions in the derivatives markets, confirming that the main trend remains downward.
However, the current price structure also holds the potential to shift to a positive direction if it transitions to a neutral outlook. In this scenario, the first strong resistance area that the upward movement may encounter is the 50-period moving average at the 76.81 level and the declining trend line around which prices continue to trade. This area, which is a horizontal resistance level, stands out as the first critical step towards transitioning from a negative outlook to a neutral one. If this level is exceeded, the 78.37 level will come to the fore as another important intraday falling trend resistance level to watch. If the uptrend gains momentum and heads towards the 79.23 level, it is likely that the movement will remain limited in a pin bar formation, as in previous attempts, due to the effect of the 100-period moving average.
If the downward movement continues, the first important support level to watch is 75.20, which offers strong support. However, if this level is broken downwards, selling pressure is expected to increase, bringing the support levels of 73.67 and 72.17 into focus. The 74.20 level, in particular, has strong reaction potential due to its position in the middle band of the channel structure.
Supports: 75.78 – 74.20 – 72.71
Resistances: 77.12 – 78.94 – 79.64
BNB/USDT
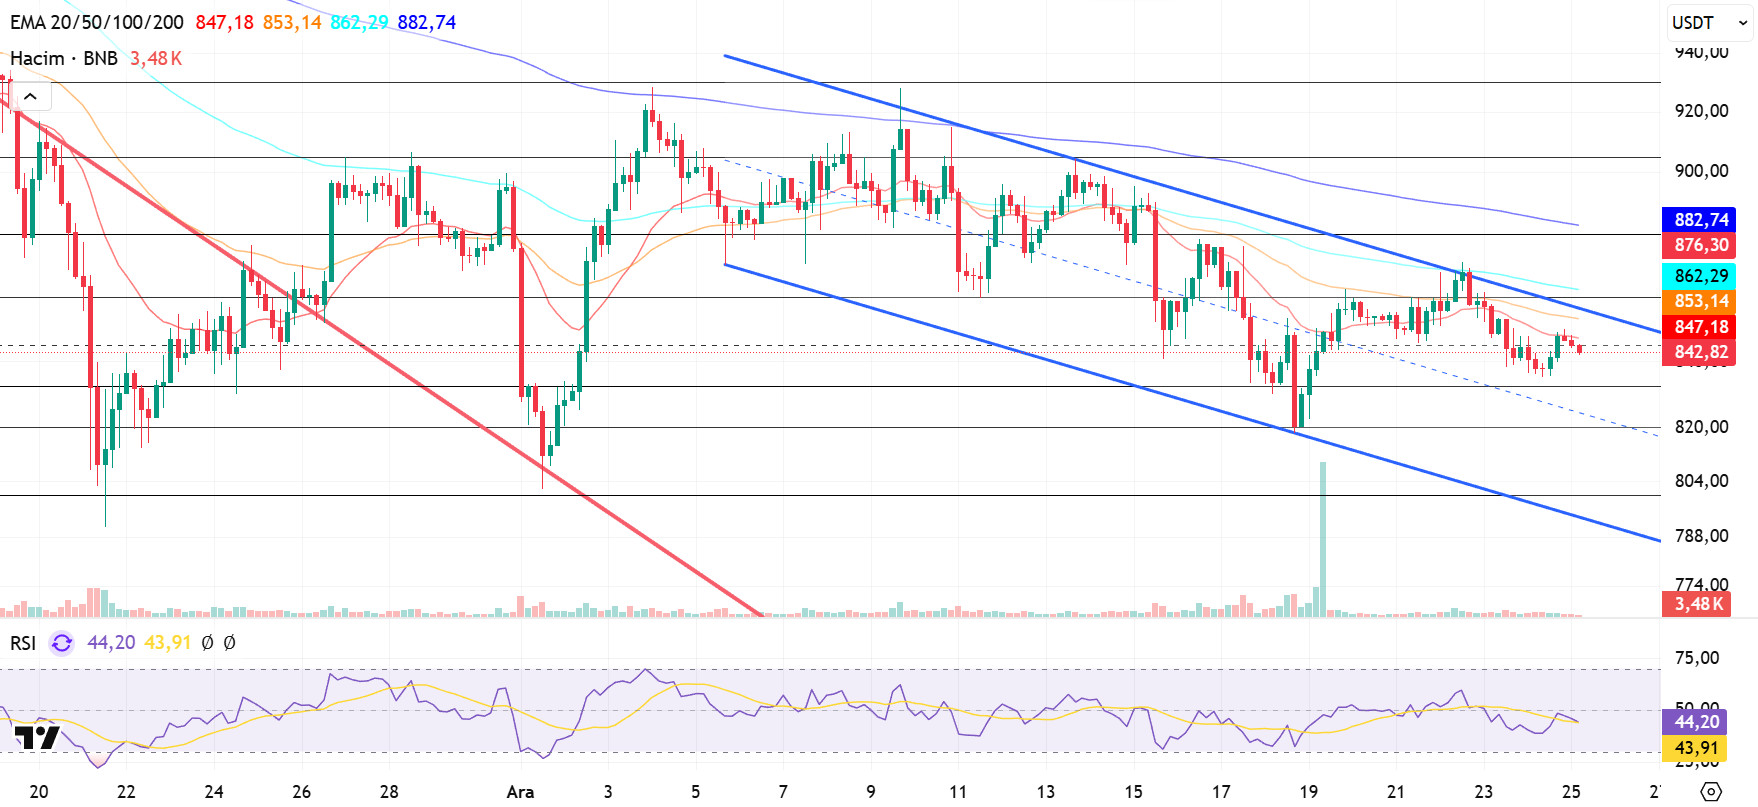
From a technical perspective, the BNB/USDT pair, which has been seeking support for some time, has ended its downward momentum with the candlestick formations that have formed and has turned its direction back upwards. With this recovery process, BNB has risen to the $930 level by testing the downward trend upwards with the support provided by the new candlesticks. While selling pressure has increased in this region depending on market conditions, the asset appears to be continuing its movement within a declining channel for some time.
Overall, the BNB/USDT pair presents a flat positive picture. In this context, the price fluctuating within a flat band indicates that the search for direction continues in the medium term. If upward price movements gain strength, the positive outlook is expected to be supported.
Currently trading in the $830–860 range, technical indicators for BNB reveal that low trading volume is limiting the upward momentum. Additionally, the RSI indicator is seen hovering at relatively low levels due to weak momentum.
Within the technical outlook, if selling pressure increases, the price is expected to retest the $830 support level. If this level is broken downward, a pullback towards the $820 and $800 support zones will likely occur.
On the other hand, if buying appetite is maintained and market momentum strengthens, BNB is expected to retest the $860 resistance level in the first stage. Breaking above this level could push the price above the downtrend line. If the trend breakout is confirmed and the price manages to stay above this level, a rise towards the $880 and $905 levels appears technically possible.
Supports: 830 – 820 – 800
Resistances: 860 – 880 – 905
Legal Notice
The investment information, comments, and recommendations contained herein do not constitute investment advice. Investment advisory services are provided individually by authorized institutions taking into account the risk and return preferences of individuals. The comments and recommendations contained herein are of a general nature. These recommendations may not be suitable for your financial situation and risk and return preferences. Therefore, making an investment decision based solely on the information contained herein may not produce results in line with your expectations.


